By Andy May
The “pre-industrial” according to the IPCC in a footnote on page 43 of AR6 WGI is prior to 1750 for radiative forcings and before 1850 for temperature. Both dates are within the period commonly described as the Little Ice Age.
The Little Ice Age was a brutal and a miserable time for humanity, but none-the-less the IPCC has chosen to measure and define “climate change” using the global average surface temperature change from that period. They talk about dangers if we exceed 1.5 to 2 degrees above the “pre-industrial” period. These numerical limits have no scientific basis, but they set them anyway.
Then they have the problem of the Holocene Climatic Optimum. This period from roughly 8,000BC to 4,200BC (see figure 1) is widely thought to have been warmer than today based on glacial advance and retreat data, and insolation models of temperatures around the world (figure 2). There has been an attempt to claim that the Holocene Climatic Optimum was actually colder than today by Bova, et al. (2021), but the paper has drawn two serious criticisms (see Laepple, et al., 2022 and Zhang & Chen, 2021 in the bibliography) and undergone a major revision. Bova, et al. is not very credible, and it is likely that the method they used was deeply flawed. A previous post on this paper appeared in WUWT here, it was written before the critical responses were published by Nature.

Bova, et al. write in their paper:
“Proxy reconstructions from marine sediment cores indicate peak temperatures in the first half of the last and current interglacial periods (the thermal maxima of the Holocene epoch, 10,000 to 6,000 years ago, and the last interglacial period, 128,000 to 123,000 years ago) that arguably exceed modern warmth. By contrast, climate models simulate monotonic warming throughout both periods. This substantial model–data discrepancy undermines confidence in both proxy reconstructions and climate models, and inhibits a mechanistic understanding of recent climate change.”
Bova, et al., 2021
Bova, et al. attempt to make a case that, previous models and global temperature proxy reconstructions confused seasonal with annual temperatures and that actually temperatures during the Holocene Climatic Optimum were lower than today. Essentially, Bova, et al. believe the models are correct and the data is wrong.
Bova, et al. constructed a model to transform seasonal temperature records to annual temperature records. Their critics show that the transform is flawed because it assumes that climate is equally sensitive to insolation throughout the year and that outside forcing, for example greenhouse gas forcing is independent of season and spread out evenly throughout a calendar year. These assumptions predetermine the outcome of the model, as shown by Laepple, et al. In addition, Bova, et al. assume that the climate response to insolation is linear, when it is well known that it is nonlinear (Laepple, et al.). The IPCC often makes the same mistake.
Finally, Bova, et al. ignore the effect of Earth’s internal feedback mechanisms, causing their model to overcorrect for seasonality (Zhang & Chen, 2021). In short, Bova, et al. oversimplified a very complicated problem, overstepped their data, and came to the wrong conclusion as a result. Let’s look at some other studies that have a different view.
Global and hemispheric temperature reconstructions from multiple proxies are very problematic, it is better to compare individual proxies to modern temperatures at the proxy location (see here). There are several hundred proxy temperature records around the world, we have described many of them and their distribution previously in a four-part series here. They all produce temperature estimates at different temporal resolutions, some a temperature every year, some every decade or two, and some only one temperature for every 100 or 200 years. Many are sensitive only to summer, some only to winter, and so on. Some estimate air temperature, some ocean temperature at varying depths. The result is that when you combine them into one global or hemispheric record, they smooth out the peaks and valleys. The resulting record is very rough and cannot be compared to the daily thermometer air temperature readings we have available today. Thus, saying it was warming slower or faster thousands of years ago, relative to today, is a meaningless statement, you can’t possible know that. In addition, comparing a modern global average temperature to a “global” or “hemispheric” average of disparate proxies thousands or millions of years ago is a meaningless comparison.
We can see in figure 1 that two high-quality temperature proxies, one from Greenland and one from tropical Indonesia, 9,500 miles away match surprisingly well, both show roughly 3.5 to 4°C of cooling from their peaks in the Holocene Climatic Optimum to their coldest points in the Little Ice Age (“pre-industrial”). Even though, or perhaps because of this warmth, human civilization developed during the Holocene Climatic Optimum. This was when Neolithic agriculture and settlements blossomed, became widespread, and well established in the Middle East. So, we can see 3.5 to 4°C of warming over the “pre-industrial” was not a problem for humans in the Middle East.
Because the HCO was caused by changes in Earth’s orbital characteristics (see here, figure 2), the effect was different in different parts of the Earth and was different in different seasons. This is a point made in both Bova’s possibly flawed paper and in another paper by Renssen, et al. on the Holocene Thermal Maximum (another name for the Holocene Climatic Optimum).
Renssen et al. used a model to compute the timing of the maximum temperature, relative to the Little Ice Age/pre-industrial period in numerous locations. He summarizes this data in our figure 2.

As figure 2 shows, the dates of maximum warming, at least according to Renssen’s model, were all during the later portion of the Holocene Climatic Optimum. The warming is stronger in the Northern Hemisphere polar region than anywhere else. Both Renssen’s model and Bova’s incorporate the effect of the melting glaciers left over from the last glacial period prior to 9,000BC.
Renssen’s insolation model of the Holocene is consistent with global glacial advances as documented by Olga Solomina and colleagues. Both Renssen and Solomina suggest maximum warming occurred in the Holocene Climatic Optimum and then gradually cooled into the Little Ice Age, with some warming coming out of the depths of the Little Ice Age.
Summary
While figure 1 only shows two temperature proxy records over the Holocene, and both are for the Northern Hemisphere, they are 9,500 miles apart and both show the Holocene Climatic Optimum peaked in the Northern Hemisphere at about four degrees warmer than the Little Ice Age/pre-industrial. The peak warmth coincided with the development of a modern agrarian civilization. It is also consistent with Renssen’s insolation model for the period, which modeled a Holocene Climatic Optimum that was five degrees warmer than the Little Ice Age in the higher Northern Hemisphere latitudes.
Renssen’s results are very consistent with global glacier advance data collected by Solomina. In fact, they both found an early Holocene retreat of glaciers in both the Southern and Northern Hemispheres, although the modeled warming was larger in the Northern Hemisphere. The correspondence in the timing of Renssen’s insolation model and Solomina’s glacier advances is remarkable.
In short, it seems very likely that the Holocene Climatic Optimum was warmer than the Little Ice Age and warmer than today, the evidence is most compelling in the Northern Hemisphere.
Download the bibliography here.
“We can see in figure 1 that two high-quality temperature proxies, one from Greenland and one from tropical Indonesia, “
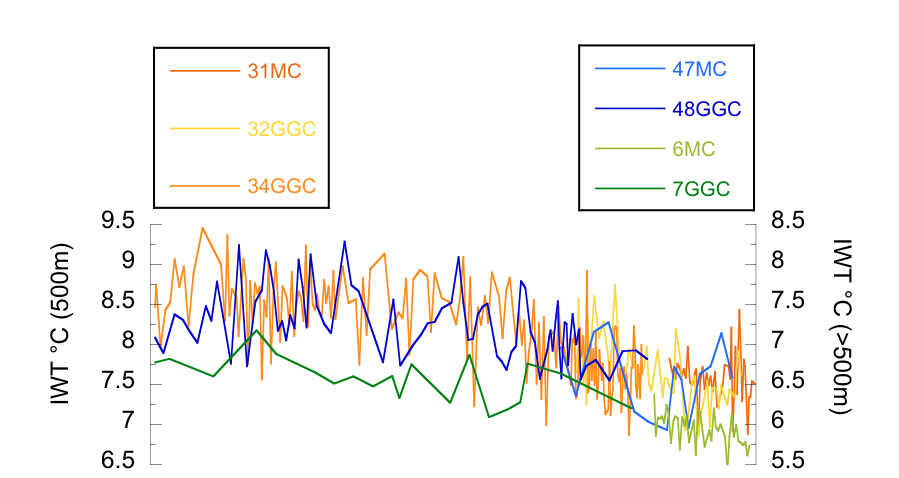
As you mntioned in passing, the “tropical Indonesia” is actually at 500m depth in the ocean. But a puzzle here is that you put its data on an axis range from about 0-3°C. But in your linked plot, it runs from about 7.5°C to 11°C. It’s hard to imagine a tropical ocean temperature below freezing.
I assumed the right-hand Indonesian scale to be the temperature anomaly.
It may be, although that is not what is said, and no base is given. But in fact it looks not like the more nuanced real plot in Rosenthal:
There is no range of 3.6°C there. The whole axis range is just 3°C.
These guys couldn’t lie straight in bed.
You don’t need to be in bed to LIE.
You, being an ultra-leftist… just breathing is enough.
I’m not a ‘leftist’, whatever that means.
It’s a numbers thing; so I wouldn’t expect you to understand.
“whatever that means.”
“It’s a numbers thing; so I wouldn’t expect you to understand.” Very true, only other alarmists can understand alarmist numbers – to everyone else they are, at best, completely wrong and, at worst, a pile of adulterated horse droppings.
There are there links to about 4000 studies on this google maps page.
It is mainly focused on the MWP but most go back much further and some to the start of the Holocene.
Go there do a summary and come back with an article supporting your opinion. I’m sure Anthony will be more than happy to publish it.
To the alarmists, whenever the data goes against the models, that’s just proof that there is something wrong with the data.
Here, a leftists is anyone who does not 100% agree with the consensus of conservatives here. They will come after you with pitchforks, torches and hoods to tar and feather you and ride you out of twon tied to a rail. If they are in a good mood.
What planet are you on, Richard? Stop, once again, with the over-the-top melodrama, please. You’re not helping in the slightest.
He lives to annoy. Meglomaniac.
Like most leftists, the thing that offends him the most, is someone disagreeing with him.
“Leftist”? We disavow him. And his skin’s as thick as that of any other commenter here..
ANother thing about those on the left. They are so convinced that they are the good guys, that any leftist who fails to live up to whatever creed they push today, is disavowed and declared to be not a true leftist.
So much paranoia, so little actual data. You really hate it when your fellow leftists embarrass themselves.
You don’t know what it is, but you know you aren’t one.
Your evasions are even more pathetic than your lies.
I don’t sit to the left or right on any political spectrum.
I’m only going by the data.
It wouldn’t surprise me in the slightest to find out that you actually believe the nonsense you are spouting. Every leftists I have ever met was convinced that they were smack dab in the middle of the political spectrum. As for you going by the data, I guess there’s a first time for everything.
Nick,
The data I’ve shown is straight from the supplementary materials.
You chopped off the time scale from your plot. The times you plotted are only 0AD to 2000.
Your plot is from page 22 of the supplementary materials.
Hi Andy,
Yes, apologies about the time scale. It’s quite a way below, and I didn’t look carefully.
Here is the graph from the main paper, with full time period. It’s still hard to see a 3.6°C range there. And it’s just the one core at 482 m; if you look at cores at 594 m or below, it looks different again, with lower ranges.
Nick,
Correct. The 500-meter ocean depth series is computed from those benthic series, mainly 7GGC, 10GGC, and 13GGC. The resulting series appears in figure 2C, which is attached.
This is Rosenthal’s plot of the same data I used for this post. I didn’t change it. In my previous posts, I often used the actual temperatures since I wanted to compare to the temperature today at that depth (500 meters) and location using the U of Hamburg database.
Rosenthal claims an accuracy of +-0.7 deg C for the raw data and 0.35 deg C for the composites. The data I plotted is a composite.
Andy,
It is very interesting you mentioned start of agriculture/farming in the Middle East was about 9000 years ago, and that people were doing great developing their civilizations
Similar beginnings likely took place in China and India.
Could you show that on your figure 1?
I see all these comments, and I wonder if the people living 9000 years ago developing their agriculture ever talked about global warming, or global cooling.
No one liked global cooling until 1975 when suddenly, a lot of people stopped liking global warming.
That is the dawning of the Environmentalist era: “change is bad”, Fourier and Arrhenius considered the greenhouse effect a good thing.
A lot of the details are given in this post, figure 1, which can be downloaded as a high-resolution pdf. Notice the first indications of agriculture in China are 14,000 BP and in the Levant in 13,000BP.
Proper houses and villages go back at least to 11,500 BP.
Proper cities date to 10,000BC (8,000 BC).
Climate and Human Civilization over the last 18,000 years – Andy May Petrophysicist
When the full data set doesn’t show what you want to see, just chop off the offending bits.
Correct, Rosenthal supplies both, see his figures 2C and 1C.
Placed on one chart for comparison of changes over time. You can see similar differences.
His 500-meter reconstruction is more easily seen in his figure 2C from the paper. There it is shown as an anomaly.
Nick, you do know that sea sediment proxies, no matter the depth where cored or the specifics of the proxy chemistry, represent the rain of detritus from the near sea surface well mixed euphotic zone. So depth of coretop is irrelevant.
Different sediment proxies yield temperature estimates at different depths. Surface dwelling foraminifera indicate SST, but benthic forams indicate temperature at depth, for instance. The chart indicates it is showing temperature at 500m below the surface.
True and IWT water is interpreted to be from the North Pacific.
Well, it certainly wasn’t 0°C on the surface.
But I showed above the original plot from Rosenthal, with several cores. They are variable, and depth seems to be a factor.
You don’t think depth might equate with age, then? The deeper the sediment the older the sample and, if as shown in the original plot, temperatures declined toward the little ice age this might represent that decline?
Richard,
the deeper the older the sample. The forams used in Rosenthal’s study live at 500M, so the temperatures are 500M temperatures.
The Makassar Strait is a key climate choke point, it is where water flows from the Pacific to the Indian and Southern Oceans. At 500-meters, the water is from the North Pacific and indicative of North Pacific SSTs.
It is not the SST in the Makassar Strait itself, that is different, see orange line in Rosenthal’s figure 3A, not figure 3 is just from 0AD to 2000, like Nick showed above.
As I mention above, I plotted anomalies this time, not actual temperatures (Rosenthal supplies both). If you read the paper, you see that the 500-meter water depth temperature is interpreted to represent North Pacific SSTs. From the paper:
“The similar IWT trends observed between 480 and 900 m suggest that on orbital time scales, changes in Pacific OHC are largely determined by climate changes in the high latitudes that possibly respond to changes in the tilt of Earth’s axis since the early Holocene.”
To see Rosenthal’s plots of the same anomalies I plotted see his figure 2C.
Your plot is only from 0AD to 2000.
As surmised by others here I used the original published Rosenthal anomaly values. The data I plot is shown in the original paper in figure 1C. Rosenthal’s SM is not very well organized or very clear, but he has both the 500-meter anomalies in there and the actual estimated temperatures. His figure 1c uses the actual temps like I use in some of my posts. In this one I used the anomalies. It amounts to the same thing.
To see Rosenthal’s plots of the same anomalies I plotted see his figure 2C.
Andy,
OK, here is the full Fig 2 from Rosenthal for comparison:
Yes, that is it, the series in my figure 1 is the same one plotted in figure 2C. I think what Rosenthal did was use 4 different forams that live at 4 depths, and then constructed a function from them to get the temperature at 500 meters that he wanted. The temperature at that depth is water from the North Pacific.
The water deeper than 600 meters contains a major contribution from the Southern Hemisphere, so he was selective about the series he used in the calculation.
My question is: Why doesn’t the sea temperature proxie have a gigantic uptick at the far right, like the land temperature proxie does?
The gigantic uptick on the land temperature proxie chart is, of course, the addition of the bastardized instrument-era Hockey Stick fraud to the chart. I guess someone forgot to add that particular fraud to the sea temperature proxie.
You need to look at the comparison chart at the top of the article, to see what I mean..
Nick
In deep ocean even in the tropics the bottom water temperatures are close to zero even with surface temperatures of 20-30C.
But that’s a lot deeper than 500m.
Very nice Andy.
Early European Farmers (EEF), First European Farmers, Neolithic European Farmers, Ancient Aegean Farmers, or Anatolian Neolithic Farmers are names used to describe a distinct group of early Neolithic farmers who brought agriculture to Europe and Northwest Africa (Maghreb). Although the spread of agriculture from the Middle East to Europe has long been recognised through archaeology, it is only recent advances in archaeogenetics that have confirmed that this spread was strongly correlated with a migration of these farmers, and was not just a cultural exchange.
The Early European Farmers moved into Europe from Asia Minor through Southeast Europe from around 7,000 BC, gradually spread north and westwards, and reached Northwest Africa via the Iberian Peninsula. Genetic studies have confirmed that Early European Farmers can be modelled as Anatolian Neolithic Farmers with a minor contribution from Western Hunter-Gatherers (WHGs), with significant regional variation. European farmer and hunter-gatherer populations coexisted and traded in some locales, although evidence suggests that the relationship was not always peaceful. Over the course of the next 4,000 years or so, Europe was transformed into agricultural communities, and WHGs were displaced to the margins.
https://en.wikipedia.org/wiki/Early_European_Farmers
We can be certain about this post’s conclusion qualitatively without relying on any proxies or ice cores.
In both the Alps and the high Canadian Arctic, big fir and spruce tree stumps are emerging from under now retreating glaciers. That means temperatures were sufficiently warmer then than now to allow seasonal cold adapted tree growth. And C14 dating of the stump wood indicates they grew during the Holocene Optimum.
We can also be certain that the MWP was real (at least in the NH)—Vikings colonized southern Greenland for hundred of years, grew summer barley (archeologists have found spilt toasted grain around hearths), and buried their dead in stone church graveyard soils. Those graves are now encased in permafrost that formed during the LIA. Mann’s statistically bogus hockey stick handle tried (unsuccessfully) to erase both inconvenient qualitative natural variation truths. Something arguably more important than his statistically bogus and partly ‘Nature tricked’ AGW hockey stick blade.
I tend to rely more and more on indisputable qualitative big picture stuff in arguments with green alarmists, rather than on the scientific microminutia of proxies, unfit for purpose surface temperature records, and such as in many chapters of ebook Blowing Smoke. Two newish ‘wisdom’ reasons.
First, most alarmists haven’t a clue about the scientific microminutia. They just believe what they heard—and don’t know enough ‘climate science’ to understand when IPCC is proven wrong. As here (wrong climate reference baseline for AGW). In a debate with dummies and ignorants, the KISS principle applies.
Second, in the big qualitative picture, the climate models have all failed their past big qualitative predictions. Stuff like Arctic sea ice did not disappear when Gore and Wadhams predicted. With which big stuff believers cannot disagree. Which strongly questions the alarmist modeled future. Or, to paraphrase Feynman, “It doesn’t matter how pretty your theory is. If it disagrees with observation, it is WRONG.”
Especially when also using versions of impossible alarm scenario 8.5.
And, this comment’s general observation becomes much more relevant when compared to Nick Stoke’s complaint about this guest post above. Thanks, Nick. You just demonstrated that quibbling about detail minutia doesn’t ever refute an irrefutable big qualitative picture.
We can also be certain that the MWP was real (at least in the NH)—Vikings colonized southern Greenland for hundred of years,
A local anecdote is not strong evidence the MWP was a global trend
Richard, I gave but one example. You need to read up on the (at least NH) MWP. I did, but decided to let folks like you do your own research. Let’s see, look up red wine grapes in England, look up tree line forests in the Alps. Look up Siberian taiga ‘fossils’.
Your negative comment is another proof of my general post. Thanks.
In other words, you ‘cherry-picked’.
Well, you ignore all the others also mentioned above but not cited.
Par for your Final Nail feeble warmunist course.
If you were data robust, you would—-
give an example of climate models being correct
give an example of climate ‘scientists’ being correct
give an example of recommended intermediate renewable solutions being correct outside the Germany Scandinavia hydro trade example.
I have repeatedly pointed to the fact that the CMIP3 model mean is running ‘cooler’ than observations.
You have repeatedly ignored it; and will again this time.
In other words, you again expose your laziness about doing simple research on Permafrost line, northern tree line extent, and more geologic evidence showing that it was clearly warmer in the early interglacial period than now.
That statement may not be true for warmer and cooler centuries the past 5000 years. Data are not a global average — not sufficient to be sure.
Tree line extent and Permafrost extent isn’t dependent on “global averages” it is a regional climatic change indicator when it involves hundreds of miles in shifting northward or southward over time as shown in studies that during the warmest part of the interglacial period tree line extent was far north of its current tree line of today.
Clearly.
Another comment gem from nails.
The truth hurts climate alarmists some times, and they lash out with irrelevant complaints.
It’s not like they have any relevant complaints.
Cherry-picking implies a distortion of the facts.
Rud did not distort the facts. He offered one example which supports his contention that it was warmer in the past than now.
He could have offered more but did not. That is not cherry-picking. Rud is not hiding something that might call this claim into question, as you imply.
If you want more examples just ask. Just because every example isn’t offered at one time does not call into question the good data that is offered.
You can’t dispute that tree stumps refute the claim that today is warmer than in was in the past. We find tree stumps in places where it is too cold for them to grow today. That can only mean one thing: it was warmer when those trees grew than it is today.
Rud, when you are over the target, is when you get the flak. You are over the target. Bombs away!
The alarmists are getting tired of these charges of cherry picking. Since they can’t refute the charges, they feel the need to pretend that everyone does it. So even though it makes no sense, they start throwing that term around in every disagreement.
No, it describes a selective approach to fact harvesting.
He did. He said that “..the climate models have all failed their past big qualitative predictions…”
This is garbage. It’s often repeated here; but that doesn’t make it any less garbage.
None of the global climate models have ‘failed’. All are within their multi-mean range; the older CMIP3 models are actually running ‘cooler’ than the surface observations.
Just because you want something to be true, doesn’t make it true.
And once again, you demonstrate that you have no idea what you talk about.
When there are hundreds of studies that come to a similar conclusion, showing only one of them is not cherry picking, especially when you mention the existence of these other studies.
What climate science is famous for is picking the one “study” that supports the narrative, while pretending that there are no other studies.
It would be more constructive to knock you head against a brick wall than to try to reason with Mr Greene
I can see a brick wall effect in your comments
When the IPCC used averages of local proxies for their 2003 report, the warm periods were about +0.5 degrees warmer than the estimated 5000 year average (up to 1960), and the colder periods were about -0.5 degrees colder than average.
Those variations are too small to be sure the warm and cold periods would have been reflected in a real time global average temperature, if such data were available in the past 5000 years.
Proxies are not real time measurements and are not particularly accurate.
None of your proxy examples include oceans — 71% of the planet, or the Southern Hemisphere — 50% of the planet. How do they add up to an accurate global average temperature, when most of the globe is not represented?
Red wine grapes were grown in England in Roman times and are still grown in England
Britain was part of the Roman Empire for over three and a half centuries. From the invasion under the emperor Claudius in AD 43 until rule from Rome ended in the early 5th century, the province of Britannia was part of a political union that covered most of Europe.
Vines have been grown in England since Roman times for winemaking. The Doomsday book refers to over 42 vineyards in Southern England at the end of the 11th Century and there are now more than 500 vineyards in England and Wales producing still and sparkling wines.
Don’t make the mistake of thinking that Britain doesn’t have enough sun to produce knock-out red wines. Grapes such as Pinot Noir thrive in our slightly cooler climate, producing fruit-driven fragrant wines to savour with charcuterie or drink on their own.
The GAT is a meaningless number that tells nothing about “the climate”.
And the GAT has only been available to us since the beginning of the satellite era (1979 to the present).
GAT before the satellite era is just a guess, and in this particular case, the guess is actually a distortion of reality. The pre-satellite GAT guess does not agree with the regional temperature charts of the time. That’s how we can tell that the pre-satellite GAT is a distortion of reality whose purpose is to promote a scary, human-caused climate change scenario.
You need far more than regional anecdotes. Extraordinary claims require extraordinary evidence. For starters, How about acglobal average temperature analysis if you want to establish that the MWP was global?
Greenland is only one smal example for MWP
Medieval Warm Period Project
Our Medieval Warm Period Project is an ongoing effort to document the magnitude and spatial and temporal distributions of a significant period of warmth that occurred approximately one thousand years ago. Its purpose is to ultimately determine if the Medieval Warm Period (1) was or was not global in extent, (2) was less warm than, equally as warm as, or even warmer than the Current Warm Period, and (3) was longer or shorter than the Current Warm Period has been to date.
At least 250 years longer.
another MWP project:
Medieval Warm Period as map
Red = warmer 😀
click on the red dots to be linked to the respective paper.
😀
great map I mean really good.
Thanks
I have posted these links many times for chumps like Aj, Nailboy and others of their ilk who commonly COMPLETELY ignore it or try to make sweeping lies over a sentence for a paper cited to maintain their delusion that no science research existed to abundantly show that MWP existed and in many parts of the world.
If the average of local proxies does not have large enough variations to exceed the likely margin of error in individual local proxy estimates, then the proxy average is statistically insignificant.
That is the conclusion so far.
People mainly in Europe said there were centuries colder and warmer than others. They were not lying with their anecdotes and local records.
Does that tell us the global average temperature, including the oceans and the Southern Hemisphere, with great accuracy?
No.
“Does that tell us the global average temperature, including the oceans and the Southern Hemisphere, with great accuracy?
No.”
You should apply that logic to the bastardized, instrument-era “global” average temperature. The same problems you cite for the Medieval Warm Period apply to the instrument-era record, too. We don’t know what the temperatures of the oceans were until just recently.
You shouldn’t have any confidence in the instrument-era “global” average temperature, according to you.
LOL, it is clear you never read the links Krishna posted.
He already knows what the right answer is. No need to actually read anything that might disagree with that.
Why so many down votes for Richard’s obviously true statement ?
Does it matter what the GAT was, including the SH?
Why so many down votes for Richard’s true statement ?
The proxies can only have +/- 2 degree accuracy, any statement of better accuracy is exaggeration.
Similar to saying the distance to your property line is 50.327 feet because your laser rangefinder has 3 decimal places, when in fact you don’t know exactly where you are standing, where your property line is, nor how vertical your helper is holding the stick.
Where did you pull that +/-2° figure from? It certainly wasn’t from the studies using the proxies which quote a +/-0.7°C uncertainty for single proxy series and +/-0.3°C for composites. And why are you using some ambiguous ‘degrees’ term rather than C or F? Perhaps you are used to using ‘degrees-whatever-the-hell-it-is-i’ve-got-no-idea-what-I’m-doing’ to measure temperature?
Modern instrumentation such as the ASOS systems have a +/- 1.8F (about +/- 1C) uncertainty. There is simply no way proxy temperatures can have an uncertainty in the tenths digit. i have no idea how the studies you mention come up with such a small uncertainty value. Are they quoting measurement uncertainty or how uncertain their calculation of the mean is? (i..e the standard deviation of sample means)
The garbage you can buy in the average grocery store does much better than that.
Obviously misleading and irrelevant, you mean?
Not so. If most or all of the proxies show the same warming or cooling, one can deduce the effect is real.
I had a long argument in the comments here with AnalJ about the extent of the MWP. He refused to accept its worldwide nature even when confronted with that map. it was very like trying to argue with someone who subscribes to the Apollo Moon landing hoax conspiracy theory.
Thanks, it reflects the pattern shown in my figure 2, most of the red in the Northern Hemisphere higher latitudes. Little in the tropics, and then some in the Southern Hemisphere high latitudes.
But hundreds of studies from the arctic to antarctic provide a fairly consistent picture of considerable warming, relative to today, although timing and calculated values vary somewhat.
The changes are not synchronous everywhere, nor should they be expected to be. They were not in the Little Ice Age either. The Sahara did not all become a desert overnight.
Mr Greene believes 100 local studies around the world showing a MWP is not global but local.
Cool and warm centuries are not proven to be global if the average of local proxies adds up to only one half degree C. above or below the 5000 year average.
The Holocene Climate Optimum averaged variations of local proxies are much larger than the MWP and LIA averaged local proxies.
The temperature variations have to be large enough to exceed the likely margin of error of local proxy estimates. Do you think individual local proxies have a +/- 0.5 degree C. margin of error? If so, then why?
I think the real time temperature measurements used for the global average temperature before 1900 have at least a +/- 0.5 degree C. margin of error.
If the proxy differences don’t exceed the margin of error then the only real conclusion is that the global average temperature exists somewhere in a small interval defined by the margin of error. The same logic applies to current estimates of the global average temperature. A slope of 0.13C per decade is impossible to know since it is less than the margin of error for the global average.
+0.14 degree warming [er decade from 1979 through February 2024 is meaningful
44 years of UAH statistics
It is claimed 30 years or more are meaningful
44 years is even better
Mr. Greene also believes that regional surface temperature charts from around the world that show it was just as warm in the Early Twentieth Century as it is today, is not global but local.
Regional is regional, not global
Local is local, not global
Global is global
Well, all you have is regional data before 1979. So quoting GAT (Global Average Temperature) temperature levels before the satellite era (1979) is just a guess, and in this case, it is a fraud perpetrated by climate alarmists to promote their climate change scare story.
Before 1979, all we had was regional temperature data.
And all that regional data, which spans the whole world, shows it was just as warm in the Early Twentieth Century as it is today, debunking the CO2-is-dangerous narrative. A fake, pre-1979 GAT, doesn’t change that.
Whenever someone on WUWT tries to show regional graphs that invariably lack any sort of hockey stick, the trendologists start howling: “Buh buh buh where is the global chart!”
Howling is all they have. Greene does exactly the same.
Andy,
As an Australian, I continue to wonder about the comparative absence of proxy studies of the Holocene from Australia. There are a couple of shaky ones from Tasmania (lacking relevant past weather stations to calibrate tree rings from Huon Pine trees). But from the Australian mainland, next to nothing is published. This mainland did not undergo ice cover in the ice age, so we have no proxies for glacier retreat, trees that were once under glaciers and so on. Out highest mountain is only 2,200 m (7,300 ft) so many proxy methods related to snow and ice are absent or not easy. The seasonal growth of trees in the NH is not so strong in Australia. We have no mainland native trees that show strong Autumn coloured foliage. However, we do have a lot of surrounding ocean with potential for sediment and coral studies, plus many inland lakes that should have long deposition histories and comparatively undisturbed sediments.
Yet, scholarly papers of proxies in the Holocene are hard to find. Maybe there has been some research done (it would surprise me if it has not been done). Maybe – and I have no evidence for this – there have been studies done, but they do not agree with current mob wisdom, so they have not been formally published.
Does anyone know why Australia has so few published Holocene proxy studies? It is an important souirce of SH instrumental temperature records. Geoff S
Hi Geoff, as you know I posted about Australian sea levels a couple of years ago at https://kenskingdom.wordpress.com/2021/08/23/the-worlds-biggest-thermometer/ I listed a number of papers showing past sea level around the coast was much higher than now, with stranded beaches being excellent visual evidence. Australia is an ideal place to study sea level as we are in the middle of a large and stable plate, far from glacial areas. Most sea level change here can be attributed to temperature change (glaciation/ deglaciation, rainfall changes). There is no doubt that global temperatures were warmer around 7,000 years ago.
Ken
Why does Australia need geologic studies when it has oft-presented verbal accounts of the Rainbow Serpent’s prehistorical meanderings to rely upon?
He gave three specific examples from widely spaced locations around the Northern Hemisphere, in addition to examples given in the article.. Your attempt to dismiss this as a single example is pathetic, even by your standards.
No examples of ocean temperature proxies or Sothern Hemisphere proxies. They add up to about 80% of Earth’s surface.
Well, no — the SH is exactly 50% of the Earth’s surface.
Add the NH oceans to the entire SH and the total is about 80% of Earth’s surface
Use a a calculator next time
Request DENIED.
These proxies do exist, why do you insist on believing that someone is required to give a complete list of the hundreds of proxies before you will accept that you are spouting nonsense?
I don’t see why not – you’ve presented several anecdotes here of your garden as evidence of a global warming trend.
I guess dickie feeds his garden lots of BS… but still has plenty left to spread here.
I print your comments, tear them into small pieces and use them for compost. Your BS makes an excellent fertilizer.
Well as long as you’re happy that’s all that counts, because your comments are worse than bloody useless.
Indeed.
I do not have a garden, although my next door neighbor has a huge organic vegetable garden
I give examples of the Michigan winters since the 1970s. Significant winter warming and far less snow. 10 minutes of snow shoveling this entire winter. At least an average of once a week shoveling in the late 1970s winters.
My anecdotes are supported by a UAH global average temperature since 1979.
The local proxies in past centuries do not have verification by a measured global average temperature.
I recall experiencing a number of green Xmas’ in central NY when I was a kid. If I were you, I’d consider a few mild winters as a gift.
Your anecdotes correspond with what you want to believe, therefore they are unquestionably proof of what you claim.
Other people’s “anecdotes” go against what you want to believe, therefore they are proven worthless.
The Great Lakes showing zero ice at present supports your experience in Michigan, it only ever made ~15% early on and then dropped away compared with the average 40%.
https://forum.arctic-sea-ice.net/index.php?action=dlattach;topic=4145.0;attach=403423;image
Typical of dickie, an AGW-cult lukewarmist… trying to DENY the MWP. !
Anyone who thinks AGW is a cult, and is fake, is a fool. Hello, fool
What evidence of AGW are you relying on?
His own feelz.
Richard,
Just because you can create a global average surface temperature does not mean it is meaningful, it isn’t.
Global average surface temperature is merely a number. Climate and climate change is much more complicated than that. No climate change, whether from solar changes or changing GHGs happens at the same time in the same way everywhere. Convection and circulation matter. They make a difference.
Completely wrong
Global warming of +1 degree C. is a statistic that does not matter. We know that from experience.
Global warming of +5 degrees C, would matter. Not to everyone. The penguins in Antarctica would not care. But most people would care.
The claim that a global average temperature is not meaningful is wrong. I recommended your article on my blog anyway.
The evidence to too strong to deny the Holocene Climate Optimum. Yet I expect the IPCC to do just that. if they haven’t already.
In time the US Dust Bowl will morph into the US Snow Bowl.
Mostly good points, but I disagree that a global average surface temp is meaningful. It is misleading because warming is minimal in the tropics, so nearly all warming occurs at the poles, more in the Northern Hemisphere than in the Southern Hemisphere. It is best to consider the latitudinal gradients separately, one for the north and then separately for the south.
Five degrees of warming would get us back to the average temperature for the Phanerozoic Era according to Chris Scotese and would probably be beneficial.
The attached plot is from the Smithsonian and based on Scotese’s work. Notice the average temp is about 21 deg C.
The reason for no/very little warming in the tropics is because it has abundant water vapor to form clouds and has steady winds to transport any excess energy to other parts of the world that have a deficit, higher than about +37 north to lower than about -37 south
The maximum amount of water vapor in the air is dependent on air temperature. The polar regions are a lot colder than the tropics. Especially during the winter.
Based on the warming pattern since 1975
a +5 degree C. warming from today could mean a +10 degree or even larger warming in the northern half of the NH.
That could not directly hurt people or animals such as polar bears but would affect them indirectly.
Nearly 70 percent of the infrastructure in the Northern Hemisphere’s permafrost regions — including at least 120,000 buildings and nearly 25,000 miles of roads — is located in areas with high potential for damage from thaingw of near-surface permafrost
How does permafrost affect structures?
A thawing permafrost layer can lead to severe impacts on people and the environment. For instance, as ice-filled permafrost thaws, it can turn into a mud slurry that cannot support the weight of the soil and vegetation above it. Infrastructure such as roads, buildings, and pipes could be damaged as permafrost thaws.
How does permafrost affect construction?
Permafrost warming can reduce the ability of foundations to support buildings and structures, leading to deformations and ultimately structural failure
. In Russia, where more than 60 % of the land is permafrost, this problem is particularly acute and Yakutsk, the largest city built on permafrost, already suffers from it.
I know few Americans care about Russia
If warming continues, and you live in an area where the ground is permanently frozen, it would be a good idea to move. It is not a good idea to ban fossil fuels over the entire planet so that these people do not have to move. Same applies to people who live at sea level.
Historically, humans have adapted to a variety of changing conditions. And that’s not going to stop now no matter what the greenies say.
Just like local anecdotes from all over the world were strong evidence of a WORLDWIDE LIA, which the IPCC erased, which led to climate gate, but no one went to jail for malfeasance and high crimes against humanity
Whether or not the IPCC admits there was a LIA, or erases it, they will still make scary predictions about the climate in 100 years. That’s what they do.
Historical climate trends are irrelevant for predictions of CAGW doom because there never has been CAGW. It is an imaginary future climate not in any historical climate records.
The LIA is based on historical climate science supported mainly by real time local anecdotes and local real temperature records
CAGW is hysterical climate junk science not supported by any data. CAGW has been coming in ten years for the past 44 years, like fusion power.
The way alarmists believe what they hear, and then go on using FF every day, thinking they are okay to do that because the gooberment will soon make everything all electric, alarmists are idiots.
Yeah I heard an activist on CBC a while ago full of enthusiasm about how California was well on its way to electrifying just about everything in order to wean their state off fossil fuels.
The interviewer asked where the additional electricity was going to come from.
The activist answered – “Mostly from natural gas”.
There was a dead-silence from the radio for about 7 seconds.
And speaking of trees as temperature proxies, there are studies from all over the world, northern and southern hemispheres, that show tree lines grew higher up the mountains in the past than they do now. That could only happen if the climate was warmer.
Yes indeed. The emerging trees and also Otzi, the Iceman, are the very best thing to show warmists…even the thickest of them can see the implications of these artifacts from a warmer past.
The obvious response to your post is that periods of regional warmth or cooler temperatures are found within global trends that differ.
It is “pre-industrial” as industrial civilization is the epitome of evil to the Green Blob. Any move away from their mythical Arcadian organic simplicity is a bad event.
Who cares that the real LIA was known for plague, famine, and war?
It’s all they got. Ridiculous.
So, man bad, industry bad, rising living standards bad…
Helpful greenie suggestion (Kerry, Thunberg)—if it is all so bad, set an example. Go off grid, off modern farmed foods, off all products derived from fossil fuels. I can even helpfully suggest a local Wisconsin cave on the river near my farm (comes predecorated with indigenous cave drawings) and some local flint (well actually just chert) for you to knape modern stone tools as steel is bad—needs coke for iron reduction from rust, which produces CO2.
OK, you can make your tools from green steel’ from hydrogen rust reduction—except there isn’t any in the real world. Back to Wisconsin chert.
Rud,
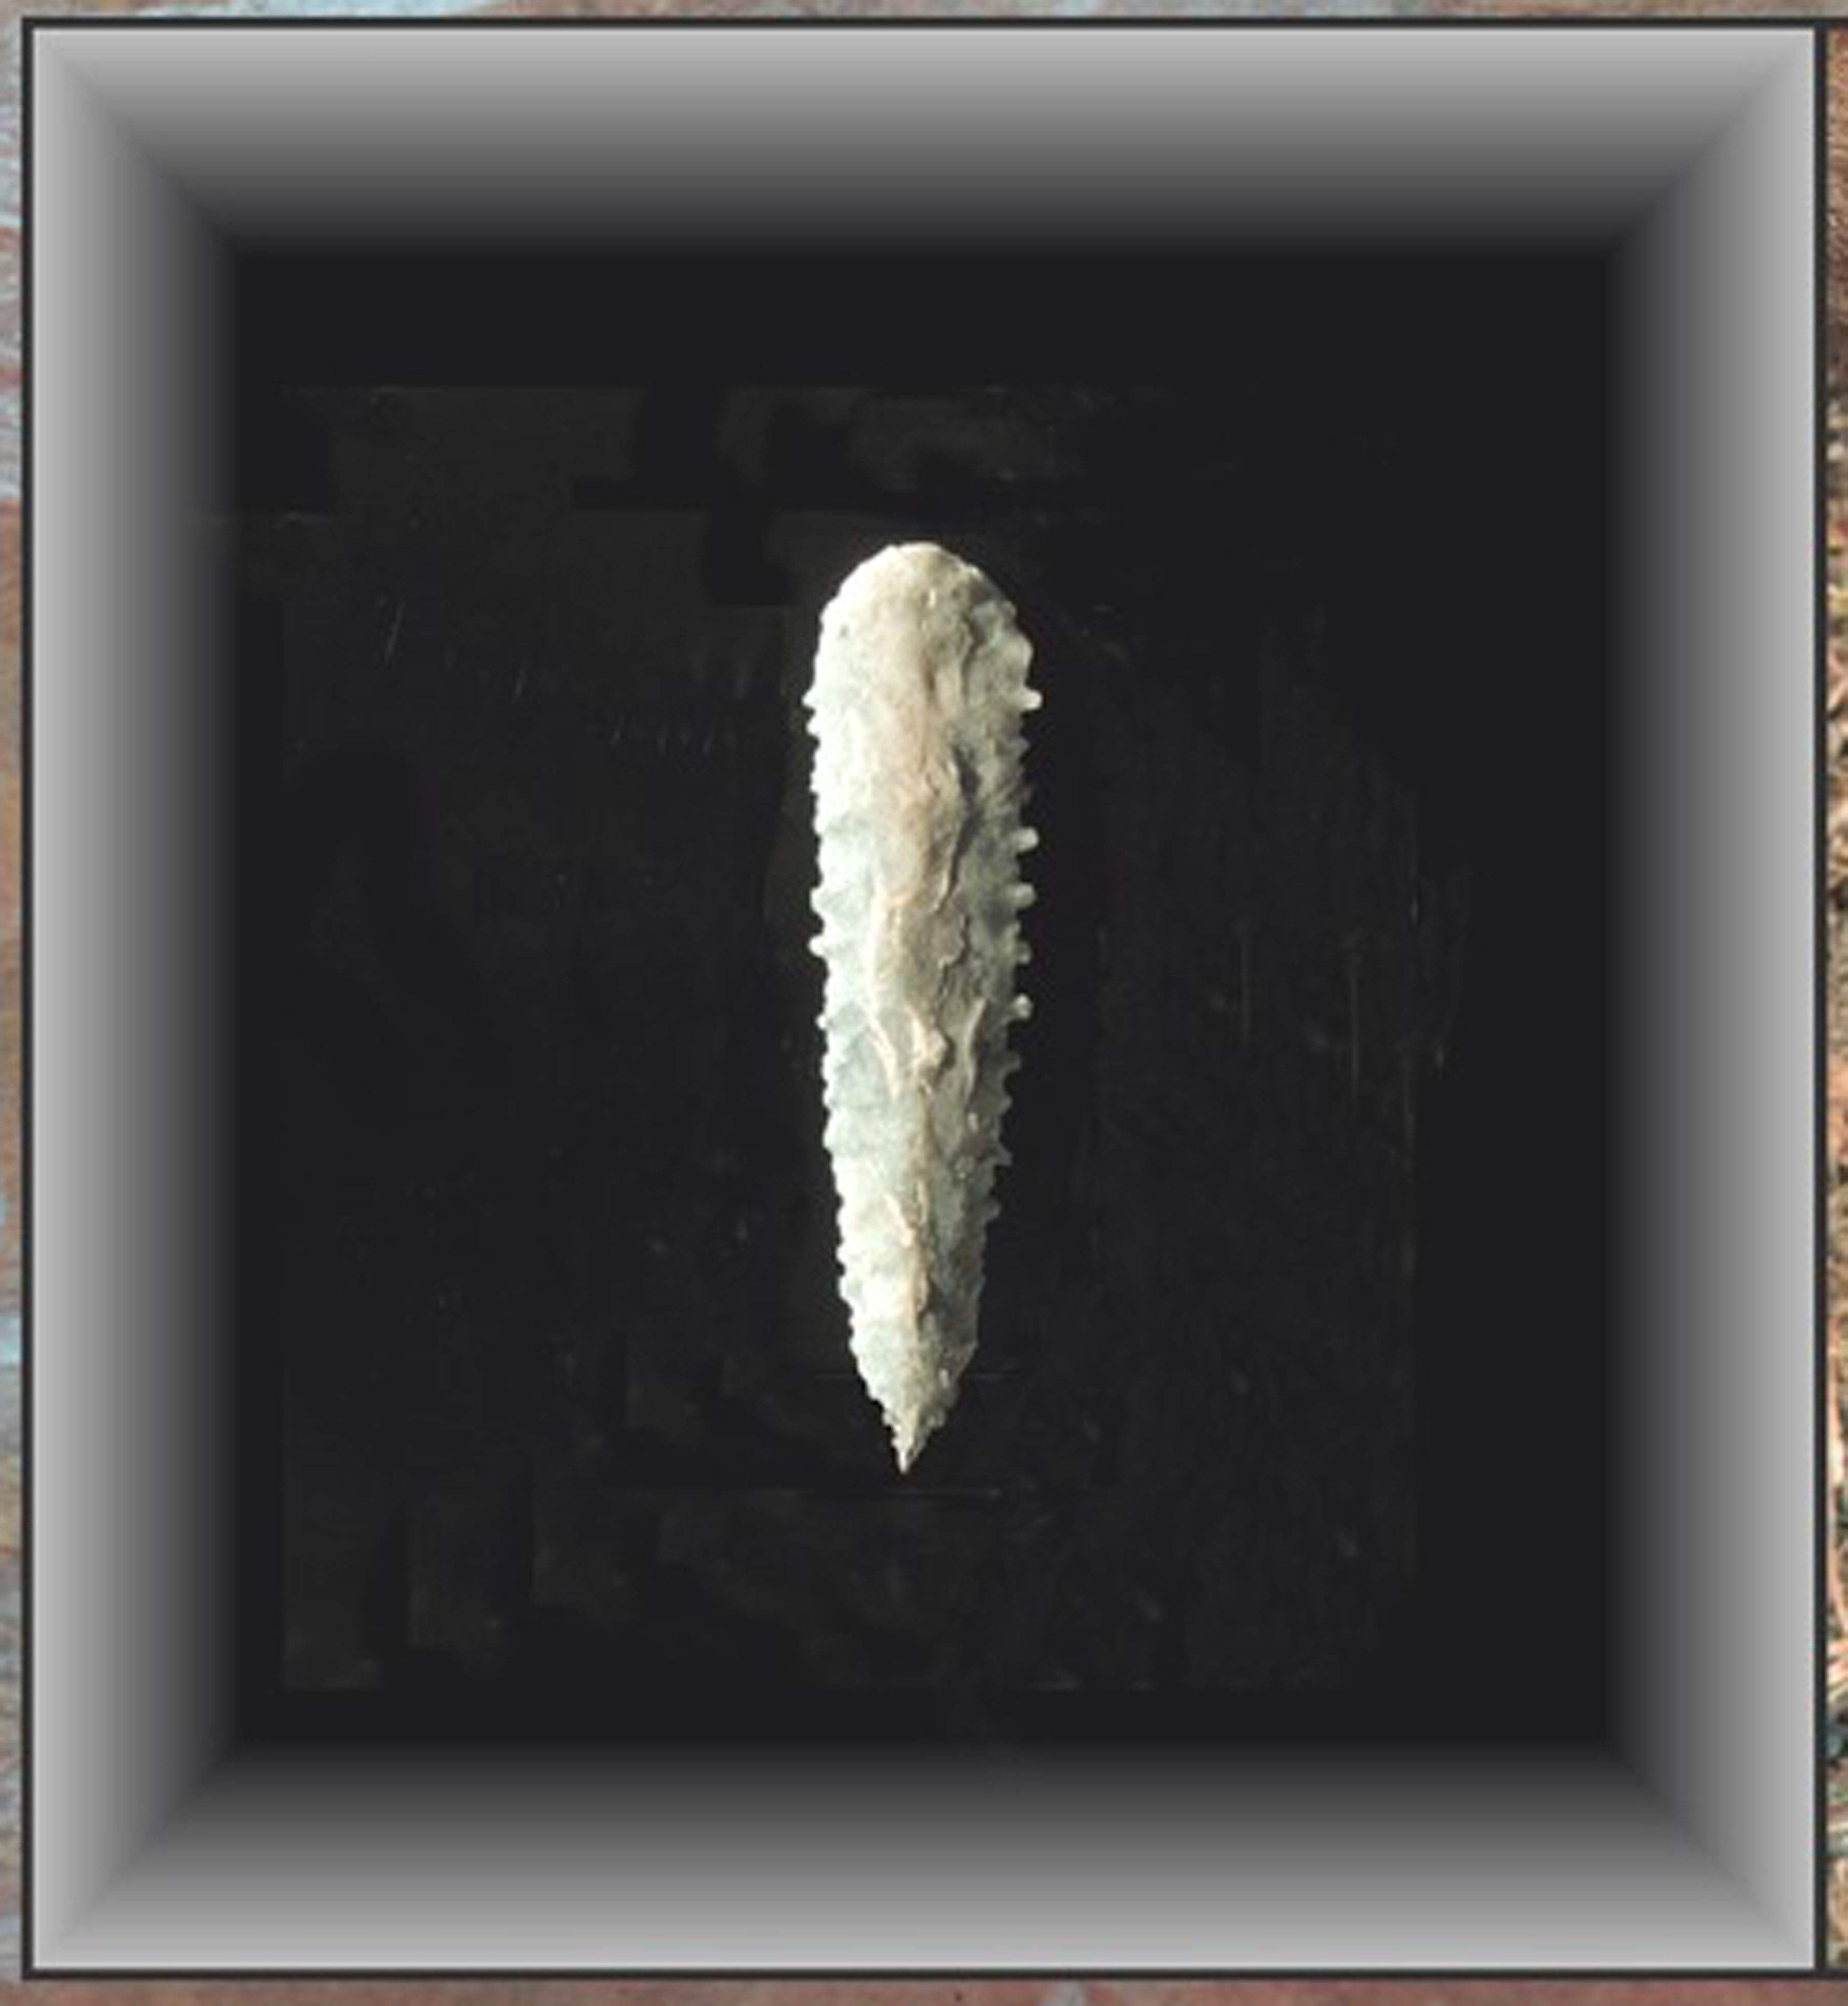
Maybe, with practice for the rest of their lives, they will produce chipped quartz hunting aids like this 2 1/2 inch specimen we found one walkabout in West Australia.
Geoff S
Beautiful!
“high-quality temperature proxies” is an oxymoron.
Not necessarily, although certain intentionally deceptive ‘scientists’ have used proxies that aren’t fit for purpose and, thus, have lowered confidence in the scientific process, scientists and the use of proxies.
There is no way to tell the average temperature (over 100 years?) of a given location 6,000 years ago to a tenth of a degree. Or to a degree for that matter.
No, not to a tenth of a degree – that looks to be a mathematical construct from averaging a range of proxy series. Not best practice but it is commonly done.
A tenth of a degree? No. Both Vinther and Rosenthal are good to +- 0.3 to +-0.5 degrees though. Probably closer to +-0.3.
I’m sorry, a range of +- 0.3 to +- .5 degree is pretty hard to believe from a proxy when modern temperature measurement devices (e.g. ASOS) have an error range of +/- 1.8C or more. That would mean proxies are more accurate than modern instrumentation.
I would love to know where you got this claim from. Thermometers you buy from the grocery store do better than that.
Only in comparison to thermometers. Proxies can be compared to one another, and the two I showed are among the best. They are continuous for thousands of years, no splicing, and they have no significant gaps. They are about as good as it gets. The Vinther ice core reconstruction has been examined from all angles, it is pretty good.
The “pre-industrial” according to the IPCC in a footnote on page 43 of AR6 WGI is prior to 1750 for radiative forcings and before 1850 for temperature
That seems like there has been cherry picking of different dates because doing so best supported the IPCC narrative. Pre-industrial dates have changed more than once since I began climate science reading in 1997. But the predictions of a coming global warming crisis never change.
I prefer pre-industrial to end on June 15, 1803 at 3:06 pm EST, and will write my CongressIdiot Rashita Taleb to fix this dat./ But every time I write her about a problem, she blames “The Jews”.
Reading elsewhere some time ago I got the information that 7000 years ago, due to procession and/or obliquity cycles, summer insolation at 60 degrees N was calculated to be 65 watts per square meter greater than today (without any changes from the sun). Is that a reasonable figure?
The total change, bottom of cycle to top is about 100 W/m2, so 65 from today sounds reasonable. 60North is the critical latitude.
Not in the present precession cycle for 60N. I have given links to actual numbers based in 1362W/m^2 for the solar “constant”.
It is somewhat high. The actual figure is 46W/m^2 from the peak 11,000 years ago to present for the summer solstice at 60N. 60N is a few decades past its minimum of 477W/m^2.
The next peak at 60N will only be 16W/m^2 above the present level.
http://vo.imcce.fr/webservices/miriade/proxy.php?file=http://145.238.217.35//tmp/insola/insolaoutxFdQwF&format=text
Orbital eccentricity is reducing so the precession swings are lower. The next upswing will be higher again.
The actual range of the precession cycle is modulated by orbit eccentricity. This is 100ka past and future at 1000 year intervals:
http://vo.imcce.fr/webservices/miriade/proxy.php?file=http://145.238.217.35//tmp/insola/insolaoutE8u5R3&format=text
Note that the sunlight last peaked in the NH half a precession cycle back.- about 10ka before now. The years prior to that, the sunlight was still increasing. Note the symmetry with temperature increase at the beginning and end of the chart. What we are seeing now is far from unprecedented.
The sunlight bottomed over NH land around 1500 not long after the Viking colony on Greenland failed. The Thames frost fairs were a feature for about 200 years up till 1819.
This time around, there is not much ice left to melt keeping the NH cool. The temperature will increase dramatically over the NH until snowfall overtakes snow melt and the permafrost advances south again.
Getting ice onto land is energy intensive. Lowering sea level by 120m by transporting it to land and storing it as ice would require the equivalent energy of burning 9,000Mt of coal, the present anthropogenic coal consumption, for 1Ma. The sea level will fall by up to 40m in each of three or four 10,000 year upswings of sunlight over the NH before glacial calving slows down the water cycle enough to start the next interglacial.
The top chart (Figure 1)captures half a precession cycle. The difference this time is that most of the ice that is going to go has gone. Greenland is already gaining ice extent and elevation so will not melt during this interglacial like it did 400ka back.
That graph shows that Eemian sea level was slightly lower than during the Holocene. Do you have a link to that source?
Yes. Here:
https://www.ncei.noaa.gov/pub/data/paleo/contributions_by_author/spratt2016/spratt2016.txt
I have only displayed the last four cycles of glaciation.
Most people consider the long cycle to deep glaciation to be linked to eccentricity but it is actually just a multiple of precession cycles. The sea level is highly correlated to the inverse of the integral of sunlight in the NH. But the land has a limited capacity to store ice such that an average elevation of ice increase of 400m on land north of 40N results in calving and ocean cooling that overwhelms the normal water cycle and snowfall drops off enough to enable melt to dominate.
There will not be a reversal of the current warming trend in the NH until; the permafrost advances south again. That will start around 2200 on present trends.
Okay. It could be the limitations of my phone, but the text format from the link was impossible to read. In reference to your last two paragraphs, do you think that continuing post-glacial rebound has an effect (for instance, if the Baltic Sea becomes a lake cut off from the N. Atlantic)?
I expect the Baltic will be filled with ice before it is cut off from the North Sea. I have not looked at the depth of channels but proxies shows it was a large ice block during the last glacial maximum. It did form a lake once the melt started but was above the then ea level.
There is a remarkable degree of inconsistency here. Note for example the
statement that:
“Thus, saying it was warming slower or faster thousands of years ago, relative to today, is a meaningless statement, you can’t possible know that. In addition, comparing a modern global average temperature to a “global” or “hemispheric” average of disparate proxies thousands or millions of years ago is a meaningless comparison.”
with the summary that says
“In short, it seems very likely that the Holocene Climatic Optimum was warmer than the Little Ice Age and warmer than today”
So which is it? If it is impossible and meaningless to say whether or not it was warmer or colder in the past then surely it is also impossible to say whether or not the Holocene Climatic Optimum was colder or warmer than current temperatures. Or is it only meaningless when somebody comes up with a temperature reconstruction that you dislike?
Izaak,
I’m clear on the differences by latitude in the post. 5 deg warmer in the high northern latitudes, 0.5 deg in the tropics, and around 3 deg in the Antarctic relative to the Little Ice Age (LIA). Regardless of how you look at the data, it was warmer in the HCO than either today or the LIA.
It is also true that comparing modern instrumental global average temperatures over 150 years to proxy averages 6000 years ago is stupid. The instrumental record is too short. Especially when comparing rates of warming or cooling. Most of the proxies have a temporal resolution of 200 years or more. The best you can do is compare the average instrumental temperature since 1823, which is an anomaly of -0.1 deg relative to 1961-1990 for HadCUT4.
I don’t see a problem or conflict. Both statements are accurate.
You are conflating the rate of warming with whether it was warmer. Two different things.
One quote refers to the rate of change.
The second quote refers to absolute temperature.
The discrepancy exists in your mind only.
That should be this site’s tag-line
No inconsistency at all. Too bad, there goes your claims of always going with the data.
The usual suspects immediately show up.
Indeed.
Although they do seem to be completely out of their depth, much more than usual.
It’s hard to argue with tree stump science.
It is hard to argue with tree stumps.
Who ever is paying for trolls must be running low on money.
There is an interesting dilemma emerging for AR7.
The net heat uptake is outpacing the ocean heat content.
The ocean heat content between 2005 and 2015 was used to calibrate the CERES radiation imbalance with estimated 91% of the heat being “uptaken” by the oceans. Hansen found the missing heat in the oceans. But the ocean heat content is not accelerating as fast as the net heat uptake. In the last 10 years (2013 to 2023), the OHC content has averaged 11ZJ per year but the net radiation budget has averaged 17ZJ per year. Both 2020 and 2021 had a net radiation imbalance above 20ZJ.
There are three possibilities for this divergence:
/1 The instruments are drifting.
/2 The heat is not going into the oceans.
/3 The assumption that radiation imbalance is accounted for by ocean heat content is wrong.
Although I cannot vouch for /1, I know the oceans cannot “uptake” heat to abyssal depths in a matter of decades. Deep oceans can only retain more heat by the water cycle slowing down and there is clear evidence for this when you observe where the ocean heat is being retained.
An excellent paper – it is wonderful what a clutch of forams can do to time. The starting date of your paper coincides with the penultimate advance and retreat (represented on shore with terminal glacial moraine sites) that commenced about 20,000 years BP (R.W. Fairbridge, 1960). At this point in time (graph starting time), the sea level was some 60 metres lower than it is today. A series of fossil strandlines were developed off many a coastline (these coincide with the onshore terminal glacial moraines of about the same relative age), especially on the eastern Australian continental shelf which I drilled with some intensity in the late 1960s.
The sea level continues to rise with one final advance and retreat about 8,000 years ago before levelling off about 6,000 years ago.
So going back to your first graph – why does the temperature curve disconnect with the sea level chart for the period from 8,000 years ago when the temperature was at its highest and so was the sea level?
Your sea level curve flattens about 4000BC, right at the beginning of the Neoglacial. Rapid warming, causing the glacial retreat, has ended and land glaciers have more-or-less stabilized, with minor fluctuations. This would be my guess. Nice graph, thanks.
Yes, it’s a great graph…from Arthur Holmes classic Principals of Physical Geology…my version is 1965! Such a wonderful book…inspired me to become a geologist!
I’m disappointed that one of my comments seemed to have “disappeared”.
Here is a summary of that lost comment
The Holocene Climate Optimum was at least a few degrees warmer than pre-indutrial, and that was considered to be good news (an optimum)
So why would a return to a few degrees warmer than pre-indistrial IN THE FUTIRE not be considered to be another climate optimum (good news)?
Warmer in the past was good news
Warmer in the future is a climate emergency?
Richard,
I agree. I think a few degrees of warming, even five degrees is a good thing. It will happen mostly in the higher latitudes of the Northern Hemisphere where they really need it. People forget that warming does not occur globally, the tropics hardly change.
Maybe a mod got fed up with the spelling mistakes? There is an edit function, y’know.
Nice article Andy.
“Preindustrial” climate or temperature is one of the most illogical terms in the climate narrative.
A bit like the “pre-2007 Dow Jones index”.
From memory:
One of the key “97% of Scientists” surveys asked if the respondents thought the current temperatures were significantly above temperatures prior to 1850.
At the time I had TWO major problems with that question:
That survey also asked if man had played a “significant” role in any warming that did occur.
“Then they have the problem of the Holocene Climatic Optimum. This period from roughly 8,000BC to 4,200BC (see figure 1) is widely thought to have been warmer than today based on glacial advance and retreat data, and insolation models of temperatures around the world (figure 2).”
The Holocene Thermal Optimum could have potentially been warmer on average without the lack of El Nino conditions, and the last 6000 years could have potentially been colder on average without the increase in El Nino conditions. Are these profound changes in ENSO regimes solely due to reduced summer insolation at 60°N? I doubt it.
The temperature profile follows the same pattern as many other interglacials of the past: a rapid rise to an optimum lasting several thousand years followed by a gradual overall decline into the next glaciation. If I, very naively, approach this decline by a linear decrease with time I have some rough estimates about that decline. Level 0C, that of the Little Ice Age is at about the year 3000-3500. At that temperature glaciers will grow all over the planet, as they did in the LIA. Level -1C is at about AD6000 and -2C AD9000.
The second millennium optimum may be the last warm(ish) epoch before the ice returns in earnest. If the fluctuations of the past are anything to go by another temporary optimum at AD3000 may not be enough to gain humanity a few centuries.
Buy a hat and a pair of gloves and stock up on coal.
9,000 years ago, the angle of the Earth’s axis to the perpendicular to the plane of the ecliptic was at its maximum, more than 24.2 degrees. Now it is slowly declining. Is the development of agriculture in Europe not related to this?

Localised climate change is the favoured explanation for the origins of agriculture in the Levant.[1] When major climate change took place after the last ice age (c. 11,000 BC), much of the earth became subject to long dry seasons.[29] These conditions favoured annual plants which die off in the long dry season, leaving a dormant seed or tuber. An abundance of readily storable wild grains and pulses enabled hunter-gatherers in some areas to form the first settled villages at this time.[1]
https://www.researchgate.net/figure/Variation-in-the-tilt-angle-of-the-Earths-rotation-axis-over-13000-years-according-to_fig1_369287586
https://en.wikipedia.org/wiki/History_of_agriculture
This paper determines the features of variations inthe specific irradiation energy and irradiation intensityin the latitudinal zones of the Earth during the phaseof decreasing axial tilt in the range from 3000 BC to2999 AD. It has been found that the annual specificirradiation energy and the irradiation intensity vary ina similar way. There is an increase in irradiation in theequatorial region (radiative heat source) and adecrease in the polar regions (heat sink), i.e., theenhancement of latitudinal contrast in the annual irra-diation of the Earth.
https://www.researchgate.net/publication/369287586_Change_in_the_Irradiation_of_the_Earth_during_the_Phase_of_Decreasing_Tilt_of_Its_Rotation_Axis
On the irradiated surface, as the axial tilt decreases,the polar circles shift toward the corresponding polesand the tropics shift toward the equator. Over the half-period of the variation in the tilt angle (approximately20000 years), the displacement is about 290 km. Atthe same time, the area of the polar zones in the phaseof decreasing tilt angle is reduced by 25.93%. The areabetween the Arctic Circle and the correspondingtropic increases by 12.87%; the area between the tropicand the equator decreases by 9.8%. In the phase ofincreasing tilt angle, these changes occur in the oppo-site direction.An increase in the intensity of the meridionaltransfer of radiative heat is associated with a decreasein the axial tilt (Fedorov, 2019). The minimum of thetilt angle of the axis and the maximum of the meridio-nal insolation gradient are expected in approximately8000–9000 years.
The irradiation intensity exhibits a more complex pattern, in which seasonaldifferences in the Northern Hemisphere are smoothed out more noticeably than in the Southern Hemi-sphere.
My understanding is the Bova study used only SST proxy data between 40° S to 40° N to represent global trends. As shown in your figure 2 low latitudes warmed less than higher latitudes during the Holocene climate optimum. It seems unreasonable to exclude proxy data from higher latitudes to understand past trends as these regions show the strongest variations.
every day one step closer to my firm belief that Otzi was just a montgomery scott transporter malfunction.
The problem is the expansion of metropolitan areas and the reduction of green spaces due to human activity. It is known that plants absorb some of the sun’s radiation.
The same is true for the disappearance of species due to the continuous reduction of their living space.