By Andy May
In part 2 we discussed the IPCC hypothesis of climate change that assumes humans and our greenhouse gas emissions and land use choices are the climate change “control knob.”[1] This hypothesis underpins their attempts to model Earth’s climate. But the model output fails to match many critical observations and in some cases the model/observation mismatches are getting worse with time.[2] Since these mismatches have persisted through six major iterations of the models, it is reasonable to assume the flaw is in the assumptions, that is within the hypothesis itself, as opposed to being in the model construction. In other words, it is likely the IPCC conceptual model should be scrapped, and a new one using different assumptions constructed. In this post we examine their underlying assumption that the Sun has not varied significantly, at least from a climate perspective, over the past 150-170 years.
As well-explained by Bob Irvine,[3] there are only two things that contribute to the thermal energy content of a planet, the amount of incoming energy and the energy residence time within the system. These two things, along with the climate system heat capacity, determine the surface temperature. Arrhenius assumed and the IPCC still assumes the Sun delivers a nearly constant amount of energy to Earth over periods of a few hundred years, constant enough that it has no impact on our climate. In addition, they work with annual averages to avoid seasonal and orbital changes. In AR6, the base period is 1750 to 2019. The IPCC assumes the Sun is invariant, at least on an annual basis, over this period and volcanic activity is just slightly negative, as shown in figure 2.[4] AR6 summarizes their views as follows:
“Changes in solar and volcanic activity are assessed to have together contributed a small change of –0.02 [–0.06 to +0.02] °C since 1750 (medium confidence).”
AR6 p. 962.
The change of “-0.02°C” is indistinguishable from zero. Since the IPCC assumes that solar input to Earth’s climate system does not change, temperature only varies as a function of the “energy residence time,” which they assume is controlled by human activity and greenhouse gas emissions.
As explained in part 2, greenhouse gases absorb radiation emitted by Earth’s surface and use it to warm the lower atmosphere, thus delaying its eventual escape to space. It is uncontroversial that adding more of these gases increases the delay, warming the planet’s surface.
The IPCC assumes that the radiative forcing for a doubling of CO2 from 1750 levels is 3.9[5] W/m2 or less and that the climate impact of this forcing change is roughly equivalent to a change in solar forcing of 3.9 W/m2.[6] But a 3.9 W/m2 change in greenhouse gas emissions from the atmosphere in the infrared frequencies cannot penetrate the top millimeter of the ocean. Thus, it has a different impact than a 3.9 W/m2 change in solar radiation, part of which penetrates more than 100 meters into the ocean before it is fully absorbed. Oceans cover 70% of Earth’s surface and have a low albedo (reflectivity) to sunlight, thus the oceans absorb most sunlight reaching Earth.

Downwelling greenhouse gas radiation warms the surface of the ocean briefly, then most of it is quickly carried away by the overlying wind or as latent heat of evaporation. It has a short residence time in the ocean and in Earth’s climate system. A change in incoming solar radiation is absorbed deeper in the ocean and has a longer residence time. This increases the ocean warming effect at the point of incidence and spreads the new thermal energy over a larger volume of water. The difference in the surface warming effect can be a factor of three or more, Watt-per-Watt, relative to a change in greenhouse gas back-radiation.[7]
Evidence that Bob Irvine’s hypothesis is correct includes the change in ocean temperatures over the course of one approximately 11-year solar cycle.[8] The shallow ocean heat storage above the 22°C isotherm,[9] increases almost an order of magnitude more than the direct effect[10] of the solar cycle radiation increase. Further, this change is in phase with the solar cycle. Small changes in the Sun’s output can accumulate over time, increasing their effect on total climate system heat storage.
Wigley and Raper calculated that for a change in solar output of about 1.1 W/m2, roughly the change over one solar cycle, the direct change in Earth’s surface temperature should theoretically be in the range of 0.014°C to 0.025°C, which is undetectable.[11] However Judith Lean shows the observed surface temperature change, due to the increase in solar activity is about 0.1°C, 4 to 7 times what is expected and the increase in the upper atmosphere is 0.3°C, more than an order of magnitude more than expected from the change in radiation delivered to Earth.[12]
Lean also adds that were the Sun to become anomalously low, like during the Maunder Solar Grand Minimum (from 1645 to 1715) the expected global surface temperature cooling would still be less than a few tenths of a °C. This is only true if the cooling is linear with the change in radiation and if there are no unexpected amplifiers in the climate system, both assumptions are unlikely. We know that there are amplifiers in the climate system because the warming and cooling over the solar cycle are more than the theoretical change as Wigley and Raper have shown. The warming and cooling could be linear with the change in radiation, but there is no reason to assume this, Earth’s surface is complex and ever changing.[13]
More simply put, we know that the climate system somehow amplifies changes in insolation, but we don’t know exactly how. We know that solar output in the Maunder Solar Grand Minimum was less than now and the change from current solar output is small in percentage terms, but we have no idea what the effect on Earth’s climate of the change was, only that historical records and climate proxies suggest the effect was very large.
Known solar cycles correlate well with known climate cycles and are in phase with them.[14] Various hypotheses have been proposed to show how the Sun’s output changes over time periods of a thousand years or less. These are periods short enough to affect surface temperature from 1750, near the end of the Little Ice Age,[15] to 2019. The problem is that although a correlation between solar activity proxies[16] and climate change can be demonstrated,[17] a mechanism for the change in solar activity cannot. Attempts to explain solar variability by internal changes in the Sun only work in some cases. For example, Frank Stefani and colleagues have shown how the approximately 193-year de Vries solar cycle may be a beat period between the 22.14 Hale Solar Cycle and the 19.86-year orbit of the Sun around the solar system barycenter.[18]
Nicola Scafetta and Antonio Bianchini have shown that the orbits of the planets around the Sun correlate with solar activity proxies.[19] However, exactly how the small gravitational changes influence the solar dynamo is unclear. Thus, the hypothesis that solar activity is regulated within the Sun itself cannot completely reproduce observations, and planetary tidal forces seem too weak to accomplish the changes. These gaps in our knowledge of the mechanisms impede the acceptance that multi-centennial or multi-millennial solar changes can influence our climate. The Sun does change according to accepted solar proxies, like carbon-14 and beryllium-10 records, but the change mechanism is unclear.
The problem with the IPCC (and Arrhenius’) assumptions is that they ignore this empirical and theoretical evidence that solar output and/or solar energy input to the Earth’s climate system varies significantly over periods of a few hundred years. Their obsession with human greenhouse gases has blinded them to possible natural influences on climate change that they should be investigating. This is not to say that human greenhouse gases have no effect, it is likely that they do have some effect, but evidence suggests that natural influences, like the Modern Solar Maximum[20] and ocean oscillations,[21] play a significant role also.
There is a large body of peer-reviewed papers on the subject of solar activity as a climate change driver, yet AR6 ignores most of them. A very comprehensive review of recent research on the effect of the Sun on Earth’s climate is presented in a recent paper by Ronan Connolly and 22 colleagues.[22] In the paper they cite 396 papers on the connection between the Sun and climate, as opposed to only 68 in AR6 WG1,[23] both AR6 WG1 and the paper by Connolly, et al. were first published in 2021. This illustrates how selective the IPCC authors were in what research was considered in their report.
There is no valid reason to assume that the Sun was constant in its effect on Earth’s climate from 1750 until today. The usual reasoning is that observed changes in solar output are too small, in terms of power delivered per square meter (W/m2) relative to changes caused by increasing greenhouse gases, but as Irving explains these two sources of change are not comparable because the frequency content of the two sources are different.
Summary
The goal of this post is not to convince anyone that solar variability is responsible for all or part of modern global warming, a subject that is well covered elsewhere.[24] The point is that the IPCC reports and the CMIP models do not consider or investigate this possibility.
It is true that exactly how solar variability occurs and how it affects climate are not known, but the Sun does vary, and the variations correlate with climate changes. It is unlikely that climate changes are a direct result of the change in insolation, the solar changes are amplified by Earth’s climate system somehow.
We also do not know how much solar output has varied since 1650, the middle of the devastatingly cold Little Ice Age and the onset of the Maunder Solar Grand Minimum. There are several possible reconstructions of solar output since then. Figure 3 shows one of them constructed from an ice core beryllium-10 isotope record by Steinhilber, et al. The major climatic periods since 0AD are noted on it, and the Solar Grand Minima are identified.

The absolute values of delta-TSI (the change in total solar irradiation), in W/m2, plotted in Figure 3 are based on one of many possible modern TSI reconstructions (PMOD) and may not be accurate, but their values relative to one another are reasonable. None of the modern satellite TSI reconstructions are well supported, and the debate over which one is the best is furious and ongoing. See the discussion here for an introduction to the debate. It is best to not consider the absolute value of the Y axis in Figure 3, and consider it a TSI index, no one really knows how much TSI has changed, even over the satellite era. Further, as we’ve seen, how TSI changes relate to climate changes quantitatively is also not known. All we know is that they generally change together.
In Figure 3 we can see that colder periods, like the Little Ice Age, have some solar peaks and some warmer periods, and the Medieval Warm Period has solar lows. None of the climatic periods identified in Figure 3 were uniformly cold or warm. What we call the Little Ice Age, had some hot periods, and the Medieval Warm Period had cold periods (see the section after figure 2 here for references). Further, the correlation between solar activity and climate is not exact, nor is it uniform and synchronous over the whole planet. This is probably because of the effects of convection and atmospheric and oceanic circulation that I examine in the next post. Climate change is complicated.
The beginning and end of the climate periods identified in figure 3 are approximate, and mostly a judgement call. All the climate periods start and end at different times in different places.
However, we do know that some solar proxy reconstructions correlate well with climate proxies since 1850 (see Table 1 here),[25] and that alone is justification for additional research. Solar variability can explain anywhere from zero to almost 100% of the warming since 1850, depending upon the datasets used.[26]
This is a very brief summary of the evidence that changes in solar activity affect climate. More comprehensive discussions of possible mechanisms and the evidence for them are available.[27] Suffice it to say that this is an area of research that is too often ignored and brushed away as unimportant, especially by the IPCC. The sometimes excellent correlations in the peer-reviewed literature between solar activity and climate change alone should be enough to spur research. The fact that the IPCC has ignored these correlations is evidence of bias.
A point we will make many times in this series is that the Earth is not a uniform single thermodynamic body. Its surface is constantly changing. Treating it as a simple thermodynamic body, and one that can be characterized by a global average temperature is a huge mistake. Next, in part 4, we will discuss the potential impact of long-term changes in convection patterns.
Download the bibliography here.
(Lacis, Hansen, Russell, Oinas, & Jonas, 2013), (Lacis, Schmidt, Rind, & Ruedy, 2010), and (IPCC, 2021, p. 179) ↑
(McKitrick & Christy, A Test of the Tropical 200- to 300-hPa Warming Rate in Climate Models, Earth and Space Science, 2018), (McKitrick & Christy, 2020), (Lewis, 2023), (IPCC, 2021, p. 990) ↑
(Irvine, A Thought Experiment; Simplifying the Climate Riddle, 2023) and (Irvine, A comparison of the efficacy of green house gas forcing and solar forcing, 2014) ↑
(IPCC, 2021, p. 961) ↑
(IPCC, 2021, p. 925) ↑
(IPCC, 2021, p. 959), (Hansen, et al., 2005), and (IPCC, 2013, pp. 664-667) ↑
(Irvine, A Thought Experiment; Simplifying the Climate Riddle, 2023) and (Irvine, A comparison of the efficacy of green house gas forcing and solar forcing, 2014). Irvine provides estimates of the surface warming “efficacy” of greenhouse gas forcing versus solar forcing. ↑
Also called the Schwabe solar cycle. ↑
An isotherm is a plane of equal temperature, in this case 22° below the ocean surface. ↑
(White, Dettinger, & Cayan, 2003). The change in radiation expected ocean temperature change is done with the Stefan-Boltzmann equation. The expected change in heat content assumes a solar cycle radiation change of about 0.1 W/m2. ↑
(Wigley & Raper, 1990) ↑
(Lean, 2017) ↑
https://andymaypetrophysicist.com/2017/09/09/hadcru-power-and-temperature/ ↑
(Connolly et al., 2021), (Soon W. , et al., 2023), (Scafetta N. , Empirical assessment of the role of the Sun in climate change using balanced multi-proxy solar records., 2023), and (Soon, Connolly, & Connolly, 2015). ↑
(Behringer, 2010) and (May, Are fossil-fuel CO2 emissions good or bad?, 2022) ↑
(Scafetta N. , Understanding the role of the sun in climate change, 2023c) and (Scafetta N. , Empirical assessment of the role of the Sun in climate change using balanced multi-proxy solar records., 2023) ↑
(Connolly, et al., 2023), Table 1 ↑
(Stefani, Horstmann, Klevs, Mamatsashvili, & Weier, 2023) ↑
(Scafetta & Bianchini, Overview of the Spectral Coherence between Planetary Resonances and Solar and Climate Oscillations, 2023b) and (Scafetta & Bianchini, The Planetary Theory of Solar Activity Variability: A Review, 2022) ↑
(Vinós & May, The Sun-Climate Effect: The Winter Gatekeeper Hypothesis (I). The search for a solar signal, 2022) and (Usoskin, Solanki, & Kovaltsov, 2007) ↑
(Vinós & May, The Winter Gatekeeper hypothesis (VII). A summary and some questions, 2022f), (Wyatt & Peters, A secularly varying hemispheric climate-signal propagation previously detected in instrumental and proxy data not detected in CMIP3 data base, 2012b), (Wyatt, Kravtsov, & Tsonis, Atlantic Multidecadal Oscillation and Northern Hemisphere’s climate variability, 2012a), and (Wyatt & Curry, 2014). ↑
(Connolly et al., 2021) ↑
(Soon, Connolly, & Connolly, 2024, p. 60) ↑
(Connolly et al., 2021), (Soon, Connolly, & Connolly, Re-evaluating the role of solar variability on Northern Hemisphere temperature trends since the 19th century, 2015), (Crok & May, 2023), (Hoyt & Schatten, 1997), and (Haigh, 2011) ↑
(Connolly, et al., 2023), see Table 1. ↑
(Connolly et al., 2021) ↑
(Soon, Connolly, & Connolly, Re-evaluating the role of solar variability on Northern Hemisphere temperature trends since the 19th century, 2015), (Connolly et al., 2021), (Soon W. , et al., 2023), (Vinós, Climate of the Past, Present and Future, A Scientific Debate, 2nd Edition, 2022), (Hoyt & Schatten, 1997), and (Haigh, 2011). ↑
The most rapid climate change is related to solar activity, particularly solar wind power and UV radiation.

Low solar activity will cause cooling in winter at mid-latitudes in certain areas of the northern hemisphere due to changes in circulation, caused by changes in the ozone zone. Also, changes in the geomagnetic field in the north will bring climate changes in the northern hemisphere.
http://wso.stanford.edu/gifs/Polar.gif
I can’t find the climate change on your graph.
Nor I
What definite of climate change is this graph supposed to display?
I wonder if the peaks match up with El Ninos, but with a lag of 5 years on the ’97 Nino, but not the others… ahhh, probably nothing.
What significance the course of the jet stream has can be seen in the current weather. It can be seen that the jet stream current in the northern hemisphere has aligned itself meridionally and is descending in both the eastern Pacific and eastern Atlantic, which is why both the mountains of California and Spain are now experiencing heavy snowfall.
“The most rapid climate change is related to solar activity,’
There is no evidence of any solar energy effect on the global average temperature
The article sites several papers as ‘evidence’ and those papers reference at least 396 others…PROOF no..evidence yes…since you’re such a stickler for details perhaps you should choose your words more carefully next time.
Aren’t you the one that is constantly chastising those who claim that the fact that we can’t identify a CO2 signal in the noisy climate data, is proof that CO2 has no effect on climate?
With no Sun the Earth, its oceans, and its atmosphere would be frozen. Duh!
You equate climate change with global average temperature which makes no sense.
A possible reason for the lack of correlation of global temperature data compared to Solar activity is because the 60s, 80s and 90’s should have been warmer, because of volcanic aerosols (Agung, El-Chichon and Pinatubo. El-Chichon possibly canceled and El-Nino that would have rivaled 98.
How do you correct for that?
Obviously you make a guess for the amount and type of ash and aerosols those volcanoes put into the air.
If your guesses make the model better match what you were paid to produce, then your guesses were proven correct.
Bob Irvine’s hypothesis has some powerful supporters. Many years ago the late (and much missed) Fred Singer pointed out to me that, though sunlight penetrated the surface to a considerable depth, longwave radiation barely penetrated the surface.
The underlying paper by Bob is interesting in that he has done a hands-on experiment, which is quite easily replicable, to demonstrate his result, and in that the model he has derived from that experiment does a much better job of hindcasting global temperature than the giant general-circulation models do.
This is definitely an idea worthy of further exploration, perhaps by getting Bob’s paper published in a leading climate journal.
My major concern is that greenhouse gases do not account for the Medieval Warm or Little Ice Age, which is why I consider Mann’s Hockey Stick an effort to deal with that issue.
Obviously, solar variations could be the driver, but the evidence is a bit thin.
Tom, great observation. Which is why Mann’s main hockey stick contribution wasn’t his ‘Nature trick’ blade, but his flat handle. Unfortunately, trying to erase written and archeological history using bad proxies and worse statistics fails in the end. Archeological fact: Vikings grew summer barley, and buried their dead in churchyards during the MWP that are still now permafrost.
I regard the IPCC using MBH98 as a major study in 2000 as their decent into just making sh!t up mode. It was reminiscent of speculation of when Sir Cyril Burt started using imaginary collaborators and impossible statistics in his studies of heritable IQ. It was as if they did not care anymore.
And there is plenty of evidence in the soil and what it contains along the north south axis
Crops the Vikings grew are not a proxy for the global average temperature. They are merely one local observation
There is no proxy for a ‘global average temperature’
The solar intensity over land bottomed in 1537. The anomalous solar energy input to land is now 70ZJ since 1537. Most of that extra heat has gone into warming the land and melting the ice that was still on it in 1537.
Due to the distribution of the global land, the upward trend was slow until the late 1700s then started accelerating. There has been very slight acceleration since 1800.
There was a sustained cooling trend prior to 1537 that started at the peak of the holocene epoch. It is likely to have experienced ups and down due to the distribution of land across latitudes but something I have not got into.
There is no doubt that the the sun variation in output causes some noise but the warming trend is solid and caused by precession of Earth’s axis. Earth is on the verge of the NH swinging back into glaciation but the evidence will not be clear till around 2200 unless you go looking for it.
Demonising CO2 will be viewed as the 21st century version of burning witches.
How the western “democracies” killed themselves.
Many studies have produced evidence that the two strongest orbital cycles (obliquity, 41 kyr and precession, 26 kyr) probably do drive changes in ice volume. The data in the figure have been fitted to these periods and also to the longer, much weaker 100 kyr eccentricity cycle.

Changes in Obliquity
There is another important cycle that has the potential to affect the Earth’s climate; it is a 41,000-year variation in obliquity, the tilt of the Earth’s axis of rotation with respect to the perpendicular to its orbital plane. This variation is different from precession — the two motions are at right angles to each other — and astronomically is a much smaller effect. The obliquity varies by only a few degrees back and forth, and the current value of 23.4° is near the middle of the range. However, climatologically, the obliquity variation has the potential to have a fairly direct effect on seasonal extremes. After all, it is the obliquity that causes our seasons in the first place — if the Earth’s axis were perpendicular to its orbital plane, there would be no seasons at all.
https://aa.usno.navy.mil/faq/seasons_orbit
“The position of the Arctic Circle is not fixed and currently runs 66° 33′48″ north of the equator. Its latitude depends on the Earth’s axial tilt, which oscillates by more than 2° over 41,000 years.”
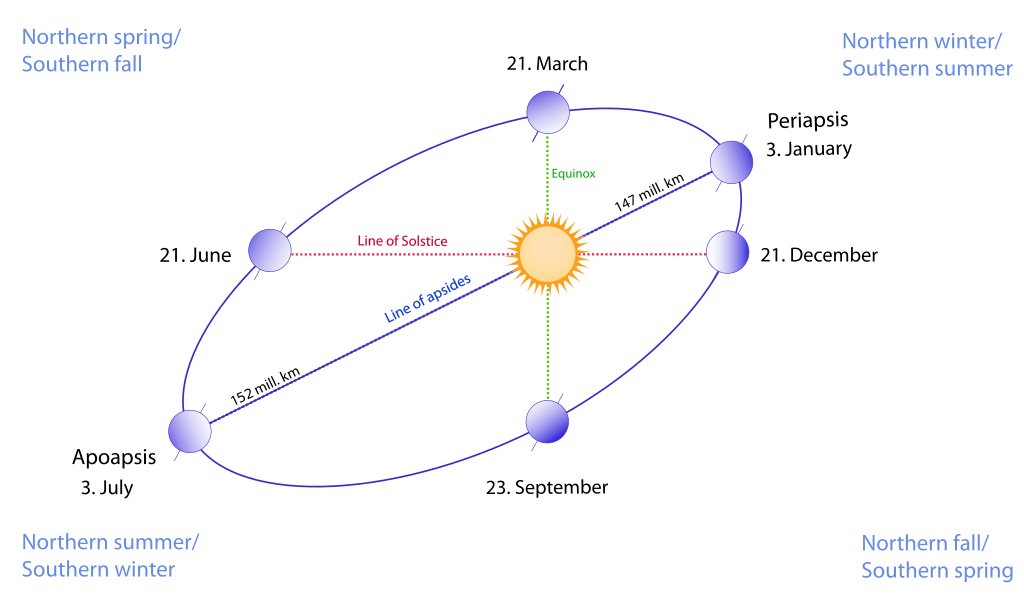
Exaggerated illustration of Earth’s elliptical orbit around the Sun, marking that the orbital extreme points (apoapsis and periapsis) are not the same as the four seasonal extreme points (equinox and solstice).
https://en.wikipedia.org/wiki/Earth%27s_orbit
We can measure the length of the year in several different ways. The length of the year from equinox to equinox (equivalently, solstice to solstice) is called the tropical year, and its length is the basis for our Gregorian (civil) calendar. Basically, the tropical year is the year of a complete cycle of seasons, so it is natural that we use it for ordinary purposes. But we can also measure the length of the year from perihelion to perihelion, which is called the anomalistic year. On average, the anomalistic year is about 25 minutes longer than the tropical year, so the date of perihelion slowly shifts over time, regressing by about 1 full day every 58 years. The date of perihelion thus moves completely through the tropical year in about 21,000 years.
https://aa.usno.navy.mil/faq/seasons_orbit
“The solar intensity over land bottomed in 1537.”
Speculation based on no accurate solar energy data. Total BS.
References. backup, graphs, data ?
“Demonising CO2 will be viewed as the 21st century version of burning witches.”
That is an excellent way of putting it, Rick. Well said.
The evidence is not thin. I dedicate several chapters of my latest book, “Solving the Climate Puzzle: The Sun’s Surprising Role,” to the evidence that solar variations were responsible for four of the most important abrupt climate events of the Holocene, including the Little Ice Age.
You can read Chapter 42, “Solar Gatekeeping Evidence,” for free in my ResearchGate page where a book excerpt is available. It explains the mechanism and shows some of the evidence on how solar variations affect climate.
Why didn’t we find out about this mechanism before? Because researchers were focused on the small changes in solar energy and possible amplifying mechanisms, when it turns out that the energy for the solar-induced climate changes is provided by atmospheric planetary waves, not the Sun. They can deliver huge amounts of energy and momentum to the polar vortex, but their propagation in the atmosphere is modulated by solar activity.
All warm and cool periods in the past 5000 years, when based on an average of local proxies, show the estimated global average temperature staying in a 1 degree C. range. Mann lowered that to a 0.4 degree C. range with proxy data mining.
Given the rough estimates of local proxies and using an average of them for a fake global average, the variations are statistically insignificant.
The causes of warmer and cooler centuries, reported with anecdotes rather than global average temperature measurements, are unknown, but definitely natural
“The causes of warmer and cooler centuries, …, are unknown, but definitely natural”
I’m printing that out & sticking it on my wall…that’s nearly as funny as Yogi-isms…one of my favorites being “It’s hard to make predictions, especially about the future.”
Irregardless of variations in solar energy output, the amount striking the Earth is strongly affected by cloud cover. Global cloud cover has declined over the past 40 years by about 2-3%. Is that not enough to measurably affect global surface and sea temperature?
For the data, see:
Lower tropospheric air temperature and global cloud cover. Upper panel: Global cloud cover according to Satellite Application Facility on Climate Monitoring. Lower panel: Global monthly average lower troposphere temperature (thin line) since 1979 according to University of Alabama at Huntsville, USA. The thick lines represent the simple running 37-month average. Reference period for UAH is 1991-2020. Cloud data access: Go to Climate Explorer > Cloud Cover > EUMETSAT CM-SAF 0.26o cloud fraction. UAH data access: Click here.
“Global cloud cover has declined over the past 40 years by about 2-3%.”
There are no accurate measurements of annual average global cloud cover that reveal exactly how much solar energy is being blocked by clouds.
There are estimates of the percentage of cloud coverage. But that is not what needs to be known.
The numbers you presented do not measure how much incoming solar energy is being blocked by clouds.
The effect of clouds on incoming solar energy depends on the type of cloud and timing of the cloud.
Certain types of clouds at mid-day will block more sunlight than other types of clouds early in the morning or in late in the afternoon.
Clouds, ranging from scattered fair-weather cumulus to extensive sheets of stratocumulus, produce no precipitation and last only as long as the upward motions continue (usually about 10-20 min for cumulus but days for stratocumulus) because such small droplets fall very slowly
Indeed, the research into earth’s natural sunscreen, i.e. global dimming and brightening, is more advanced than many appreciate. In fact there are fluctuations in the amount of solar energy reflected rather than absorbed by the atmosphere and surface. Brightening refers to more incoming solar energy from clear and clean skies. Dimming refers to less solar energy due to more sunlight reflected in the atmosphere by the presence of clouds and aerosols (air-born particles like dust and smoke).
The leading research on global brightening/dimming is done at the Institute for Atmospheric and Climate Science of ETH Zurich, led by Martin Wild, senior scientist specializing in the subject. ETH has announced The Global Energy Balance Archive (GEBA) version 2017: A database for worldwide measured surface energy fluxes. The title is a link to that paper published in May 2017 explaining the facility and some principal findings. The Archive itself is at http://www.geba.ethz.ch.
My synopsis of their findings is:
https://rclutz.com/2017/07/17/natures-sunscreen/
A comment about your figure 2 (IPCC AR6). You know IPCC lost the basic physics based on the second bar, other well mixed GHG.
They show CH4 having the biggest ‘other’ effect. True in the lab in a standard dry atmosphere. Not true in the real world averaging about 2% specific humidity on a planet that is 71% ocean surface. In the real world, methane is essentially not a GHE—its contribution is miniscule. The whole veg*an daily/beef thing is a canard.
Specifics. Methane has two smallish IR absorption peaks, at about wavelengths 3.5 and 7.8 microns (both bands are fairly narrow around those small peaks). (There is another negligible tiny height very narrow peak at about 2.8 microns). Both of those band heights are less than a tenth of two MUCH higher and broader water vapor absorption bands.
Google something like |methane and water vapor IR absorption bands| and you will easily find a recent open access peer reviewed paper juxtaposing both (and all other GHG like NOx) on a very nice single x=wavelength versus y=% IR absorption graph.
If I weren’t replying on my iPad I would fetch its archive off my main computer and attach it. Too lazy to go fire up the big boy and redo the comment. But easy for anyone at WUWT to find. I have done so twice in the last two weeks off my iPad.
Felt bad about not posting the key figure. Here are the open access coordinates:
Heliyon (2019) @ncbi.nim.nih.gov. Is the bottom part of figure 1.
Didn’t work Rud, can you post the link when you get a chance?
Here is a figure like the one Rud describes. Point being Methane makes little difference because the radiation in those bands is already absorbed by water vapor.
The leftist lying about methane is worse than their exaggerations of the effects of CO2.
Andy,
Here is an alternative analysis of the greenhouse effects of CO2 and water vapor, based on physics and thermodynamics.
Most folks criticize the IPCC, et al., methods, which are highly political, and take a cavalier approach to actual science, because the IPCC, et al., claims the “science is settled”
The Greenhouse Model and CO2 Contribution
https://www.windtaskforce.org/profiles/blogs/the-greenhouse-model-and-co2-contribution
Dr. Cyril Huijsmans, a Dutch Research Scientist Retired from Shell
.
EXCERPT
The Greenhouse model, as is universally presented, appears to be incorrect.
Molecular collisions and convection, rather than re-radiation back to earth, is the energy transfer mechanism.
.
The black body radiation of the earth, after absorption by greenhouse gases, is quickly converted into kinetic energy, and becomes part of the thermal pool of the atmosphere.
.
The atmosphere should not be treated as a black body radiator, as there is no thermodynamic equilibrium. Even for a local thermodynamic equilibrium, one cannot define its boundaries in the sense of the premises of Planck’s law.
.
Furthermore, the maximum possible contribution of CO2 to the greenhouse warming is limited to about 7% of the total warming potential from black body radiation.
This is solely based on the black body energy availability from Planck’s energy distribution in the range of the CO2 absorption wavelengths.
.
To achieve this maximum possible contribution, about 0.15% of the current presence of CO2 molecules in the atmosphere would participate, i.e., less than 1 ppm of CO2 concentration in the atmosphere.
.
Water vapor, WV, is the most important greenhouse gas and contributes about 93% of the greenhouse warming. With the current concentrations of WV and CO2, the black body energy is fully absorbed, i.e., saturated.
.
NOTE: These articles have similar results using WV and CO2 ppm in atmosphere.
https://www.windtaskforce.org/profiles/blogs/hunga-tonga-volcanic-eruption
https://www.windtaskforce.org/profiles/blogs/natural-forces-cause-periodic-global-warming
.
1 Introduction
.
CO2 is considered by the IPCC and allied entities, as the main contributor of the greenhouse phenomenon.
.
To place this view in perspective, it is important to realize, the earth’s black body, BB, radiation is the source of heat trapped by the greenhouse effect.
.
The model of the greenhouse phenomenon considers absorption of the earth’s BB radiation by CO2 and other greenhouse gases, and subsequently, the greenhouse gases radiate the absorbed energy back to earth, keeping the soil warm and by convection also keeping the atmosphere warm.
.
The most important greenhouse gases are WV and CO2.
There are more greenhouse gases, but their contribution is very small.
.
The earth’s BB radiation ranges between wavelengths 2 – 70 micrometer.
WV is the most important and dominant greenhouse gas, which absorbs heat in the whole range of wavelengths of the earth’s BB radiation, except between 8 – 12 micrometer, and to a lesser extent around 15 micrometer.
.
CO2 absorbs essentially only one wavelength in the range of the earth’s BB radiation, i.e., at 15 micrometer.
.
There are two more wavelength’s of absorption by CO2, but they are at the edge of the earth’s BB curve, and at current temperatures, their contribution is very small, i.e., less than 0.5%.
.
The atmosphere of the earth is transparent to space between 8 – 12 micrometer; WV and CO2 are not absorbing at these frequencies.
.
The potential for CO2 to trap heat around the wavelength of 15 micrometer is about 10.5% of the total heat emitted by the earth’s BB radiation.
.
This is the part of BB energy emitted by the earth of the total BB radiation emitted at 300 K that can be absorbed by CO2, as can be calculated with Planck’s law. See Appendix A
.
The rest of the greenhouse effect is absorbed by WV.
A part of the radiation between 8 – 12 micrometer goes directly into space.
.
Due to the transparent window, and the large share of WV in the absorption of the earth’s BB radiation, including also some absorption around 15 micrometer, the maximum share of CO2 is limited to about 7% of the total greenhouse effect. See Appendix C.6
.
Read more by opening URLs
Andy,
“Arrhenius assumed and the IPCC still assumes the Sun delivers a nearly constant amount of energy to Earth over periods of a few hundred years, constant enough that it has no impact on our climate. In addition, they work with annual averages to avoid seasonal and orbital changes.”
If you are really going to write post after post on this stuff, you really should make the effort to find out how GCMs really work. That would put you well ahead of most folks here. GCM’s use observed TSI as a forcing. They don’t work with annual averages; for each location on Earth they use their best estimate of TSI at that time and place, including diurnal variation. You say over and over that IPCC (meaning GCM developers) assume this or that. You should find out; look at the code, if you can. They don’t. They use observed data as inputs; the best they can get.
What you are really pointing to is not a fault in the GCM itself, but what you believe is a fault in the input TSI data. OK, find out what they use, and spell it out. What actual data do they use (find out), and why do you think it is wrong. Your credibility there is not enhabced by citing so many crank papers.
Nick, I am maybe one of the few here who has gone thru more than one GCM detailed code documentations (not the code itself, only its multihundred page mathematical documentation). So I actually know how they ‘work’ (or not). Have you?
That is why I know the CFL constraint on numerical solutions to partial differential equations means they are computationally intractable by several orders of magnitude at meaningful physical scales, so must be parameterized to best hindcast. And that is how they unavoidably drag in natural variation while presuming they don’t. And that is fatal, as their projection results easily prove.
And why most climate models therefore must fail. Earliest simplest illustrated post here on this topic long ago was ‘The trouble with climate models.’ I suggest you review it before getting back.
i also note there is one exception in CMIP6. INM CM5 does NOT produce a nonexistant in reality tropical troposphere hotspot. Because its ocean rainfall was parameterized using ARGO observations. Also has an ECS of 1.8, closest to EBM observational estimates.
“Have you?”
Yes. In fact, I was around when the first CSIRO GCM was being developed. I spent at least 20 years working on CFD (I wrote a commercial code, Fastflo). As your
informative post says, GCMs use a FEA-like discretisation, though they use faster methods than FEA. And there is a CFL constraint, which basically says that the grid has to resolve the fastest process happening, which are pressure waves. In a closed tank you’d call them sound, but here they are more like gravity waves, and so are slower. But if they resolve fast processes, they are certainly adequate for resolving climate change.
And as you say there, there is a similar CFL with numerical forecasting. GCMs are just NWF programs run beyond the forecast period. NWF is only for a few days, so they can use shorter timesteps and a 2-3 times finer grid. But they work very well.
None of this has to do with how they take in TSI data.
‘2-3x finer (weather) grid’. Your claim appears factually just wrong. By several orders of magnitude (~200/~4=50, not 3). And Paraphrased, ‘GCM’s work very well’. Nope, they produce a tropical troposphere hotspot that does not exist, and an ECS about twice observational EBM per Lewis and Curry 1 and 2.
Nick, you want to challenge me on easily researched facts, come with your fact gun loaded and cocked, not with a rubber assertion knife. Embarrassing. ‘Bam’ goes my loaded and cocked fact gun—metaphorically aimed at you.
Non apology. You challenged me on a bad sad night just a week after I had to put our beloved dog of almost 17 years down because a horribly aggressive cancer. Bam. Bam.
Bam. As illustrated in my above cited earliest climate model post here (easily searchable here as I gave you the post name and you obviously knew the author), the then finest IPCC climate model horizontal grid resolution was about 250km per side (in CMIP6 with better supercomputers it has been reduced to about 150-180 km).
The then equivalent UK ‘best’ weather model was a 4km grid for regional weather fronts, and a lesser regional coverage (land only) 2.5km grid to resolve weather front precipitation using actual Navier-Stokes viscous turbulent flow physics. I illustrated both in the old here post using the then UK Met new model brag illustrations from them—their then public justification for their new ~£100 million expense.
(Fun aside for WUWT cogniscenti. See Feynman ‘Lectures on Physics’ Volume 2 chapters 40-41 for his delightful and insightful take on the differences between (C40) the flow of dry water, and (C41) the flow of wet water. For those who don’t get Feynman’s brilliant ‘dry physics’ joke, wet water also has viscosity.) My personal Feynman Physics Lectures volumes 1-3 are well thumbed.
My old post’s illustrated weather/climate model difference was intentionally easy for anyone (including hopefully Nick) to understand. The UK weather model ‘only’ ran on the UK region (parameterized outside that region) for about 5 days. NOT on the whole world for a century.
The difference between computationally tractable regional weekly weather and computationally intractable global century climate was then 6-7 orders of magnitude. Put differently at the time I wrote the post, it would have taken roughly 2 million years for the 4km grid UK weather model to complete a single century global climate run—a wee bit longer than the about two months climate models then took (per NCAR) for 1 run at their much grosser grid resolution.
And this analysis ignores Pat Frank’s trenchant separate hopeless compounding of climate model error. More simply put for WUWT here, two climate model wrongs do NOT make climate models right.
I have not rerun the orders of magnitude numbers since the old original post, as the computationally intractable disparity is still so great. Several orders of magnitude does not depend on calculating the precise value of ‘several’.
I do agree with Nick that none of this has to do with model TSI. BUT it has lots to do with climate models generally, which is the general subject of this Andy May series of posts. So still topical albeit TSI independent.
Andy, please feel free to reuse this as you see fit without attribution. Facts and common sense have no authors.
Rud,
‘By several orders of magnitude (~200/~4=50, not 3)”
Your fact gun is short on details and even shorter on linked sources. Firstly 50 is not several orders of magnitude less than 3. But I have a source, none other than Rud Istvan, linked above:
“The finest CMIP5 horizontal resolution was ~1.1° or about 110km.”
and
“The newest (installed in 2012) UK MET weather supercomputer and associated models use a rough scale of 25 km”
the latter being just for the UK.
The GFS weather program has just been upgraded:
“The GEFSv12 upgrade addresses significant challenges in the extended range portion of forecasts. GEFS resolution increased from approximately 33 km to 25 km”
Your “fact gun”:
“in CMIP6 with better supercomputers it has been reduced to about 150-180 km”
No, even back in 2015 you said finest CMIP5 resolution was 110 km, as I quoted above. GFDL’s CM4 from CMIP6 has about 110 km. The French CNRM-CM6-1-HR has 55 km. That is only two times more than GFS.
Details, details. One of the most efficient natural mechanisms for transporting thermal energy (heat) from the surface to the upper troposphere for emission to space is the common thunderstorm, which can easily be smaller than 24 km across, less than any of the grid cells you mention.
Nick, you think one-dimensionally, like most modelers. GCMs are coarse collections of one-dimensional models cobbled together. These grids only interact with each other at their edges, and very crudely. This is why timing problems (that is time step problems) are so important. Can’t have a time step so short it is shorter than the time to get across a cell. This is why the big picture is missed.
GHGs are limited to the atmosphere, they just bounce around for a while and then are expelled to space. Solar radiation joins the ocean thermal energy pool, the reservoir of 99.9% of the thermal energy in the whole climate system. It acts cumulatively over extended periods. Oceans are not good at lateral energy transport; the atmosphere is excellent at lateral transport. More later.
Andy,
“ GCMs are coarse collections of one-dimensional models cobbled together.”
Your ignorance of GCMs shows more and more. Even Rud here explained the treatment of dimensions.
“Can’t have a time step so short it is shorter than the time to get across a cell. This is why the big picture is missed.”
That is potentially an explanation of CFL, but it’s the wrong way around. CFL limits how long a time step can be. And that doesn’t miss any big picture. It just means you have to take a lot of time steps.
Thanks Rud,
Charles moved my post to earlier in the queue and caught me by surprise, so I’m a little late. Still reading through the comments. Both your comments and Nick’s are along similar lines. I’ll jointly address them soon at the current end of the comments.
I appreciate your information on the internal details of the GCM’s, but as you say, I am addressing the models more generally. I know from long experience that the details of how to construct stable gridded models are not as important as the assumptions that went into their design.
The expected predictions of climate models were known before they were programmed. Only the Russians seem to have ignored the expected narrative.
The programming is irrelevant when the expected answer (ECS of CO2) was specified in advance.
The climate confuser games are very effective climate scaremongering propaganda.
That is their intention.
There has been no evidence in the past 50 years that accuracy was the primary goal. Except possibly for the INM model.
Model resolution is clearly the problem here.
It is clear that the latest models treat all energy that is absorbed in the first 10m grid of the ocean in the same way. In fact the “Technical Guide to MOM 4.0, GFDL Ocean Group Technical Report 5, 2008) divides solar penetration into the water column into three exponentials. Quote from MOM Guide 8.3.2;
“The first exponential is for wavelengths >750nm (i.e., IIR) and assumes a single attenuation of 0.267 meter…”
The models treat the long wave GHG energy the same way that they treat the long wave solar component, by simply including it in the first, nominally 10 meter, grid by assuming an attenuation of 0.267 meter. They simply do not distinguish or account for the fact that long wave GHG energy centred at 15 microns is almost totally absorbed in the evaporation layer and is proportionately returned to the atmosphere almost immediately by evaporation when compared to solar energy. To treat this accurately the models would need the first ocean grid to be 0.2mm thick. This is something they simply don’t do for reasons of complexity.
Nick, can you give me a reference that indicates models differentiate between GHG ocean penetration that is overwhelmingly absorbed in the evaporation layer and solar ocean penetration that generally is not.
Bob,
MOM4 is an ocean model, not a GCM, and it seems that your link was written in 2004.
Nick,
Can you give me the reference as requested at the bottom of my previous comment.
If the models did recognize the difference in ocean penetration between GHG and Solar forcing then they would, of course and obviously, register a large difference in efficacy between the two forcings.
They don’t produce a difference in efficacy, so it follows that the models have not allowed for the big difference in ocean penetration.
Forcing efficacy and energy residence time are essentially the same thing.
“Parameterized to best hindcast”. I am not sure that’s how it is done. Take convection, for example. Once you decide to parametrize it, there are many model variables you can use, and hundreds of ways to construct equations. I imagine that suddenly a light bulb lights in a modeler’s head. Or maybe (s)he googles how to do it, which suggests there may be a mother of all parametrizations somewhere. Of course there will be a number of parameters you have to select, but doing it to the best hindcast looks like a formidable task.
Convection is a basic outcome of solving the Navier Stokes equations. It was being done long before google.
If convection is so easy, why do they get it so wrong. This is figure 7.14, AR6 WGI. Just one of many examples. Don’t get me started on the NAO.
What is your basis for saying it is wrong? They are just showing what would happen after CO2 quadrupled. That hasn’t happened yet.
“Abrupt CO2 quadrupling” – in what universe is that possible???
Bad enough they exaggerate the total effect of an increase in CO2, but to pretend a radical change that would take approximately 350 years in the real world happens overnight is just pure alarmism and click-baiting of the political and rent seeking kind. It is not science.
Yet, that is the way they model ECS. As you say, it is very unreal. It follows from their assumption that CO2 controls our climate and nothing else matters. Thermodynamic models only work in controlled systems, like steam engines, they don’t work for the weather.
“Yet, that is the way they model ECS.”
Abrupt doubling of CO2 is the very definition of ECS, going back to Arrhenius. It makes no assumption about wht else might happen; it just quantifies the effect of CO2.
““Abrupt CO2 quadrupling” – in what universe is that possible???”
Where do you get the word “abrupt” from?
And concoct the sentence “pretend a radical change that would take approximately 350 years in the real world happens overnight”
Nick’s statement does not give a time scale.
Figure 7.14 is designed so that the colors between the model (lower figure) and the observations (upper figure) can be compared directly. The scales are different to make this so. From the text discussing the figure (page 990, AR6):
Just one of many examples of critical model/observation mismatches in the Pacific. The fact that they get the Walker Circulation wrong is a huge problem, it often drives global weather.
The Earth is not a giant uniform thermodynamic object. Dynamic processes drive our weather, not thermodynamics as the models assume.
CG, I explained the two way it is commonly done in a long ago illustrated post here on parameterizion. (Both illustrated). Will not repeat. Neither is the details of convection. Both involve the gross model outputs.
Research for yourself. Is long ago posted here. I am old and tired. But to help you:
One way is meteorological divergence. Example in past post here, rapid appearance of double ITCZ means faulty parameterization, since it doesn’t ever happen.
Second way, divergence from near term climate norms. Example in post was statistical variance from graphic Arctic seasonal climate.
Thanks.
Racehorse’s beloved CSIRO now (2002) has “The CSIRO Mk3 climate system model” … there’s a paper on it by Eva Kowalczyk. Stokes is not an author.
The CSIRO Mk3 climate system model | Eva Kowalczyk – Academia.edu
Sorry, this was meant as a reply to Andy’s post, not wilpost.
“GCM’s use observed TSI as a forcing.”
A radiative forcing, and they assume that each watt of TSI forcing has less an effect on climate at the surface than the equivalent GHG forcing (Hansen, et al., 2005 and AR5 pp664-667). This is backwards.
Solar changes on the climate system involve more than the change in radiation received, that is the point. The IPCC and the CMIP should not assume they know exactly how solar variability affects the climate, they don’t.
I did not assume that the models have one year time steps and didn’t write that either.
You said, and I quoted
“ In addition, they work with annual averages to avoid seasonal and orbital changes.”
The IPCC works with annual averages, the CMIP modeling group is a separate entity. They do so mostly out of necessity. The annual changes in temperature are much larger than the changes since 1750. The attached is the monthly change in global average temperature from ERA5. Note global average temperature varies almost 4 degrees between January and July every year.
The IPCC doesn’t do any scientific work. It is a political body that recruits selected scientists to produce report chapters by selecting and interpreting published articles. GCMs are independent of the IPCC.
Some scientists produce solar activity reconstructions which can be used by GCMs. GCM consortiums like CMIP make recommendations on which solar activity reconstruction to use, but the decision is on the scientific group building the model.
Models are able to extrapolate the insolation conditions on every grid cell for every time point from the reconstruction provided, taking into account changes due to the variable distance to the Sun and the Earth’s orientation.
This does not mean that GCMs correctly reproduce solar effects on climate, because solar effects on climate are not properly known, and what is not known cannot be programmed. Models are unable to properly reproduce even the known effects from the 11-year solar cycle.
“The IPCC doesn’t do any scientific work.”
They’re just like you!
The IPCC, et al., wants folks not to focus on water vapor
Figure 2 in your article leaves out water vapor, which is responsible for about 93% of the greenhouse effect.
The sun evaporates water, which becomes water vapor, and rises to form clouds.
The water is transported to most places of the earth.
Water vapor has a lifetime presence in the atmosphere of about 10 days, due to rainfall, etc.
However, it is constantly being replenished with new water vapor, so the total amount in the atmosphere varies very little from day to day.
The sun warms the earth, 24/7/365, while it is rotating. Without that rotation life could not exist. One side would burn up, the other side would freeze.
A tall pile of baloney
Now there’s a truly evidence based ad hominem attack if I ever saw one. What device did you use to measure it? Since ‘tall’ is a subjective term what is the height of your reference stack of baloney to classify it as ‘tall’? Why baloney for your ad hominem? I know a lot of people who love baloney.
Dear Andy,
We (in OZ) have temperature datasets going back at least for 100-years, in some cases like Sydney and Melbourne Observatories to ~1850. Although the standard in those days was different (calibrate using Kew standards), and sites have moved and changed, why are post-1850s solar cycles etc. not reflected in long-term data?
The second question is, if solar changes were reflected in data, how would this affect the response of maximum temperature data to rainfall, which under dryland conditions is the only source of latent-heat cooling?
Also, I published a study at http://www.bomWatch.com.au, which we summarised at WUWT, where I compared sea surface temperature measured in 1871 by Henry Chamberlain Russell, then NSW Government Astronomer at Sydney Observatory, on a trip to Cape Sidmonth to observe the total eclipse of the sun, with data measured over the last several decades by the Australian Institute of Marine Science (AIMS) (https://wattsupwiththat.com/2021/08/26/great-barrier-reef-sea-surface-temperature-no-change-in-150-years/).
The main conclusions were: Compared at the same times of the year (November and December), there is no difference in average sea surface temperature over the last 150 years, which shows that temperatures are homeostatic, that is, self-regulating.
Secondly, during the warmest time of the year (from December to March) the monsoonal water cycle acts a self-regulating heat pump that maintains average sea surface temperature between 29 and 30degC. If the water entering the Reef Lagoon cannot warm, neither can the North Queensland or East Australian Currents. There is no evidence that the process has broken-down or is likely to do so in the future.
Likewise there is no trend in AIMS datasets that go back at least 30 years.
How does this accord with commentary related to the effect of solar cycles on SST?
Yours sincerely,
Dr Bill Johnston
http://www.bomwatch.com.au
Thanks Dr. Johnston,
Good points. The non-changing average temp of 29-30 makes sense, since ocean temperatures are limited to that maximum by deep convection (see Sud, et al. 1999 in my biblio). As for the November temps, I’m not sure.
There is a persistent planetary wave (#4) over the Southern Ocean that changes regularly with the solar cycle, perhaps that has a stabilizing effect. See attached, it is from this post:
The Sun-Climate Effect: The Winter Gatekeeper Hypothesis (II). Solar activity unexplained/ignored effects on climate – Andy May Petrophysicist
Andy
“As well-explained by Bob Irvine,[3] there are only two things that contribute to the thermal energy content of a planet, the amount of incoming energy and the energy residence time within the system. These two things, along with the climate system heat capacity, determine the surface temperature.”
If you look at the comments on your WUWT link, you’ll see that even the WUWT locals (eg Javier) didn’t think much of it. And there is a very good reason; you can’t observe the residence time.
What you should do is what every heat transfer scientist does; look at flux balance (heat being conserved). This cuts short all the nonsense spoken of light rays penetrating etc.
Flux has to balance at the surface, otherwise a sufficiently thin layer will heat or cool at infinite speed. The flux away is IR, evap and conduction to air. These are all determined by T, and to some extent wind. They are not determined by how the heat got there. IR is S-B; evap is Clausius-Clapeyron+wind, and conduction is temp difference+wind.
So surface T is locked to those flux expressions, and can only be maintained if there is enough heat coming in to balance. Those influxes are solar in, and downwelling IR. It doesn’t matter whether the solar penetrated to whatever depth. It still has to come out, and helps to balance flux at the surface, and hence maintain T. It doesn’t matter whether thermal IR penetrates or not. It doesn’t have to. It just has to contribute to flux balance.
It might help to think about sun on a rock. There is no evap; the rock gats quite hot, so loses heat mainly by SB. Neither SW nor LW penetrate the rock. But in the same way as water, it comes to a temperature where outflux equals influx.
Nick, how do you define the surface of a cloud?
This is not relevant to heat flux at the ocean surface.
Now you are saying that clouds are not relevant to the heat flux at the ocean surface?? What are you smoking?
The ability to define the surface of a cloud is not relevant.
Your abject inability to define ANYTHING, is highly relevant… and very laughable.
Nick you say:
Surely T is a measure of “conduction to air”. Specifically, Tmax is a measure of peak conduction (advection). Tmin results from heat loss (IR) between the time of Tmax, and when SW starts to impact the atmosphere (and T starts to rise) around dawn. In rainfed environments the only source of latent heat loss is rainfall (mm = 1kg/m^2) multiplied by L (2.45 MJ/mm). T is therefore determined by the advection component of the heat balance (flux), not the other way around.
Cheers,
Bill Johnston
Bill, I’m talking about this stuff of Andy’s
“Downwelling greenhouse gas radiation warms the surface of the ocean briefly, then most of it is quickly carried away by the overlying wind or as latent heat of evaporation. It has a short residence time in the ocean and in Earth’s climate system. A change in incoming solar radiation is absorbed deeper in the ocean and has a longer residence time. This increases the ocean warming effect at the point of incidence and spreads the new thermal energy over a larger volume of water. The difference in the surface warming effect can be a factor of three or more, Watt-per-Watt, relative to a change in greenhouse gas back-radiation.[7]”
Ocean temperatures. But wherever you are, each flux is determined by T, and maybe something else. T settles to a value where fluxes balance. No individual flux determines T.
Well that was meaningless gibberish, Nick !
Nick,
Do you believe that the residence time of energy has no effect on temperature? All greenhouse gases do is change the residence time, they supply no additional energy. You are arguing the greenhouse effect makes no difference, which surprises me.
Andy,
What is the residence time? How do you measure it?
I don’t think you can, and so I don’t think it is a useful thing to talk about.
So we don’t know and it is useless to talk about what we don’t know, so let’s parameterise it or ignore it. 😉
It’s something folks here made up, but can’t say how it should be used.
So you can’t measure something. have no idea what it is, or even if it is important..
So you just ignore it…
roflmao !!
Well done, NIck.
You have just trashed all the climate models in one sentence.
“So you can’t see my imaginary friends, can’t hear them, can’t smell them, have no idea who they are or if they’re important, so you think we should just ignore them.”
Well, yes, of course.
Nick,
If we assume the incoming energy from the Sun is constant, which is what the IPCC does, then temperature is a function of residence time. Measure it with T.
The more important question than resident time is how much energy is required to overcome the increased mass of the atmosphere.
Andy,
“Measure it with T.”
Then you can’t use it to discover T. You have to know it already.
Perfectly circular, just like climate models.
Andy,
You admitted your logic is circular, but you haven’t done the same with climate models – that’s just your assertion.
The ERF change for a change in CO2 (or TSI) is generally assessed at the tropopause, and the surface warms according to the lapse rate. If something causes a 3.7 W/m^2 decrease in outgoing LWR, the surface must warm in response until the energy imbalance at the tropopause returns to 0, regardless of what caused the imbalance.
The Sun is a stable star, and there are no observations of solar variability that can explain any significant fraction of current warming. However, CO2 is building up in the atmosphere, and this is responsible for about 2.2 W/m^2, which essentially explains all current warming (since the impact of other GHGs and aerosols nearly cancel).
You can’t just make stuff up about “residence time” and expect rational people to give up on thermodynamics because of it.
If we take Bob Irvine’s values for sensitivity – 1.4 C/Wm^2 for TSI and 0.35 C/W/m^2 (which is based on a kitchen experiment that does NOT represent the oceans), we still end up with dCO2 causing about 0.6 C and dTSI causing next to nothing, because TSI doesn’t change by much.
Residence time is a useful concept to understand how the climate system functions, but it is an intractable problem. It is not a constant value, it changes continuously as energy is transported in variable amounts through variable pathways. It cannot be measured in any significant way and, therefore, it is not useful to study the climate system.
Indeed so. The underlying problem is that you can’t label heat, so it is impossible to measure directly.
Javier,
Forcing efficacy depends on energy residence time and is, not just a “useful concept”, but integral to any reality-based sensitivity study.
Because it is difficult to measure does not mean it should be ignored.
In fact, if forcing efficacy is discarded as not useful, you can be absolutely certain that any resulting sensitivity calculation will be wrong.
Residence time is inextricably linked to the net flux at the top of the atmosphere, and while the second can be measured, the first cannot.
Let’s imagine an equilibrium at the ToA. If we increase the average residence time of energy in the climate system, outgoing energy will decrease causing a disequilibrium, and the Earth will warm up to reach equilibrium (net flux = 0). This is what the CO2 increase is supposed to do.
My hypothesis of natural climate change is that the transport of more heat to the Arctic in winter increases emissions there, and since the greenhouse effect is several times weaker in the Arctic in winter, the residence time of heat decreases, cooling the planet. This is what happens when solar activity is low, and can be detected in winter Arctic temperatures and outgoing longwave emissions. The opposite happens when less heat is transported, and that is why I call it the Winter Gatekeeper Hypothesis.
So when the energy residence time is altered the way to look at that is to look at the ToA imbalance. When we do that what we see is that incoming energy is increasing, partly compensated by an increase in outgoing energy. This means energy residence time is decreasing, but not enough to compensate for the increase in incoming energy. Not exactly what one would expect from an increase in CO2.
Any sensitivity calculation is wrong because of the unproven implied assumptions that go into the calculation.
Javier,
Thanks for the detailed reply.
Your quote,
“It (residence time”) cannot be measured in any significant way and, therefore, it is not useful to study the climate system.”
We should not dismiss an approach as not being useful in all circumstances. The climate is immensely complex, and we should always use the most useful tool in the toolbox. If that tool is residence time, then so be it.
There are many ideas that attempt to explain the correlation between solar activity and climate. Your Winter gate Keeper Hypothesis, Stephen Wilde’s jet stream, the cosmic ray cloud connection and Lindsen’s Iris negative feedback are all strong contenders in this area.
None of these can be easily explained using residence time alone. As you say, residence time is not a useful concept to describe these phenomenon. There are better ways.
My idea, on the other hand is best described in terms of residence time.
Here is a quote from my comment at the bottom of this thread, referenced in the comment on 4/3/24, 9.15 pm, below.
“AR4 describes efficacy in terms of residence time.
Forster (2006) describes ERF in terms of residence time.
Hanson (2011) describes sensitivity as a function of TOA response time which is directly related to residence time.”
My idea, as you realize is that solar energy is absorbed deep in the ocean on average and consequently can remain in the system for many years. Energy reemitted by GHGs is almost totally absorbed in the evaporation layer and is consequently returned to space relatively quickly on average.
The efficacy of solar forcing or any change in solar forcing must be significantly higher than the efficacy of a similar GHG forcing or change. My use of residence time to describe this phenomenon is simply common sense. It is clearer in my opinion.
That solar forcing could have an efficacy 3 to 4 times higher than GHG forcing is something that needs significant investigation, and if true would solve a lot of the climate sensitivity issues we all struggle with.
Well put, thanks.
The global average temperature increase is ALL explained by the precession cycle; distribution of global land surface and differing responses of land and ocean to solar input.
The sunlight anomaly over global land since it bottomed in 1537 is 70ZJ. That has resulted in the land warming and, most importantly, the oceans retaining more heat as summer advection in the NH has reduced.
Nothing at all to do with CO2 or anything with the sun. The solar variation is observed as noise against this ling-term, sustained warming trend.
There is some slight acceleration as the peak sun moves northward.
All climate models warm the lower southern latitudes but cool the high northern latitudes relative to measured. The high latitudes of the NH are warming faster than anywhere else and mostly in winter.
The CO2 nonsense needs to be called out. It is not based on physics.
And expecting the warming trend to shift to cooling trend until the ice is accumulating again is just wishful thinking.
You do not need to be very smart to realise that land has a highly positive response to sunlight. Places remote from the ocean can experience a annual temperature range of 70C. Globally, the annual range on land is 12C. The response is highly linear. Over oceans, the response to sunlight is non-linear and changes about 1C over an annual cycle globally.
You really do not have to be Einstein to appreciate that the solar intensity shifting northward would cause the globe to warm up. It is ALL the sun. It is just that very few people actually understand Earth’s axial precession cycle. By 2100, the land surface will be 3C warmer than 2000. That is viewed as a big change but it is trivial in the context of what is to come over the next centuries. It will be 2200 before the permafrost starts to advance south again. Could be a thousands years before the ocean start t fall again. Anyone who has looked at the precession cycle in relation to glaciation can forecast what is coming.
The warming trend will continue and accelerate a little. Thinking that minuscule changes in the sun are going to alter that trend is wishful thinking.
I agree that solar input residence time is the key factor and we have only two options for that.
Either it is set by downward infra red from ghgs or it is the time taken for surface kinetic energy to become convectively available potential energy (CAPE) within rising air and CAPE to return back to kinetic energy within falling air. Readers here know that I favour the CAPE basis for the greenhouse effect.
The reason for my choice being that oceanic limit on surface temperatures at a given level of solar input. That limit is set by the weight of the atmosphere pressing down on the ocean surface which cannot change on a less than geological timescale.
The consequence of that limit is that there can be no increase in temperature from downward infra red because the overturning of CAPE just speeds up or slows down to neutralise any thermal effect from any factor other than distance from the sun or atmospheric mass.
That leaves us needing another process to explain climate variations.
That looks likely to be cloudiness changes because they mimic the effect of moving the Earth towards or away from the sun.
It has been suggested by others that observed variations on millennial timescales can be adequately explained by variations in global albedo which in Earth’s case is mostly regulated by clouds. On Mars it would be atmospheric dust.
I await the next contribution from Andy setting out his thoughts on the convection aspect.
My proposition is that global cloudiness varies due to top down solar effects altering the configuration of the relative sizes and positions of the Hadley, Ferrel and Polar convective overturning cells in the atmosphere. That configuration affects the length and pattern of jet stream tracks.
The more meridional those tracks the more clouds they generate.
That would them be the amplification factor we need given that changes in TSI emitted by the sun are too small to explain the observed climate variations.
Really good points Stephen.
The main impact of greenhouse gases is to direct the flow of thermal energy. Energy flows out of the tropics where the greenhouse effect is large to places or altitudes where it is weak. Thus, we have thunderstorms to take heat to high altitudes and storms (cyclones, etc.) to take heat to higher latitudes. When the heat reaches a place where it can be expelled to space, it escapes.
The faster that process works, the cooler the Earth is.
‘It is unlikely that climate changes are a direct result of the change in insolation, the solar changes are amplified by Earth’s climate system somehow.’
I would buy that. My impression was that the main solar climate impact was due to changes in the Sun’s magnetic field, as evidenced by good correlation between ice rafting in sea cores and nuclides in ice cores, e.g., Bond et al.
Not quite. The small changes in orbit alter the exposure of global land surface to the sunlight. The accumulated solar anomaly of land since it bottomed in 1537 is 70ZJ – hardly trivial. A small amount of that has contributed to melting land ice but the larger component warming the northern land surface in summer, thereby enabling the oceans to retain more heat, which is being observed. The oceans still give up heat to land in winter as evidenced by the increasing snowfall across the NH.
This trend in increasing sunlight over land will continue for 9,500 years. The land will continue to warm until the permafrost advances south again around 2200.
Orbital mechanics are of great importance. I should have clarified that I was referring to climate changes that take place over a much shorter time span.
Is this 22° a temperature measure, an angular measure, or something else?
No, I’m referring to the 22 deg. C isotherm, the depth where the ocean temp is 22 degrees.
I’ve + voted every comment here.
Because they all demonstrate just how “unsettled” the whole climate science conjecture really is.
I’d double + any comment that said –
“we really don’t know”
Agree
Legacy government-funded climate science stubbornly refuses to acknowledge the full range of influences of space weather on Earth.
Space weather factors that influence Earth’s climate aren’t limited to total solar irradiance: geomagnetic modulation by the solar wind, solar proton streams, solar electromagnetic interaction with Earth’s relativistic electrons, interplanetary magnetic fields, and galactic cosmic rays also play a role.
The influence of these will increase as the magnetosphere continues to weaken, and that will be most noticeable at the weakest points in the magnetosphere – the poles.
Legacy climate science cannot acknowledge these realities because of the political control of its funding streams – and the controllers want climate alarmism.
Those controllers are using money taken from you by force of law to terrify the gullible about weather and climate so they can control entire populations – facts don’t matter to them.
??Should ‘anonymously’ be ‘anomalously’.
This issue about the sun seems at basis to be straightforward: if climate models cannot reproduce past climate without factoring in solar activity then they must not factor it out.
Andy just doesn’t want to know about this stuff. Of course GCMs factor in solar activity. And yes, they can reproduce past climate.
No. GCMs only consider the effect of direct total irradiation changes. They ignore known indirect effects.
And no, GCMs do not correctly reproduce past climate changes.
Figure 77 from my latest book. Models do not reproduce the LIA, nor do they follow northern summer insolation and obliquity changes as they should. They follow CO2 levels which respond to Southern Ocean climate (southern summer insolation) as ocean’s CO2 uptake and release are governed mainly by temperature changes in this ocean. So it is easy to conclude that models respond too much to CO2 changes and too little to insolation changes.
Models in this figure (average of three) are from Liu et al. 2014.
Your second figure shows that the world was, on average, ~1-1.5°C warmer than today (black line) for most of the last 11,000 years. Is that significant?
Regarding the Medieval Warm Period, I do recall reading about Greenland being arable, but this could be due to regional changes owing to ocean circulation patterns in the area at the time. Western Europe, for example, experiences a relatively mild climate despite being located at a high latitude when compared to other places in Eurasia and North America, due to the North Atlantic Drift.
There is a lot of uncertainty in translating what the proxies register into temperature data. Proxies aren’t really measuring temperature but affected by it in complex ways. Different reconstructions give different values on how much warmer was the Holocene Climate Optimum than the Little Ice Age, between 0.5°C and 1.5°C. The proxy (black) curve in my figure ends in 1920 because proxies ending before the reconstruction strongly affect the averaging, producing an artifact. We must be now warmer than the endpoint of the black curve but still cooler than the HCO, because that is what global glaciers, the treeline in altitude, and sea level support.
MWP, LIA, etc back to the Holocene optimum?
Show me?
Yes, thanks. I fixed it.
Should be anomalously.
Figure 3 is unfortunate, because the Modern Solar Maximum is unremarkable in that figure. Beryllium is not the best way to reconstruct past solar activity. Let’s see for example Wu et al. 2018 solar activity reconstruction over the past 9,000 years (Figure 14):
The IPCC agrees with what this reconstruction shows when in AR5 states that solar activity during the 20th century was in the top 10% of the past 9,000 years.
Given the large angle of the Earth’s axis to the plane of the ecliptic (which is slowly decreasing) and the distance of the Earth from the Sun in winter, it will still be thousands of years during which the oceans in the northern hemisphere will absorb and accumulate more solar radiation than in the southern hemisphere. But in time the snowfall, thanks to the warm oceans, will be so strong that another glaciation will begin. Also, low solar activity will cause cooling in winter at mid-latitudes in certain areas of the northern hemisphere due to changes in circulation, caused by changes in the ozone zone. Also, changes in the geomagnetic field in the north will bring climate changes in the northern hemisphere. It seems that the northern hemisphere has already reached a maximum in access to solar energy.
https://earthobservatory.nasa.gov/images/7122/chilly-temperatures-during-the-maunder-minimum
Satellite measurements of top of the atmosphere solar energy since the 1970s are evidence of:
The inaccuracy of sunspot counts as a proxy for TOA solar energy
and
TOA solar energy changes were no ta cause any of the post 1975 warming.
There is no evidence the 11 year sunspot cycles affect the global average temperature
There is evidence of more solar energy reaching Earth’s surface. One cause is declining SO2 emissions.
The effects of changes in cloudiness are unknown because there is no accurate measurement of annual global average cloudiness.
The IPCC was formed to predict dangerous global warming and blame that imagined climate change on humans. That limited the range of possibilities for their reports. That’s what happens when one starts with a conclusion.
The IPCC claim about TOA solar energy is correct and based on data
People like Willie Soon who blame the sun for all climate change are Solar Nutters.
This is a Solar Nutter article
You are a climate ignoramus suffering from Dunning-Kruger effect who insults anybody you disagree with.
“There is no evidence the 11 year sunspot cycles affect the global average temperature”
Of course there is, see here:
Sun-Climate Connections | Oxford Research Encyclopedia of Climate Science
If it’s something that RG believes in, such as whether CO2 is a greenhouse gas, absence of evidence is not relevant.
If it’s something that RG doesn’t believe in, such as impact of sun on climate, absence of evidence is proof of non-existence.
See also Warren White in the bibliography, quote attached.
Summarize the article that Andy wrote in your own words. If you can successfully do that, then perhaps your criticism is meaningful.
The probability of La Niña is low.
With decreasing solar wind energy hitting the Earth (after the peak of solar activity), the jet stream and easterly winds in the equatorial Pacific will weaken. The jet stream current will become more meridional.
http://www.bom.gov.au/archive/oceanography/ocean_anals/IDYOC007/IDYOC007.202403.gif
We’ve had another widespread display of the Aurora Borealis yesterday
https://www.bbc.co.uk/weather/features/68465895
Do the charged particles that cause this phenomenon have any effect on temperature? Although the Aurora are in the visible spectrum, is there any component in either the ultraviolet or infrared ends of the spectrum? What happens to the X rays and gamma rays that don’t get beyond the upper atmosphere?
It’s a long time since I studied physics.
I don’t know if you understood what I am writing about? I’m writing about climate change in certain areas of the Northern Hemisphere, not global temperature. These changes, especially in winter, are related to changes in the distribution of ozone in high latitudes, caused by weakening of the magnetic field.


All good comments and greatly appreciated. I’ve briefly addressed some specific things above, but this is an overall comment to everyone, especially to Rud and Nick. Some additional points will be in my next post on Wednesday.
I know how they work. They are a collection of one-dimensional cells, that only communicate at their edges via thermodynamic principles. This is their weakness. Atmospheric dynamics (mainly storms) drive our climate and the models are very poor at reproducing the dynamics. The oceans are a different story. They mostly work vertically (convection) and models might do a better job there, but not much emphasis is put on ocean dynamics in most of the models.
From Shepherd, 2014, in the biblio.
I would only add that the models do not get global patterns of temperature right either, as AR6 says, they overestimate SST globally and I’ve already shown that they make a mess of the Pacific Ocean.
Comparing AR5 to AR6 – Andy May Petrophysicist
“model TSI”
The models only factor in the power delivered to Earth via TSI (total solar irradiance), which is a huge mistake. One of my points is that frequency matters, and so does ocean penetration. See attached graphic.
Worth repeating here:
The Earth is not a giant uniform thermodynamic object. Dynamic processes drive our weather, not thermodynamics as the models assume. They seem to think that global average temperature is simply a function of how much GHGs slow the exit of thermal energy to space.
This is a one-dimensional look at a 3D process and a vast oversimplification. Greenhouse gases just bounce heat around the atmosphere until it is expelled to space, a very temporary process. “TSI” radiation changes are stored, sometimes for years or decades, in the ocean. The accumulated energy is eventually expelled from the ocean to the atmosphere, sometimes in an El Niño or a hurricane, and then it bounces around until it is expelled to space.
Nick, you say that we cannot measure energy residence time. But if the input from the Sun is assumed to be constant (in net), then T reflects only residence time, right?
Author says:”Dynamic processes drive our weather, not thermodynamics as the models assume.”
What dynamic process overrides thermodynamics? Did you mean weather or climate?
The dynamic elements of our weather are wind, precipitation, clouds, storms, currents, and convection. You could also include ocean oscillations, I suppose. These are the processes that create our weather and our climate.
The climate models cannot model these processes because they all occur below the scale of their grid cells. The concept behind the climate models, and their design, only allow thermodynamic considerations, along with some physical and chemical principles. That is a major flaw, because dynamic processes are critical.
More in parts 4&5.
I am sorry if I misunderstand you but ALL things are subject to thermodynamics. The only thing you mentioned is possibly currents which are probably more due to friction and spin of earth.
Yes, the ‘processes’ are subject to thermodynamics, but keep in mind what Andy said:
‘The climate models cannot model these processes because they all occur below the scale of their grid cells.’
Think of the internal processes and the grid cells as mathematical functions, f(x) and g(x), all of which are approximations. The modelers would have you believe that f(g(x)) is always equal to g(f(x)), which is definitely not true.
“T reflects only residence time, right?”
Given a volume, and flux in and out, you can infer a residence time by dividing heat content by flux. But to get the heat content, you have to know T. This calculation doesn’t help you find it.
“I know how they work. They are a collection of one-dimensional cells, that only communicate at their edges via thermodynamic principles. This is their weakness.”
That isn’t promising. The cells are three dimensional.
Nick, you appear to have misunderstood the point Andy is making.
Residence time is a discussion about the efficacy of a forcing not an attempt to put a number on climate sensitivity.
There are 21 distinct climate zones with energy residence time constantly changing within and between those zones. The changing efficacy depends on changing residence time for the various forcings in a chaotic and complex climate.
It is clear that solar energy residence time is significantly longer than energy reemitted by the GHGs.
It is also clear that the models do not have the resolution to capture this.
I’ll repeat my earlier but late comment here.
Model resolution is clearly the problem here.
It is clear that the latest models treat all energy that is absorbed in the first 10m grid of the ocean in the same way. In fact the “Technical Guide to MOM 4.0, GFDL Ocean Group Technical Report 5, 2008) divides solar penetration into the water column into three exponentials. Quote from MOM Guide 8.3.2;
“The first exponential is for wavelengths >750nm (i.e., IIR) and assumes a single attenuation of 0.267 meter…”
The models treat the long wave GHG energy the same way that they treat the long wave solar component, by simply including it in the first, nominally 10 meter, grid by assuming an attenuation of 0.267 meter. They simply do not distinguish or account for the fact that long wave GHG energy centred at 15 microns is almost totally absorbed in the evaporation layer and is proportionately returned to the atmosphere almost immediately by evaporation when compared to solar energy. To treat this accurately the models would need the first ocean grid to be 0.2mm thick. This is something they simply don’t do for reasons of complexity.
Nick, can you give me a reference that indicates models differentiate between GHG ocean penetration that is overwhelmingly absorbed in the evaporation layer and solar ocean penetration that generally is not.
If you believe this large difference in efficacy between solar and GHG energy makes little difference to the climate then you would need to overturn a large body of evidence. Forcing efficacy is central to any understanding of sensitivity.
Bob,
“Nick, can you give me a reference that indicates models differentiate between GHG ocean penetration”
No. Can you give a properly worked out reason why they should.
You speak of a difference in efficacy. There is none. GCMs do what every heat transfer program does – it balances fluxes at the surface. Watts coming in have to match watts going out. Watts going out depend on the temperature, which has to adjust to make them equal. This is like the role of price in matching supply to demand in a market.
Sunlight has, say, 160W coming in. It doesn’t matter whether it penetrated microns or mm. It all ends up as influx to the surface layer. Down IR is also, watt for watt, flux to the surface layer. The add, and the upflux has to balance. The temperature adjusts so it does.
On residence time, as I said elsewhere, the basic problem is that you can’t label heat, so the term is meaningless. To illustrate, think of a parcel of air high in the atmosphere. It has GHGs which absorb IR. They pass on almost all of that to other molecules (mostly not GHG) by collision. At that stage you have lost the history. It is just heat in the air.
But suppose steady state. The air loses heat as fast as it came. It does so by other GHG randomly getting excited and emitting photons. The temperature T settles at a value so that process matches absorption of IR. But there is no chance of tracking the heat, so what was the residence time?
Nick,
Forcing efficacy or Effective Radiative Forcing is a well understood concept.
We all understand that energy in must “eventually” equal energy out otherwise there would be big issues.
We are talking here about the time taken to equilibrium and this is proportional to efficacy or residence time.
Equilibrium is still eventually reached at the Top of the Atmosphere (TOA) but this equilibrium takes a little longer. Hansen (2011) “..show analytically, with ocean mixing approximated as a diffusive process, that the response time (TOA) increases as the square of climate sensitivity.”
Forster (2006) also describe this well.
“Imagine, for example, that the atmosphere alone (perhaps through some cloud change unrelated to any surface temperature response) quickly responds to a large Radiative Forcing to restore the flux imbalance at the TOA (Top Of Atmosphere), yielding a small effective climate forcing. In this case the ocean would never get a chance to respond to the initial Radiative Forcing, so the resulting climate response would be small, and this would be consistent with our diagnosed “Effective Climate Forcing” rather than the conventional “Radiative Forcing.”
The point being made, and obviously not getting through to you, is that the models don’t pick up or allow for the fact that a GHG forcing change is quickly restored at the TOA while solar energy penetrates deep into the oceans and remains there for a very long time. The TOA will take a lot longer to return to equilibrium for a similar change in solar forcing and that solar change will for that reason have a larger climate response.
The AR4 discusses efficacy in detail and finds that a forcing that acts high in the atmosphere has lower efficacy. Its energy is returned to space quickly.
It also finds that a forcing that acts at the poles generally has a higher efficacy as it slows energy transport from the tropics to the poles. In other words, residence time is increased.
You’re the only scientist I have ever come across who thinks that time taken to equilibrium has no effect on system energy content at any given time.
Bob,
You were talking about how the model should treat penetration of sunlight in the ocean. ERF is on a totally different level. It can be hard to convince people here, but the fact is that models make no use of forcings as inputs at all. They can’t, because their computation is local, and forcings are described as global averages. Instead, forcings are deduced from model results. That is where the notion of ERF comes in. It is how much calculated warming results from a gas concentration, say.
Insolation is a little bit different, because it is directly adding heat according to its measured value. But the others don’t. ERF is just a refined way of translating a GHG concentration, say, into calculated warming. It doesn’t in itself imply a radiation that you can observe.
Nick,
AR4 describes efficacy in terms of residence time.
Forster describes ERF in terms of residence time.
Hanson describes sensitivity as a function of TOA response time which is directly related to residence time.
I’m astounded that you can’t see that solar energy that remains in the system sometimes for hundreds of years will not have a higher efficacy, ERF and residence time than energy reemitted by GHGs that only stays in the system for a relatively short time on average.
I can’t see how I can explain this any more clearly.
Your quote,
“They can’t, because their computation is local, and forcings are described as global averages. Instead, forcings are deduced from model results. That is where the notion of ERF comes in.”
In a strange way I agree with this quote. The primary forcing is calculated from the SB equations. The ERF is then deduced from the model results as you say.
The trouble is the models do not allow for the different ocean penetration of solar and GHG forcing. The model resolution is simply too large. If they did the huge difference in ERF between solar and GHG forcing would be apparent.
You were unable to supply me with a quote that indicates that the models do take account of this difference in ocean penetration between these two forcings.
‘Instead, forcings are deduced from model results.’
Ok, so presumably, then, so can the Earth’s responses to those forcings.
According to the IPCC, the GCMs projection for SSP3-7.0 (ref. AR6, Figure spm.4) is that a total radiative forcing of 7.0 W/m^2, including all GHGs, aerosols and land use changes, will result in an additional 20.0 W/m^2 of IR being emitted by the surface.
Perhaps you could point out how the models say this happens by, say, completing the following table:
Planetary Energy Budget in W/m^2:
SW_incoming_TOA… [340] / [340]
SW_absorbed_ATM… [80] / [ ]
SW_absorbed_SURF… [160] / [ ]
SW_reflected_ATM… [75] / [ ]
SW_reflected_SURF… [25] / [ ]
LW_emitted_SURF… [398] / [418]
LW_absorbed_SURF… [342] / [ ]
LW_emitted_TOA… [239] / [ ]
EVAP_from_SURF… [82] / [ ]
SENS_from_SURF… [21] / [ ]
IMBAL… [0.7] / [0.0]
It takes real “faith” to claim that current CO2 levels have a significant impact on global temperature. The amount of CO2 over large metropolitan areas in winter indicates an inverse relationship. The colder it gets, the more CO2.
https://earth.nullschool.net/#2024/01/01/0730Z/chem/surface/level/overlay=co2sc/equirectangular
Of course at winter temps, furnaces come on more often and emit more CO2. Are you suggesting that because the local CO2 goes up, the local temp should increase ? Maybe it does…say 1/1000th of the natural temp change that caused the furnaces to fire more often….
Warmer oceans absorb more CO2 than colder ones. When the ocean temperature drops to about 0 C, the growing season for marine algae ends.
https://earth.nullschool.net/#2023/09/01/0630Z/chem/surface/level/overlay=co2sc/equirectangular
Moreover, thanks to algae, there is a constant level of oxygen in the atmosphere, which they produce using CO2.
Cyanobacteria remained the principal primary producers of oxygen throughout the Proterozoic Eon (2500–543 Ma), in part because the redox structure of the oceans favored photoautotrophs capable of nitrogen fixation.[citation needed] Green algae joined cyanobacteria as the major primary producers of oxygen on continental shelves near the end of the Proterozoic, but only with the Mesozoic (251–66 Ma) radiations of dinoflagellates, coccolithophorids, and diatoms did the primary production of oxygen in marine shelf waters take modern form. Cyanobacteria remain critical to marine ecosystems as primary producers of oxygen in oceanic gyres, as agents of biological nitrogen fixation, and, in modified form, as the plastids of marine algae.[82]
https://en.wikipedia.org/wiki/Photosynthesis
A carbon dioxide concentration in the air of about 0.036% is much lower than optimal for photosynthesis under favorable light conditions and adequate temperature. Under optimal conditions, the rate of photosynthesis increases up to a CO2 concentration of about 0.1%. At extremely low CO2 concentrations, respiration and photorespiration processes produce more CO2 than is assimilated in photosynthesis.

Autorstwa Jiří Janoušek translated by Pisum – ŠEBÁNEK, J., et al Fyziologie rostlin. 1. vyd. Praha: Státní zemědělské nakladatelství, 1983. S. 165.Created by Gimp, CC BY-SA 3.0, https://commons.wikimedia.org/w/index.php?curid=9087789
“In part 2 we discussed the IPCC hypothesis of climate change that assumes humans and our greenhouse gas emissions and land use choices are the climate change “control knob.”
It’s more than a hypothesis. IPCC’s role which was periodically reapproved defines its marching orders to look into “human-induced climate change”. It’s essentially a lobbyist that is supported by governments who also have a heavy hand in writing the ARs Summary for Policymakers. Claims that the IPCC is unbiased are dubious at best.
Good article. I noted the following “As well-explained by Bob Irvine,[3] there are only two things that contribute to the thermal energy content of a planet, the amount of incoming energy and the energy residence time within the system.”
That’s true, but it is worth noting that “amount of incoming energy” is not just solar output.
The average albedo (reflection of sunlight) has to be included in calculating incoming energy. Clouds, especially tropical clouds, are probably an important element of the average albedo. Yet, the only discussion of albedo that I have noticed is about the ice caps. Yes, their albedo matters, but they receive only a small fraction of solar output, so their efficiency of reflection will have correspondingly very small effect on global averages for incoming energy.
Here is a suggestion for NASA. Consider placing an Earth-observation satellite at Lagrange point L1. A satellite at this position could both monitor the solar output and the Earth’s albedo as seen from the Sun. After a decade or so, we would know if the albedo changes. IF, as I suspect, the albedo increases slightly with increasing CO2 (due to increasing clouds on average) the satellite data will reveal that. And if the albedo stays exactly the same it will be a useful constraint on better climate models.
Good point about the clouds.
“Here is a suggestion for NASA.”
Of course there are such satellites. Here is GOES-18, operated by NOAA (but put there by NASA).
No. No such satellite as I described. Goes-18 is not positioned at L1, and is not able to provide continuous monitoring of solar output and Earth albedo as seen from the direction of the Sun.
As the upper tropical troposphere is -17 deg C and the surface is 15 deg C, 33 degrees warmer, no gas of any kind can emit IR radiation that can warm the surface, it’s that simple. All IR would be reflected upward—straight-forward thermodynamics.
So, stop pretending that GHGs have anything to do with climate. Zero. Nada. Zilch.
There is no downwelling CO2 IR flux at all. DWIR is a local feature. IR is reabsorbed very quickly in the atmosphere. Any downward directed IR only travels a few meters before reabsorption.
Since the density of the atmosphere increases as we head downward, any IR directed towards the surface is reabsorbed quicker than energy directed upward. Hence, the average direction of all emissions is upward. This is why the atmosphere cools.
The temperature difference simply increases this factor by reducing the emissivity as you rise in the atmosphere.
The only meaningful quantity of IR absorbed by the surface comes from within the atmospheric boundary layer (same temperature as surface) at an altitude of less than 10 meters. This energy can increase evaporation at the surface.
GHGs like CO2 situated low in the atmosphere can also intercept more surface radiated IR energy as they increase due to widening of the absorption window. This energy balances out the energy lost due to evaporation.