News Brief by Kip Hansen — 2 March 2024
Several times I have had readers at WUWT ask in comments: “If the climate is changing, why haven’t the planting zone maps changed?”
Well, they have and they do. The U.S. Department of Agriculture issues a new U.S.D.A. “Plant Hardiness Zone Map” periodically. A new version of the map was just released on Nov. 15, 2023. I became aware of it because my wife is an avid gardener and follows our local agricultural County Cooperative Extension news.
When she followed the link to the new Plant Hardiness map and checked our very local area, she was surprised to see that it had “warmed” here by 5°F. Here is the bit of the page she was looking at:

She was a bit perplexed by this news, as we have been having not “hot” years but cooler years recently. It took me a minute to sort through it to see that the drop down was not clear on what temperature change they were talking about. That temperature change elevated us one half a zone from zone 5b to zone 6a.
This is what the hardiness map is meant to show, according to the U.S.D.A. [USDA hereafter]:
“USDA’s Plant Hardiness Zone Map is the standard by which gardeners and growers can determine which plants are most likely to thrive at a location.”
“The 2023 map is based on 30-year averages of the lowest annual winter temperatures at specific locations, is divided into 10-degree Fahrenheit zones and further divided into 5-degree Fahrenheit half-zones.”
“The 2023 map incorporates data from 13,412 weather stations compared to the 7,983 that were used for the 2012 map.”
The confusion about “Temperature Change 2012-2023” was that it is not the Global Warming type of change – average surface temperature change – but rather “30-year averages of the lowest annual winter temperatures”. Those of you who follow the odd science of averaging temperatures will see that this type of average gives a common-sense view of the most likely absolutely lowest temperature in a year expected for an area based on a 30-year climatic-period average. What hardiness zones don’t give is the lowest possible temperature.
Why do they track this particular metric?
“Plant hardiness zone designations represent what’s known as the ‘average annual extreme minimum temperature’ at a given location during a particular time period (30 years, in this instance). Put another way, the designations do not reflect the coldest it has ever been or ever will be at a specific location, but simply the average lowest winter temperature for the location over a specified time. Low temperature during the winter is a crucial factor in the survival of plants at specific locations.”
For instance, when we plant gladiolus bulbs [aka “glads”] the usual practice recommended is “In temperate zones, the corms [bulbs] of most species and hybrids should be lifted in autumn and stored over winter in a frost-free place, then replanted in spring.“ But, in our experience, when we have a mild winter, glads that we missed when lifting (digging up) in the Fall, come up in the Spring just fine. We find that aggravating, as it is a lot of work to dig them up if we could have left them in the ground. But…if one fails to lift the bulbs, and we get a hard winter, of which we have had many over the last 30 years, the majority of the glads will be frozen and lost. Now, we find that our “average lowest annual winter temperature” is -10°F to -5°F. In that range, it is possible, maybe with a lot extra care, not to dig them up. But….if we get that winter with -20°F or -10°F for a week running, we’d lose all of the glads still in the ground.
Enter the Hardiness Zone map. For our area, we are on the cusp of being able to leave glads in the ground and needing to dig them up. In the little bit of map above, we see that the green area spreading north along the Hudson River Valley from New York City. The low altitude and the warmer water of the river (comparatively warmer) keep the valley a bit warmer, as for lowest temperatures, than in the rising hills to the west and east.
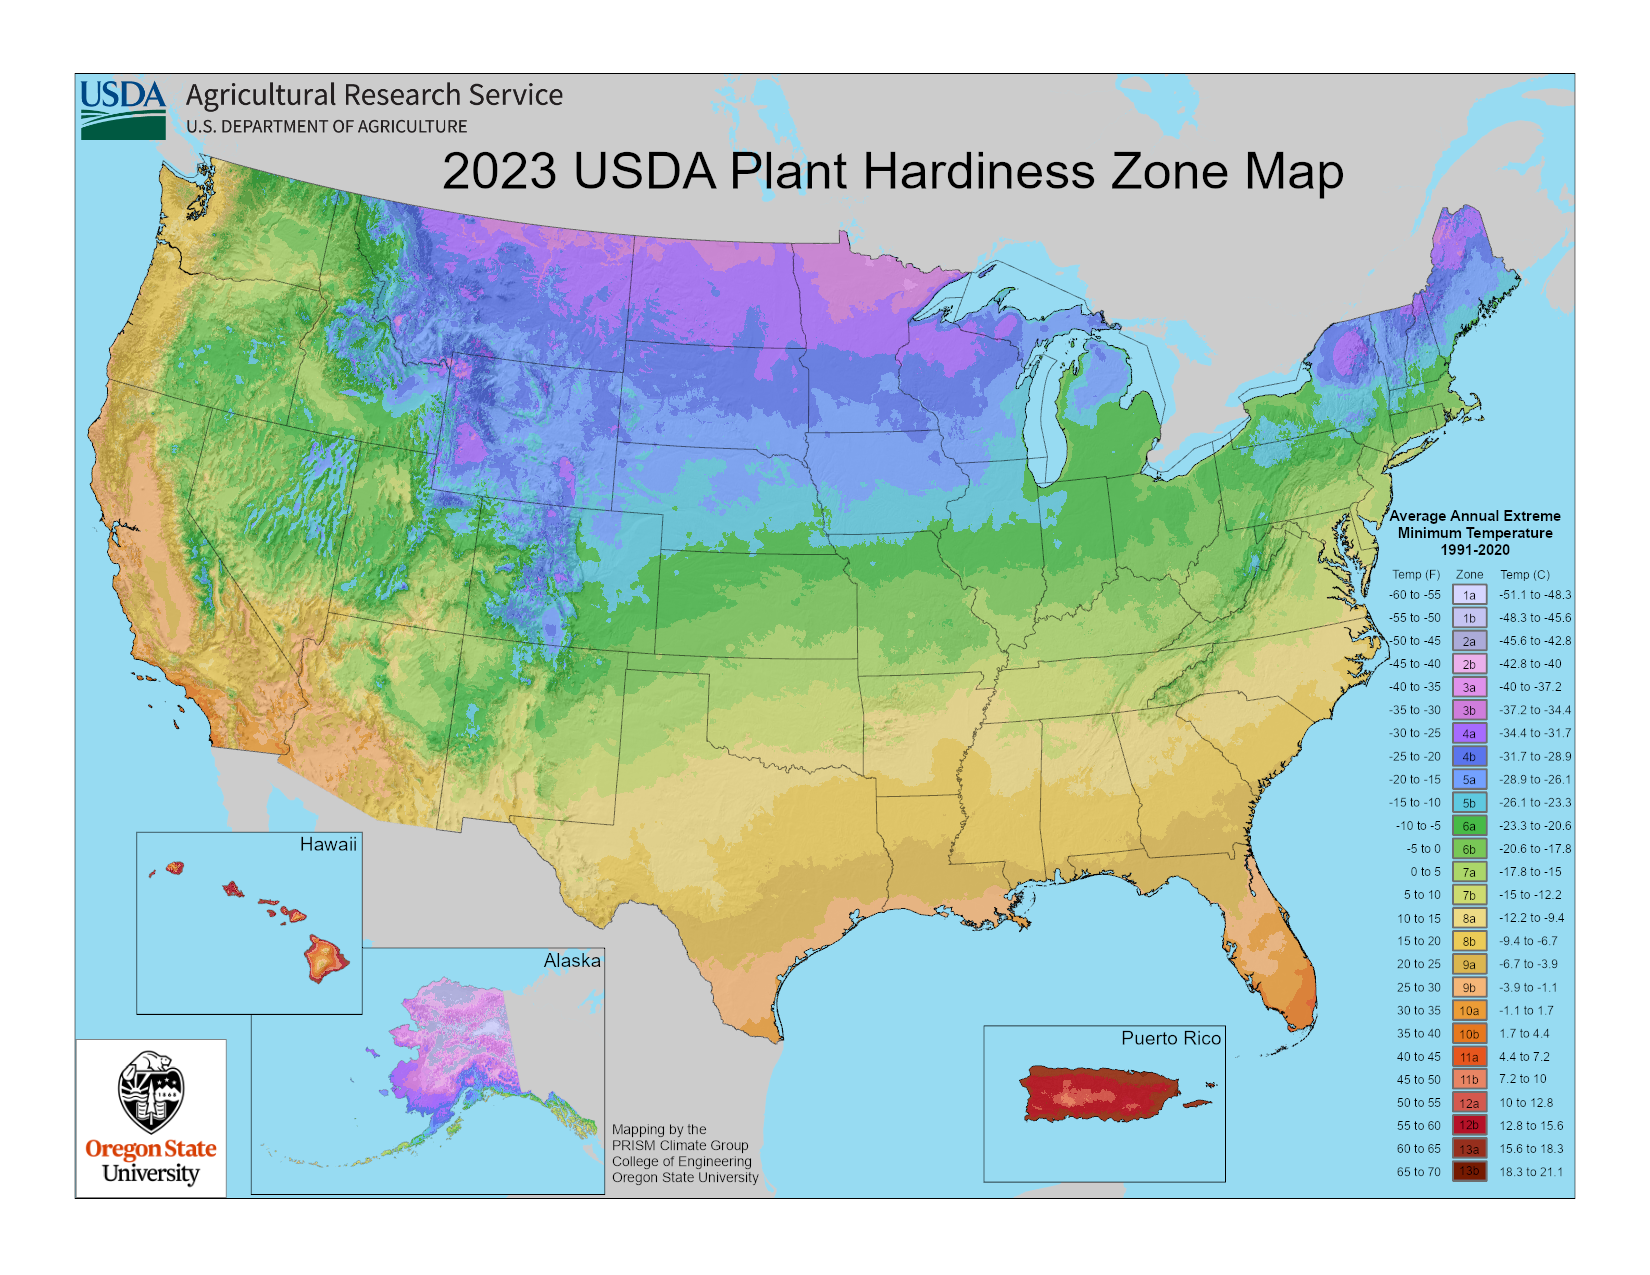
Here is the whole U.S.A.:

If your area is obscured by the drop down in the middle, or you just want to see a larger version – use this link. At the USDA site, you can put in your zip code and the little drop-down report shown. You can see by the index along the right that to be totally safe from frost, temperatures below freezing, you must be in zones 10 or above.
The Arbor Day Foundation has its own versions of Hardiness Maps and interesting comparisons over the last 30 years. Why Arbor Day? “Fruit Trees for Cold Hardiness Zone 4 (Average Minimum Temperature of -30° F/-35° C) — These Apple, Cherry, Peach, Plum, Apricot, Nectarine, Pear, Asian Pear, Almond, and Walnut trees can be expected to grow and thrive in climates rated as being within USDA Cold Hardiness Zone 4. These cold hardy and resilient fruit trees are known to withstand temperatures down to -30°F / -35°C! “ [source] Also see “Orchard Frost – Critical Temperatures for Various Fruits” for common spring temperatures that can ruin orchard crops in my area.
What does all this mean? If one is going to plant expensive garden or landscaping plants, stick to the USDA Hardiness map and give yourself an extra half zone. For me, that would be sticking with my old zone 5b instead of hoping my 6a plants will survive. If I were planting a commercial orchard or nursery, I would fall back of lowest recorded temperatures for the last century or so – averages be hanged.
Personal note: My family has lived in this area for 30 years (albeit, my wife and I flitted off to the Caribbean for a decade and a bit). We have had winters with nary a flake of snow and we have had a winter that remained between -20°F and -10°F, day and night, for a week. Decimated the gardens.
As the planet has slowly come up out of the Little Ice Age, growing conditions in many places have improved with earlier frost-free dates in the Springs and later first-killing-frost dates in the Falls which add up to longer growing seasons. In some areas, this is allowing two dependable crops in the same calendar year. Hardiness Zones reflect this gentle beneficial warming.
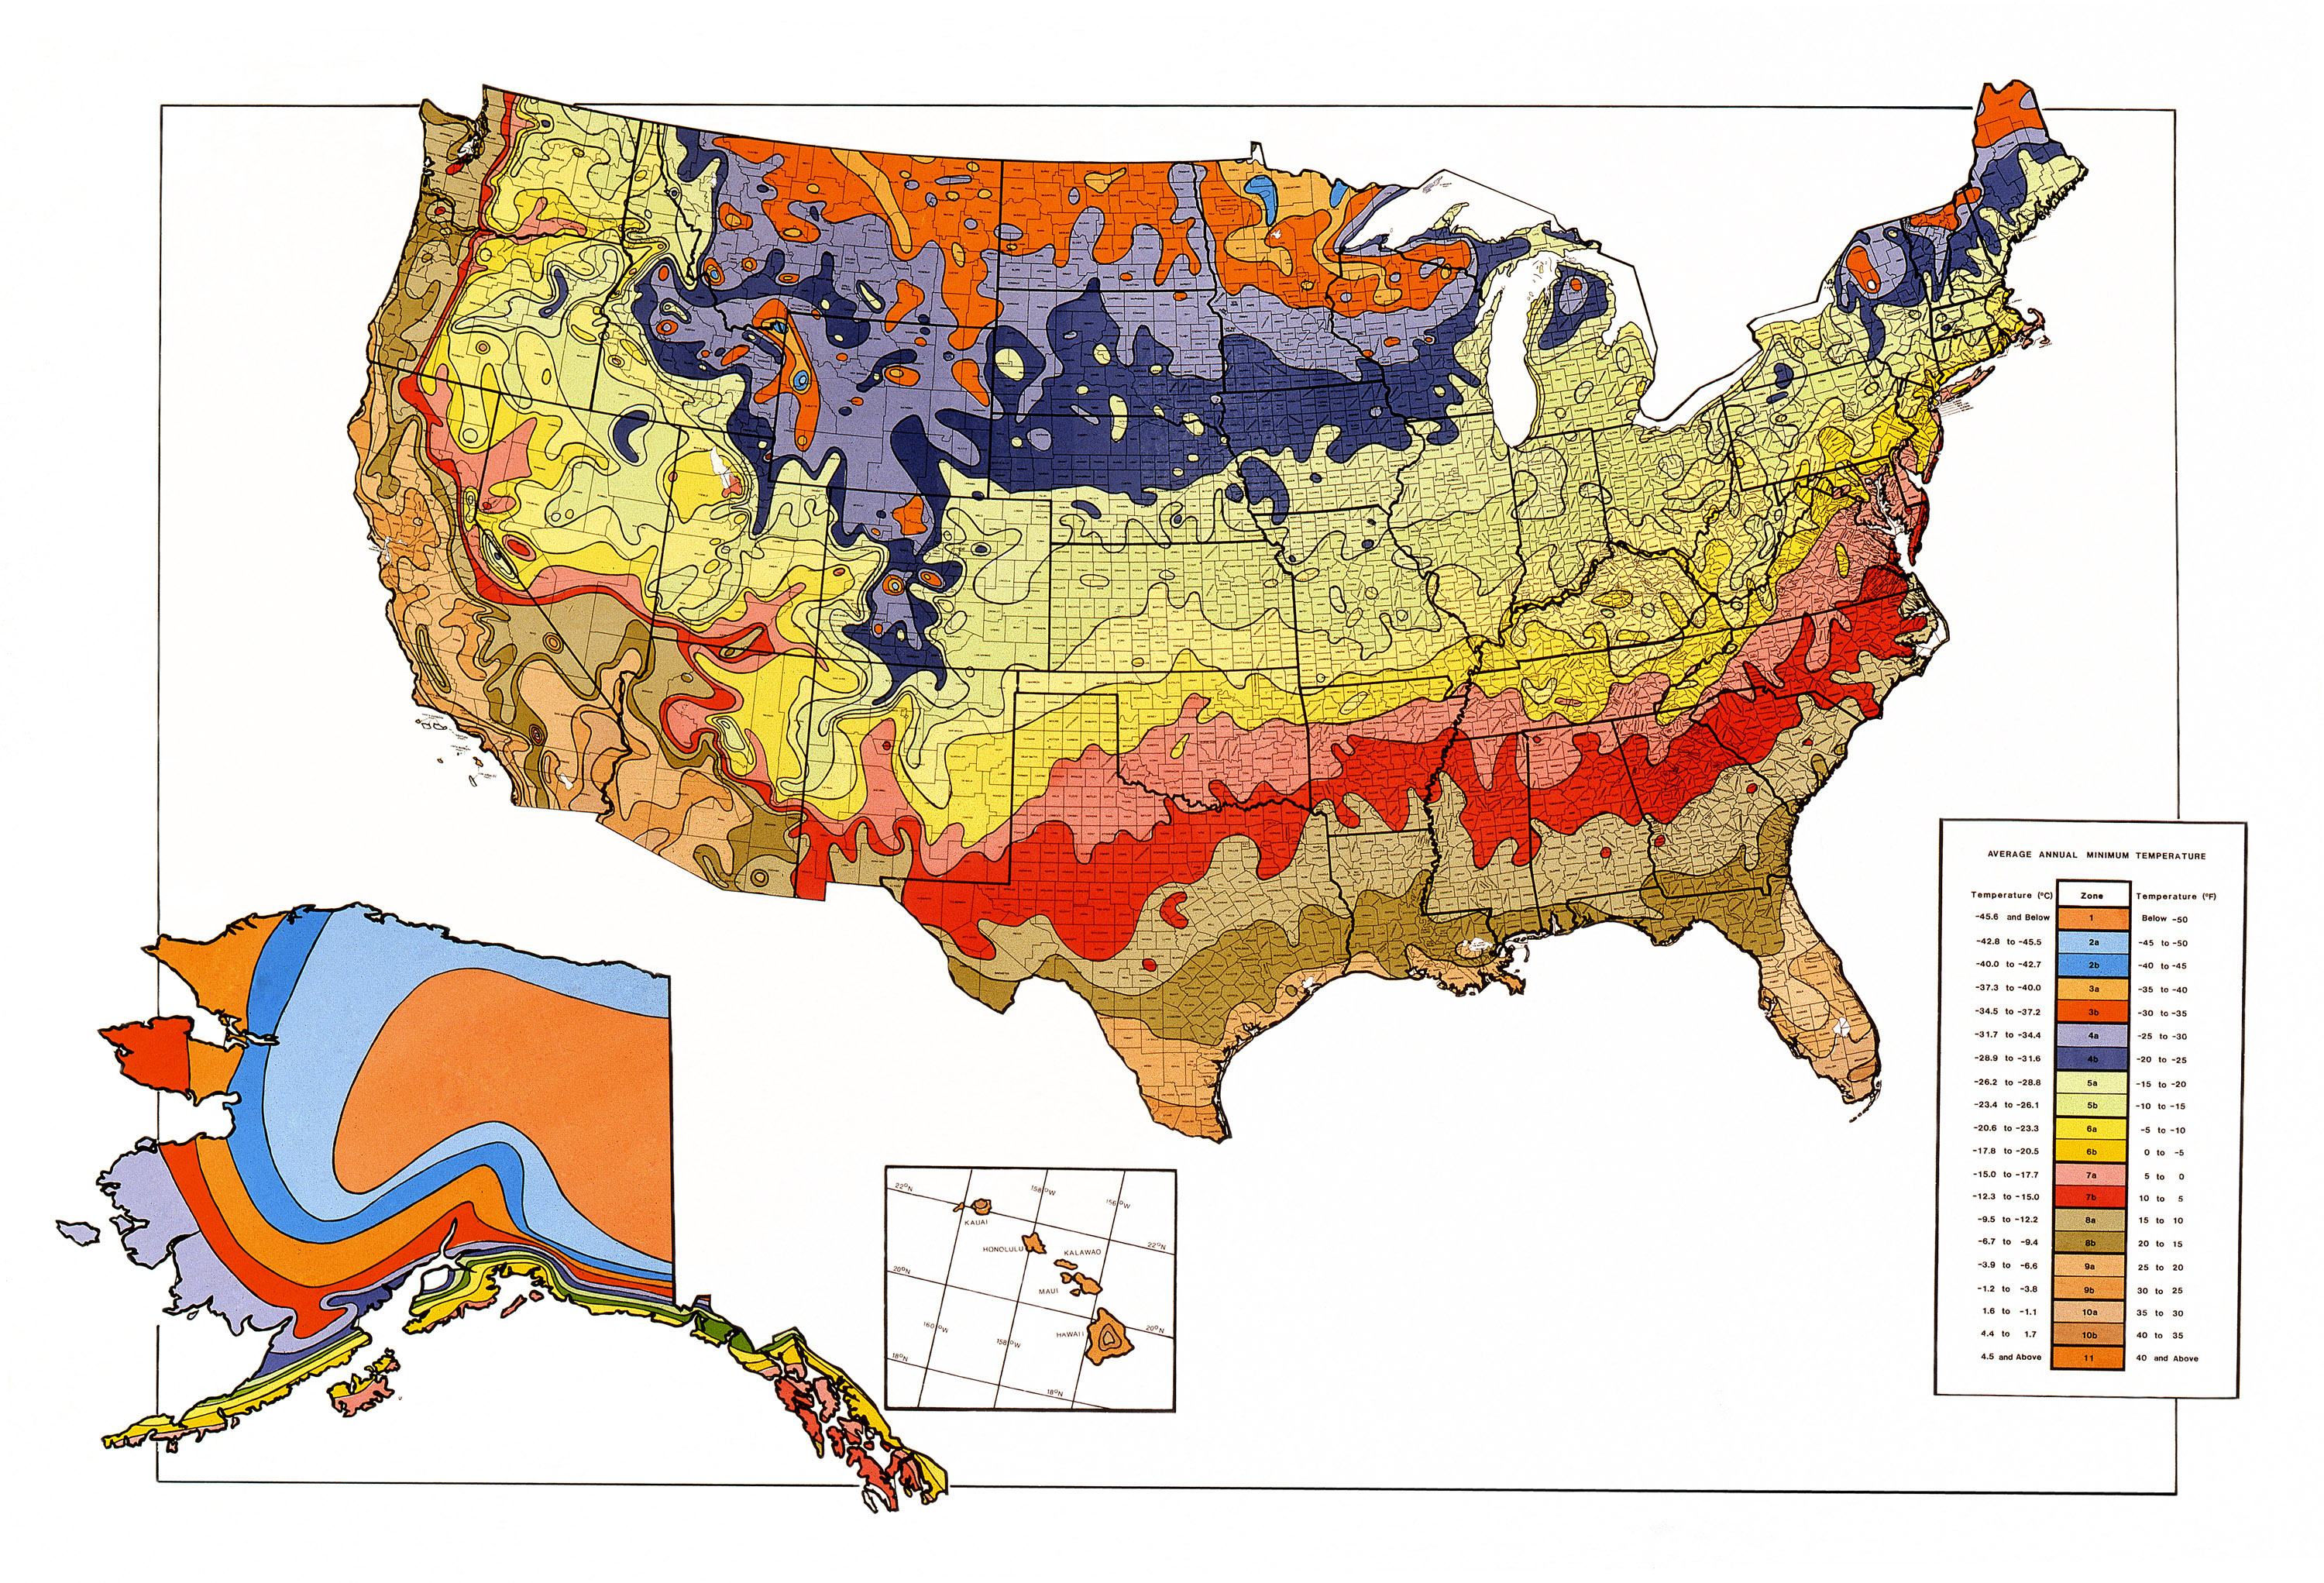
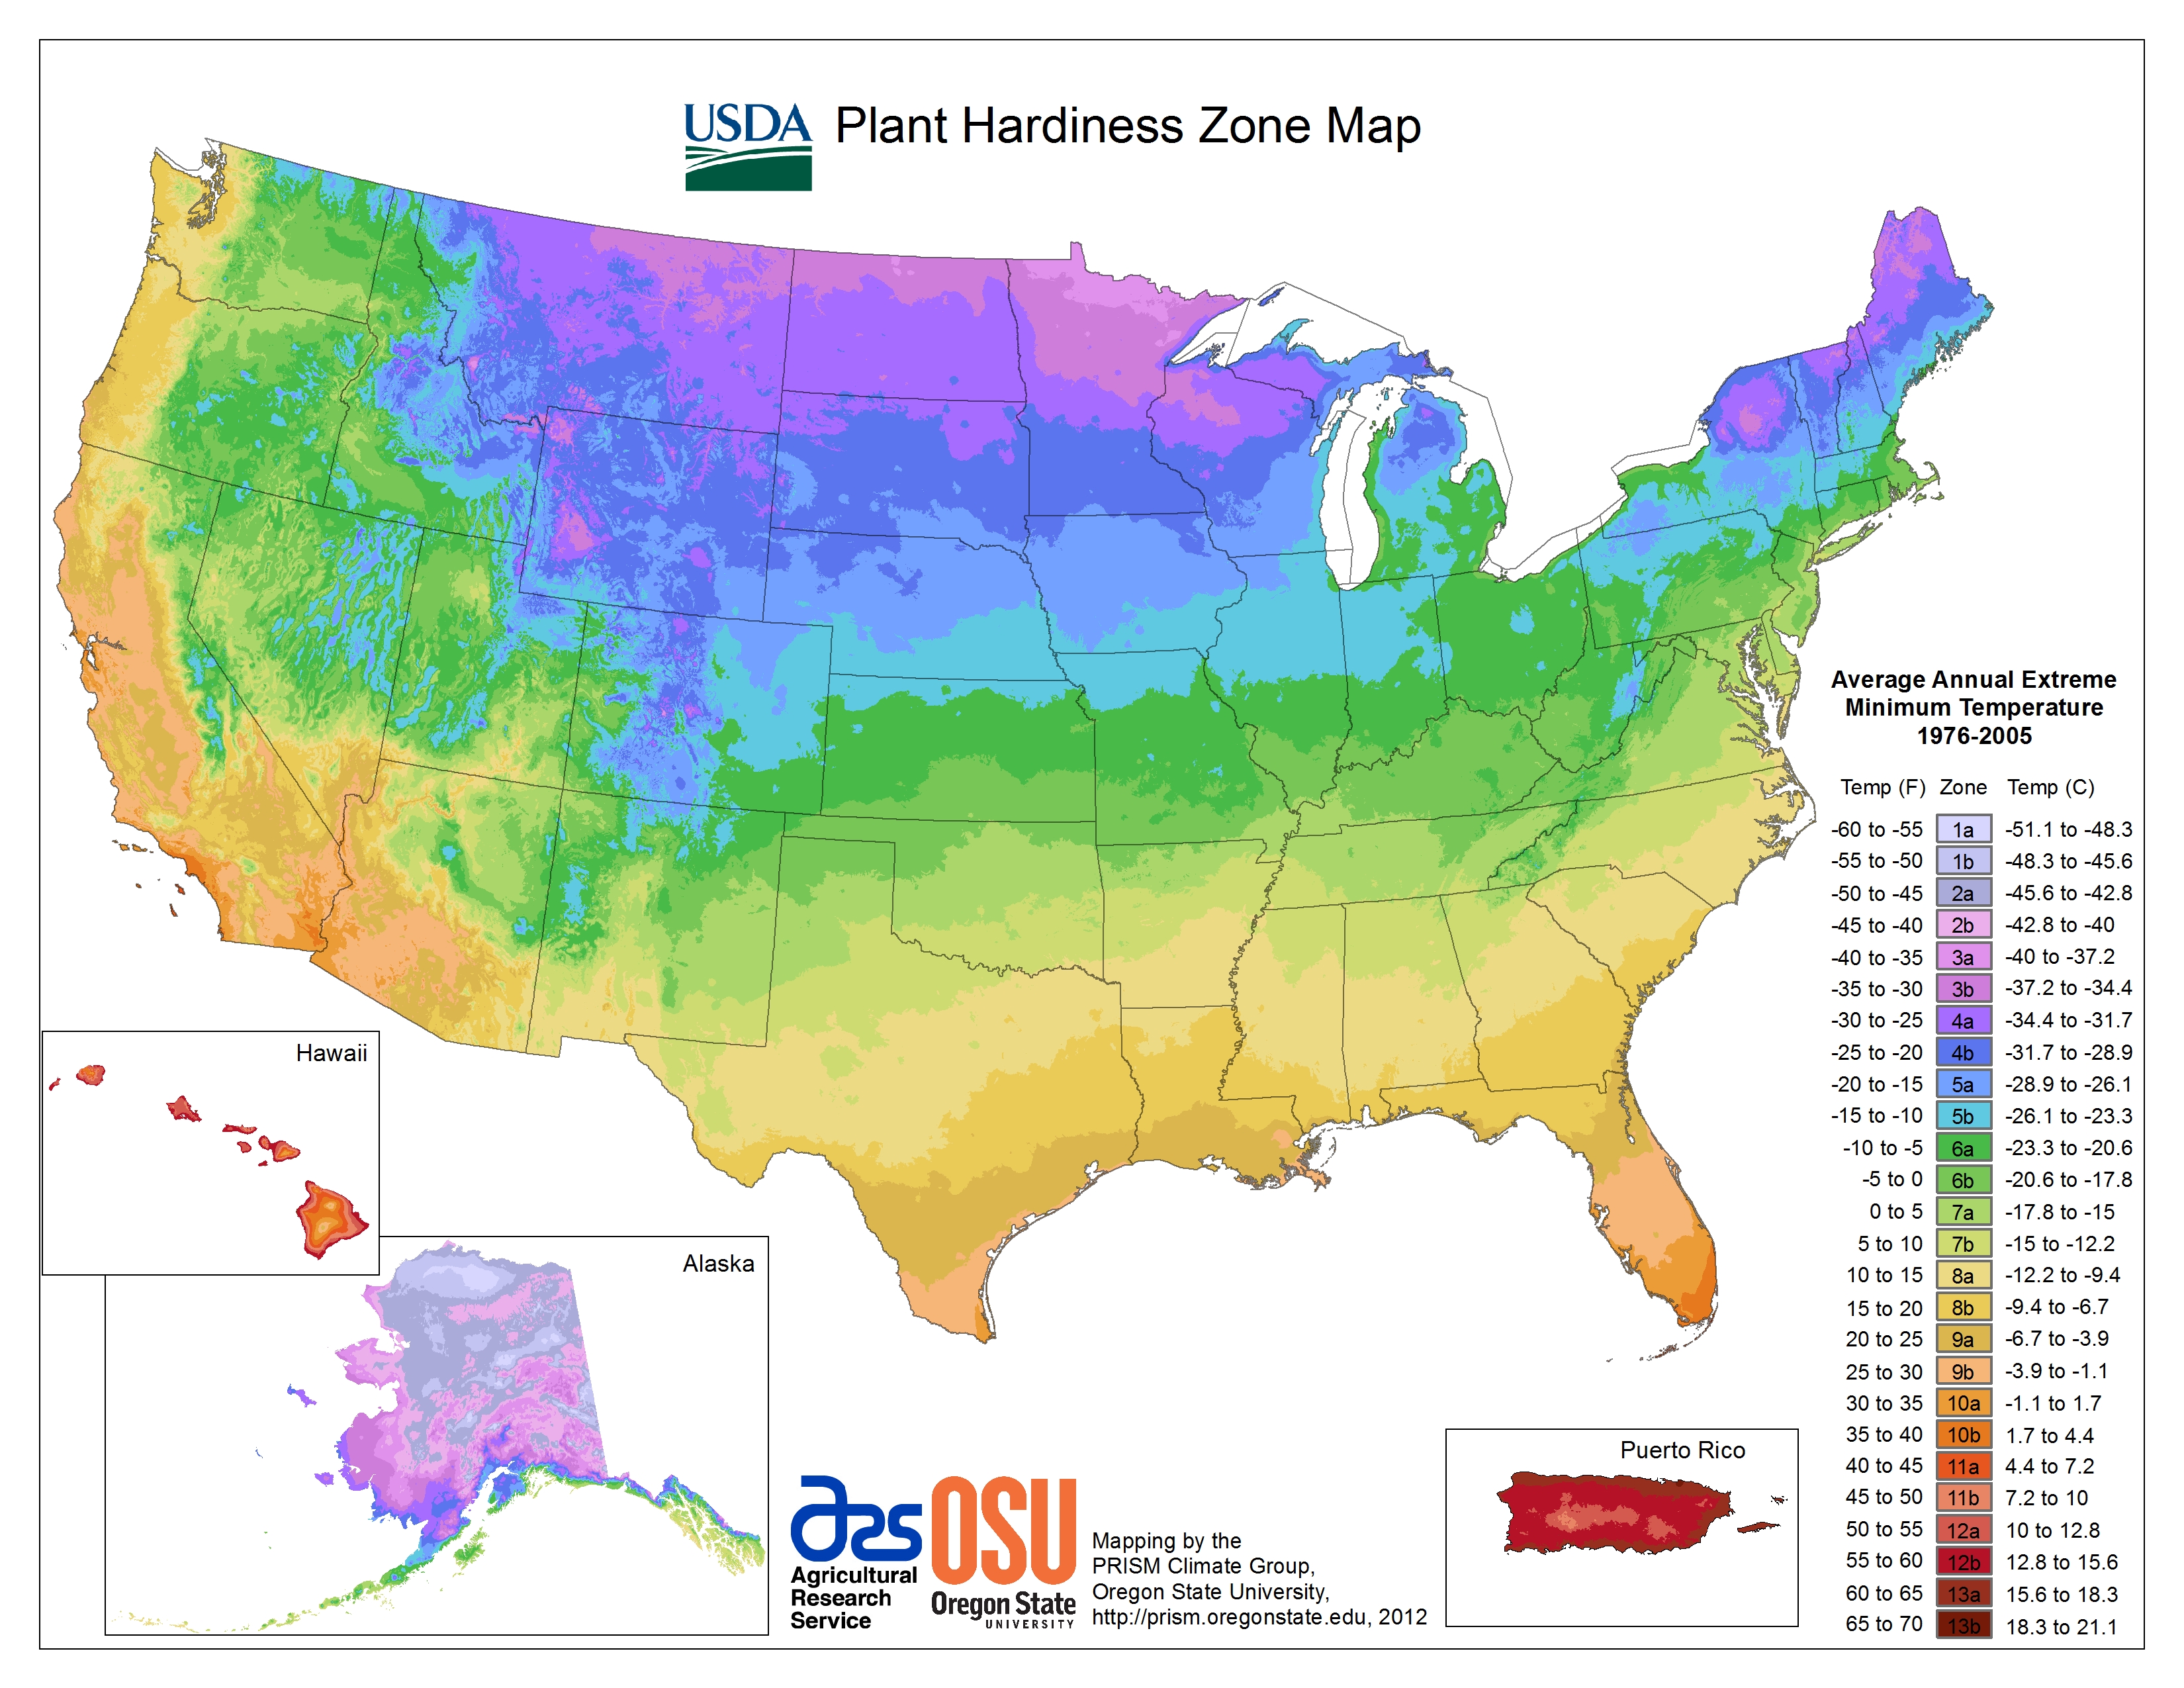
It is important to note that the USDA Hardiness Zones are now based on a great deal more data and are developed at a finer scale than previously. Here I show the 1990, 2012, and 2023 maps, side by side.

links to the maps are: 1990, 2012, 2023.
It is easy to see how coarse the map was for Alaska in the 1990 version. The differences between 2012and 2023 are very hard to see, but they are there. If you are in the United States, use this link and enter your zip code.
Bottom Lines:
1. USDA Hardiness Zones are based on “30-year averages of the lowest annual winter temperatures” – periodically, those values are re-examined and hardiness zones adjusted.
2. The changes in the Hardiness Zones represent only changes in that average.
3. The lengthening of growing seasons are a net positive for the slow gentle warming as the planet comes up out of the Little Ice Age.
# # # # #
Author’s Comment:
Not only are the U.S. Hardiness Zones changing but so are the Koopen Climate Zones – but only in modeled futures. I’ll write about that effort.
Köppen Climate Zones must be based on observations – there are no observations of the future.
Thanks for reading.
# # # # #
It’s not just the coldest winter temperature.
It’s freeze-thaw cycles where in the warm winter we are having in the US Great Lakes region that is claimed to be the “new warmer climate normal”, we could still get hit with a serious freeze this season.
A master gardner where I live is quoted as saying, “You can plant a Zone 5 tree and have it going for a few seasons until it gets hit with (a freeze-thaw cycle).”
paulmilenkovic ==> Yes, plants respond to a lot of different aspects of cold, freezing, thawing etc. It is the Hardiness Zones that are determined solely on average lowest temperature.
Agriculture is not easy.
When I lived in Seattle I had a conversation with a landscape gardener who had client having problems with a (leafless at purchase) sapling which wouldn’t grow, despite the mild climate.
He eventually visited her to diagnose the problem. It turned out that trees don’t like being planted upside down either. 🙂
LOL!
“Agriculture is not easy.”
Well, as they say, you can lead a horse to water, but you can’t lead a horticulture.
(Very educational and informative post, by the way. I didn’t know any of this, and the resources you cited will be most useful both in the near term, and when my wife and I retire to our farm in Tennessee.)
As far as I know, the hardiness zones are getting wider and moving poleward in other words more arable land which is #3 on my list:
1. More rain is not a problem.
2. Warmer weather is not a problem.
3. More arable land is not a problem.
4. Longer growing seasons is not a problem.
5. CO2 greening of the earth is not a problem.
6. There isn’t any Climate Crisis.
Steve ==> That said, a lot of people don’t like change of any kind.
Yes, they still say they will vote for Trudeau despite boundless evidence of failure, corruption, all around bad, worst PM in our history
There is a climate crisis in progress
It’s called Nut Zero
Nut Zero is:
Not feasible
Not affordable
Not possible by 2050
Will not stop rising CO2 levels
— Seven billion people live in nations that could not care less about CO2 emissions
Nut Zero and its EVs will lose popularity as people learn more about the plan and the EVs.
Nut Zero is an enormous project
But there are no detailed plans
There is only a long winded vision statement and an arbitrary completion date
Add this up in your mind
(1) Nut Zero is not needed because warming and more CO2 are both good news. See (1) through (5) in the prior Steve Case post
(2) Nut Zero has almost no chance of success.
So why continue wasting money on Nut Zero?
The answer is something I thought of several years ago:
Nut Zero was never intended to succeed as an engineering project. Nut Zero is a political strategy to increase government power and control
Nut Zero is more valuable to leftists if it fails
In a few years or less it will be apparent that Nut Zero is not going according to plan (because there never was a plan — Real engineering projects require detailed plans and funding)
What happens when it becomes obvious Nut Zero is failing?
Common sense would say you give up — the goal was never feasible
I believe leftists will spin Nut Zero way behind schedule as a new crisis.
We will then have two crises:
-The imaginary coming CAGW crisis plus the Nut Zero way behind schedule “crisis”.
The only passible way to force Nut Zero on the general population will be with fascism.
Fascism is when elections are fixed and opponents are ridiculed, demonized, sued or imprisoned.
Can’t happen in the good old USA?
WRONG.
We are already moving toward fascism.
Starting with the crooked 2020 election, January 6 political prisoners who dared to protest that election fraud and the lawfare attack on former President Donald Trump.
Exactly! Global warming has many benefits.
Don’t tell anyone though; that would wreck the narrative.
The 30 year basis was a serious mistake. Climate cycles in a roughly 65-70 year cycle. A 30 year ‘section’ of a 70 year ‘cycle’ will lead to serious errors. It is a basic sinewave, 70 years long. Any given 30 year ‘trend’ could be either one in which temperatures are rising, falling, or remaining generally unchanged, depending on which part of the cycle the 30 years were taken from.
We all know of the ‘1930’s, where heat records still stand. Then we know of the 1970’s where the coming ice age made newspaper headlines, and cold records still stand. Now, we are coming to a new negative end of a cycle, where cold will again dominate.
It is like a roller coaster, where the media only reports on the times in which the ride is rising. Well, I have news for you…at some point you will HAVE to report on the down trend. It is much more exciting.
70 years would be better than 30 but my vote for climate is weather averaged over 1,000 years (see Bray and Eddy solar cycles graph, John Shewchuk, 2023)
30 years is an arbitrary number, like +1.5C. I read somewhere that it was (officially) chosen because “we now have about 30 years of decent weather records against which to compare”. There could be unacknowledged reasons such as ‘there are cycles of 60 to 70 years and we’ve just started the 30 year warming phase of such a cycle. 30 years will hopefully be enough time to put the social changes we want into place.’
However, there are apparently a number of different 60 to 70 year cycles whose primary influence is in different large areas of the globe. They all have different phases. Sometimes the phases add, sometimes they cancel, so the amplitude of peaks can vary extensively. Also, there is evidence of a number of longer cycles, from perhaps 100 years up to at least 40,000 years. These also interact depending on their independent phases, varying maximum and minimum amplitudes significantly. At the lower end there is the 5 to 8 years of ENSO, also not independent in its effects.
Even the 24 hour cycle can have extensive variations on short time scales. “Extensive” is a very anthropological evaluation in that what seems significant to humans may mean next to nothing to the planet or any sizeable region thereof.
Thirty years was also, at the time, the length of the satellite record. Prior to satellites the record is spotty thermometer records. Prior to thermometer records is all Proxy Dust
30 years was chosen because it provided the required answers.
jshtsky ==> That might be right — maybe these decisions should be based on a longer period.
The rise of the global average temperature in the 48 years since 1975 has little to do with any 60 to 70 year cycle.
Some nations will be affected by the AMO or PDO Cycles
The PDO and AMO merely redistributes heat. They are not a heat input into the earth’s atmosphere. The effects would be strongest if both were positive pr both were negative at the same time. That seems to be uncommon.
Four periods were identified: (i) positive PDO and positive AMO (1926–1943), (ii) negative PDO and positive AMO (1944–1963), (iii) negative PDO and negative AMO (1964–1976), and (iv) positive PDO and negative AMO (1977–1994).
The AMO is an ongoing series of long-duration changes in the sea surface temperature of the North Atlantic Ocean, with cool and warm phases that may last for 20-40 years at a time and a difference of about 1°F between extremes. These changes are natural and have been occurring for at least the last 1,000 years.
The AMO was in a warm phase from the 1920s to the 1960s, a cold phase from 1970s to the early 1990s, and then changed back to a warm phase in the mid-1990s.
Some nations will be affected by the Pacific Decadal Oscillation (PDO), a long-term ocean fluctuation of the Pacific Ocean. The PDO waxes and wanes approximately every 20 to 30 years.
Since 2020, the PDO has been consistently negative, reaching the most negative values since 1955 in both 2022 and 2023.
A lot depends on whether the planting you are planting has an expected lifespan of 5 years, or 100 years.
Actually, increased CO2 has changed hardiness zones directly by reducing plant stress and weather isn’t climate and there’s been no real change in climate temperatures since WW2…
CO2 will not change the sap freezing point. They may be vigorous right up until that reach that maximum low.
Here on the east slope of Northern Rockies the USDA extended the growing season dates
by 30+% a long time ago, I think around the late 80’s. They made a point that this was
just a regional change, not a large change.
During my early days farming/ranching in the 70’s we were lucky to get 2
cuttings of hay, it was a very short season. If I didn’t get the hay cut by Labor Day it was risky
going much later. Now the season go’s into October.
At the present 3 cuttings are common.
In the early times it was difficult to even grow sweet corn in the garden. Field corn
was unheard of. Now it’s in common use, mostly as silage. Bottom line
is the area Ag producers are in much better shape with a longer growing season.
Mr Ed ==> Yes, longer growing season is better for most crops. Temperature sensitive crops, many fruit trees, required sequences and need warmth during the budding and flowering time.
But, we have learned by experience where which crops grow most reliably and profitably, which is what is important to farmers and ranchers.
Yes, no cherries in bc this year due to the January climate change.
i hope there is lots of Washington ones or they will be $$$
I’ve discounted these ‘hardiness zones’ for decades.
Back in the 1980’s I had occasion to look up the zone for the high desert north of Reno, NV and was surprised to see it qualified for redwood trees. I didn’t test this by planting any.
eastbat ==> Hardiness zones are just that — hardiness zones. They are not suitability zones. There are lots of other factors besides “average lowest temperatures” to consider.
We have a redwood where we live, and it can’t get above three feet tall, as the winters here are too hard/too cold and kill the foliage each winter. The roots are hardier, and the tree starts over every spring.
Don’t Redwoods require a lot of water? HIgh deserts aren’t known for having a lot of rainfall.
MarkW ==> Redwoods have very specific requirements and High Desert is not one of them — entirely unsuitable. My area is not suitable either, but it is my granddaughters redwood and I keep it going. Maybe by the time she’s old like me, it will have warmed up enough here to allow it to grow properly.
Bingo
The zone means it might survive but only barely. Microclimates help, I have zone5 plants doing great in sub-arctic zone 3 calgary but they only work in very protected spots.
My low temperature in December 2023 was -17°F. Years ago,
I had a -15° week and never got above Zero. [Zip = 98926]
The 2023 cold didn’t last as long.
Daffodils are now 4 inches out of the soil.
My biggest problem is during blooming with frost or wind.
{I should mention deer!}
Wind inhibits pollination. Cold can blacken/kill tiny fruits.
At 2,240 feet night-time temperature is often low enough that
tomatoes will not set fruit. (that’s <55°F)
Cherries and such come through about once in four years.
I can usually get a good harvest of onions. They keep well.
Some last 6 months. I grow “long day-length types.
They are more easily given to friends than Zucchini. 🙂
Zucchini, boiled with onion in chicken broth, then puréed, chilled and served with sour cream and dill, makes an excellent summer soup! I actually ask for the larger, overgrown ones when I want to make a batch. Most summers I can get all I want for free; a low-carb treat that goes well with some cold, smoked chicken or pork!
I recommend about 3 or 4 parts zucchini to one of onion, but you can decide what you like best and then give out little recipe cards with your zucchini!
I grew a bunch of walla walla sweet onions last summer in calgary, grew great, dried and stored them same as my regular yellow onions
by midnovember they were all sprouted and mushy
Lesson learned, eat them as they come and eat first after harvest
yellow ones just starting to sprout
Couple of fun farm anecdotes from my big old Wisconsin Uplands dairy farm.
We had Yellow day Lilies planted around the perimeter of the screened porch (built ~1981) since before I bought it in late 1983. They still come up every spring year, and we still have to mow them down every late spring year after flowering. They just thrive in that soil. To keep them from ‘expanding’, we have to dig up their expanding root bulbs off the porch flower bed margins every once in a while.
The farm soil is limestone alkaline. So we planted some grape vines along the north side of the big (~half acre) west vegetable garden, and they did great. Lots of grape jam after I put up a vine trellis and learned how to fall prune the vines.
So planted some rhubarb on the west garden end, and it also did great—almost too great. There is a rhubarb jam limit somewhere solved by riding lawnmower.
And on the garden east end, shaded by big old crabapple trees in the morning, planted three rows of trellised black raspberries, which did great also until infected by fungal anthracnose. Tried for years to save them with fungicides—no go. Fungus won.
But no matter, because wild honey bees carried the blackberry pollen and seeds into the forest and we had an abundance of healthy ‘wild’ black raspberries to harvest in natural forest clearings despite the abject domestic garden failure. You just had to know where and when to go into the forest to harvest them. Easy.
So, point of this long anecdote, I unknowingly got early very cocky and also planted some blueberries around the big SW garden edge—they need acidic soil—and they all failed miserably despite everything else doing great. Why blueberries? Used to love picking them in the fall Appalachian Shenendoah, in Maine summer, and going to our summer fishing cabin in Ontario.
Thus did a then very novice part time dairy farmer learn about nature, soil, wild bees, and such. A lesson never forgotten, which many climate alarmists have evidentially never learned.
Blueberries have the same outcomes in non acidic soils as green renewables have everywhere.
Great story, Rud!
Just one problem. In the last sentence you mentioned green ruinables; I don’t believe that any such actually exist! But then I’m skeptical about Nessie and Bigfoot, too!
My wife makes an amazing rhubarb cherry ginger crisp that people knock down the door to get.
Well, some temperature scales (UAH) do show a slight warming, whether it’s real, corrupted or fake data was never the question. It’s about what is causing the warming. And there, there’s an enormous divergence of opinions.
Eric ==> Yes “there’s an enormous divergence of opinions.” But generally, nearly everyone with sense agrees that there has been warming — it is not as danged cold as it was during the Little Ice Age or even as cold as the very recent “Global Cooling Period”.
The disagreements are mostly about exactly how much warming, the causes of warming, and the future of warming. with those three points, there are as many opinions as there are knowledgeable people to answer.
They always talk about the average temp because it’s the minimum temps that have increased. Max temps not so much.
Discount all the “increasing heatwaves” nonsense.
John Robson did a great series a few years ago looking at the max temps at places all over the canadian north (recall that the north is supposedly warming 4x faster) called 1920/2020, overlaying the max readings 100 years apart.
And yes you cannot tell the difference.
https://climatediscussionnexus.com/
Home gardeners will all rent and be happy with climate change-
Finance guru Suze Orman says climate change will stop Americans wanting to own homes as it is causing insurance costs to soar – as she faces $28,000 A YEAR premium for modest Florida condo (msn.com)
or something like that.
It’s interesting that land(lords|ladies) won’t pass on the insurance premiums in the rent.
She has “an oceanfront condo”, so probably worth millions. 2100 sqft is not a modest condo, it is fairly large. In addition, being a condo, she and the other owners must cover the costs for the entire building so it is dependent upon how many units there are. Then consider the year built and the codes it was built to. Lot’s of missing information in her “claim”.
Thanks for a great article about one benefit of global warming. The plants also benefit from more CO2. There are too few articles about the good news from more CO2 and more warming. I have no idea if there has been any bad news
We have had 48 years of CO2 enrichment and global warming. If there was any bad news, someone would have noticed by now.
Due to a warped sense of humor, I have decided I prefer the term:
Laurel and Hardiness Zones
The only bad news is made up.
If only it would get warm enough that I could grow tomatoes in the Ponderosa Pine Belt!
What good is all this Gorebull Worming hysteria if I can’t have tomatoes with my mountains!?
abolition man ==> Greenhouse ’em! You ought to be able to grow short-season tomatoes in any decent little greenhouse, maybe with a little extra heat on cold nights…..alternately, I hear the marijuana growers have developed little indoor grow tents with all-spectrum lights and timers to mimic seasons.
Plant them under the dryer vent, do lots of laundry.
Nansar07 ==> Not as silly as it might sound. Planting on the south and west side of a house foundation can be very beneficial as far as hardiness goes, especially for plants that naturally die back to ground level. The foundation itself keeps the soil warmer and the reflected sun light and warmth helps in the Spring. My son placed all his potted trees and plants along his foundation in the Fall and we just moved them last week. Under the pots, thr bulbs were coming up and ready to bloom.
Double edge sword
The increased warmth dries out and desicates over winter so only if you are getting lots of moisture or adding yourself.
a dry year will wipe out those plants
Idiots. They moved my area from 7a to 8a. Last winter showed we were still 7a. My microclimate gardenias under the window agree (died). The neighbors had similar results.
USDA has drunk the Kool-aid.
g3ellis ==> Sorry about your gardenias. But your case is an example of what I am saying in the essay above. Hardiness Zones are guidelines not guarantees. The Hardiness Zones are based on average lowest winter temps, thus, there were and will be winters warmer and colder (that’s how averages work). Gardenias are best suited to zones 8-10…and your area is on a cusp…I recommended 1/2 zone safety margin,, but looks like you need a full zone .
There are new hardier varieties of gardenias that might be better suited for your spot.
A great resource for Koppen zones and climate change is a study by Hans Chen. His paper is
https://hanschen.org/wp/wp-content/uploads/chen-2013-ed.pdf
There is also an excellent interactive website. My synopsis:
https://rclutz.com/2016/05/17/data-vs-models-4-climates-changing/
Ron ==> Thanks for the links. Good stuff.
This was a nice article, though there are two important things to remember about the plant hardiness zones.
(1) The USDA and the developer of the maps on the USDA’s map’s website always have stressed that since the hardiness zones represent only one temperature reading a year (and it may only even be during 10 out of 30 years, depending on the reliability of the weather stations) that, ” … changes in zones are not reliable evidence of whether there has been global warming” and,
(2) the move of half a zone up, even the author’s move from 5b to 6 in the area on the New York – Massachusetts border, is really a return to older zones from the last century. If the hardiness zone maps from 1927-1990 are examined, you will see that the author and his wife’s property was in zone 6 on the 1948 and 1960 maps, which may reflect the temperatures our country was experiencing in the first half of the century which are similar to our temperatures during the present time period. See this article for an in-depth (and illustrated) history of the plant hardiness zones: https://medium.com/@tpacker25/an-illustrated-history-of-americas-plant-hardiness-zones-with-a-closing-look-at-one-north-carolina-county-694dd2185803
Tom ==> Thanks for the link to the historical data.
“” … changes in zones are not reliable evidence of whether there has been global warming” — Global Warming is a different issue, and only vaguely, if at all, connected to hardiness zones.
Hardiness zones are only 30 year averages of lowest winter temperatures — and can be translated as “how cold have winters been here lately?”
On the 1948 map, my area is either 5 or 6 — hard to tell as the granularity is different. But, that’s where we are today as well — 5 or 6 or 5b or 6a….
The maps that use larger lateral stripes miss the changes in altitude in areas like the Catskill Mountains,the Berkshires and the river valley.
All-in-All, the zones don’t change much — and gardeners should take care to leave some leeway in interpreting zones.
UHI is also going to have an impact.
I remember one time we were watching an approaching cold front that was slowly during a light drizzle into the first snow of the season. We lived near a moderate sized city (~100K). As the snow line approached the city, it divided up and went around the city, for awhile there was a city sized hole in the leading edge of the cold front. Over time, as the temperatures continued to drop, the hole gradually closed.
I kind of wish I had made a video of that so that I could plot the hole against development patterns.
MarkW ==> The Hardiness maps are not quite that fine — and generally don’t show differences on the “city-scale” — for instance, NYC may have an actual physical different hardiness in, say Central Park, but the maps do not show it. I would expect a zone or two higher in Central Park, surrounded by the mass of NY City.
And where does the agriculture department get their temperature data? Clearly not from NOAA’s Climate Reference Network which shows no change in US minimum temperature since 2005 (19 years.0
Denis ==> These are very local temperatures — and our winters are variable — we have had awful cold periods and warmer periods. They average those lowest temperatures to help gardeners and agriculturalists make decisions of plants and varieties.
Some places have gotten a bit colder and some a bit warmer.
The important thing about Hardiness Zones is to understand what they represent and how to use the data to inform decisions.
Not everything is about Global Warming…..
Since we are dealing with absolutes, not anomalies, these metrics are even more sensitive to UHI and other artificial influences. It’s imperative to ensure that these temperatures are coming from a reliable source, like USCRN. If this data originates from stations with the problems that Mr. Watts has documented, then these numbers do not reflect the real situation.
If you are trying to figure out what plants will survive, you want to include UHI in the measurements.
fieryrevenant & MarkW ==> For USDA Hardiness Zones, most of the weather stations are rural and semi-rural, to avoid contamination by cities.
Since they are dealing only with the LOWEST annual temperature and the granularity is very fine — there is less chance of UHI interference.
As Tony Heller documents in his Real Climate Science blog, the government keeps “adjusting” temperatures to cool the past and warm the present. I’m sure the USDA changed the hardiness zones based upon the “adjusted” temperature data. Unfortunately, our plants don’t recognize the “adjusted” temperatures, only the actual temperatures. Good luck with using the new zones.
rbcherba ==> Generally, the local station data is not adjusted other than through the usual somewhat-odd averaging etc. which I and many others have covered here for years. Some stations may be affected by bad siting and affected by non-weather factors like air conditioners, parking lots, etc. See Anthony Watts’ Stations Project reports.
They temperatures used for the hardiness zones are the lowest temperatures for each winter, averaged across the latest thirty years. It is a VERY crude metric — and should not be used for anything other than what it is originally intended.
It is not a CLIMATE metric.
Where we are, Vancouver Island, it is mostly zone 9 on the lower half unless you get into the hills and then we go down a zone. That hasn’t changed in the 50 years we’ve been living here.
Nansar07 ==> Gee, Zone 9 that far north? Truly? Not a typo?
Here, in Bend, Oregon my house is in zone 6b. Down the hill about 3/4 of a mile should be zone 5a. It’s always 10 or 15f colder down there on a still winter day. This is desert with dry air that won’t hold heat. These zones are guidelines and not to be trusted for microclimates. Best to add safety margin. Mother Nature will let you know if you messed up.
Citizen ==> “These zones are guidelines and not to be trusted for micro-climates. Best to add safety margin.”
That is exactly right.
In my area, there are frost pockets….small areas, sometimes just the size of football fields, that regularly frost when the rest of the county doesn’t. Odd little micro-climate-zones.
My wife cares for a pubic garden by the river which had quite a different gardening climate than at our home, a 1/2miles away and uphill.
Several years ago they changed the hardiness zone of where I live from a 6b to a 7a. But I don’t trust that and I won’t purchase any plants that aren’t hardy for zone 6. I’m not into digging stuff up so I expect whatever I plant to be able to survive the winter. Also not into doing a lot of mulching either.
Kip
gardener here as well, in Calgary with our usual 6 week summer.
”Why do they track this particular metric? “
because if they are too honest people won’t buy and plant those specialty breeds. $$$
Then when a hard freeze kills them and the poor sucker goes back to the garden center he’s told no refund but it’s unlikely to happen again so buy another.
same as selling annuals starting in April knowing most will plant out, June is the only safe time although I had a hard -9C freeze in second week of June a decade ago.
Us that can read know that the rising temps story is about nighttime and winter lows. All good for growing
[QUOTE FROM ARTICLE] “Also see “Orchard Frost – Critical Temperatures for Various Fruits” for common spring temperatures that can ruin orchard crops in my area.”[END QUOTE]
I have an old apricot tree in my back yard, on a south-facing hillside above Salt Lake City. The coldest winter temperatures in January or February have nothing to do with eventual apricot yield, but that apricot tree has to “beware the ides of March” if it is warm.
If mid- or late-March is unusually warm, the apricot tree tends to bloom in late March, and then there is invariably a freeze in early April that kills the fruit embryos and leads to a minimal fruit yield in June.
But if “March goes out like a lion” with chilly, rainy/snowy weather, the apricot tree doesn’t bloom until mid-April, with lots of bees to pollinate the flowers, with no freezes later on, and we get a few bushels of apricots in July. In fact, March 2023 was very snowy, with snow lasting into early April, but the fruit yield in July was abundant.
Hardiness zones based on minimum winter temperatures can be deceptive. What is more important for fruit yield is the transition from winter to spring, and whether early blooms are killed by late frosts.