However, This El Nino Not Expected to Be as Strong As 1982-83 Or 1997-98 Or 2015-16 El Nino
Reposted from gujaraweather.com
Enso Status on 10th February 2024
Ashok Patel’s Analysis & Commentary :
The classification of El Niño events, including the strength labels, is somewhat subjective and can vary among meteorological and climate agencies. There isn’t a strict rule defining the specific number of consecutive Oceanic Niño Index (ONI) values that must be 2.0°C or above to categorize an El Niño event as “Super Strong.”
In general, a strong El Niño event is often characterized by ONI values reaching or exceeding +2.0°C. A Super Strong El Niño would typically involve sustained ONI value of +2.0°C or more. Hence for ease of understanding and comparing the strength of various Strong El Nino events, I propose to define an El Nino as a Super Strong event if three consecutive ONI index is +2.0°C or more.
A brief history of the past El Nino events with the number of consecutive ONI +2.0°C or above:
In the year 1965 the highest ONI index during that El Nino were SON +2.0°C, OND +2.0°C
In the year 1972-73 the highest ONI index during that El Nino were OND +2.1°C NDJ +2.1°C DJF
In the year 1982-83 the highest ONI index during that El Nino were SON +2.0°C, OND +2.2°C NDJ +2.2°C DJF +2.2°C
In the year 1997-98 the highest ONI index during that El Nino were ASO +2.1°C SON +2.3°C, OND +2.4°C NDJ +2.4°C DJF +2.2°C
In the year 2015-16 the highest ONI index during that El Nino were ASO +2.2°C SON +2.4°C, OND +2.6°C NDJ +2.6°C DJF +2.5°C JFM +2.1°C
ONI Data has been obtained from CPC – NWS – NOAA available here
There have been three Super Strong El Nino events from 1950 onwards till date. The first such event was 1982-83 Super Strong El Nino with 4 consecutive ONI +2.0°C or above with highest ONI of +2.2°C twice. The second Super Strong El Nino event was 1997-98 with five consecutive ONI +2.0°C or above with highest ONI of +2.4°C twice. The third Super Strong El Nino event was 2015-16 with six consecutive ONI +2.0°C or above with highest ONI of +2.6°C twice. The current forecast and analysis does not support the 2023-24 El Nino to become a Super Strong El Nino.
Indian Monsoon & Enso relationship for India:
Based on earlier more than 100 years weather Data for Indian Summer Monsoon, The Average Rainfall in an El Nino years is 94% of LPA while in La Nina Years it has been 106 % of LPA for the whole country. Monsoon Rainfall over India had been +94.4% of LPA at the end of 30th September 2023. El Nino or La Nina may affect the Monsoon differently for different Regions of India and warrants research for concrete co-relations for each region of India if any. Performance of Southwest Monsoon 2023 over the entire Country was much better than expected.
How ONI is determined:
The ONI is based on SST departures from average in the Niño 3.4 region, and is a principal measure for monitoring, assessing, and predicting ENSO. Defined as the three-month running-mean SST departures in the Niño 3.4 region. Departures are based on a set of further improved homogeneous historical SST analyses (Extended Reconstructed SST – ERSST.v5).
NOAA Operational Definitions for El Niño and La Niña, El Niño: characterized by a positive ONI greater than or equal to +0.5ºC. La Niña: characterized by a negative ONI less than or equal to -0.5ºC. By historical standards, to be classified as a full-fledged El Niño or La Niña episode, these thresholds must be exceeded for a period of at least 5 consecutive overlapping 3-month seasons.
CPC considers El Niño or La Niña conditions to occur when the monthly Niño3.4 OISST departures meet or exceed +/- 0.5ºC along with consistent atmospheric features. These anomalies must also be forecast to persist for 3 consecutive months.
The Climate Prediction Center (CPC) is a United States Federal Agency that is one of the NECP, which are a part of the NOAA
Latest Oceanic Nino Index Graph Shows
El Nino Conditions Are Prevailing At The End Of January 2024

The Table below shows the monthly SST of Nino3.4 Region and the Climate adjusted normal SST and SST anomaly from July 2021. Climate Base 1991-2020. ERSST.v5
| Period | Nino3.4 | ClimAdjust | ||
| YR | MON | Temp. °C | Temp. °C | ANOM °C |
| 2021 | 7 | 26.9 | 27.29 | -0.39 |
| 2021 | 8 | 26.32 | 26.86 | -0.53 |
| 2021 | 9 | 26.16 | 26.72 | -0.55 |
| 2021 | 10 | 25.78 | 26.72 | -0.94 |
| 2021 | 11 | 25.76 | 26.7 | -0.94 |
| 2021 | 12 | 25.54 | 26.6 | -1.06 |
| 2022 | 1 | 25.61 | 26.55 | -0.95 |
| 2022 | 2 | 25.88 | 26.76 | -0.89 |
| 2022 | 3 | 26.33 | 27.29 | -0.97 |
| 2022 | 4 | 26.72 | 27.83 | -1.11 |
| 2022 | 5 | 26.83 | 27.94 | -1.11 |
| 2022 | 6 | 26.98 | 27.73 | -0.75 |
| 2022 | 7 | 26.6 | 27.29 | -0.7 |
| 2022 | 8 | 25.88 | 26.86 | -0.97 |
| 2022 | 9 | 25.65 | 26.72 | -1.07 |
| 2022 | 10 | 25.73 | 26.72 | -0.99 |
| 2022 | 11 | 25.8 | 26.7 | -0.9 |
| 2022 | 12 | 25.75 | 26.6 | -0.86 |
| 2023 | 1 | 25.84 | 26.55 | -0.71 |
| 2023 | 2 | 26.3 | 26.76 | -0.46 |
| 2023 | 3 | 27.19 | 27.29 | -0.11 |
| 2023 | 4 | 27.96 | 27.83 | 0.14 |
| 2023 | 5 | 28.4 | 27.94 | 0.46 |
| 2023 | 6 | 28.57 | 27.73 | 0.84 |
| 2023 | 7 | 28.31 | 27.29 | 1.02 |
| 2023 | 8 | 28.21 | 26.86 | 1.35 |
| 2023 | 9 | 28.32 | 26.72 | 1.6 |
| 2023 | 10 | 28.44 | 26.72 | 1.72 |
| 2023 | 11 | 28.72 | 26.7 | 2.02 |
| 2023 | 12 | 28.63 | 26.6 | 2.02 |
| 2024 | 1 | 28.42 | 26.55 | 1.87 |
Indications and analysis of various International Weather/Climate agencies monitoring ENSO conditions is depicted hereunder:
Summary by: Climate Prediction Center / NCEP Dated 4th February 2024
ENSO Alert System Status: El Niño Advisory
El Niño conditions are observed.*
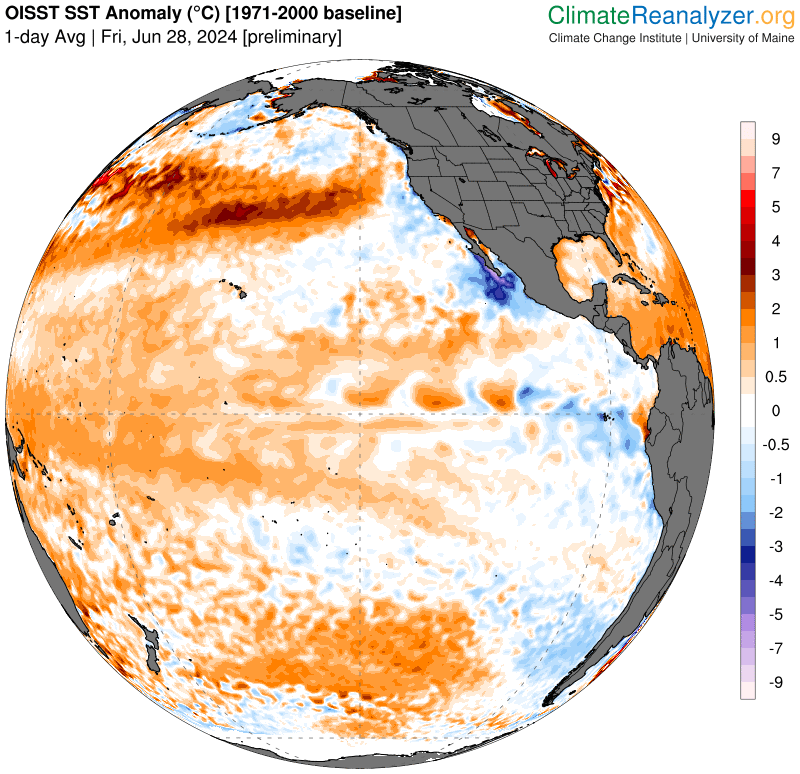
Equatorial sea surface temperatures (SSTs) are above average across the central and eastern Pacific Ocean.
The tropical Pacific atmospheric anomalies are consistent with El Niño.
El Niño is expected to continue for the next several seasons, with ENSO-neutral favored during April-June 2024 (73% chance).*
Note: These statements are updated once a month (2nd Thursday of each month) in association with the ENSO Diagnostics Discussion, which can be found by clicking here.
Recent (preliminary) Southern Oscillation Index values as per The Long Paddock – Queensland Government.
30 Days average SOI was 3.96 at the end of January 2024 and was -3.97 on 8th February 2024 as per The Long Paddock – Queensland Government and 90 Days average SOI was -4.64 on 8th February 2024. During January 2024 the SOI had become +3.96 and is -3.97 currently.

Southern Oscillation Index
As per BOM, Australia
The 30-day Southern Oscillation Index (SOI) for the period ending 31 January 2024 was 3.7 and was 0.7 on 4th February 2024 and is moving towards negative direction once again..
Sustained negative values of the SOI below −7 typically indicate El Niño while sustained positive values above +7 typically indicate La Niña. Values between +7 and −7 generally indicate neutral conditions.

As per BOM – Australia 6th February 2024
El Niño has peaked and is declining
ENSO Outlook
Climate model outlooks suggest El Niño has peaked and is declining, indicating a return to neutral in the southern hemisphere autumn 2024. The ENSO Outlook will remain at El Niño status until this event decays, or signs of a possible La Niña appear.

WUWT Editors’ Note
On February 8th, NOAA issued a La Niña Watch
EL NIÑO/SOUTHERN OSCILLATION (ENSO)
DIAGNOSTIC DISCUSSION
issued by
CLIMATE PREDICTION CENTER/NCEP/NWS
8 February 2024
ENSO Alert System Status: El Niño Advisory / La Niña Watch
Synopsis: A transition from El Niño to ENSO-neutral is likely by April-June 2024 (79% chance), with increasing odds of La Niña developing in June-August 2024 (55% chance).
During January 2024, above-average sea surface temperatures (SST) continued across most of the equatorial Pacific Ocean [Fig. 1]. SST anomalies weakened slightly in the eastern and east-central Pacific, as indicated by the weekly Niño index values [Fig. 2]. However, changes were more pronounced below the surface of the equatorial Pacific Ocean, with area-averaged subsurface temperature anomalies returning to near zero [Fig. 3]. Although above-average temperatures persisted in the upper 100 meters of the equatorial Pacific, below-average temperatures were widespread at greater depths [Fig. 4]. Atmospheric anomalies across the tropical Pacific also weakened during January. Low-level winds were near average over the equatorial Pacific, while upper-level wind anomalies were easterly over the east-central Pacific. Convection remained slightly enhanced near the Date Line and was close to average around Indonesia [Fig. 5]. Collectively, the coupled ocean-atmosphere system reflected a weakening El Niño.
The most recent IRI plume indicates a transition to ENSO-neutral during spring 2024, with La Niña potentially developing during summer 2024 [Fig. 6]. Even though forecasts made through the spring season tend to be less reliable, there is a historical tendency for La Niña to follow strong El Niño events. The forecast team is in agreement with the latest model guidance, with some uncertainty around the timing of transitions to ENSO-neutral and, following that, La Niña. Even as the current El Niño weakens, impacts on the United States could persist through April 2024 (see CPC seasonal outlooks for probabilities of temperature and precipitation). In summary, a transition from El Niño to ENSO-neutral is likely by April-June 2024 (79% chance), with increasing odds of La Niña developing in June-August 2024 (55% chance; [Fig. 7]).
This discussion is a consolidated effort of the National Oceanic and Atmospheric Administration (NOAA), NOAA’s National Weather Service, and their funded institutions. Oceanic and atmospheric conditions are updated weekly on the Climate Prediction Center web site (El Niño/La Niña Current Conditions and Expert Discussions). Additional perspectives and analysis are also available in an ENSO blog. A probabilistic strength forecast is available here. The next ENSO Diagnostics Discussion is scheduled for 14 March 2024.
To receive an e-mail notification when the monthly ENSO Diagnostic Discussions are released, please send an e-mail message to: ncep.list.enso-update@noaa.gov.
Climate Prediction Center
5830 University Research Court
College Park, Maryland 20740
It’s interesting that USCRN has already dropped below the zero anomaly line from what was considered to be its El Nino spike.
It’s also interesting that the PDO seems to be at or beyond a record low.
Pacific Decadal Oscillation (PDO): NOAA Physical Sciences Laboratory
Great Falls, Montana recorded its lowest winter temperature in over 5 decades.
That is called anecdotal evidence. It isn’t possible to distinguish that from simple weather.
Shut up.
So it is not unprecedented and has happened previously prior to the advent of the Great Scam.
Yes, it was below average in the USA and Northern Europe in January. But still the warmest January by someway globally.
Yep, see that El Nino region releasing energy around the whole of the tropics then outwards from there.
You do know there is rather strong El Nino releasing a lot of energy, don’t you ??
Still waiting for any evidence of human causation…
… or are you agreeing that this a TOTALLY NATURAL El Nino effect.
You mean the El Nino that isn’t even in the ten warmest on record?
The ‘Magic Enso‘ that only warms but never cools?
No I mean the El Nino that has released very large amounts of energy into the atmosphere, and warmed the whole of the tropics, and continues to do so.
Stop your idiotic denial of what is plainly obvious from the UAH charts.
And please educate yourself about El Nina / La Nina, which you still patently have very little, if any, understanding of.
re: Magic ENSO:
That’s what the satellite record shows!!
Got follow the evidence!
💕
With 100% correlation, all El Ninos are caused by a decrease in global SO2 aerosol levels, and all La Ninas are caused by increased global SO2 aerosol levels
The Climate Prediction Centers are looking at the wrong metrics to make their predictions!
To you down voters:
https://doi.org/10.30574/wjarr.2023.17.1.0124
Citing yourself as a reference..
Dickie Greene/Nick Stokes emulation.
Ego trip.
I thought I was wrong once, I was mistaken.
“Ego trip”
Yes, until someone proves me wrong.
bnice2000::
Nothing wrong with citing ones self, if I have done the work that no one else has.
Except if you are perpetually wrong or have a one-track mind blocked to all other realities… and don’t realise it.
Basically it is just an arrogant ego-trip.
bnice2000.
Unfortunately, there are no other climate realities other than what I have identified. SO2 aerosols ARE the control knob for Earth’s climate. Increase them and it cools down. Decrease them, and it warms up.
A simple concept, but obviously beyond your capability to understand.
So I did a Google search on “IPCC el nino predictions”
This came up: from NOAA:
ENSO and Climate Change: What does the new IPCC report say?
If you read through that with the school teacher analogy and all it’s pretty easy to conclude that as far as El Niños go, the IPCC doesn’t know when they will occur or how strong they will be. But we’re supposed to believe they know what the world temperature will be in 2100.
Better than Schellnhuber and his crew, prognosting El Niño, because of some tricky points other models didn’t show and getting La Niña, because the missing tricky points in other models were what ever blibs in the Schellnhuber model 😀
Wasn’t that the super-villain in “Die Hard”?
El Nino is the (surface) warming part of the ENSO system, an oscillation (as the name suggests). The net effect of ENSO on global surface temperatures over decades is expected to be ~0.0C. It will have no affect on long term global temperatures. It will continue to raise and lower them intermittently, independent of other factors.
OMG . the fungalfool still thinks a climate oscillation is a nice smooth curve with a regular period and always the same response.
NO, fungal , El Nino and La Nina and NOT like a nice regular sine curve
The two parts of the “oscillation” are NOT doing the same thing. !
It is very obvious that since 1979, El Nino has been the deciding factor.
ALL the warming in the satellite data comes from those strong El Nino events
That is a FACT that your tiny “brain-washed-into-ignorance” little mind cannot allowed itself to grasp.
And STILL you have no evidence of any human causation.!!
bnice2000:
The 1969-1970, 1997-98, 2014-2016, and 2018-19 El Ninos were all caused by human activity.
You owe The Final Nail an apology!
You owe the whole blog an apology for pushing hair-brain anti-science.
bnice2000;
I have the data to prove everything that I have said, and no one has ever proven me wrong.
Further, my thesis is falsifiable (empirically testable) and has been tested by nature and by man and has been validated hundreds of times.
Like it or not, YOU are the one who is anti-science.
Yes and no – you’ve got the timescale completely wrong. You’ve got to factor in the El Nino/La Nina together with the warm/cool Pacific cycles of the PDO as well – that tends to magnify or reduce the effects and so the oscillation may take 30 or more years to get close to ~0.0, if ever. It’s too complex to simply handwave away as averaging out.
With you right up until “if ever”. The base point of TFN is correct.
El Niño certainly won’t end soon, as temperatures in the tropical eastern Pacific are rising and SOI has fallen hard again.

https://www.longpaddock.qld.gov.au/soi/
Latest Southern Oscillation Index valuesSOI values for 12 Feb, 2024
Average SOI for last
30 days-10.99
Average SOI for last 90 days-5.33
Daily contribution to SOI calculation-37.51
Looks like the last little bit of the subsurface warmth is rising in the Nino 1.2 area.
This ENSO ranked tenth in strength since 1950, #5 using the 12 month average change in RONI.
“Relative Niño3.4 index is now included in ENSO monitoring, which is defined as the conventional Niño3.4 index minus the SSTA averaged in the whole tropics (0°-360°, 20°S-20°N), in order to remove the global warming signal. Also, to have the same variability as the conventional Niño3.4 index, the realtive Niño3.4 index is renormalized (van Oldenborgh et al. 2021: ERL. 10.1088/1748-9326/abe9ed; L’Heureux, et al. 2024: J. Climate, 10.1175/JCLI-D-23-0406.1)” – CPC ENSO advisory
ML CO2 anomalies followed Niño3.4 temperature changes as I expected:
It looks like a warming trend releases CO2 from the oceans, like a warm soda pop bottle.
There is very little free CO2 in the ocean, because almost all of it is tied up in carbon, sodium and chlorine compounds.
Yes, from free CO2 near the ocean surface outgassing more as the OHCa increases.
A westerly circulation over the Gulf of Carpentaria brings tropical lows to northern and eastern Australia.
http://tropic.ssec.wisc.edu/real-time/mtpw2/webAnims/tpw_nrl_colors/ausf/mimictpw_ausf_latest.gif
Thanks…. not!.
Weatherzone forecast for my region of NSW is shown below
As if the darn grass isn’t growing fast enough already !
Strong thunderstorms on a cold front from the south.

And we all know global warming causes El Nino.
Hmmm… Wait, doesn’t El Nino cause global warming? Maybe we have discovered some perpetual motion machine? Or a self-causing phenomenon?
Good thing we have professionals doing that science stuff to figure this out.
More Soylent Green:
An interesting observation:
Using Woodfortrees.org graphs of HadCrut4 global temperatures, and Hadsst3 global sea surface temperatures, and taking the integral of each, one gets IDENTICAL graphs. To me it tells me that ENSO is not causing temperatures to rise, but that both rising simultaneously, making your first statement correct.
What would you conclude?
The BoM in Australia predicted record temps, drought and a higher risk than normal of wildfires with an up coming El Nino this summer. None of that happened. They should just stick to predicting the weather a week away. Even then, they can’t get that right.
Three day forecasts, I reckon. They can do those with better than 50% accuracy and the rest is just handwaving. I used to collect screen grabs of the 7 day forecasts for my place in Queensland for whinging rights, but it was as exciting as shooting fish in a barrel. Still, they go on with their forecasts without an apology – and make excuses for why this El Niño is not the hot and dry hell they predicted and no doubt will claim this was the hottest summer in the history of the universe.
From the National Weather Service disclaimer webpage https://www.weather.gov/disclaimer
The user assumes the entire risk related to its use of information on NWS Web pages. NWS is provides such information “as is,” and NWS disclaims any and all warranties, whether express or implied, including (without limitation) any implied warranties of merchantability or fitness for a particular purpose. In no event will NWS be liable to you or to any third party for any direct, indirect, incidental, consequential, special or exemplary damages or lost profit resulting from any use or misuse of this data.
Off topic- but … I watch too much TV (mostly YouTube) – but I occasionally get curious what’s on the mainstream TV channels like NBC, CBS, etc. I did that today- and they all have news stories about how Mickey Mann won his court case against some extremist right wing climate deniers- usually showing Mann for a few seconds- he looks so happy in his great victory against those horrid deniers on the take from the ff companies. On one of the channels- the “newsman” said “now these deniers will think twice about attacking these important climate scientists”. Seems the MSM loves the word “extreme”- as in extreme weather and extremist ff funded climate/science deniers. They’ll probably soon start calling the deniers – terrorists- if they haven’t already. After all, if it wasn’t for those deniers- everyone would slash their carbon footprint which would end extreme weather causing extreme damage – ergo, the climate emergency is caused by those deniers- ergo, they are terrorists! So logical! 🙂
Sort of like Bomb Cyclones and Atmospheric Rivers, the weather people like to talk about now.
Today’s Bah-stin Globe:
Boston is under a snow emergency ahead of winter storm
https://www.bostonglobe.com/2024/02/12/metro/boston-snow-updates-2/
That’s a new one on me- a SNOW EMERGENCY! Add it to the crazy list. Anybody got any more?
It just looks like a jolly short El Niño to me.
A rather “different” El Nino, too, and very widespread effects.
El Nino normally means decreased rainfall for Eastern Australia…
Nope, not this one.
What goes up must come down… somewhere.
A quick note on the WUWT ENSO meter, which I maintain.
I get the data from ftp://ftp.bom.gov.au/anon/gen/clim_data/IDCK000081.zip and extract nino_3.4.csv
It’s updated weekly, this year’s data is (I use the last line):
“Strong El Nino Conditions Prevails at The End of January 2024”
Yeah, I could tell here on the Front Range of Colorado…
However, it appears that the associated temperature peak may be spread out longer than the ’97-98 and 2015-16 peaks. We need another month to see if this El Nino is really behaving differently.
It was a moderate, run-of the-mill, El Nino.
The ‘elephant in the room’ question is: why did it result in so many new record warm global temperature records?
Every month since July 2023 has set a new warmest monthly record. February has started off the same way, even more above average than January, so far.
TFN,
When Nature does not match the human-measured numbers, investigate the human numbers.
Too many people are questioning the change from LIG thermometers in Stevenson screens to electronic devices in different housings. Suspicion is raised when authorities decline to measure or release comparisons in overlap tests. Geoff S
It is matching the numbers.
And the satellite producers, who don’t use thermometers, are also setting new monthly high temperature records; so this whole ‘it’s all down to the thermometers’ thing is wearing a bit thin, Geoff.
Yes, and very large amount of energy has been released into the atmosphere.
Thank you for confirming that point… again.
And still the DENIAL of bad thermometers, bad sites and urban warming.
Just how much further are you going to take your science denial and ignorance ??
No, that is not a challenge. !
Wrong again. !
You can see from the UAH charts that it has released a HUGE amount of energy, and still is.
A very large El Nino spike starting in May, and spreading warmth around the whole tropics.
Global temperatures were actually COOLING before then
Notice January map above from the bellboy, still has the El Nino producing a lot of energy.
Whatever little “elephant” fetish you are imagining is purely in your tiny little mind, and leaving no room for anything else.
As has been pointed out above many times, including with links to the data, this was not a “a very large El Nino spike”.
It was moderate, at best.
So it does not explain the new temperature records, as and of itself.
It has merely served to emphasise an already obvious and statistically significant underlying global warming trend.
WRONG… as always.
The 2016 El Nino added a spike of about 0.7C from its start, then subsided rapidly
The 2023 El Nino added a spike of about 0.9C from its start, and had 2-3 months around it peak, so far.
There has been enough energy released to warm the whole tropical atmosphere by at least 0.5C… And In January the El Nino region reach +1.5C warming
Do you really DENY that that is a LOT of energy ????
It very much DOES explain the temperature records when combined with really bad sites and urban warming..
You know you have NO OTHER RATIONAL EXPLANATION.no other rational explanation, which is why you hum and hah and make mindless comments and suggestion.
You KNOW it cannot be human released CO2.
…. and you KNOW there is no other human causation except those really bad site placements and lots of urban warming.
Do you have any evidence of any other human causation... or are you just playing with your little pink elephant !!
There is NO underlying warming in the satellite record. It all comes from El Nino events. Even a moronic denialist like you should realise that by now.
“You can see from the UAH charts that it has released a HUGE amount of energy, and still is.”
How do you work out from a temperature graph exactly how much energy was released? Was it more or less than in 1997/98 and 2015/16?
“Global temperatures were actually COOLING before then”
Got to keep using those La Niña’s to produce your statistically insignificant cooling periods.
“Notice January map above from the bellboy, still has the El Nino producing a lot of energy.”
Got to keep up this childish name calling, rather than make a coherent point.
You argument comes down to saying that records were broken, therefore the El Niño was record breaking, therefore it was all down to the El Niño.
OMG you are so THICK.
Enough to warm the whole tropics by at least 0.5C in a couple of months.
… and still going.. again the El Nino area of the eastern Pacific is now up to 1.5C anomaly.. ocean release directly into the atmosphere.
Wake the **** up, gormless twit !!
—–
“Got to keep using those La Niña’s to produce your statistically insignificant cooling periods”
Well done.. La Nina produce sometimes nothing. sometimes slight cooling
Then you get an El Nino release, that in this case has warmed the whole tropical atmosphere.
You have FINALLY realised that El Ninos are the source of the warming.
A very tiny step for a mental toddler…
… now… don’t fall back on your over-full nappy. !!
bnice2000 wrote:
Umm, why do you call yourself “bnice…”?
I was being nice. !
This sums up your fundamental misunderstanding.
El Nino and La Nina are equal and opposite parts of the ENSO system; together they just slosh heat around, both land and ocean. What ENSO can’t do is increase or diminish it all by itself.
The system needs outside influences for that.
By itself, ENSO does not explain the observed statistically significant long-term warming.
You still answer from utter cluelessmess.
NO! they are NOT equal, and they are NOT opposites.
They are two very different processes.
And if you still haven’t figured out where the oceans get their energy from, to charge El Nino events….
… then you really are one of the most ignorant people on the planet.
Thanks for confirming you’ve got no argument.
“Enough to warm the whole tropics by at least 0.5C in a couple of months.”
Again, is that more or less than ’97 or ’15?
“Well done.. La Nina produce sometimes nothing. sometimes slight cooling”
And yet you keep claiming that a few years that contained three La Niñas demonstrates that the world would be cooling if it wasn’t for all the El Niños.
“Then you get an El Nino release, that in this case has warmed the whole tropical atmosphere.”
And made the planet on average warmer than it was during either of the previous big El Niños. The question you fail to grasp is where does the El Niño heat come from? How is it possible for every El Niño to add more heat into the atmosphere, and then for that heat to just hang around waiting for the next El Niño to arrive?
“where does the El Niño heat come from?” !!
OMG! look up into the sky, you brainless twit… !!
“heat to just hang around waiting for the next El Niño to arrive”
You have just shown that you have absolutely ZERO comprehension of what El Nino and LA Nina events are… well done. !!
“OMG! look up into the sky, you brainless twit… !!”
Thanks for admitting the warming trend has nothing top do with El Niños. Well done.
““Enough to warm the whole tropics by at least 0.5C in a couple of months.””
At least now you are admitting that a LOT of energy is being released by the current El Nino. Looks like more than 2015 for sure which looks like a short burp. and similar to
Look at the UAH sequence of charts.. and use your what little brain you have.. for once.!
“At least now you are admitting…”
You realize you are quoting yourself there, right?
Here’s a comparison of ONI values for ’97, ’15 and ’23.
2023 starts close to 1997, but the rise in 97 was stronger and was stronger by the beginning of 1998. By 2015 the El Niño had already started and remained strong throughout the year.
But what’s been unusual about the global temperature during 2023 is that it warmed much quicker than what happened during the previous two strong El Niños.
Usually the effects don’t reach a peak until the following year. But in 2023 we saw an almost immediate reaction – assuming this is entirely due to the El Niño.
Here’s some maps based on the UAH gridded data.
2023 looks more like 1998 and 2016, than 1997 and 2015.
Again, I agree with Bellman. The first plot below shows a slightly different perspective. The UAH peak is usually about 4 months after the ONI peak, so it remains to be seen if UAH temperature goes even higher around that time. The second plot highlights the consistency in SST timing behaviour for the larger El Niño events as well as the huge contrast with large La Niña events, which reflect the increasing effect of cold, upwelling waters.

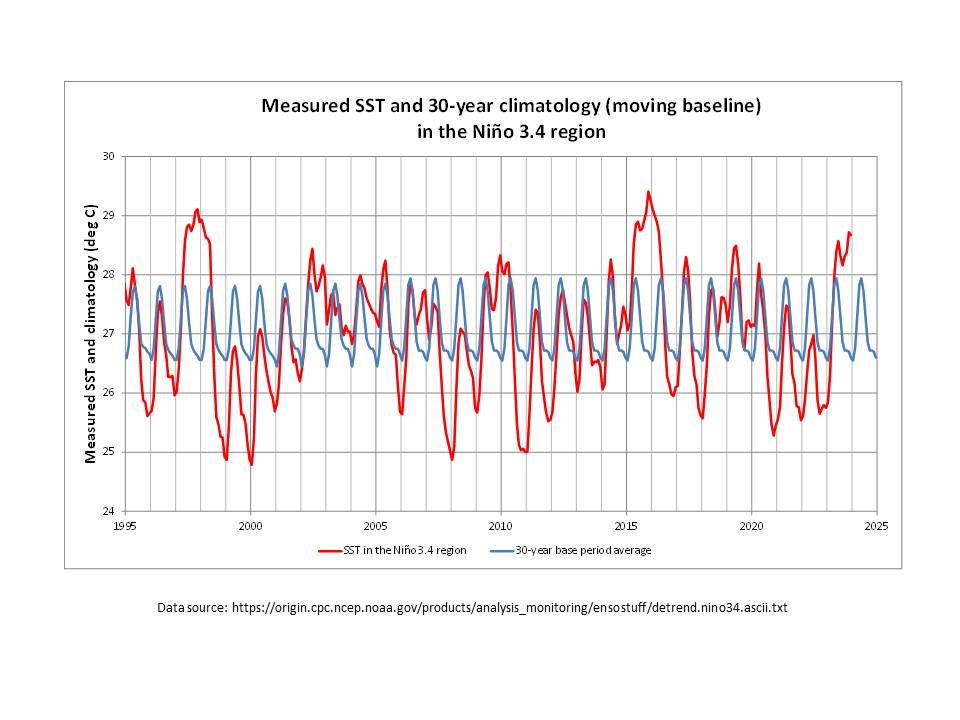
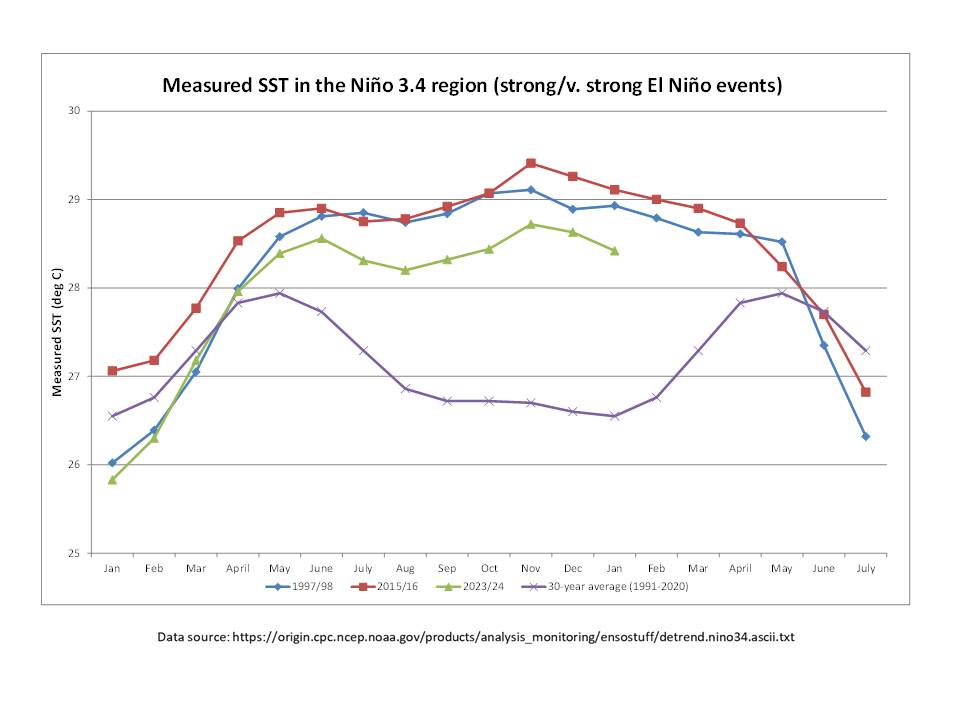
I agree with Bellman. There is an important distinction to make in these discussions: the temperature behaviour locally, as reflected in the ONI values for example, and the global temperature consequences. The following plot is based on measured SSTs rather than ONI values, which are based on SST anomalies and which have been de-trended (as published by NOAA). This indicates that the SST behaviour in the Niño 3.4 region matches very closely with the two earlier ‘very strong’ El Niño events other than SSTs being about 0.5C lower, consistent with this being classified (on the basis of ONI values) as a ‘strong’ event. With the 30-year average SST being used to compute anomaly values which are then used to determine the ONI value (3-month rolling average), the decrease in anomaly/ONI values is significantly driven by the increase in the average values. This is why the peak in ONI values is mostly seen in the November-January period for the larger El Niño events.
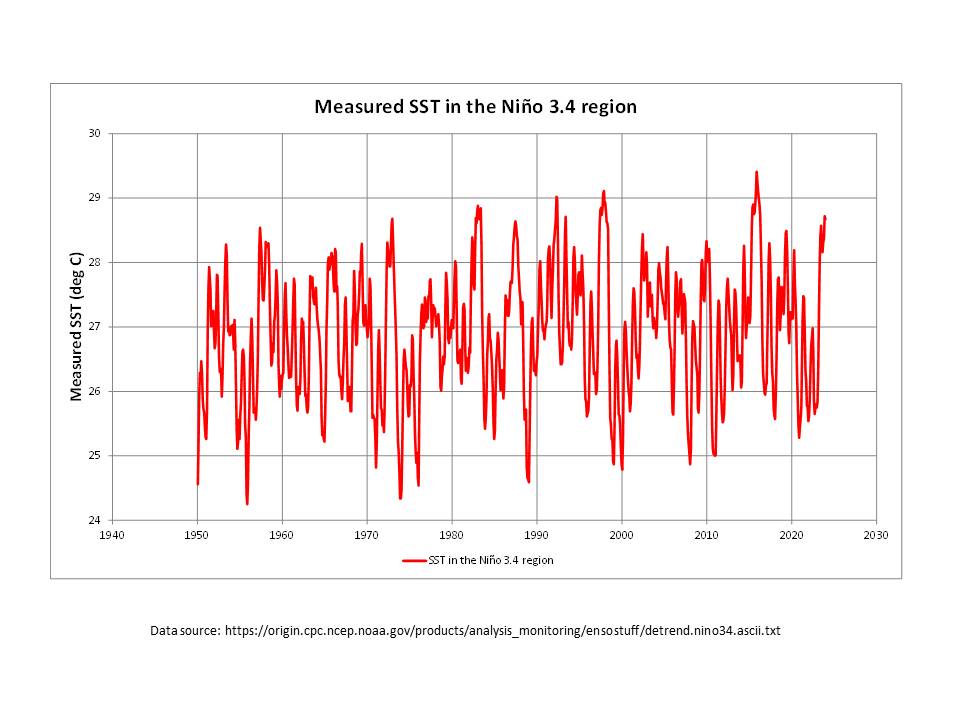
Just to highlight the fact that ONI values are de-trended, here are the measured SST values without de-trending. There is a clear increase over time of both the maximum values and the minimum values.
Was that a rhetorical question?
There’s been an overall reduction in clouds allowing an increase in absorbed solar radiation (ASR). There was a graph posted here not too long ago, but I can’t remember by whom. The data was from the CERES mission through 12/23. We already knew from Dubal/Vahrenholt 2021 that ASR had increased this century, but it took another move upward following the HTE eruption.
More sunlight reaching the surface plus El Nino seems like a pretty logical reason for increased temperatures.
It didn’t. And it doesn’t matter.
An El Bamb-nino?
Months are not seasons.
Basically this says that El Nino is tanking and will be gone before summer.
Here in Britain people have been watching te weather for at least 5000 years – ever since it became agrarian.
I find it extraordinary that modern climatologists find patterns that no one else has noticed in 5000 years.
El Niño is affecting a large increase in temperatures in the tropics, as the reversal of the equatorial current in the central Pacific affects air circulation, which significantly slows down easterly winds. Therefore, the temperature of the entire tropical Pacific increases significantly. The eastern Pacific is affected by the cold Humboldt surface current, which pulls water from the south. When the easterly winds at the equator weaken, the action of the Humboldt current weakens, allowing the surface temperature to rise. As a rule, El Niño occurs after the peak of solar activity.
Ireneusz Palmoski:
“As a rule, El Nino occurs after the peak of solar activity”
No, with 100% correlation, an El Nino occurs after there has been a DECREASE in atmospheric SO2 aerosol levels (for several reasons), which raises temperatures due to the cleaner, less polluted air, and not due to any changed solar activity.