Guest essay by Larry Hamlin
The NASA GISS global average temperature anomaly for November 2023 was released (provided below) which shows an El Niño driven value of 1.44 degrees C (2.592 degrees F) with the November outcome hyped in an L A Times article as being “a new monthly record for heat” and the “hottest November”.
This GISS anomaly value represents a November global absolute average temperature of 59.792 degrees F.

The prior highest measured GISS November global average temperature anomaly was in the year 2020 with a value of 1.10 degrees C (1.98 degrees F) which represents a November global absolute average temperature of 59.18 degrees F – a difference of 0.612 degrees F which the Times has hyped as being the “hottest November”.
The highest prior GISS measured EL Nino year average temperature anomaly was in 2016 at 1.37 degrees C (2.466 degrees F) which represents an absolute temperature of 59.666 degrees F – a difference of 0.126 degrees F (1/8th of a degree F) from the November 2023 EL Nino driven anomaly value.
The climate alarmist propaganda media misleadingly exaggerate the small average temperature anomaly differences between these measurements by deliberately concealing the specific numerical value of such differences and instead hyping these carefully hidden small differences as being “a new monthly record for heat” and the “hottest November” even when the latest measured GISS global anomaly value is only 1/8th of a degree F changed from the highest prior year 2016 EL Nino value.
The L A Times climate alarmist article continues to conceal and downplay the overwhelming importance of the large year 2023 El Niño event with the obvious impact that such a naturally occurring global wide climate event has in hugely increasing both absolute and anomaly temperature measurement outcomes around the world.
The Times article ridiculously hypes (shown below) that November 2023 is the “sixth straight month to set a heat record” that “has truly been shocking” with people “running out of adjectives to describe this” when the NASA GISS data shown above clearly establishes that this many month-long pattern of increasing anomalies is completely consistent with the year 2016 Global El Nino event which experienced 7 straight months of increasing anomalies from October 2015 through April 2016.

The GISS November 2023 global average temperature anomaly represents a mathematically derived composite average value of all global average temperature anomaly measurement data representing an extraordinary array of five disparate global climate regions (shown below) along with the huge disparate climate behavior differences present in the global hemispheres with their unique and far flung oceans, continents, mountains, deserts, rain forests, low lands, etc.

The mathematically contrived global average temperature anomaly result is created through a composite menagerie of widely disparate climate region data outcomes that apply to no specific region or location anywhere on earth.
Additionally, climate alarmist hyped claims of “limiting global warming to 2 degrees C (temperature anomaly value) above pre-industrial times” are based on a climate model referred to as RCP8.5 that was rejected by Working Group I, The Physical Science, of the UN International Panel on Climate Change (IPCC) Assessment Report (AR6, 2021).
The climate alarmist propaganda media erroneously misrepresent the contrived global average temperature anomaly data in support of their hyped climate alarmists claims while ignoring and concealing extensive anomaly and absolute temperature measurement data that conflicts with their highly contrived global average temperature anomaly driven methodology.
Extensive NOAA anomaly and absolute temperature measurement data is readily available for the Contiguous U.S that addresses both average temperature anomaly measurements as well as maximum absolute temperature measurements.
The graph below shows NOAA’s average temperature anomaly measurements through November 2023 for the Contiguous U.S. which clearly demonstrates there is no increasing trend in the average temperature anomaly data for the Contiguous U.S. using the most accurate USCRN temperature measurement stations that went into operation in 2005.

The NOAA November 2023 El Niño year average temperature anomaly value is 1.44 degrees F compared to the prior November 2016 El Niño year average temperature anomaly value of 4.88 degrees F.
Furthermore, the highest measured NOAA Contiguous U.S. November average temperature anomaly value from the USCRN temperature measurement stations was also the November 2016 El Niño year outcome of 4.88 degrees F compared to the November 2023 El Nino year value of 1.44 degrees F.
The next highest NOAA Contiguous U.S. November average temperature anomaly outcomes following the 4.88-degree F year 2016 value occurred (highest to lowest order) in the years 2020, 2009, 2017, 2021, 2005, 2015 and then 2023 respectively.
Thus, the November 2023 Contiguous U.S. average temperature anomaly value is only the 8th highest measured by the USCRN for the month of November.
The L A Times alarmist article conceals the most relevant Contiguous U.S. year 2023 climate average temperature anomaly data available from its readers with that data clearly showing the lack of any record-breaking climate anomaly outcomes in the Contiguous U.S. region.
Instead, the Times article hypes a contrived global average temperature anomaly outcome that applies nowhere on earth while at the same time falsely positing that this contrived global anomaly outcome is relevant to the Contiguous U.S. region.
The NOAA climate data shown below provides the November 2023 absolute maximum temperature measurements for the period 1895 to 2023 in the Contiguous U.S. that establishes the November 2023 outcome is only the 109th highest out of 129 maximum November temperature measurements recorded during the 1895 to 2023 period.

The NOAA data below provides the maximum November 2023 year to date interval temperatures in the Contiguous U.S. for the period 1895 to 2023 establishing that the year 2023 January through November absolute maximum temperature is only the 115th maximum temperature interval out of 129 maximum interval temperature measurements.

The NOAA data below provides the absolute maximum temperatures for all months between 1895 and November 2023 for the Contiguous U.S. establishing that month of November 2023 is only the 592nd highest maximum temperature out of 1547 absolute maximum temperatures measured with the highest ever measured maximum temperatures occurring in the dust bowl era of the 1930s.

NOAA has extensive temperature measurement data available for 9 U.S. Regions as shown in their Map below with access to this data obtained through NOAA’s Regional Time Series option at the links noted for the above graphs.

Without belaboring this analysis any further all NOAA’s 9 Contiguous U.S. climate regions measured data establish that November 2023 does not represent the highest absolute maximum temperature for any of these regions regardless of whether one is evaluating just the month of November, the January to November period interval or all months over the period 1895 through November 2023.
NOAA also has data available for all 48 Contiguous U.S. states as well as for Alaska using NOAA’s Statewide Time Series option available at the links noted above.
NOAA data for California establishes that November 2023 does not represent the highest absolute maximum temperature regardless of whether one is evaluating just the month of November, the January to November period interval or all months over the period 1895 through November 2023 as shown below where November 2023 is only the 602nd of 1547 absolute maximum temperature outcomes during 1895 to November 2023 period.

NOAA’s extensive and readily available climate data for the Contiguous U.S. (both average temperature anomaly and absolute maximum temperature measurements) clearly shows that climate alarmist propaganda claims of a “climate emergency” (including such claims in the L A Times) are unsupported by NOAA average temperature anomaly and absolute maximum temperature climate data measurements.
Additionally, this extensive NOAA data is deliberately concealed by climate alarmists while at the same time erroneously misrepresenting the critical climate science differences between maximum absolute temperature and average temperature anomaly data measurements.
“instead hyping these carefully hidden small differences as being “a new monthly record for heat” and the “hottest November” even when the latest measured GISS global anomaly value is only 1/8th of a degree F changed from the highest prior year 2016 EL Nino value.”
Itisn’t hype; all those things are true. Here is a stacked graph showing the various monthly values of global average. Each rectangle goes from the month temperature of the year shown by color, down to the next higher year. Black is 2023; the pinkish color is 2016. The dataset is TempLS, virtually the same as GISS.
Even the YTD for 2023 is about 0.14C higher than any previous year, and December will only increase that.
Here is the underlying table of values for that graph, this time with GISS data:
The month averages are in descending order, with year shown by colored square.
I’ve looked into the GHCN to extract information on the distribution of maximum and minimum temperatures rather than focusing on anomalies. There’s a lot of missing data, especially in the vicinity of the Arctic Circle, and the scarcity of weather stations just exacerbates the issue. That’s why I find it puzzling that when the monthly GHCN map is published, the entire area appears bright red, almost as if someone simply used a crayon to color it all in. Averaging temperatures over fixed periods isn’t very informative since the climate doesn’t neatly reset every 30, 60, or 365 days – it’s a chaotic system. The satellites still offer some utility as they cover all Earth’s grids, allowing them to capture natural events like ENSO in the best possible way.
You can visualise the GHCN (and ERSST) data for average anomaly here. It’s average, not min/max, but it shows the stations reporting. It’s a globe like Google Earth, where you can turn it, and zoom in. The coloring is by station anomaly interpolated over each triangle, so it is accurate at each station. You can click on stations for numerical dtat, and ask for display with or without stations marked. It has a glitch that I have had trouble fixing, where a few triangles don’t get colored. Here is a hemisphere showing how Eastern US was relatively cool in November; stations are not shown
And here is a closeup of the US, now with statios shown
Is that Earth or Mars?
It appears to be bassackwards to me. Looks like they’ve taken the average anomalies and worked backwards to fabricate some sort of regional pattern. All they had to do was to take the actual temperatures from each station and build up from there but no, that’s obviously far too old-fashioned for such a progressive thinker like little Nicky.
“All they had to do was to take the actual temperatures from each station and build up from there”
That is exactly what is done. For that month, the measured temperature for that station has its climatological mean subtracted and color assigned according to the scale. Then a triangle mesh is haded in between those colors. Here is some detail of the US part showing the mesh:
So the “measured mean” temperature (an “averaged” construct) then has another “averaged temperature” construct (the climatological mean) subtracted.
And the plot just gets thicker from there on?
(as happens in most mystery thriller scripts)
Sir Arthur Conan Doyle would be Stoked.
(sorry Nick, couldn’t stop myself)
I was thinking the exact same thing. Why bother using anomalies when you have actual temperatures unless you’re trying to hide something?
I note that Nick evaded your question, never actually providing an answer.
Anomalies are assumed by climate science to “normalize” the temperature variations at different locations, hemispheres, or whatever thus allowing them to be compared.
It’s just like the assumption that all measurement uncertainty is random, Gaussian, and cancels – i.e. garbage.
The climate science assumption with the anomalies is that their variances all cancel thus allowing direct comparison using averages.
Climate science is just chock-full of statistical garbage like this.
It’s even worse than that. You are a race car owner. Your crew chief has measured the braking force each of two cars have.
Car 1 @ 200 mph can initiate a rate of change of 1 fps.
Car 2 @ 100 mph can initiate a rate of change of 5 fps.
The crew chief tells that the cars can generate a rat of 3 fps. You see every other car on the track outbreaking your fast car. Yet the crew chief told you that it should be close to average.
Do you blame the driver?
If you want to combine multiple station records, you can’t use the absolute temperature unless both station records have the same length and are not missing any values. Otherwise you will introduce spurious trends into the resulting dataset. Anomalies avoid this problem because the datasets are normalized to a common baseline.
Research has also shown that anomalies are correlated over much larger distances than the absolute temperature, which helps in areas with low station density. The reason for this is trivially intuitive from common experience – the temperature above my driveway is rarely the same as the temperature under the trees in my back yard, but if it’s a hotter than normal day on the driveway it’s almost certainly going to be a hotter than normal day in the back yard, even though the definition of “hotter than normal” is different for both areas.
Note: assertion without evidence.
https://agupubs.onlinelibrary.wiley.com/doi/10.1029/JD092iD11p13345
OMG!
“Error estimates are based in part on studies of how accurately the actual station distributions are able to reproduce temperature change in a global data set produced by a three-dimensional general circulation model with realistic variability. ” (bolding mine, tpg)
And you claim this study is EVIDENCE? Comparing actual station data to that produced by a MODEL?
And exactly *what* is REALISTIC VARIABILITY? Someone’s GUESS?
As always, it is models all the way up, down, left, and right.
It sounds like the abstract piqued your interest, so maybe you should now go and delve into the study to get the answers to your questions.
YOU are the one quoting the study as an authority. It is thus YOUR responsibility to show how it supports your claim, not mine. *YOU* supply the answers, not me.
You asked for evidence, I provided it. The questions you have are answered in the manuscript, and I do not need to copy and paste the entirety of the document here, you are a big boy and more than capable of clicking a link.
You provided NOTHING! You gave a link to a document that says physical data is in error while model data is accurate!
You can’t even answer as to how that can be a valid assumption! And the document doesn’t answer it either!
You got caught using an argumentative fallacy and now you are trying to weasel your way out of it. My guess is that you didn’t even bother to actually read the document – you just looked at the title and cherry-picked it. Have you been taking lessons from bellman?
His evidence is a study that compared actual station data to that from a a MODEL with “realistic variation”!
In climate science, its ALWAYS models all the way down. And the models are always assumed to be 100% accurate and realistic! It’s the ACTUAL STATION DATA that creates the errors!
And that these “experts” possess the necessary knowledge to go back and edit historic data, claiming they are able to “remove” biases.
“Anomalies avoid this problem because the datasets are normalized to a common baseline.”
Anomalies do *NOT* avoid this problem!
Winter temps have a higher variance than summer temps. When you subtract a constant (the long term average) from those temps the anomalies thus generated will reflect the very same variance differences! You can’t avoid that. All you can do is “ass”ume it away.
You cannot average distributions with different variances and get a physically meaningful value. The variance in height of Shetland ponies is smaller than the variance in height of quarter horses. If you average the heights of Shetlands and use that to calculate an anomaly for a herd of Shetlands versus doing the same thing for quarter horses the variance of the anomalies produced for the Shetlands will be different than the variances for the quarter horses. Averaging those anomalies, a set for Shetlands and a set for quarter horses, WILL TELL YOU NOTHING PHYSICALLY MEANINGFUL about either herd or even for horses in general.
You are trying to defend doing the exact same thing for temperatures and give the result some kind of physical meaning. The truth is that there is *NO* physical meaning you can discern from what you calculate!
“Research has also shown that anomalies are correlated over much larger distances than the absolute temperature, which helps in areas with low station density”
What research? Are you trying to tell me that the variance of temps in San Diego and Boston are the same as the variance of temps in Lincoln, NE? Are you trying to tell me that the variance of temps on the north side of the Kansas River valley as on the south side? If so then explain why weather forecasts are always given for north of I-70 (which parallels the river valley) separately for locations south of I-70? The river valley is only 20-30 miles wide, that is not even a “large” distance! The variance of temps on top of Pike’s Peak is different than the variance of the temps in Colorado Springs, just a few miles away!
Once again, most of the temp correlation studies I have seen are actually looking at the correlation in time and the sun’s travel across the earth and not at the correlation of the temps themselves. Of course the temps are going to go up during the day and down at night (typically). That doesn’t mean the temps themselves are correlated, terrain, geography, elevation, humidity, etc usually legislate against temps being highly correlated even just a few miles apart. And if they are not highly correlated then you cannot just assign the temps at one location to another location without considering the intervening terrain, geography, etc. And none of the studies I have seen take that into consideration!
“the temperature above my driveway is rarely the same as the temperature under the trees in my back yard, but if it’s a hotter than normal day on the driveway it’s almost certainly going to be a hotter than normal day in the back yard,”
That does *not* mean the variance of the temps in the two locations are the same. And if they are not the same then the anomalies won’t be the same either. Meaning you can’t just substitute one for the other.
I have three different thermometers at my location, one on the porch on the north side of the house, one under the deck on the south side of the house, and one out in the middle of a 3 acre plot which is at least 50 yards from any building or equipment. Not only are the temps usually different, the variance in the temps are different also. And none of them are highly correlated with the thermometer at the Forbes AFB about 1.5miles from my location. Humidity is different (I live in the midst of soybean and corn fields vs a flat airport with lots of concrete/asphalt/etc). Wind is always different. Temperatures are always different. Even air pressure can be quite different.
You simply can’t say that because temps at two different locations both go up during the day that the temps are correlated and you can substitute the temp at one location for missing temps at another location. That just totally ignores physical reality!
What you need to do is not remove the variance, but to move the series onto the same baseline (so they have a zero that is aligned). That is all you need to do to resolve the problem I described (needing to combine records of varying lengths).
Doing this can’t give you breed-specific insights, but it can absolutely yield meaningful information about horse populations in general. Nobody ever said that the global temperature anomaly yields regional insights, it’s used as a generic metric to track the energy content of the climate system. If the global mean anomaly is low enough, the planet is in an ice age. High enough, and the poles are ice free. And everything in between. This is useful information to track. Nobody ever said the investigation ends there.
“What you need to do is not remove the variance, but to move the series onto the same baseline (so they have a zero that is aligned). That is all you need to do to resolve the problem I described (needing to combine records of varying lengths).”
Malarky! You cannot change the variance of two distributions by just moving them along the x-axis!
If the variances are different that implies that the ranges are different also. If one distribution has a range of 10 with a median of 5 and a second one has a range of 20 with a median of 10 then shifting the distribution with the range of twenty along the x-axis so its median becomes 5 WON’T CHANGE THE DIFFERENCES IN THE VARIANCE! Neither will shifting the distribution with a range of 10 so its median is no 10.
The anomalies generated by the two different distributions will inherit the same variances as the distributions themselves. Meaning that the average of the anomalies will remain meaningless.
If the average height of Shetland ponies is 4′ and that of quarter horses is 5′ you are claiming that by adding 1′ to all the heights of Shetland ponies you can somehow change the variance in heights of the Shetland’s to be the same as the variance in the heights of the quarter horses!
Where did you learn your statistics?
“Doing this can’t give you breed-specific insights, but it can absolutely yield meaningful information about horse populations in general.”
Again, MALARKY!
What you have is a multi-modal distribution! Neither the average or the median tell you anything useful! Every statistics book I have says you should describe the distribution you get using the 5-number description or something similar. I’ll ask again, WHERE DID YOU LEARN YOUR STATISTICS?
The *exact* same thing applies to temperatures. When you combine winter temps with summer temps you get a multi-modal distribution. The average is meaningless. And using anomalies doesn’t help since they inherit the variances of the underlying absolute temps. Temperature variance is a vital piece of knowledge for determining climate as are the absolute temps. The variance of the temps in a coastal city is vastly different than the variance of the temps in a high plains city. Yet you would have us believe that they have the same climate if the average anomaly is the same!
“it’s used as a generic metric to track the energy content of the climate system.”
Temperature is the most piss-poor metric for energy content there is. Energy content is highly dependent on humidity and pressure. If it wasn’t then Las Vegas (low humidity) and Miami (high humidity) would have the same climate! Have you *ever* looked at a set of steam tables?
You might be able to fog your CAGW buddies with all this crappola but you aren’t fooling anyone that has ever spent any time in a tent in below zero weather or time in Boston vs Topeka, KS both in the summer and winter.
You are as bad as bellman and bdgwx – totally unable to relate statistics to the real world. Statistics are *NOT* the real world. the real world is the real world. And in the real world you have humidity, pressure, terrain, geography, prevailing winds, elevation, etc. None of which are considered in averaging temperatures in climate science. You also have measurement uncertainty in the real world, you can’t just assume it all cancels. Buildings and bridges collapse when you do that!
I did not say that you could. I said that you can place the two series onto a normalized axis and remove spurious trends that arise from combining records of different lengths.
Of course I’m saying nothing of the kind, but tilting windmills does seem to be the favorite passtime of WUWT acolytes.
I’m saying that if you observe the mean height of the horse population changing through time that that is relevant information about horses. Obviously you cannot say from the population mean whether there has been a change in the height of shetlands or in quarter horses, but now you know that there is change occurring that you should be investigating.
“I did not say that you could. I said that you can place the two series onto a normalized axis and remove spurious trends that arise from combining records of different lengths.”
Still malarky! If the distributions are not identical, i.e. don’t have the same variance, then exactly what does shifting one of them along the x-axis do as far as eliminating spurious trends?
A statistical description of a distribution includes *both* the average and the variance. All you are doing is changing the average value by adding or subtracting a constant. That does *NOTHING* to normalize the variance!
“Of course I’m saying nothing of the kind, but tilting windmills does seem to be the favorite passtime of WUWT acolytes.”
If that is not what you are saying then exactly HOW are you treating the distributions to give them the same variance? If they don’t have the same variance then they are not identical distributions!
What you are implying is that you can make a multi-modal distribution into a uni-modal distribution merely by shifting one mode along the x-axis regardless of whether each mode has the same variance!
It is this kind of idiotic statistics that makes climate science into such a laughing stock!
“I’m saying that if you observe the mean height of the horse population changing through time that that is relevant information about horses.”
If you can’t identify what changed then knowing it changed is totally useless! Why is that so hard to understand?
“you should be investigating”
Investigating what? What is climate science investigating? It’s all CO2 and models based on CO2 growth! All based on not knowing what exactly is changing as far as temperature is concerned! The minute you use (Tmax + Tmin)/2 you have lost the very data you need to determine what is happening! Ag science tells you that growing seasons are expanding while grain crop harvests are setting records! Who in climate science is investigating why that is? It isn’t from the planet burning up or the oceans boiling!
Here’s an excerpt from a 2018 study on crop harvest variability: “Weather variability in general (1, 15, 16) and the frequency and intensity of heat waves and droughts are expected to increase under global warming ”
Really? The physical data shows that heat wave and drought intensity is *NOT* increasing. Who in climate science is investigating why that is using actual physical data instead of models?
Pretending that multi-modal distributions can be treated as if they are uni-modal is just part and parcel of the idiotic meme’s climate science uses to make things “easier”, regardless of whether it is physically meaningless or not!
It feels like you and I have been down this road before. But one more time for the folks in the cheap seats, here is an illustration. Take two records of unequal lengths (station B doesn’t start reporting until 1950):
Take their average:
You should, if you are observant, see that there is a problem. The average doesn’t look like it is representative of the trends in either series. They both seem to show slightly negative trends, but the average is sharply positive! Now calculate the anomalies, using the 1951-1980 reference period for the baseline:
And take the average of the anomalies:
Well, that’s a bit better! Now the mean actually seems to be representative of the trends in the individual series. This is one of the important reasons to use the anomaly: it allows us to combine records of unequal lengths. Our alternative would be to dump any records shorter than the longest (data loss), or to infill missing values (more uncertainty).
Notice we are not normalizing the series to have the same variance, we are just setting them to a common zero.
You probably don’t even know what you have actually shown. You are displaying how manipulating data allows you to show what you think is correct.
“If the global mean anomaly is low enough, the planet is in an ice age. High enough, and the poles are ice free. And everything in between.”
And yet we are told we just lived through the hottest year on record, while Arctic ice is no where close to as low as it has been.
And when it was lower in recent past years, it was not the hottest year ever.
So, either your idea about that correlation is wrong, or what we are told about temperature is wrong.
Or both.
Warmistas have recited a litany of disasters for many years, that they have insisted would categorically occur if the globe heats up.
Those disaster scenarios and events have failed to transpire, even as we are told the globe has heated up and is now hotter than ever.
So which is wrong?
How should we be expected to believe people that say such things, especially when we know they make stuff up and alter historical records? And then lie about making stuff up and altering records?
Year to year variability in Arctic sea ice is controlled by more factors than just ambient air temperature. The thing to look at is the trend. The long term (decades +) trend is being driven by a change in temperature in the Arctic.
Most of the more dire consequences of climate change have not been projected to happen for several decades to come. You can’t say something has “failed to transpire” when it is supposed to transpire at a future date.
“What you need to do is not remove the variance, but to move the series onto the same baseline (so they have a zero that is aligned). That is all you need to do to resolve the problem I described (needing to combine records of varying lengths).”
I think you have no spent nearly enough time outside for long stretches of time, making careful observations of weather conditions under every possible circumstance, and in different types of environments.
Microclimates vary hugeley over short distances, and the amount of this variance also varies gigantically.
Under some conditions, a rural farm area may be ten to fifteen degrees colder than areas nearby, even while on most days and nights, it rarely more than a few degrees different.
On one of the few nights a year that Florida has radiational cooling events with light winds and low dewpoints at all levels of the atmosphere, cold pockets form where the temperature is far below freezing, while higher terrain nearby, or the places where there is habitation and hence paving and homes and other buildings, it is in the mid-40’s.
The some high clouds blow in on the jet stream and the farm jumps up in temp 10 degrees within minutes, but the warmer spots do not change.
Go out west to places with huge changes in terrain and ground cover, from forests to rocky deserts within a few miles, and the situation is so much more complex, an such variances are so much more commonplace.
I wonder if microclimates are taken into account at all?
Because it sounds like the idea you are suggesting is about like declaring that microclimates can be ignored.
Which is something only someone who spends a lot of time inside, and little time outside observing in all conditions and all times of day and night in all sorts of places, could ever say. Or think.
But then, many of us know this full well.
The people that do climate modelling are generally not the same people that spends long lonely hours outside observing over many years.
from Hubbard and Lin, 2006:
“ For example, gridded temperature values or local area-averages of temperature might be unresolvedly contaminated by Quayle‘s constant adjustments in the monthly U.S. HCN data set or any global or regional surface temperature data sets including Quayle‘s MMTS adjustments. It is clear that future attempts to remove bias should tackle this adjustment station by station. Our study demonstrates that some MMTS stations require an adjustment of more than one degree Celsius for either warming or cooling biases. These biases are not solely caused by the change in instrumentation but may reflect some important unknown or undocumented changes such as undocumented station relocations and siting microclimate changes (e.g., buildings, site obstacles, and traffic roads).”
‘Spurious trends’ hahaha.
You do realise, don’t you that the station siting requirements were a way of establishing a common frame of reference for all temperature stations? That by ignoring these and including airports and urban stations you have introduced random variables that cannot be allowed for and, therefore, your datasets are now nothing but ‘spurious trends’ in their entirety? Your weak excuses aside, the datasets are complete and utter junk.
Btw – the very fact that you think using temperatures taken under some trees and in your driveway is perfectly fine leads me to the conclusion that you should never, ever take a professional temperature reading.
In the US, at least, the entire monitoring network was historically run by volunteers. So you can set requirements and guidelines, but you can’t really enforce them. Nor can you prevent, say, a parking lot from being built in what used to be a nice open green space. Nor can you prevent stations from being relocated when necessary. So you wind up with a transient station network whose composition changes through time, and you are forced to do your analysis within this context.
Since 2005 or so in the US, we have the pristine reference network, but we don’t have time machines to go back and install that network a century ago. So scientists do the best that can be done with existing historical data. Happily, the full, adjusted network is near perfect agreement with the reference network over their period of overlap:
Making scientists confident that the identified trends are not spurious or unduly influenced by non-climatic biases.
Always on WUWT there is an insistence that the data either have to be completely perfect and without a single flaw or we cannot use them, and I think this is unscientific and antithetical to the advancement of human knowledge. Never, ever, not once ever, on WUWT is there discussion of “here is how we would approach the analysis using imperfect datasets,” it’s always just “let’s close our eyes and pretend like we live in complete darkness.”
“you are forced to do your analysis within this context.”
That analysis cannot simply make things up in order to make things easier. If that means having to use shorter station data lengths then so be it. Include that as part of the analysis write-up. Making up “adjustment” data is *NOT* the way to do it!
“So scientists do the best that can be done with existing historical data. “
NO, they do not do the best they can. If they did they would use the measurement uncertainty associated with the data to say “we can’t actually tell what is going to happen in the next 100 years”!
“Making scientists confident that the identified trends are not spurious or unduly influenced by non-climatic biases.”
Not a single post you have made or link you have given has done one solitary thing to analyze the measurement uncertainty associated with the temperature record data sets. NOTHING. NADA. ZIP!
“Always on WUWT there is an insistence that the data either have to be completely perfect and without a single flaw or we cannot use them”
NO!!!!! That is *NOT* what is being insisted on! You are just whining. What is being insisted upon is that climate science do a valid analysis of the uncertainties associated with the data. The only ones assuming the data is perfect is climate science, including you!
Metrology protocol says that any statement of measurement, including the GAT, should have associated with it an uncertainty interval: “stated value +/- measurement uncertainty”.
When have *YOU* ever given any kind of uncertainty interval for anything associated with temperature?
Everything that is done as a part of the temperature analyses is included as part of the documentation.
Here is NASA’s GISTEMP analysis with the uncertainty estimate plotted:
And here is a link to the paper describing in detail NASA’s uncertainty analysis:
https://pubs.giss.nasa.gov/abs/le05800h.html
I’m happy we are able to put this myth that climate scientists ignore uncertainty to bed once and for all.
“Everything that is done as a part of the temperature analyses is included as part of the documentation.”
No, it isn’t. Can you tell me the systematic measurement uncertainty in the temp measuring device at Forbes AFB? At Moffat AFB? At the Topeka Municipal Airport?
If you can’t then the temperature analyses are NOT documenting all factors.
Can you give me the current systematic measurement bias for ANY measurement device in any temperature data base?
If you can’t then how can you say that all involved factors are being documented?
These NASA goobers are claiming ±0.2K air temperature uncertainty in 1880.
I call bullshit.
So does Berkeley Earth data.
You’ve opened pandora’s box. The Gormans, karlomonte, etc. will seize this opportunity to reject well established procedures for assessing uncertainty making numerous algebra mistakes in the process some so egregious a middle schooler could spot them.
If history is any guide then the discussion of uncertainty will devolve quickly and yield hundreds of posts. For that reason I’ll try to keep my own separated in a different subthread so as not to disrupt the flow here.
The Gorman twins do seem to have a proclivity for this topic and seem to have developed quite a cult of thought around their peculiar ideas. I appreciate your comments on the subject, I run out of patience trying to wade through the quagmire.
Yer an idiot as well as a troll.
beeswax and bellcurveman will welcome you with open arms.
You and climate science are stuck in 19th century methodologies. It’s obvious when you continue to use the standard deviation of the sample means as the accuracy of the mean as well as writing an average as “stated value” only instead of “stated value +/- uncertainty”.
NO ONE involved in metrology in the real world accepts “stated value” as acceptable today. Not even in the GUM. Yet that is *all* that climate science uses. It is based on the meme (never actually stated) that all uncertainty is random, Gaussian, and cancels. So the average is always 100% accurate.
Even the hidebound medical establishment has recognized that the use of the standard deviation of the sample means is not an acceptable metric for the accuracy of the average. Yet climate science stubbornly keeps right on using it.
Calculating the average of a huge number of inaccurate data points does *NOT* increase the accuracy of the calculated average. Never has and never will – unless you are a climate scientist!
stated value +/- uncertainty:
No one ever said it did. The precision of the estimate of the mean increases with a larger sample size, there might still be an inaccuracy arising from non-random bias. You need to use adjustments to deal with non-random bias, but you don’t like adjustments.
You keep talking past everyone and deliberately misunderstanding everything they say. I’m not sure how you find this a fulfilling way to spend your time.
±0.2K in 1880 is absurd, and not a single one of you trendology goobers can see this.
You don’t know WTF you yap about.
Do please substantiate this assertion.
Are you blind? Can you not see what is on the very graph that YOU posted?
Dearest karlo, I am obviously talking about your assertion that the shown uncertainty is absurd. That is what I want you to substantiate.
The instrumental uncertainty of LIG thermometers prior to 1890 is at least ±1 K.
We are not talking about the instrumental uncertainty of a single thermometer, we are talking about the uncertainty in the global mean temperature anomaly analysis prepared by NASA. Can you speak to this?
Yeah, its like thinking you can reduce entropy. Where did the numbers from 1880 come from? A model?
And the GAT is a meaningless index that tells nothing about climate.
Well they came from the same places that the numbers post 1980 came from. Have you read any of the relevant literature on this subject? You seem to have awful strong opinions about NASA’s temp products for someone who doesn’t seem to know much about them.
You are a data fraudster who pushes the clownish line that “biases” in historic temperature data can be “removed”, apparently NASA is part of this clown show as you here regurgitating the same fiction.
Do you expect to be treated seriously?
We *HAVE* been speaking to it. And your only reply is to continue stating the climate science meme that all measurement uncertainty is random, Gaussian, and cancels. It can therefore be totally ignored and all averages and anomalies can be assumed to be 100% accurate!
It is as simple as understanding that the standard deviation of the sample means is *NOT* the uncertainty of the average. It is a measure of the uncertainty of the sample means, not of the average.
σ or σ^2 of the population is the proper measure of the uncertainty of the average. And σ^2 = (standard deviation of the sample means) * sqrt(n).
σ^2 goes UP as n goes up!
I’ve not said this once, or alluded to it. Only you have.
A larger sample makes the estimate of the population mean more precise. You and I agree on this. It does not make the estimate of the mean more accurate because there might be a source of systematic bias in the sample. And I think you and I both agree on this. So why you’re acting like we’re in an argument about it is puzzling.
And no, you haven’t spoken a single word about the uncertainty analysis from NASA cited above.
What is YOUR background in formal uncertainty analysis?
How do YOU know this NASA bunch knows WTH they are doing?
Just because you found it in a journal paper?
You (and they) believe that anomilization reduces LIG temperature measurement uncertainty by a factor of at least 5.
This is a lie: subtracting a baseline increases uncertainty.
Yet you keep arguing that the GAT is accurate. The only way that can be is if all systematic bias is random, Gaussian, and cancels. The meme that permeates the entirety of climate science.
You seem to want your cake and to eat it too.
Or are you agreeing that the GAT calculated out to the hundredths digit is a useless piece of garbage?
You are not showing uncertainty. You are showing how precisely you have calculated an inaccurate mean using inaccurate data.
Why does that keep escaping your understanding?
Precision is not accuracy!
The GISTEMP uncertainty analysis includes estimates for uncertainty arising from systematic biases, which, having read the relevant literature, I’m sure you already know. The range of uncertainty thus encompasses the precision and accuracy of the analysis. There’s a 95% chance that the right answer is inside that envelope.
Actually it does *NOT* make estimates of the measurement uncertainty. It only makes estimates of how precisely they have calculated the inaccurate average from inaccurate data.
Precision is *NOT* accuracy.
NASA makes absolutely *NO* provision for the combination of temperature distributions with different variances, e.g. winter vs summer temps in opposite hemispheres.
They, like you, assume that all temperature distributions have the same variance so it can be ignored!
“There’s a 95% chance that the right answer is inside that envelope.”
There is a 95% chance that the inaccurate average obtained from inaccurate data is within the envelope of the averages of the samples.
If the population data is inaccurate then the sample means will be inaccurate and, in turn, the average calculated from those sample means will be inaccurate.
It simply doesn’t matter how many digits you use in calculating the average of the sample means, that average of the sample means will still be inaccurate if the sample means are inaccurate. And if the population data is inaccurate then the sample means will be inaccurate also.
Why can’t you address this? Why are you and the rest stuck in the meme that the standard deviation of the sample means tells you how accurate the average calculated from those means is? Why do you ignore the inaccuracy of the sample means/
Again, NASA’s uncertainty estimate includes consideration of uncertainty imparted by systematic bias. The uncertainty envelope includes uncertainty arising from inaccuracy.
“inaccuracy” — a big tell that you know next to nothing about the subject.
How do you fit ±1K into a ±0.2K “envelope”?
You haven’t read or understood anything I’ve written.
You first need to define your measurand. What are you hoping to accomplish.
Let’s say your measurand is the perimeter of a 30 sided irregular table.
How would you go about it.
You would make multiple measurements of each side and using the GUM procedure of finding the mean and the variance and subsequent uncertainty. That will vive a value of P1±u(P1). You do the same for P2 – P30. Then you calculate a combined uncertainty of all pieces.
With temperatures, you get one shot. No multiple measurements of each temp, all you have is Type B for each measurement and the variance of the data.
Let’s say you want to measure the average height of a person in a room with 10,000 people in it. You can measure the heights of 2000 people at most. Explain your process.
What it sounds like you’re saying, to all of us, is that you should only measure the height of a single person in the room, because each time you include another person in your average, your uncertainty of the average height of the people in the room increases due to measurement error. If this is not what you’re saying, please clarify.
I skimmed through this NASA production, looks to me like they confuse error and uncertainty. It certainly does not adhere to the international standard for expressing uncertainty (the GUM).
4.2.1: “The major source of station uncertainty is due to systematic, artificial changes in the mean of station time series due to changes in observational methodologies. “
This is total bullshit, hand-waving.
TOBS which hasn’t been a problem since ASOS.
Says a lot right there. They don’t recognize uncertainty lies in the process of monitoring the temperature.
First, you don’t measure the height of the average person. You measure the height of the population subjects. From that you have a distribution of data. You may calculate a mean, variance, and standard deviation.
From the GUM
Basically, the variance and accompanying standard deviation describe the dispersion of the values that could be attributed to the measurand.
Because of your limited sample of people, it is quite possible there is a large chance that the uncertainty of your mean is very large.
Your very question illustrates your lack of training in making measurements. Your understanding is incorrect.
It is not each measurement that adds uncertainty. It is the effect on the distribution of measurements that each measurement has. If all the measurements cluster closely around a mean, the variance will decrease and the uncertainty will be small. That is, the dispersion of values attributed to the mean will be small.
If the measurements are spread out, the dispersion and uncertainty will be large.
This subject is obviously something you have not studied. It is something every engineering student must learn in lab classes. Making inaccurate measurements just won’t be acceptable. Not understanding influence quantities in evaluating deviations from standards is inherent in engineering.
“First, you don’t measure the height of the average person.”
I think this why a lot of confusion in these discussions. Some people never understand that “the average height of a person”, is not the same as “the height of the average person”.
Alan J was careless in his choice of words.
No. He was entirely correct in his choice of words. It’s the way some insist on thinking average height, means height of the average, that is the problem.
One cannot measure the average of anything directly. It has to be calculated from sample measurements.
It isn’t surprising that you and Alan J are at odds with other commenters here when you don’t choose your words carefully.
“One cannot measure the average of anything directly.”
Of course not. It’s measured indirectly. But that doesn’t mean you are not measuring it.
If you disagree that sampling is a measurement then you need to take it up with NIST and their example from TN1900, which defines the average monthly maximum temperature as a measurand, which can be measured by looking at a sample of daily temperatures.
It’s not even “measured” indirectly. The average is a statistical descriptor, not a measurement. The average doesn’t even have to exist. How can something that doesn’t exist be a measurand?
What people call something and what it actually is don’t always match. You are a prime example of doing that when you say the standard deviation of the sample means is the accuracy of the mean.
And in less than five days, they get to start their out-of-tune orchestra up all over again, using the same bad music arrangements.
This is just quibbling semantics, but that isn’t what I said. I said “Let’s say you want to measure the average height of a person in a room.” i.e the average of all of the heights of all of the people. There are 10,000 people in the room, and all of them have a height, and we can compute the average of those heights. We want to estimate that number. In my example, we are restricted to only being able to measure the height of 2000 of the 10,000 people.
Nothing in the remainder of your response explains how you would approach this task, or if you even think it can be achieved. Care to actually take a stab at it?
You are not familiar enough with measurements to ask pertinent questions. Here is an article that is an excellent example of the issues surrounding averages. The big point is that they have variance. In other words uncertainty. Regardless of how accurate your average is calculated there are data surrounding that measurand that must be taken into account when dealing with it.
When U.S. air force discovered the flaw of averages (thestar.com)
This is an excellent example of how the measurements that make up a measurand can each have their own uncertainties and that they all combine into one uncertainty that illustrates the range to be expected.
I know you, programmers, and mathematicians have had basic statistics where sampling theory was discussed. I’ll also guarantee that 99.9% of these basic courses never addressed the issue of how to determine basic measurement uncertainty. I’ll also guarantee that these 99.9% of courses never addressed what to do when height measures were 5’8.25″±0.25″. They all assumed the 5’8.25″ was exact. Prove me wrong.
I know that graduate chemists, physicists, engineers, etc. had senior level lab classes that emphasized measurement accuracy and uncertainty. Their future jobs depended knowing how to guarantee that their work ended up with satisfactory statements of values+uncertainty.
Nowhere have I denied that averages carry uncertainty, nor have I claimed that the average is an ideal metric for every scenario. Those are motes of fairy dust you are swatting at, having imagined them in your head.
And you’ve again failed to even attempt to explain how you might approach the problem posed, or if you even think it is a solvable problem. At this moment it isn’t clear to me if you actually believe the average is a metric that is possible to estimate or use.
So writes the clueless noob who doesn’t understand Lesson One about uncertainty.
You’ve been told at least twice now how to handle this! Can’t you read?
Why do you think piston diameters are given a stated value +/- uncertainty? It’s so engine designers can make sure the cylinders can handle the varying sizes of pistons. They don’t design to a highly precisely calculated average. Nor do they assume that how precisely you have calculated the average tells them exactly what size to make the cylinders.
It works the other way around as well. Pistons are designed to fit cylinder walls with a specified uncertainty. In an ICE engine its done by fitting the pistons with compression and oil rings that can adjust to the size of the cylinder. The piston designers don’t make the pistons to fit a highly precise calculation of the average size of a cylinder wall.
Examples abound EVERYWHERE. The original M-16 rifle as compared to the AK-47. Every place you see a rubber o-ring such as in the end of your garden hose connector!
Every bridge you drive over has been carefully designed to the measurement uncertainty of the shear stress of the beams, not to a highly precise calculated average!
Temperature averages are no different. Any calculation of the average using samples which winds up with more decimal places than in the measurement uncertainty is basically scientific fraud. It’s stating something that you can’t possible know.
Climate science has been getting away with this fraud for literally decades, even centuries. But thanks to people like Mr Watts, Kip Hansen, Pat Frank, etc. more and more people are becoming aware of this. It’s not going to end well for climate science. It’s just a matter of time.
If you could measure 2001 people instead of 2000, would the quality of your evaluation probably improve, or not?
If you measure each person with a different device then the uncertainty of the average will grow with each measurement – exactly what is done with global temperature.
If you measure each person with their shoes on then the uncertainty of the average will grow with each measurement because the soles of shoes vary widely with style and wear.
It’s what is meant when it is stated that you can minimize uncertainty if you are measuring the same thing multiple times using the same measurement device under the same environmental conditions.
If you don’t meet *all* those requirements then uncertainty grows with each additional inaccurate measurement.
And global temperature measurements don’t meet ANY of those requirements.
It’s why the medical establishment has finally understood that the standard deviation of the sample means is *not* the proper metric for judging the accuracy of the mean. It leads to being unable to reproduce results as well as overestimating possible efficacy.
In the end, the “stated value +/- uncertainty” is meant to give other experimenters something they can use to judge the reasonableness of their results as well as to provide what is euphemistically called a “safety margin” when designing something that can fail, perhaps catastrophically – such as a bridge.
The trendologists really hate that uncertainty increases.
this reasoning implies that if you measure enough people your uncertainty will grow to greater than the height of the room. How can the uncertainty be greater than the limits imposed by known quantities?
Error is not uncertainty!
Our friend Tim tells us that the uncertainty grows with each measurement, so soon we will not be able to say whether the average height is greater than the height of the room or smaller than an ant. So you’d say you disagree with Tim?
Your interpretation of Mr. Gorman’s reasoning is erroneous. The key point being stressed to you is that uncertainty increases because the measuring conditions are not consistently stable and comparable.
Furthermore, it is a poor analogy because measuring temperatures is like a room full of people who wander in and out.
You’re an idiot.
Hope this helps.
If the measurements are high precision, the uncertainty will grow slowly. That is a good reason to use high precision because if the uncertainty becomes non-physical, it it telling you that the experiment is designed poorly.
Your comments are always enlightening. Thank you!
If you are measuring different things then high precision may not be as much of a help as you think. The variances of the measurands determines the uncertainty, not the measuring device.
“this reasoning implies that if you measure enough people your uncertainty will grow to greater than the height of the room”
What are you expecting to happen?
As you add people you are going to increase the range of the heights you encounter. Range is an indication of the uncertainty of an average. The wider the range the smaller the hump at the average. The distribution gets squished. Variance is related to range. Standard deviation is related to variance.
The range will never exceed the height of the room but the number of elements at the end of the range might grow extending out the standard deviation interval.
At some point you will probably reach an equilibrium that defines the distribution. What makes you think it will be a Gaussian distribution when different measuring devices and different environments are involved?
If it isn’t Gaussian then you can’t assume any specific level of cancellation that would reduce uncertainty, at least not with out some involved statistical analysis – which climate science does *NOT* do.
And even if the distribution looks Gaussian you *still* can’t account for the systematic bias introduced by the different measuring devices and/or the different measuring environment.
The best you could do is say the different measurement devices introduced an uncertainty of x inches. The different shoe designs introduced an additional uncertainty of y inches.
Did everyone stand at parade attention with their feet flat on the floor or did some slump and some didn’t have their heels against the wall? Add in some uncertainty for that, z inches.
Did the group consist of men and women? Those of Nordic descent and those of Mexican descent? Did you wind up with a multi-modal distribution or a Gaussian distribution?
How precisely you calculate the average is meaningless without knowing all the other factors describing the distribution. The SEM only works for a Gaussian distribution because a multi-modal distribution doesn’t even have a meaningful average or standard deviation!
I expect that your model of uncertainty should not allow for impossible things to happen, but yours does. Because we aren’t uncertain about impossible things happening. You claim that the uncertainty will never exceed the height of the room, but you also claim that the uncertainty grows without bound as the number of measurements increases. One of these things cannot be true. But you dont attempt to explain the contradiction.
And as I’ve said as nauseam, I agree that you cannot address systematic bias via taking a large sample. We agree on this point. You address systematic bias by identifying and adjusting for it. You keep arguing as though this is a point of contention.
So it must get smaller? Is this your claim?
Fool.
Little wonder climate pseudoscience is so off in the weeds.
Go buy a battery car.
“Go buy a battery car.”
Coincidentally, I didn’t wait for your permission. Our new Bolt EUV was bought on Friday, and is in our driveway as we exchange posts. Perfect for 95% of our driving, and will result in lower OpEx/mile than any other ICE vehicle.. It will also allow us to extend the life on our ’18 Colorado diesel for the rest of my driving life. We use that to pull our Escape 5.0 TA around El Norte, ~3 months/year, and for lots of family camping.
Don’t worry – we’ll still use the e bikes in clement weather to get us from A to B around St. Louis, and we rack them behind the Escape for trips. That way, we park close, get to see the city/countryside better on the way, and generally enjoy life more.
Is there anything else we should be doing…..?
Oh look, blob is a virtue signaler … what a surprise.
Don’t get it wet, or too hot, or too cold…
Measuring many samples allows one to determine the variance in the population (especially non-stationary time-series), confirm that the probability distribution is close enough to normal to justify most parametric statistical measures, and calculate those statistical measures, which one can’t do with a single measurement. However, the precision of the individual measured samples bounds the justifiable precision of the calculated statistical parameters. That is, if one measures the sample with a crude measuring device, they are not justified in claiming as many significant figures in any of the measurements or calculations as one would be with a high-precision measuring instrument. If one starts with a large uncertainty, it grows rapidly with each additional measurement. That is why high precision (and accuracy) is desired in the measuring device.
How do you distinguish accuracy from precision? Why show a temperature to a precision of +/- 0.01 deg if you think that the accuracy is only +/- 1 deg? It is deceptive because it gives the false impression that the accuracy is known to the same number of significant figures as the precision.
The UAH is guilty of this, they convert irradiance to temperature and save the results in K with five significant digits, 0.01K.
Pat Frank has a document out explaining this in detail. Of course you and climate science ignore the facts because they are inconvenient.
“The precision of the estimate of the mean increases with a larger sample size, there might still be an inaccuracy arising from non-random bias. “
Pure malarky!
Precision is not ACCURACY! Do I need to repost the graphic showing the difference? How many times will you need it reposted before accepting what it shows? I’d like to know.
The uncertainty gray line you are showing is *NOT* the accuracy of the mean, it is the precision with which you have calculated that inaccurate mean!
Where is the non-random bias in your graph? Did you just assume that it would cancel? I.e. that the non-random bias is actually random?
The problem is that everything concerning uncertainty is just whizzing by you right over your head and you simply won’t look up to see it!
IT SIMPLY DOESN’T MATTER HOW PRECISELY YOU CALCULATE THE POPULATION AVERGE IF THAT AVERAGE IS INACCURATE! And the precision with which you calculate the population average tells you *nothing* about the accuracy of the average.
The average uncertainty is *NOT* the uncertainty of the average! The average uncertainty is not a measure of the variance of the population data nor is it somehow a cancellation of systematic bias!
If you had taken the time to understand my comment before replying to it, you would see that I am actually distinguishing between precision and uncertainty using the very same criteria that you are. On this point we actually agree, yet even so you cannot help but take an adversarial tone. It’s a shame.
On the contrary, non-random bias is carefully accounted for in the uncertainty estimate:
But, again, I’m sure I’m just repeating what you already know.
“Uncertainties arise from measurement uncertainty, changes in spatial coverage of the station record, and systematic biases due to technology shifts and land cover changes. “
Stating that uncertainties arise from measurement uncertainty is *NOT* stating that they properly account for it! In actuality they use the same meme you do – all measurement uncertainty is random, Gaussian, and cancels. Thus they can ignore it!
If they *truly* accounted for it then they would be using the formula that the standard deviation of the temperature data is the standard deviation of the sample means *multiplied* by the standard deviation of the sample means. In other words the uncertainty interval associated with their “global average temperature” would *increase* instead of decreasing.
It is the variance of the population data that is the true determinant of the uncertainty of the average, not the precision with which you calculate an inaccurate mean from inaccurate data.
Well, sure, you can’t read only the abstract and conclude that the work is robust. I’ll look forward to your analysis of the actual paper and methodology described therein.
Again, how do you fit ±1K into a ±0.2K “envelope”?
Well said, they are no different from perpetual motion machine inventors trying to defeat entropy.
bgwax is still a clown show.
But nice lits o’haet, always a kook sign.
Put your money where your mouth is dude!
Show us where NIST TN 1900 Example 2 is incorrect.
Use some math and show their errors.
Then show the math as to how you reach a better measurement uncertainty for the same month and what it is?
Good luck! I will keep asking till you answer this.
His entire repertoire of uncertainty consists of blindly stuffing the average formula into the GUM and declaring:
“See! Averaging reduces measurement uncertainty!”
And of course there is the bellcurveman classic line:
“I can’t believe it is that big!”
“I can’t believe it is that big!”
I’m not sure when I said that. But if it’s in relation to the idea that 100 thermometers each with a measurement uncertainty of 0.5°C, could produce an average where the measurement uncertainty was 5°C. Then, yes, I find it hard to see how that is possible.
That’s because you have absolutely ZERO experience in reality.
You simply can’t accept that when you combine 10 2″x4″ boards the accuracy of the final result accumulates uncertainty as you add each board. Make it 100 boards and the inaccuracy of the final length will accumulate even *more* inaccuracy.
If you would *ever* actually work through Taylor’s book on uncertainty, especially Chapters 2 and 3, and actually DO THE EXAMPLES, it should become obvious that uncertainty accumulates when you combine measurements of different things.
Something you and climate science just absolutely refuse to accept. Your ingrained meme is that all uncertainty is random, Gaussian, and cancels. Neither of you can break out of the paper bag formed from that meme.
A lecture on reality from someone who still doesn’t understand that an average is not a sum.
The “well established” procedures you speak of have been abandoned by the medical establishment. It has been specifically recognized in the medial establishment that using the standard deviation of the sample means is *NOT* the proper measure of uncertainty. You’ve been given the links and specific quotes concerning this but you continue to ignore them.
The standard deviation of the sample means tells you *NOTHING* about the accuracy of the mean you have calculated. That can only be determined by analysis and propagation of the measurement uncertainty of the individual data points.
The medical establishment has been searching for reasons as to why so many experiments can’t be replicated. The use of the standard deviation of the sample means as the accuracy of the mean has been identified as one basic reason. It simply doesn’t matter how many samples you take if those samples are not accurate. You can calculate the average of those inaccurate samples down to the millionth digit but the result will still be as inaccurate as the data used to determine the average.
You and AlanJ are prime examples of why climate science remains stuck in 19th century methodologies while the medical establishment, agricultural science, and even HVAC engineering have moved on into the 21st century. Even the GUM has recognized this progression in methodology of determining measurement uncertainty.
Until climate science starts to recognize that the standard deviation of the sample means is *NOT* a measure of *accuracy* of the mean it will not progress past 19th century methodology.
And all they can do is mash the red button, heh.
This is not true. Errors occur. They should be noted in official documents. They can be interpolated to resolve singular errors.
What is not kosher is changing 50 years worth of data just so you can match it up with a recent trend using a different measuring device, different enclosure, etc.
You might tell us why recent measurements are not adjusted to match long records from the past instead of the other way around.
The various issues addressed by the major temperature analyses (GISTEMP, HadCRUT, BEST) are quite thoroughly documented in the literature. Being ignorant of the literature, and then assuming that if they aren’t aware of it then it mustn’t exist (blindness to one’s own ignorance) is something of a hallmark of WUWT acolytes.
It’s an arbitrary choice, but we live in the present, it’s our frame of reference, so it kind of makes sense to adjust past temperatures relative to the present day rather than present day temperatures relative to the past. There is no impact on the end result either way.
You lose! That is not a scientific reason based on data and logic at all.
Have you ever looked at what that does to a “global average temperature? If not, your scientific background is suspect. You can’t make decisions like that without examining multiple scenarios.
Who isn’t aware of the literature?
Have you read Hubbard and Lin’s 2006 analysis showing that regional temperature adjustments are just plain bad? That because of micro-climate differences any adjustments have to be done on a station-by-station basis? I.e. they have to be lab calibrated ON SITE, which is very seldom done?
Why has climate science ignored their findings? Why have YOU ignored it?
That’s just patently false. PHA was developed in part because of the findings of Hubbard & Lin.
[Hubbard & Lin 2006]
[Menne & Williams 2009]
Notice that Menne & Williams cite the work of Hubbard & Lin.
Why are you not addressing the actual issue? As I pointed out, PHA only serves to identify discontinuities. It can *NOT* evaluate what adjustments are appropriate to create a homogenous long record.
Hubbard and Lin SPECFICALLY point out that adjustments must be done on a station-by-station basis. When you are using other stations to determine the adjustments for a specific station or to infill missing data you are ignoring what Hubbard and Lin found.
Why can’t you address that simple fact?
NOAA’s implementation of PHA does just that. BEST uses a similar method for detection, but instead of making adjustments they opted to split the record. They call it the “scalpel” method.
That’s what PHA does.
Data FRAUD, and you defend these practices.
That is *NOT* what the documentation I read says. It said it can accurately identify change points. It did *not* say it could accurately determine the adjustment values over time to homogenize the differing records accurately.
PHA finds the inconsistencies on a station-by-station basis. Since it can’t evaluate differing micro-climates or calibration it simply cannot accurately evaluate adjustment VALUES.
Anyone that thinks it can is only fooling themselves. It’s what Hubbard and Lin tried to tell everyone. Microclimate matters. It doesn’t matter if you move the station 1 inch or 1 mile. If you can’t evaluate the micro-climate then you can evaluate any adjustments, especially for measurements far in the past.
From Hubbard and Lin.
You haven’t shown where Menne & Williams 2009 addressed measurement uncertainty at all. Identifying breaks is not the same as determining accurate adjustments.
HL06 are making a very specific argument that a generic offset adjustment from Quayle, 1991 is inappropriate for considering localized (single station-level) changes, and that a station-specific adjustment should be made in these cases instead. I don’t have the requisite expertise to evaluate those claims, but they are quite irrelevant when considering network-wide global/CONUS indexes.
USHCN has also been replaced by ClimDIV. I’m not sure how relevant this research is for the present day.
The paper has 27 citations.
Pushing data fraud again?
Your feathers are on display for all to see.
“ but they are quite irrelevant when considering network-wide global/CONUS indexes.”
They are *TOTALLY* relevant!
You state you don’t have the expertise to evaluate the claims but then turn around and use the argumentative fallacy of Argument by Dismissal to say they are irrelevant!
Unfreakingbelivable!
I’m saying that if Hubbard and Lin’s argument is correct, it has little impact on global/CONUS wide temperature estimates. It’s something that is of concern when you’re looking at large scales, e.g. areas represented by a single station. But also as stated, I’m not sure the adjustment from Quayle is still being used for the instrumentation change bias adjustment, since automated algorithms are being employed.
“All errors are random and cancel” — yawn, the same-old same-old.
“I’m saying that if Hubbard and Lin’s argument is correct, it has little impact on global/CONUS wide temperature estimates.”
In other words don’t confuse me with facts! My meme is that all measurement uncertainty is random, Gaussian, and cancels – and I’m sticking with that meme.
Thus the uncertainty of the global/CONUS wide temperature estimates are 100% accurate – or are at least accurate out to the milli-degree!
Most are actually systematic uncertainties which can never be discovered using statistical analysis.
A fact these rubes will never acknowledge—instead they invoke a magical incantation that transmogrify systematic uncertainties into random which then disappear in a puff of greasy green smoke.
They are not normalized to a common baseline. They are normalized to a STATION common baseline and all based on a similar period of time. Do you know the difference? It doesn’t mean the anomalies have one single baseline for the globe.
It is my contention that climate science should determine a common single global baseline value used for all anomalies. That would do two things, one, tell all what the best temperature is, and two, show variations from that temperature so a common point is used.
I am not going to pay for a junk document. It is up to you since you presented the paper, to answer questions. If measurements are correlated, the GUM requires a correlation calculation be added to the combined uncertainty. Was this done? If so how was it determined?
“It is my contention that climate science should determine a common single global baseline value used for all anomalies.”
It’s already done. the base is set at 273.15K, it’s just Americans who refuse to use it.
But using that as an anomaly for global temperatures fixes none of the problems that using different bases is intended to fix.
“That would do two things, one, tell all what the best temperature is,”
How does it do that? What do you mean by best? Best for me during summer is not the same as best during winter.
Well, doesn’t that say something about how useless an average anomaly is?
No.
And every time historical data is changed, the baseline(s) change. There is no assurance that all the old baselines get updated. That is a good reason for changing current readings and keeping the archival data untouched. It is far less effort and there is less chance for errors.
“let sleeping dogs lie”?
“The reason for this is trivially intuitive from common experience – the temperature above my driveway is rarely the same as the temperature under the trees in my back yard, but if it’s a hotter than normal day on the driveway it’s almost certainly going to be a hotter than normal day in the back yard, even though the definition of “hotter than normal” is different for both areas.”
Let’s assume for the sake of discussion that this is exactly true, even though you say it is only “almost certainly” the case.
Leaving that aside.
If we are going to use the temp of the driveway, where we have a thermometer, to figure out the temp of the backyard, where we have no thermometer, we must also expect that the conditions that make one place warmer than normal will have the same effect in the backyard, in magnitude and direction. So if it is hotter than normal on the driveway, we might figure that it is because the humidity is lower than average and less breeze than average and there are less clouds than average and there is higher pressure than average. But there is no reason to expect by any logic that the driveway is going to be as much above average temp as the back yard is, where it is grassy and kind of shady, as opposed to blacktop paving with no vegetation and no trees!
That driveway might be 5 degrees hotter than when it is breezy and partly cloudy and very humid, while these same relative conditions may well cause the grassy back yard to only be half a degree warmer than when it is breezy and partly cloudy and more humid.
Do you have any idea how much the actual density of air varies over the course of a year?
Do you know how much the specific heat of air varies from place to place and day to day?
As I’ve pointed out elsewhere, the fact that anomalies correlate over very large distances is not an assumption, it is a fact born out of research. My example is just to help you intuit why this is the case for anomalies when it is not the case for absolute temperature. You can nitpick the specifics of the example to death to no end. Anomalies are a measure of how much warmer or colder a location is than is typical for that location, which is much more likely to apply over greater distance than the simple measure of the absolute temperature at that precise location, which may not even apply a few feet away.
Has anyone shown why this is, assuming it’s true? Why should anomalies correlate over large distances (actually only 1000 km or less) at mid-to-high latitudes better than at low latitudes?
One thousand kilometers does not reach across the Arctic ice cap. There is a huge area over the Pole with nothing within 1500 km. How is that handled in the record?
“As I’ve pointed out elsewhere, the fact that anomalies correlate over very large distances is not an assumption, it is a fact born out of research. “
The problem is that the anomalies do *NOT* correlate with each other. They correlate with time!
Nicholas is correct. The anomalies *have* to follow the local conditions. See the attached picture. This is for northeast Kansas. You can see that the temps north of I-70 (which follows the Kansas River valley) are different than those south of I-70.
Those temps are different for a reason. Factors include measurement uncertainty, humidity, wind, pressure, cloud cover, wind, terrain, geography, etc. Those very same factors will affect the anomalies seen at each station. The amount of heat necessary to create an anomaly will be different based on the capacity of the atmosphere at each point. That capacity of the atmosphere to warm is also a function of humidity, wind, pressure, terrain, geography, etc. Since those factors are different at different locations the anomalies will be as well.
Correlation is *NOT* a sufficient condition for using the anomaly value at one location at a second location. The actual value of that anomaly at the second station *WILL BE* different from the first location and depends on the micro-climate factors that are different at each location.
It’s why Hubbard and Lin found in 2002 that temperature adjustment factors simply can’t be done on a regional basis. They must be done on a station by station basis because of different micro-climates at each location. That applies to anomalies as well as the absolute temperatures. If you are missing data at one location it is impossible to substitute the data from another location without also increasing the measurement uncertainty associated with the second station. As that measurement uncertainty goes up so does the measurement uncertainty of the regional average!
What is *YOUR* estimate of the measurement uncertainty introduced by substituting one set of data to another location? Do you have any idea at all? What factors do you use to determine what the additional uncertainty should be?
It isn’t clear to me that you know what an anomaly is.
It’s not clear to me that he even knows what an average is. See here, here, here, and here for examples of what I mean. And every time Bellman and I try to explain it to him he responds with one algebra mistake after another. I even begged him multiple times to use a computer algebra system to verify his results and he told me that the computer algebra system website I used was incorrect. This is the brick wall you are up against right now. If you can’t get him to understand what an average is or even understand that addition is different from division then you’ll never be able to explain an anomaly to him. It was like pounding my head on a table…over and over again.
Oh lookie, beeswax is posting his enemies’ list.
Another kook sign.
You do this a lot? It would explain a lot.
What a load of crap!
The issue is the ACCURACY of the average, not the average itself. Something you CONTINUALLY refuse to address. All you ever do is trot out the meme that all uncertainty is random, Gaussian, and cancels so that the average is 100% accurate. And that accuracy can be increased by averaging even more inaccurate measurements.
It’s the viewpoint of someone who has NEVER put their professional judgement on the line with possible civil and criminal penalties involved!
It’s why the medical establishment is moving away from using the standard deviation of the sample means as the metric for determining the accuracy of the mean. Too many lawsuits and insurance payments tend to do that.
Averages of real world measurements are *NEVER* 100% accurate and the accuracy of the average can *NEVER* be increased by obtaining more and more inaccurate measurements.
A simple fact that climate science continues to ignore.
Despite all his noise about stuffing the average formula into the GUM, he never treats systematic uncertainty at all. Total crickets.
Anomalies are determined by the heat capacity of the atmosphere at a single point in time and location.
If the temperatures across even a small area like NE Kansas vary widely then it indicates that the heat capacity of the atmosphere at those locations vary as well. This will certainly impact how much the temperature can change at leach location – which in turn determines what the anomaly value will be.
The fact that you can’t even understand that simple physical fact only indicates to me that you are a mathematician and not a physical scientist or engineer with actual experience in the real world.
The anomaly represents how hot or cold an area is relative to the mean climatology over the reference period. Large temperature variation across a region does not equate to large variations in the anomaly, because the anomaly represents how different a given value is from “typical.” If the daily temperature in Marysville for the reference period is around 34 on the given day of the year, the anomaly will be around 0. If the daily temperature in Burlington is around 39 on the given day of the year, the anomaly there will also be around 0. Since it’s likely that both Marysville and Burlington are experiencing similarly normal or abnormal weather for the given day, an anomaly from a nearby station is very likely to be representative of both locations.
The GAT is a fictitious index that does not represent “the climate”.
For the umpteenth time, it isn’t just the value of the anomaly, it is the VARIANCE of the anomaly.
Anomaly variances are larger in winter than in summer. How do you combine random variables that have different variances?
You can’t just average them and ignore the variances or assume the variances cancel.
What *do* you do with them?
With a small, but unspecified and unacknowledged error that is simply ignored.
I’ll be honest, I don’t believe that an anomaly can be that accurate, especially in all locations. There is just too much terrain difference to make monthly averages that similar to the distances of 1500 km. If that was the case you would only need 3 or 4 stations to cover the whole U.S.
No one seems to believe Hubbard and Lin that adjustments can only be done on a station-by-station basis because of differing microclimates at each.
That also means that anomalies will be different. Substituting the anomaly from one station to another *will* introduce uncertainty in the station getting the substitution.
ΔT is heat absorbed/released divided by heat capacity.
If the heat capacity at one location is different, e.g because of humidity, then ΔT will be different at that one location. Humidity can vary widely because of terrain, geography, etc.
Climate science assumes everything is homogeneous and then is surprised when you find big differences in temperatures between even closely located stations, e.g. in San Diego and Romana CA (30 miles apart)
A-yup.
forgot the image!
If true then why do the animations of global temperature never show this?
They certainly do. Each station is a point-level sample of the regional anomaly. Global temperature maps present a continuous temperature anomaly field. Those point-level anomalies are being used to represent large areas.
Continuous? HAHAHAHAHAHAAHAH
More bullshit (for which you have a fine talent).
Is this not continuous?
Where do the numbers from the South Indian Ocean come from, clown?
Did you even read the fine print on your own pic?
You call your data mannipulations “continuous”, what a joke.
Do all “temperature anomaly fields” have the same variance and uncertainty? How would anyone know from looking at the map?
Then why do the temps on Pike’s Peak have a different variance than those in Colorado Srpings?
What is continuous between those two locations?
Instead of answering they push the downvote button.
Success achieved!
With a nominal value with no specified uncertainty.
Yes they may correlate but are they equal.?
Subtracting two random variables, that is subtracting a station baseline from a monthly average is subtracting two random variables, each with a mean and a variance. Doing this has the following equation for combining variances.
Var(X – Y) = Var X + Var Y
Variance is a measure of the dispersion of data that can be attributed to the measurand. It is important in defining the range of data that makes up the mean.
Do you ever concern yourself with uncertainty and/or variance? You sound like a programmer that simply ignores that you are dealing with measurements and not just 100% accurate numbers whereby you can just find simple high school averaging of simple numbers.
Tell us how you deal with the variances and uncertainty in the temperature MEASUREMENTS!
The station baseline is *NOT* a variable. It is a fixed constant determined from the data set of a variable.
Correlation is related to covariance. The covariance of a fixed number is zero therefore the correlation must be zero for anything it is associated with.
You can calculate the correlation between two sets of anomalies, i.e. from two different stations. But correlation only tells you they move together, it does *NOT* give an absolute adjustment value. That means that you simply cannot legitimately use the anomaly from one location at another location. You can assume they may be correlated but that doesn’t help.
The line from 1,1 to 2,2 may be correlated with the line from 1,3 to 2,4 but you can’t substitute the y values 1 and 2 for 3 and 4 in the second set.
If you don’t know the points 1,3 and 2,4 then you can’t substitute 1,1, and 2,2 for them even if you assume correlation!
Of course you can, and you have no other choice, because the earth’s surface isn’t completely blanketed every square nanometer by weather stations. The only question is how large of a region a single station can represent, and we know from research that it is quite a large area.
And, importantly, most areas are represented by multiple stations, not just one, which improves confidence that the representation is adequate.
Only in the twisted minds of climastrologers.
“you have no other choice,”
Of course you have other choices! This is the argumentative fallacy of The False Dichotomy.
“we know from research that it is quite a large area.”
Malarky! I gave you a picture of the temps around NE Kansas showing that neither single or multiple stations can determine the temperature being measured at other stations, not even close ones.
Once again, you are ignoring all the factors that determine temperature and trying to claim that the temperature field is continuous on its own with no other influences from reality.
It’s why more and more people are beginning to question climate science!
Please describe them.
We are talking about the anomaly.
I’ve given you the answer twice already. Why do you keep ignoring it?
You INCREASE THE UNCERTAINTY ESTIMATE FOR THE COMBINED DATA!
“We are talking about the anomaly”
I’ve given you this answer before also – and you have ignored it as well.
Different temperatures over multiple stations indicate 1) measurement uncertainty between stations and 2) differing heat capacities of the atmosphere at different locations.
Both of these will result in anomalies that may or may not be correlated but even if they are correlated will have differing values. The anomaly recorded at a station near a large body of water can, and most likely will be, different than that for a station out in the middle of a section of land that is entirely dormant pasture during the winter.
The anomaly variance will certainly be different as well. But, as usual for climate science, you want to ignore the data variance and just assume that all distributions are exactly the same.
And then you wonder why someone questions the things you come up with!
This isn’t a solution to the problem posed. The issue is that the planet is not blanketed by weather stations. Thus, it is my contention that a single weather station must be used to represent a larger area than the exact gemotric point on which it sits. You say no, there are alternative choices. I am asking you what those choices are.
As always, it’s as though you’re arguing with a phantom, because your replies have no bearing on what is actually being discussed. Take a breath, have a stiff drink, and think about what is being said to you before jotting of a deranged and irrelevant missive.
I’m worried that you don’t know what “correlated” means.
Of course it is an answer! It’s just an answer you don’t like because it would clue people in to the fact that your “global average temperature” simply can’t be determine down to the hundredths digit. It would mean you having to actually process the uncertainties instead of just ignoring them!
You don’t know what you don’t know! You simply can’t accept that. Unfreakingbelivable.
“I’m worried that you don’t know what “correlated” means.”
that’s not an assertion of fact. It’s just an ad hominem argumentative fallacy meant to cover up the fact that you have no actual refutation as to why anomalies have variance across measurement stations.
Buh-buh-buh-buh Stokes paints his mesh pictures!
Unless there is perfect correlation, errors are introduced.
I was going to mention this earlier. Correlation is not the correct condition to use for making changes at a distant station. EQUAL is the correct condition. Correlation only means two variables move in the same direction. It does not mean they are equal in value.
Even if you have perfect correlation, if the values are different then you still introduce errors.
It is true. Temperatures (and many other atmospheric metrics) exhibit both high spatial and high temporal correlation. You don’t have to assume it. You can test this quite easily yourself.
You do realize that by affirming a high correlation you are also indicating that there is an additional uncertainty element that should be added to the combined uncertainty. Show where this has been done.
Correlation is not a sufficient condition for substituting one value for one at a different location. Hubbard and Lin proved this in their 2002 study.
Correlation is not a sufficient condition for substituting a value from one location to another location.
If what you say is true then Hubbard and Lin would not have found in 2002 that station temperature adjustments must be done on a station by station basis because of varying micro-climate conditions.
Can you refute Hubbard and Lin’s findings?
Without perfect correlation, there is an uncertainty introduced that isn’t dealt with.
“Sir Arthur Conan Doyle would be Stoked.”
Well, here is Sir Arthur getting Stoked about the fate of my Irish great great uncle
“Early in 1895 occurred the Stokes affair, which moved public opinion deeply, both in this country and in Germany. Charles Henry Stokes was an Englishman by birth, but he resided in German East Africa, was the recipient of a German Decoration for his services on behalf of German colonization, and formed his trading caravans from a German base, with East African natives as his porters. He had led such a caravan over the Congo State border, when he was arrested by Captain Lothaire, an officer in command of some Congolese troops. The unfortunate Stokes may well have thought himself safe as the subject of one great Power and the agent of another, but he was tried instantly in a most informal manner upon a charge of selling guns to the natives, was condemned, and was hanged on the following morning. When Captain Lothaire reported his proceedings to his superiors they signified their approbation by promoting him to the high rank of Commissaire-Général.”
Yes we of Irish descent have a sad legacy to bear in life Nick.
At about the time your great great was being strung up by the German colonizers, my great grandfather was in outback Queensland Australia providing food to the sheep shearers who were on a prolonged strike.
The shearers union promised to reimburse my great grandfather for the costs of all the provisions he supplied. But of course the union stiffed him when it came to coughing up the dough.
Must have been English union organisers.
By the way, was your great great uncle’s demise later called “Stokesgate”?
“my great grandfather was in outback Queensland “
Hah! My great gf (brother of Charles) came out to work as a railway engineer on building the Palmer River railway.
Ah the Belgians, that explains it. We of Irish descent do have to watch it around other nationalities – they’re just jealous y’know. My grandmother was imprisoned in strangeways prison for a few days for the grand crime of travelling back from Ireland after visiting her family. And I shan’t go into which relative got shot, stitched up or imprisoned by the English, it’d take up far too much room. If you feel you have to put your Irish descent into block lettering to highlight it, do be sure to remember it’s not so exclusive a club.
I bolded the Irish because Conan Doyle wrongly said he was English.
And each “average” is assumed to be 100% accurate with no measurement uncertainty inherited from the individual temperature measurements!
Why would anyone want to waste time visualising what is undoubtedly JUNK DATA !!
Golly, the Arctic looks red hot!
So why is ice extent and volume not showing any indication of being unusually warm…like none, whatsoever?
Ocean and Ice Services | Danmarks Meteorologiske Institut (dmi.dk)
DMI Modelled ice thickness
There is no trend in Arctic ice extent or volume over the past 17 years of panicked end of the world doomsday alarmism.
Exactly, Nicholas.
“There is no trend in Arctic ice extent or volume over the past 17 years”
Your own graph shows the contrary. The colors are the last six years. The grey curve above is the 1981-2010 median.
2023 is current ABOVE the 15 year average, also above 2022, 2022, 2019, 2018, 2017, 2016, 2012, 2010
Your comments are meaningless as always.
Is “1981 to 2010” the same thing as “the past 17 years”?
Of course it is not, and so my graph does no such thing!
Stop making stuff up, Nick!
Besides it is not “my graph”.
It is a picture of the DMI website from yesterday.
The trend in Arctic sea ice extent over the last 17 years is -0.6e6 km2/decade.
And what is the actual error range on that statistic, not the mathematical probability, please?
I think that Nicholas McGinley may have been a trifle optimistic in his 17 year idea, there has certainly been a trend in sea ice, even allowing for overblown estimates and biased estimation methods but it is a curve, not the straight line that idjits like bdgwx or Stokes can only ever work in. As such we’re probably around the bottom of the curve and flattened for maybe the last 8-10 years. Your straight line, like the straight line global warming trend and the straight line global cooling curve can go straight (heh) in the bin; as Antonio Gaudi said “there are no straight lines or sharp corners in nature.”
Global cooling trend. I do miss the edit function. Mods, I’m beggin’ ya on my knees here!
I used the same method Monckton used. Monkton’s method and monthly updates received widespread acclaim here on WUWT. Anyway, yes, I agree not having the edit button is annoying.
There’s your problem, right there. You’re following other people around like a lost puppy rather than using your brain. Innovate – do something original, that’s what will impress.
As to Monckton having universal support, I think not, he had quite a few detractors who just couldn’t see what he was getting at.
The CAGW crowd hated that Monckton used their own data to show that CO2 was *NOT* driving the GAT anomaly. If it was doing so then you wouldn’t see the pauses. CO2 is just a convenient scapegoat for those looking for political power and/or money.
“The CAGW crowd hated that Monckton used their own data to show that CO2 was *NOT* driving the GAT anomaly.”
He did not. He didn’t even claim to have done that. All he ever said was that the ability to cherry-pick flat periods demonstrated that that the rate of warming was less than predicted.
Of course, cynical me might suspect he hopped the gullible would assume that’s what he was showing.
The pauses show that CO2 is a minor player in driving the temperature!
That is why the rate of warming didn’t follow CO2!
When is climate science going to start addressing the other factors controlling temperature?
“The pauses show that CO2 is a minor player in driving the temperature!”
So you’ve progressed from “it proves CO2 is not driving the temperature”, to “it is driving temperatures, but only in a minor way.”
But as always, you’ve given no actual evidence to support this claim. It’s just hand waving.
When you have variable temperatures you expect the trend to change over short periods. That’s why you want to look over a longer time period, that’s why you have to consider the uncertainty of the trend. Basing your evidence on an arbitrary short period tells you nothing about whether the underlying rate of warming has changed. Cherry-picking a period specifically because it has a zero trend is less than useless. Ignoring the effects of El Niños and La Niñas when you claim warming has stopped is deceitful.
“That is why the rate of warming didn’t follow CO2!”
All you are saying now, is that the effects of ENSO conditions over a few years are bigger than the rise in temperatures from CO2. That is what I’ve been saying every time the pause is mentioned. It’s spurious to start a trend just before a major El Niño and claim it tells you anything other than temperatures cool down after a spike. This is precisely why you need to look at several decades worth of warming to be able to detect the rise from CO2 (or postage stamps) above the fluctuations caused by ENSO, Volcanoes, or whatever.
“as Antonio Gaudi said “there are no straight lines or sharp corners in nature.””
Love it!
“I think that Nicholas McGinley may have been a trifle optimistic in his 17 year idea…”
Perhaps, perhaps not.
Here is extent, since Jan 1, 2007.
12 days or so shy of 17 years, attached below.
Other information I have been reviewing recently tells much the same story regarding volume of ice.
I’ll have to locate a source with a good graphic…no one wants to look at stitched together comments, and if I use pics from by hard drive, I can only attach one per comment.
Links often do not display as a graph, even when the link is to a graph. I have not been able to discern any consistency in how this site displays links.
But yes, no trend.
No substantial trend.
But this is changing the subject.
Look at November, and there is no sign of what we might expect if the Arctic is red hot.
Is there, N.S and alphabet soup person?
“now with statios{sic} shown”
With temperatures from up to 1,200km distant used to “ADJUST” missing or unsatisfactory temperatures.
These are unadjusted temperatures.
They have FOOLED you haven’t they Nick !!
Surface temperatures are always massively adjusted by urban warming.
yes, as I understand it, the actual as-recorded instrumental temps readings are “adjusted” to be what is put into the records
Historical records before about 1980 were typically recorded in the units digit. And somehow they can be averaged to create differences in the hundredths digit? It’s not even a matter of being “adjusted” – it’s a matter of ignoring basic metrology. A surveyor can’t record measurements in the unit digit of feet (e.g. 1′, 2′, 3′, …) and use them to discern differences in the hundredths of feet! But climate science assumes it can do it with temperature!
And even then, when a surveyor does take multiple measurements of the same parameter such as an angle, it is the same angle with the same transit.
Temperatures do not have a single unique value. They are samples of a population measured over time and the longer the time the greater the range and variance. I’ve mentioned it before, but the acolytes have ignored it: Non-stationary data have to be handled differently from stationary data.
Yep!
I’m not even sure that the traditional methods of dealing with non-stationary temperature data will be adequate. They typically assume that the data has no other confounding factors. But temperature does. Humidity is a time-varying confounding factor. So are clouds. So are lots of other things.
That’s the GISTEMP strategy. Note that UAH uses measurements from up to 4165 km distant with most contrarians having a favorable view of UAH here on WUWT at least until these last 3 monthly updates anyway.
Every dataset has problems and issues. I prefer not to touch the corrupted things myself but I understand others will hold their noses and choose the lesser of the evils on offer.
Wouldn’t GISTEMP be the lesser evil between it and UAH then?
The operative words you used are “lesser evil”. NEITHER are fit for the purpose to which they are being used – to determine average anomalies in the hundredths digit.
“It’s average, not min/max.”
Is that a typo, Nick? What use would min/max be?
Walter,
It is invalid to use a Taverage of Tmax and Tmin. The events that caused the old thermometers to register a daily Tmax are different to the causes of Tmin. They are, for statistics, different beasts. People who use Taverage should know that the uncertainty is huge, because Tmax and Tmin are not IID (independent and identically distributed) so you cannot benefit from so called Law of Large Numbers or Central Limit Theorem.
Geoff S
At an even more basic physical level, temperature does not indicate energy content of air.
These averages would have us believe that, for example, a one degree increase in temperature in November in Denver is equivalent to one degree increase in Miami in July.
All such notions are entirely unphysical and unscientific.
It’s even worse than that. What does a 0.1C change in December really mean when the temperature is -7C as compared to 0.2C when the temperature is 32C? 0.1/7 -> 1.4% while 0.2/32 -> 0.6%. That’s close to 2.5 times the difference. Trying to equate anomalies ignores the relative seasonal difference.
It is one reason that a common baseline should be used everywhere. First, it would make climate science sit down and actually devise what the “best” temperature should be. That is never discussed. Only that the increase is what is bad. One should have an idea what the “best” temperature is before deciding the change that is occurring is bad.
This essay is a useful base for showing that the current “global average temperature” applies to nowhere on earth and is not a good metric for determining whether the current increase will destroy the earth. I congratulate the author.
“0.1/7 -> 1.4% while 0.2/32 -> 0.6%.”
Have you still not figured out that percentages of temperature are meaningless – unless you are using an absolute scale. And your 0.1°C increase from -7°C, would result in a negative percentage.
Using absolute values you have 0.1 / 266.15 = 0.038%, verses 0.2 / 305.15 = 0.066%.
Have you still not figured out that there is no statistical significance between 0.00038 (=0.1/266.15) or 0.00066 (=0.2/305.15) and zero?
Please show your workings. How are you calculating the statistical significance of an individual anomaly?
You cannot be serious. Are you trying to say that, given the ‘accuracy’ of the historical instrument record, there is any meaningful information conveyed by 0.1/266.15 or 0.2/305.15?
Am asking what you mean by no statistical significance.
You do realize these are just numbers Jim made up to prove some nonsense about relative changes. So I’m not sure what statistical analysis you could do to establish the figures where statistically insignificant, or why you think it’s relevant.
Unfreakingbelievable. Once again, a statistician unable to interpret physical reality shows up.
Think about it for a while. Does a difference in the tenths digit represent a significant change in a value given in the hundreds digit – at least as far as physical reality is concerned?
Can plants discern a 0.1K difference in temperature? Can you? If the answer to those is “no” then of what statistical significance is the 0.1K?
Statistics are a descriptive tool used to help interpret the real world. Statistical descriptions have no significance value of its own outside its ability to describe the real world.
A more relevant question would be if you think a global monthly average that is 0.34°C warmer than the previous record according to GISS, would be statistically significant?
WOW.. look at that mal-adjusted, agenda-driven URBAN WARMING.
I hadn’t realized there had been so many buildings built in just the last 6 months.
Funny how satellite data also shows the spike this month – even when just looking at the sea.
During the period that global CO2 was rising at a more or less constant rate, that graph shows a 0.5 degree drop, a period of no trend at all, and the big spike on the right.
That does not seem to be correlated to me.
I think your monitor might be upside down.
Why don’t you just say you can’t explain it?
You’re right. I can’t explain why you think that graph shows a 0.5°C drop.
“there is any meaningful information”
The usual evasion. You said “Have you still not figured out that there is no statistical significance …” which is meaningless. When Bellman asked how you worked that out, you shifted to “no maningful information”. Which is of course meaningless. The meaningfull information is that the temperature shifted by 0.1C, and that doesn’t change if you divide by the temp in K, or the national debt, or whatever.
Oh the irony.
You forget that anomalies are bars on °C. The % change is what you see for the anomalies. Perhaps you should investigate why Kelvin is not used for all calculation. As I’ve shown in the past, I always do my calculations in Kelvin. Were the anomalies in your pictures calculated using Kelvin?
“Were the anomalies in your pictures calculated using Kelvin?”
As Bellman says, you seem to have no idea about the arithmetic here. It makes absolutely no dofference whether you calculate an anomaly using K or C. The size of the degree is, by definition, the same.
And talking, as you did, of a % of a temperature in C is nonsense. If you used F, you’d get a different answer.
No, he’s not talking about anomalies. Please pay closer attention to the conversation.
His question, which I quoted, was
“Were the anomalies in your pictures calculated using Kelvin?”
“Perhaps you should investigate why Kelvin is not used for all calculation.”
It makes zero difference whether you calculate anomalies using C or K. It’s just a constant offset. If somewhere is 1°C warmer than the average it will also be 1K warmer. Do you really need me to explain why this is?
“I always do my calculations in Kelvin”
Except for that one time when it mattered.
“Were the anomalies in your pictures calculated using Kelvin?”
If you mean the UAH maps, I’m pretty sure they would use K, given they have to convert microwave data into a temperature.
Here for example:
https://www.drroyspencer.com/wp-content/uploads/APJAS-2016-UAH-Version-6-Global-Satellite-Temperature-Products-for-blog-post.pdf
Exactly. And via the magic of differencing, an anomaly is in Kelvin, i.e. is absolute.
Have you not figured out yet that it is the difference that matters?
When comparing anomalies, the difference is important. It is why a common baseline is important.
As Frank from NOVA points out these values are not significantly different.
“Have you not figured out yet that it is the difference that matters?”
Anomalies are differences. You were the one insisting they had to be turned into percentages, and still won’t accept the simple point I keep making – if you want to use percentages or ratios of temperatures, you have to use an absolute temperature scale.
“It is why a common baseline is important”
Not sure what you mean by a common baseline. If you want the baseline to be the same for all places on the earth and for all seasons, then all you have are relative temperatures, with a different zero point, with all the problems that entails.
“As Frank from N”OVA points out these values are not significantly different.”
Which values? And how are you determining the statistical significance of them? The only values you quoted was an anomaly of 0.1°C and one of 0.2°C, taken from wildly different, which you said should actually be 1.4% and 0.6%. How would you test if these were significantly different or not. And then what would you say about say a global anomaly for November, of 1.4°C. Would that pass your significance test?
I have been trying to show you that the relative differences matter and all you want to argue about are numbers. You can use °F, °C, Kelvin, or Rankine for that matter. The difference in percents remain. You can’t escape it.
The consequence is that a small change at a large number has smaller effect than the same change at a much smaller number.
“…and all you want to argue about are numbers”
Yes. Because your number s are meaningless. Your claim is that a rise of 0.1°C from -7°C is over 2.5 times bigger than a rise of 0.2°C from 32°C.
I say that’s a meaningless comparison because it depends entirely on where the zero is.
“You can use °F, °C, Kelvin, or Rankine for that matter. The difference in percents remain.”
And you will get completely different percentages unless you use an absolute scale which has a fixed zero.
°C: -1.4% compared to 0.6%
°F: 0.9% compared to 0.4%
K or R: 0.04% compared to 0.07%
Note that using C or F the 0.1 warming is larger (in absolute value) than the 0.2 warming. But using the absolute scales, the 0.2 is now warmer, almost twice as warm as the 0.1.
“The consequence is that a small change at a large number has smaller effect than the same change at a much smaller number.”
What effect? There can be any number of effects at different temperatures, and it’s difficult to know which will be bigger when when the change. A percentage change based on the triple point of water does not give you a meaningful measure of effect.
Do you think a rise from 0.1 to 0.2°C is equivalent to a warming from 20°C to 40°C? And big do you think a rise from 0°C to 0.1°C is?
These math jockeys are unable (or unwilling) to see that the offset between K and °C drops out when they form a temperature difference!
Yes, if you look at the difference they are the same regardless of where the zero is – that’s what happens when you use anomalies.
But when you use a percentage rather than the absolute difference the offset between K and C becomes very relevant.
The PHYSICAL IMPACT of the difference remains the same.
A 1deg difference at -30C, a 1deg difference at 100C, and a 1deg difference at 0C all have very different physical impacts.
And it doesn’t matter whether those temps are given in kelvin, celsius, or fahrenheit. At one, frozen water will remain frozen. At one water will start to boil. At a different one ice will melt.
The absolute percentage difference may change but the physical impact won’t. And it is the physical impact that is important.
So a percentage difference in the hundredths digit for kelvin is just as important as a percentage difference in the unit or tenths digit for a different scale.
You are arguing from a statisticians viewpoint as you always do, trying to assign some significance to the numbers while it is the physical reality that is important!
“The PHYSICAL IMPACT of the difference remains the same.”
What physical impacts, and what are the differences that remain the same. You keep doing this. Right some words in all caps as if that explains what’s going on in your head.
“A 1deg difference at -30C, a 1deg difference at 100C, and a 1deg difference at 0C all have very different physical impacts.”
Very likely – but just turning them into percentages is not going to explain what those differences are.
In you examples you have a percentage change of -3.3%, 1% and something that tends to infinity. Do you think these are meaningful in any way.
“So a percentage difference in the hundredths digit for kelvin is just as important as a percentage difference in the unit or tenths digit for a different scale”
You still don’t get that its the scale that is a problem, it’s where you put the zero.
“You are arguing from a statisticians viewpoint as you always do, trying to assign some significance to the numbers while it is the physical reality that is important!”
It’s nothing to do with statistics, it’s to do with thermodynamics. It makes no sense to say that 2°C is twice as warm as 1°C. It does make sense to say that 200K is twice as warm as 100K.
And they don’t understand how a percentage is calculated!
If I made a mistake tell me, rather than making these snide ad hominems.
I think Walter was calculating the average Tmin and Tmax, not the average of Tmin and Tmax.
However, even the average Tmin and Tmax values must be localized, not wide area. That’s because they are not identically distributed. Coastal areas and inland areas have different variances of data because of terrain and geography. Temperatures in mountainous areas have different variances than temperatures on the high plains.
Why climate science, after more than 50 years, absolutely refuses to address the violation of statistical rules involved with a “global” average temperature (or anomaly since anomalies inherit the variance of the absolute values) is beyond me. It seems to be a case of the ends justifies the means – the end being obtaining funding from government.
I suspect the reason Anal J, Bellend, Stick Nokes and the other scientifically-challenged trolls defend the use of anomalies rather than physical temperatures is that the former give the results they so desperately desire, and the latter don’t.
I defend the use of anomalies because 1) it removes a component of systematic error and 2) it normalizes two timeseries onto a common baseline so that they can be compared.
Liar.
Did the NIST Uncertainty Machine tell you this fable?
Point 2 is correct, but I must be missing something with point 1.
He’s lying (again)—this is their bullshit claim that averaging allows them to ignore systematic measurement uncertainty.
I’m just wondering about which components of systematic error may be removed, and under which circumstances.
Getting into motivation tends to be counterproductive.
He won’t explain it because he can’t.
Systematic error can not be addressed via statistical analysis. If it occurs, it will be a constant and appear on each and every measurement. It can only be evaluated via calibration with a standard from which a correction method can be generated. It can not be “cancelled” by averaging with another instrument. The error will be inherent in any average.
Do they not understand that averaging is a statistical analysis method?
You would be surprised how many programmers complain that they are only calculating averages and all the measurement mumbo jumbo is just a way to criticize their work. They have no problem with carrying calculations out to3, 4, or 5 decimal places.
After witnessing how these climate types treat data, I would not be surprised.
NO components of systematic bias will be removed. NONE.
Let Mi = Ti + Es + Eri where M is the measurement, T is the true value, and Es is a systematic error component, and Eri is a random error component.
Let B = Σ[Mi, 1, N] / N where B is the anomaly baseline and M are the measurements that go into it.
Let Ai = Mi – B where A is the anomaly for measurement M.
Therefore
Ai = (Ti + Es + Eri) – (Σ[Ti + Es + Eri, 1, N] / N)
Ai = (Ti + Es + Eri) – (Σ[Ti + Eri, 1, N] / N + Es)
Ai = (Ti – Σ[Ti + Eri, 1, N] / N) + (Es – Es)
Ai = Ti – Σ[Ti + Eri, 1, N] / N
Notice that the Es term cancels. It is important to notice Es must be a time-invariant systematic error for this to work for timeseries data.
You can also prove this with the law of propagation of uncertainty as well. It’s quite a bit more involved though.
That was what I was afraid you meant. The specific condition that has to be met is that systematic error is invariant.
This constraint almost certainly doesn’t apply if different measurement instruments are used, and over time may not apply to the same instrument due to wear or damage.
Bear in mind the time period involved in setting each baseline site temperature.
Of course it doesn’t apply, to claim that Es is a constant is another indication of abject ignorance of measurement uncertainty.
It does apply to repeated measurements with the same instrument under the same conditions, but can’t really be safely extrapolated.
The problem is that Es is unknowable—the best that can be done is to estimate its magnitude. And when used or combined with other measurements, the total uncertainty grows. There is no way escape this, all the gyrations about partial derivatives are vain.
Type A uncertainties are those which can be quantified with statistical methods (i.e. repeated measurements), but Type B cannot be so quantified. Es is a Type B.
Yes, Es is a type B, but calibration should ensure it is it under the resolution threshold.
Each and every instrument has to be evaluated independently, and calibrations drift with time. Applying broad brush assumptions won’t cut it.
How many field temperature measurement devices are lab calibrated before each measurement?
Statistically evades too many of these jokers. Uncertainty is based on variance. NIST TN 1900, the GUM, and every text book I have evaluate uncertainty this way.
The use of error and true value is no longer an accepted process internationally.
Absolutely correct—uncertainty is quantified by variance, which 100% of the climate scientists deposit in the rubbish bin.
It applies to measurements from different instruments as well. For example, consider an engineer that puts the wrong 4-20 ma scaling function into the PLC. No matter which instrument you use it may record a value 10 C too high. It is an example of a systematic error that applies to all measurements regardless of instrument.
So what? How do you identify that systematic bias? Compare it to another instrument/PLC? How many temperature measuring stations have a co-located lab calibrated thermometer to compare to?
Systematic bias can’t be identified even when you have the same instrument doing measurements under the same condition.
A ruler that reads 1/8″ inch long will always give a measure that is too short for every measurement. Averaging won’t remove that bias.
should have been rejected by QC 🙂
Then compare different rulers.
As I keep suggesting, if you want an empirical clue about the amount of uncertainty in the records you could start by comparing different independent data sets – such as UAH and BEST. That’s not going to tell you everything, but it puts limits on the likely size of any uncertainty.
How many field temperature measurement sites have a co-located lab calibrated thermometer that is itself is calibrated before every measurement?
What do you compare the thermometer at Forbes AFB with to determine its systematic uncertainty before each measurement it takes?
Comparing inaccurate data sets does *NOT* increase accuracy. It does not reduce uncertainty!
Pete forbid he should ever have to take a job as a carpenter, welder, or even a goldsmith!
Or in a calibration lab.
“This constraint almost certainly doesn’t apply if different measurement instruments are used, and over time may not apply to the same instrument due to wear or damage.”
I see your point, but wouldn’t those errors tend to devolve to random? What is Chimps Typing The Encyclopedia unlikely are a series of such errors significantly changing any of the trends under discussion, much less turning them from + to -.
Nope. Each measurement uncertainty must be quantified separately, and then the combined uncertainty calculated.
Uncertainty grows, just like entropy.
aiui, adding uncertainties in quadrature is the usual method of apportioning the systematic and random components.
Me too. And the total uncertainty of each data bunch would certainly be higher. And that uncertainty would obviously increase the standard error of the resulting trends. But w.r.t. the change in trends from the resulting bias, as the amount of data increases exponentially, over statistically/physically significant time periods, see my comment about the Chimps.
I tend to lose my train of thought if there are too many topics or discussions going on, so I was trying to keep this to the point of systematic error with respect to anomalies.
Yes, totally agree that the larger the data set or longer the trend line the smaller the impact of instrument or sampling uncertainties.
That was largely the bone of contention of Schmidt vs Scafetta earlier in the year.
So the individual temperature instrument measurement uncertainties are irrelevant?
The impact of reading uncertainty on a trend line decreases as the number of readings increases.
For a given desired angle, a 0.0001″ height difference will affect a 12″ sine bar less than it will a 6″
No, it doesn’t.
A trend line formed from data that is off by 1 measurement unit will remain off by 1 measurement unit regardless of how many readings you make over time.
Again, systematic bias is simply not amenable to statistical analysis. It remains no matter what you do.
The gage block stack should be accurate to better than 0.001″.
Granted, 0.0001″ won’t make any practical difference, so for the sake of argument let’s say the stack is 0.010″ too high. Or we could even use gage blocks from the hypothetical ruler manufacturer, and the stack is 0.1250″ too low.
Assume we want a 45 degree angle. Do the calculations for the 12″ sine bar and the 6″ sine bar.
Extend that 45deg line over 400 miles and travel along it. See how far you miss your destination.
Why do you think I specified the sine bars and the uncertainty of height of the opposite?
You can use a sine bar for navigation or surveying if you like, but I’d prefer a longer baseline.
How about tramming a milling table in the longitudinal axis at 4″ and 12″ with that same 0.0001″?
The issue is not accumulated error over a six foot long table. It is accumulated error over a LONG period, like 30 years or 400 miles.
Okay, now I see where you’re coming from.
Let’s take a series of measurements which have uncertainty but where the stated values form a straight line.
Let’s say the stated values have an uncertainty of +/- 0.05″
The coordinates are (0.0, 0.0), (4.0, 3.0) and 8.0, 6.0).
What is the subtended angle, and its range?
Now extend the data set with (12.0, 9.0), (16.0, 12.0), (20.0, 15.0) and (24.0, 18.0)
What is the subtended angle and its range?
Sort of, but not exactly.
When posting a trend line you should consider the case that all measurement uncertainty is positive and the case that all measurement uncertainty is negative.
Take the case of a warming planet. Assume it is linear growth. Tn = T0 + mTn
“m” depends on your measurement of the incremental change in temperature over each index step.
“m” can be just “m0” if you know the true value. Or it can be m0 + u if the true value is at the positive end of the uncertainty interval. Or it can be m0 – u if the actual true value is at the negative end of the uncertainty interval.
m = (x2 +/- u) – (x1 +/- u)
now take the case where the true value of x2 is actually (x2 + u) and the true value of x1 is actually (x1-u).
You wind up with
m = (x2+u) – (x1-u) ==> m = x2 – x1 +2u
the next case could be
m = (x2 – u) – (x1 + u) == m = x2 -x1 -2u
What happens is that any measurement uncertainty accumulates as you step down the x-axis. Just like it accumulates is your compass heading is off by a 0.5deg. Over a short distance, it may not be significant. Over a long distance it can certainly become significant.
If you only graph the stated values while ignoring the uncertainty you are also ignoring the fact that over a long period small incremental uncertainty accumulates to an actually large value.
It’s how Pat Frank showed that a very small error in the initial conditions of a climate model can accumulate to a large total error after thousands of steps over 100 years. Climate sciences explanation? Error is random, Gaussian, and cancels so there is no accumulated error at each step.
For the same per-reading measurement uncertainty, all positive or all negative will just offset the line. Interpolating the uncertainty such that either end is at the opposite extreme of measurement uncertainty will give the extremes of the slope.
Yes, total uncertainty is additive, but the worst case of y = a + b*x is determined by the individual xi values.
Let’s take a simplified case of a 45 degree trend line which has its intercept at the origin (ie the x and y values are the same). Let the xi values be stated values, and the yi values be stated value +/- 0.5
In this case, (1,1), (2,2), 3,3), (4,4), (5,5)
This is nominally y = x
1/ If each yi measurement is at the upper bound of the uncertainty interval (1.5 … 5.5), a will be offset upward – y = 0.5 + x
2/ If each yi measurement is at the lower bound of the uncertainty interval (0.5 … 4.5), a will be offset downward – y = -0.5 + x
3/ If the yi measurement starts at the lower bound of the uncertainty interval and ends at the upper bound of the uncertainty interval (0.5 … 5.5), a will be lower and b will be be higher – y = -0.75 + 1.25x
4/ If the yi measurement starts at the upper bound of the uncertainty interval and ends at the lower bound of the uncertainty interval (0.5 … 5.5), a will be higher and b will be be lower – y = 0.75 + 0.75x
Extending the range to (1…10) will have no effect on cases 1 or 2, but will bring the intercept and slope closer to their nominal values of 0 and 1.
How do you “read[] uncertainty on a trend line”?
The readings are the data points. The trend line is calculated from those.
I must have worded it badly.
Nope.
The larger the uncertainties in the individual data points the larger the uncertainties in the trend lines. Sampling uncertainties may decrease if the uncertainty is all random, if you are measuring the same things, and the measurements are all done under the same environment. Not if systematic bias is involved.
Systematic bias is simply not amenable to statistical analysis. And trend lines, sampling error, etc are all statistical tools – and therefore cannot increase accuracy in the existence of systematic bias.
Claiming that averaging reduces/removes systematic uncertainty is the climate science equivalent of a perpetual motion machine inventor claiming he can reduce entropy.
and, for the same absolute uncertainty, the longer trend will have a lower relative uncertainty.
You will still miss the target. Extending the trend line over 100 years is like extending a small error in heading direction on your compass over many miles. Ask Daniel Boone!
If you can read a compass to better than half a second, good luck to you.
“”””Yes, totally agree that the larger the data set or longer the trend line the smaller the impact of instrument or sampling uncertainties.””””
Not really. A trend, especially a linear trend assumes the data it is fed is 100% accurate. Any “error” is based on how well the calculated line encompasses the data points. How uncertain the data values are never enter into the calculation.
Time has no relation to temperature. Developing a trend of time versus temp is useless in using seeing why the temperature changes. All you can say is that temperature has risen during this time period. Forecasting that what has happened in the past will continue in the future is soothsaying. It is why financial folks tell you past performance is no guarantee of future performance!
You can conduct sensitivity analysis to see the effect of using the extremes of the uncertainties.
Case 1. Take the lower bounds of measurements to the left of the midpoint, and upper bounds to the right.
Case 2. Take the upper bounds of measurements to the left of the midpoint, and lower bounds to the right.
These give you the extremes of the slope.
Well, strictly, you could interpolate the uncertainties so they transition smoothly between the extremes, with 0 at the midpoint.
Yep. That’s one of the things they taught us in Econometrics.
Interpolation is fine, but don’t extrapolate.
As it happens, one of the financial crashes occurred while I was an undergrad, so we saw this first hand.
I missed this when replying about slope of the line.
You got it.
Uncertainty can accumulate over time. It affects the slope of the trend line.
It’s why a small error in the initial conditions of a climate model can accumulate to a large value over hundreds or thousands of steps.
Climate science excuse? Measurement error is random, Gaussian, and always cancels.
That’s more a case of Lorenz’s sensitive dependence on initial conditions.
It doesn’t have to be an error in the initial conditions, just uncertainty. In Lorenz’s case it was just rounding.
Yep. +100
Don’t forget that calibration drift is typically accumulative also. If an instrument drifts up it seldom drifts back down the same amount for the next measurement.
I showed that on another thread and the B’s thought it was stupid. You get in essence an X, vertical angles if you will, and any trend that fits within that X is a legitimate possibility for the trend.
Trendologists forget that the purpose of a linear regression is to show what a combination of independent factors in a functional relationship can do over time. Unless you know how the factors combine, extrapolation is soothsaying.
That’s a good description.
“A trend, especially a linear trend assumes the data it is fed is 100% accurate.”
It does not. A regression is simply the best fit according to some metric, such as least squares. The uncertainty of the trend assumes that all points have a random error about the trend. There is no assumption about why they are not a perfect fit. It could be due to any number of factors, including measurement error.
“Time has no relation to temperature.”
It does. Have you never noticed a day getting warmer as time goes by?
“Developing a trend of time versus temp is useless in using seeing why the temperature changes.”
But it’s useful for determining the rate of change. Or whether there has been a change at all.
“The uncertainty of the trend assumes that all points have a random error about the trend.”
But that random error is between an assumed 100% accurate value and the trend line!
The problem is not the fit metric. The problem is assuming the data point is 100% accurate!
“t does. Have you never noticed a day getting warmer as time goes by?”
You have absolutely *NO* understanding of confounding variables.
If you stopped the earth from turning would the daytime temp go up over time? Time would still progress into the fourth dimension. But would the temp change?
The warming is actually related to the travel of the earth, not to time itself! You are actually plotting the change in the earth as it moves.
It is the best fit of 100% accurate data points. Have you ever entered uncertainty values for each data point into a linear regression? If so, what software did you use? I want to see what the possible linear equations would be.
Nope. If the uncertainty of the individual data points making up the trend increases then the uncertainty of the trend increases also.
You simply can’t escape the increase in uncertainty by always assuming that all uncertainty is random, Gaussian, and cancels. That’s the meme climate science lives by. But no other discipline I know of lives by that meme.
Uncertainty increases, just like entropy!
For a single station during the baseline calculation period, probably not. In the extreme cases, the original thermometers read low in the baseline period and the replacements read high subsequently, or vice versa. Either of those will bias the trend
“In the extreme cases, the original thermometers read low in the baseline period and the replacements read high subsequently, or vice versa.”
Which is why they try to detect such biases and correct for them.
How do yo detect those biases using statistical analysis and correct for them?
You might be able to identify that differences exist. How do you quantify what the correction factor should be when both field measurement devices will undoubtedly have different systematic biases?
Chimps is not representative of uncertainty. It is an example of probability, not uncertainty or even errors.
Uncertainty is more akin to having fat fingers when typing. You may think you’re hitting the “s” key but you get the “d” key. The next time you may get the “a” key. Your finger exceeds the resolution needed to always get the correct key. It is indicative of what you don’t know and can never know.
“Chimps” is my description of the probability that all of these hundreds of thousands to millions of systemic errors will magically line up over the decades to qualitatively change evaluated trends from close to actual to bogus.
Exactly. An example of a context switch where a systematic component becomes a random component is that of a set of instruments each with their own differing bias. Analyzed in the context of a single instrument the bias is systematic since it is the same for all measurements from that one instrument. But analyzed in the context of a many instruments the bias is random since each measurement has a set of biases. And, of course, if the set of biases had a mean of zero then averaging a sample of measurements selected randomly would exhibit an ever smaller bias as the sample size increased.
True, and utterly relevant. But I am describing what is required of these “systemic errors” to yield qualitatively different expected values from those known by The Imaginary Guy In The Sky, for the trends that are under most discussion.
While you’re here. California g’kids, 9 and 11 are here between Christmas and New years. We want to concuss them with Christmas cheer. So far, Zoo Lights, Candy Cane Lane, Mrs. Doubtfire at the Fox (seeing live shows is Christmas adjacent), family floccing up (oilfield slang) from Cal, Texas, Ireland. Anything worth driving out to St. Charles to experience?
Oh…you’re putting me on the spot there. Main Street appeals more to adults. We have a tradition of going to Melting Pot for dinner around Christmas time. It is fun for kids, but that is in St. Louis County and probably wouldn’t work so well with 9-11 kids. Sorry, not much I can think of in St. Charles County.
Thx. We’ll just chain them to the water heater and head up to Ameristar.
Error is not uncertainty!
Instruments many times have asymmetric biases that move in the same direction. Stopwatches very seldom speed up, they typically slow down but by how much for each instrument is UNKNOWN. Resistors in an electronic instrument tend to drift in the same direction but by how much is UNKNOWN.
Biases in most instruments is *NOT* random. That is just one more unjustified assumption that statisticians, computer programmers, and climate scientists tend to make – especially ones that have no actual physical reality experience with metrology.
It magical bullshit, uncertainty doesn’t work like this.
Until you realize that uncertainty is not error, you will continue to be trapped in this magical thinking.
That’s where it becomes fuzzy. What if all the instruments were from the same machine in the same batch?
“ But analyzed in the context of a many instruments the bias is random since each measurement has a set of biases. And, of course, if the set of biases had a mean of zero then averaging a sample of measurements selected randomly would exhibit an ever smaller bias as the sample size increased.”
How do you know what the systematic bias is in each instrument? If you don’t know then how can you assume a mean of zero when they are combined?
Did you not bother to read what I posted about asymmetric uncertainty for many types of instrument? How do asymmetric biases result in a mean of zero?
You are making unjustified assumptions all over the place. STOP IT!
He can’t even identify the sign of any individual bias.
They don’t have to line up! All they have to do is be UNKNOWN. How do you adjust for the UNKNOWN?
You can’t. What you can do is use your common sense. I.e., aks yourself what combo of millions of systemic errors, back and forth over decades – with constant attention being paid now and in the past to spot and correct them – could possibly, “yield qualitatively different expected values from those known by The Imaginary Guy In The Sky, for the trends that are under most discussion.”
Yes, it’s possible. Chimps Typing the Encyclopedia Britannica possible….
IOW, you and the rest of the Frankian cohort don’t really convince thinkers when you jump up and down and scream “LOOK AT THE UNCERTAINTIES” And Pat has the lack of cites (other than autoerotic self cites) to prove it.
In other words you just want to ignore everything people have been trying to teach you.
Clocks almost always run slower over time.
Resistors almost always increase in value over time.
These are just two, very obvious, examples of asymmetric uncertainty. And you can’t seem to get it into your head that if asymmetric uncertainty exists then it *can’t cancel!
Clocks, over decades of time, will exhibit systematic biases that can’t be identified and can’t be cancelled.
Electronic instruments over decades of time tend to drift the same direction as their components age. They exhibit systematic biases that can’t be identified and which can’t, therefore, cancel!
The climate science meme that all measurement error is random, Gaussian, and cancels simply can’t be justified no matter how much sophistry you want to indulge in.
This is magic thinking.
And it is exactly like claiming you can reduce entropy.
Good point!
Instrument calibration drift is very much dependent on environment. Each and every field temperature measurement device exists in a different environment. Things like insect detritus, just plain dirt blown into the enclosure by the wind, temperature extremes, etc are different *EVERYWHERE*.
In addition, electronic devices tend to have asymmetric uncertainties. Resistors, be they individual or on a substrate, all tend to drift in the same direction. Same for inductors, capacitors, etc.
Even things like stopwatches tend to drift in one direction, usually slowing down and not speeding up.
Yeah, wear and tear would be an example of a systematic error that changes over time.
We will still get the cancellation for instrument package changes, station sighting changes, etc.
The other thing to remember is that this cancellation is not a binary concept. Anytime r > 0 you get some cancellation when doing a subtraction per the law of propagation of uncertainty. So even when r = 0.9 (or whatever) you get a substantial cancellation of the error when anomalizing.
Nonsense. You just hope this is true.
Yet another indication you still don’t understand anything—uncertainty is not error!
“Yeah, wear and tear would be an example of a systematic error that changes over time.”
I agree. Now, how is the uncertainty and bias evaluation influenced when you have tens of thousands of them, occurring over decades?
It might switch context from a systematic component to a random component.
Might?
Do you spend time inventing perpetual motion machines?
It depends on the context switch. Anyway, see JCGM 100:2008 section E3.6 on pg. 57.
“Thus, when its corresponding quantity is used in a different context, a “random” component may become a “systematic” component, and vice versa.”
So you cherry-picked something from the GUM you think supports your magical thinking, just like stuffing the average formula into the GUM.
You get a D-: you don’t understand that error is not uncertainty, and uncertainty always increases.
““Thus, when its corresponding quantity is used in a different context, a “random” component may become a “systematic” component, and vice versa.””
You really don’t have a clue as to what this is saying, do you?
Stop cherry picking – you are getting as bad as bellman!
You do have an odd idea about what cherry-picking means. If you think the quote is out of context, explain what the correct context is. If you are saying there are contradictory parts in the GUM, then that’s a problem with the GUM.
There are *NO* contradictory parts in the GUM *UNLESS* you are talking pieces and parts (i.e. cherry-picking) while ignoring the context of the entire document!
It’s what you have done with Taylor and Bevington as well. You quote stuff from Taylor, Chapter 4 and higher while ignoring Chapters 1-3. Totally ignoring that Chapters 1-3 address situations with systematic bias and Chapters 4-on address situations with only random error.
In other words you pick pieces and parts as justification without considering the ENTIRE context involved. The very definition of cherry-picking.
“There are *NO* contradictory parts in the GUM”
So do you agree or not that it says systematic can be random or vice versa?
“*UNLESS* you are talking pieces and parts (i.e. cherry-picking) while ignoring the context of the entire document!”
And what context do you think is being missed?
“You quote stuff from Taylor, Chapter 4 and higher while ignoring Chapters 1-3.”
You have this weird idea that if something starts of simple and then introduces more advanced topics, that anything said after the introduction can be ignored.
And most of the time it’s actually been chapter 3 I’ve been quoting, especially the special case from 3.4. If you think there is context I’m missing you need to explain what that is, and not just hand wave, saying there are secret messages that only you can interpret.
“In other words you pick pieces and parts as justification without considering the ENTIRE context involved. The very definition of cherry-picking.”
That is not what cherry-picking means, and as I keep saying, if you think I’m quoting something out of context, you should be able to supply the correct context.
“So do you agree or not that it says systematic can be random or vice versa?”
Taylor: “For this reason, uncertainties are classified into two groups: the random uncertainties, which can be treated statistically, and the systematic uncertainties, which cannot.”
What don’t you get about this? If systematic uncertainties were random then they could be treated statistically! But they are *NOT* random.
“You have this weird idea that if something starts of simple and then introduces more advanced topics, that anything said after the introduction can be ignored.”
Unbelievable! *YOU* are the one ignoring stuff! Chapters 1-3. Chapters 4 and on are about RANDOM uncertainty, not (random + systematic) uncertainties! And you don’t think you are cherry picking when you can’t even distinguish this simple differentiation between uncertainties?
Do I need to quote Bevington to you again as well?
“And most of the time it’s actually been chapter 3 I’ve been quoting,”
No, it isn’t! You’ve been cherry picking pieces out of Chapter 3 with absolutely no understanding of the context you are extracting the pieces from!
“ If you think there is context I’m missing you need to explain what that is,”
It’s been explained to you over and over and over … ad infinitum. And you refuse to accept the explanations – taken right out of the textbooks!
Taylor’s Eq 3.18 and 3.26 is *exactly* the same as the GUM equation 10!
And yet you refuse to accept that. NO DIVISION BY N OR SQRT(N) ANYWHERE IN THE EQUATIONS!
“It might switch context from a systematic component to a random component.”
And exactly how does that happen?
https://wattsupwiththat.com/2023/12/17/nasa-giss-data-shows-2023-el-nino-driving-global-temperature-anomaly-increases-noaa-data-shows-u-s-nov-2023-temperature-anomaly-declining/#comment-3834166
You trendology lot just wish this to be true.
Any source of systemic error described here, if repeated, over and over, over time, will tend to contribute to a lower standard error of the trend, the more data you use, for longer. One of 2 events will occur. Either the average y value of that trend will be higher or lower than it should be, or it won’t. But what you and yours repeatedly intone as “UNKNOWN, UNKNOWN” is, in fact, totally predictable. That is, that you get into the Chimps Typing The Encyclopedia level of probability that those 5-6 figures worth of various systemic errors, occurring over time, will have any real effect on the expected value of the overall trend.
Oh, BTW, a Debbie Downer was mine. It tears me up to see how hard you take them, but…..
Once a clown, always a clown.
Hand-waved, word salad bullshit. Good job blob.
Like or not, just like entropy, uncertainty increases.
Oh and before I forget, uncertainty is not error.
Malarky!
As was pointed out once – the chimps typing something is probability, NOT STATISTICS.
Engineers take a course called “Probability and Statistics”. They are *NOT* the same. They are studied differently. They are different concepts.
The slope of the trend line *is* affected by the uncertainty of the measurements. If the slope is affected then linear trend lines with different slopes *will* diverge over time, it won’t converge!
The standard error of the trend line is how well the data point matches the fitted trend line. If the data points are uncertain then so is the trend line! Yet no linear regression of temperature trends have been shown here that take into account the uncertainty of the data points and their affect on the slope of the trend line.
You are still trying to throw crap at the wall hoping something will stick. You just made a mess on the floor! My guess is that you won’t clean it up!
If that was the case, why recalibrate any measuring device. It will work itself over decades of use, right? Thousands of certified labs would enjoy your conclusion, if only it was true!
Well, because the outputs will be improved. Mostly by improving the accuracy of y bar. Of course, your ilk will continue to intone “adjustments”, but that’s the price real science must pay….
Another idiot.
Going to save me some money! Won’t need to use the calibration lab any more to calibrate my oscilloscope, freq counter, or freq generator!
Hey blob, you try to pass yourself off as a Real Smart Guy, please to explain exactly how after-the-fact “adjustments” to historic data are the same as what happens in a calibration laboratory.
The are both adjustments. One occurs roughly concurrently. The other, when the error source is discovered. Are only certain kinds of errors eligible for correction?
How do you know what the correction should be for a field measurement device that you have no access to? Especially a decade ago!
That’s a whole process. Feel free to argue with the processors, but don’t deflect from my question. You and yours continue to hold only for certain kinds of corrections. i.e., those that you believe gird up your fact free arm waving about “Too much error“.
You seem to miss the Introduction to Engineering Statistics 101 point that you can, and should, both work to reduce error and consider whether you can arrive at the Engineered Answer (the answer that is good enough to use). The data, as it is, can be used to assess statistically/physically significant modern trends, for subsequent consideration of why they exist. I, for one, am glad that is happening.
Oh the irony.
Yep!
I am all for corrections. I am *NOT* for wild ass guesses that no one actually knows. I don’t follow carnival fortune tellers with cloudy crystal balls in my life and I won’t follow climate fortune tellers with foggy crystal balls in my work either.
Reducing error has to do with IDENTIFYING the error. Not with guessing at what the error might have been a decade or more in the past. It has nothing to do with adjusting 10 year old measurements based on information obtained today from a field measurement device.
Engineering Statistics 101 has *NOTHING* to do with this. Good enough to use *IS* using good engineering judgement to establish a reasonable uncertainty interval.
Trends made from inaccurate data are inaccurate as well. You can’t fix what you don’t know. You *have* to propagate the uncertainty in data points onto the trend if you want a real world view of what the data is telling you. We don’t live in statistical world where stated values are all 100% accurate.
Let me give you an example. I am assigned a project to put patina on a copper disk blanks that have been stamped with a logo. I design a tray that will be dipped in the patina fluid for a specified length of time and then the tray will be lifted out and moved to a washing station. I design a mixer with probes to insure the patina fluid is perfectly mixed from top to bottom and side to side.
And yet, after the process is tested some of the blanks come out shiny and some so dark you can’t read the stamping and some are perfect.
Do you adjust the patina concentration hoping that will fix the problem?
Or do you search for why blanks don’t react the same to the same patina fluid and fix *that*?
Nah, just do what the climate scientists would do. Throw away the bad ones, raise the price on the good to cover the loss, and hope another business doesn’t have fewer bad ones and undercuts your price.
“I agree. Now, how is the uncertainty and bias evaluation influenced when you have tens of thousands of them, occurring over decades?”
It’s all part of the GREAT UNKNOWN!
“Anytime r > 0 you get some cancellation when doing a subtraction per the law of propagation of uncertainty. So even when r = 0.9 (or whatever) you get a substantial cancellation of the error when anomalizing.”
No, you DON’T. You only get cancellation for random error and then only for measurements of the same thing under the same conditions. When you are measuring different things under different conditions you can assume you get some cancellation, therefore addition in quadrature, but you *must* justify that assumption.
Otherwise you could say that you get cancellation of errors when measuring Shetland ponies using a yardstick and measuring the heights of quarter-horses using the distance between you outstretched thumb and little finger and then combining the results into one average.
Again, normalizing does *NOT* change variance. And variance is the measure of uncertainty, not how precisely you can calculate the mean of a population.
The Big Lie of climate science: subtracting a baseline reduces bias error.
Show me the math. Use GUM equation 16 with y = a – b and r(a, b) = 0.5. Show me how the correlation term is either positive or zero.
What physical relationship does this subtraction of two variables represent?
ROFL!
Eq. 16 is the uncertainty for correlated measurements.
You ADD the correlation factor, you don’t subtract it.
If r(x_i, x_j) is positive then the correlation factor will be positive as well!
If the correlation factor is zero then there is no correlation factor for the uncertainty, multiplying by zero gives zero.
If it is positive then the correlation factor is positive and adds to the uncertainty.
Read the ENTIRE section.
“The combined standard uncertainty uc(y) is thus simply a linear sum of terms representing the variation of the output estimate y generated by the standard uncertainty of each input estimate xi (see 5.1.3). [This linear sum should not be confused with the general law of error propagation although it has a similar form; standard uncertainties are not errors (see E.3.2).]”
You and bellman are champion cherry pickers with absolutely no basic understanding of the context of what you cherry-pick.
Is this what the NIST Uncertainty Machine told him?
Absolutely.
“The specific condition that has to be met is that systematic error is invariant.”
That is the definition of systematic error.
“This constraint almost certainly doesn’t apply if different measurement instruments are used,”
It should do if you use the same instrument to calculate the base and anomaly.
“and over time may not apply to the same instrument due to wear or damage.”
And there I agree, and have said this several times. The issue with measurement errors here is not from individual monthly values – it’s from a systematic bias that changes over time. As I’ve said there has to be such a bias in at least some data sets or they would all have identical trends.
Not necessarily – see https://www.thoughtco.com/random-vs-systematic-error-4175358
I read what you wrote, but understand what you meant (the anomaly is reading – base) Apart from individual instruments being (hopefully) replaced by a freshly calibrated instrument on a regular schedule, even the type of instrument has changed over time.
Yes, the same regularly calibrated instrument should read the same over time.
The trends vary geographically in any case.
“Not necessarily”
Ah yes. That’s a good point. A systematic error can be proportional to the value. Which is a good way of introducing a systematic bias that changes over time.
Systematic error includes drift as well.
Yes, proportional uncertainty/error is a trap as well.
The other thing to keep in mind that anomalization comes with a tradeoff. You trade the partial cancellation of systematic error with an increase in the random component of uncertainty. The tradeoff is advantageous in the case of station temperatures since the changepoint jumps can add up quickly and the random component gets reduced quite a bit already during both the baseline averaging step and the spatial/temporal averaging step.
Word salad bullshit.
I don’t think you actually decrease any error by using anomalies.
The simplest case is that you just calculate an average temperature for the site for the time interval of interest (I assume a calendar month) over the baseline period (10 years, 30 years, 50 years or whatever) and ignore any measurement uncertainty and variance. That gives an offset to subtract from measurements to calculate an anomaly. That’s similar to subtracting the melting point of water from K to give C.
This then gives an anomaly for any subset of the base period of 0.0 degrees C +/- the uncertainty for that particular period, and with the variance of that period.
Strictly, the base period has an average temperature +/- uncertainty. I don’t think the uncertainty should propagate into the anomaly, because the comparison of any 2 periods should add the uncertainties of those periods in any case. Similarly, the variances of those 2 periods should be used.
Similarly, the changepoint jumps belong to the period, not the offset.
This is getting into areas beyond my formal training, so I may well be totally wrong.
You definitely decrease error. Consider a station with no climatic trend that has 10 changepoint jumps of +0.2 C each over a 100 year period. If you didn’t anomalize the data you’d get a spurious trend of +0.2 C/decade if the trend were computed from the raw absolute values. If, however, you anomalized each segment and then stitched the segments together and then compute the trend you’d get 0.0 C/decade. That’s not unlike how many datasets are currently doing it. The hard part is identifying the changepoints.
If a station has one jump point of 0.2C and you attempt to change it with a neighboring station’s trend, you would be changing the recorded values as well. What would you change them to? Would you just subtract 0.2C to all of the values? That’s completely absurd.
Yes.
It would be absurd not to. Curious…what you do?
Just to clarify…you shouldn’t change the record values. Instead you should create a separate timeseries with the corrections applied.
I don’t think you understand that a baseline is limited to one individual weather station and is NOT regional.
I understand what I station baseline is and how to calculate it. No offense here, but duh.
Anyway, back to my question…if you know there is a changepoint of +0.2 C why would you not remove it? What would you do instead?
I would hire the best quantum engineering experts in the real world, throw all of the possible currency that exists in hopes of them inventing a Time Machine.
And you think it is better than simply correcting the +0.2 C bias how?
Is what you are proposing even feasible?
You DON’T KNOW what you CANNOT KNOW!
These data mannipulations are fraudulent.
That’s why I say they are carnival fortune tellers with a cloudy crystal ball! NONE of their predictions have ever come to pass, NONE!
People who get their fortunes told by carnival hustlers sooner or later realize they are being hustled. But among the hustlers there *are* true believers that think they can actually see the future in their cloudy crystal ball.
Those true believes in the cloudy crystal ball are the climate scientists of today hustling the CAGW hoax.
Not to mention how they discern “biases” in historic data via reading tea leaves and goat entrails.
“Trust me, I’m a climate scientist!”
No, that’s my point. It is literally impossible. Do you understand the delicacy associated with recording temperature? These are literally two numbers with decimal points to the hundredth digit.
Then it sounds like removing the +0.2 C bias is the best option.
HTF do you KNOW the magnitude of the bias? You can’t even know the sign.
“Removing bias” is just like reducing entropy, it ain’t gonna happen, ever.
Consider a scenario where climate scientists identify a ‘step-up bias’ in an old record, perhaps due to a station relocating to a higher elevation in 1899. To address this bias, they examine a nearby station and aim to eliminate it. However, the process involves adjusting the actual recorded values in the dataset. For instance, if there’s a step-up error of 0.2°C, a climate scientist may ‘remove’ this error by subtracting that value from all recorded temperatures. This means that every temperature value would now be adjusted downwards by 0.36F. The recorded maximum temperature on April 24, 1899 was once 59.3F; it is now 58.94F. Does that really make sense to you?
That’s not how it works. They don’t adjust the actual recorded values in the dataset. They create a new timeseries and leave the actual recorded values as-is.
That’s not how it works. The maximum for April 24, 1899 is still 59.3 F. Nobody is altering the raw data. When a meteorologist looks up the high for that date it will still be 59.3 F even despite it potentially being biased too high. The correction is applied to a new timeseries that is constructed so that the bias that contaminates the recorded values is removed. The timeseries is often anomalized in the process and then is used for temporal and spatial averaging. The original timeseries is left unaltered.
Yes. If a measurement is biased 0.2 C higher due to a non-climatic effect then you should remove that bias. If you don’t you’ll get a spurious warming trend when you do your analysis. What doesn’t make since is publishing a warming rate of +0.2 C/decade over a 100 yr period with 10 changepoints of +0.2 C each. The would be unethical at best and fraudulent at worst.
Are you even aware of what you just said? The ‘error’ comes from the recorded values at that station’s new elevation. So you WOULD be changing the recorded values if you wanted to correct the error, because those are not the ‘right’ temperatures!
He simply doesn’t understand at all!
“That’s not how it works. They don’t adjust the actual recorded values in the dataset. They create a new timeseries and leave the actual recorded values as-is.”
In other words they GUESS at what they should use and those guesses are SUBJECTIVE, not objective!
They totally ignore calibration drift over time and apply the same adjustment to everything!
What the climate scientists ae using is SUBJECTIVE guesses without EVER increasing the uncertainty interval associated with that subjective guess! It’s part and parcel of the climate science meme that all uncertainty is random, Gaussian, and cancels. It can, therefore be ignored in everything they do!
Uncertainty is definitely not random. Variance itself undergoes real-time fluctuations as the Earth completes its orbit. The degree of variance observed on January 1 is likely to differ from that on February 1. Additionally, factors such as the sun’s angle during temperature recording, delicately capturing only two values for the maximum and minimum temperatures throughout the climatological day, contribute to the dynamic nature of temperature measurements. In regions with mountains, temperature inversions complicate the scenario, causing lower valley elevations to experience colder temperatures while higher elevations enjoy warmer conditions. The intricacies of these influences create a continuous and extensive list of considerations.You can’t know what you don’t know.
There used to be a meteorology site at the Tabernash-Frasier Colorado airstrip, that would many times be the coldest spot the weather service reported for the entire 48 states. It was in Middle Park, surrounded on four sides high mountains, except for a small gap where the Colorado River drains the area.
And don’t forget that night and day air temperature profiles are like, well, night and day!
It’s funny how they are unable to move beyond their statistical fantasy realm, resorting to downvoting comments and labeling you as a troll.
We’ve had the capability to calculate enthalpy at measurement stations for over 40 years, since 1980. Today we could have a 40 year long record of enthalpy deduced from temperature, humidity, and pressure measurements with time intervals ranging from 2 minutes to 10 minutes.. Yet climate science has adamantly refused to do this for some reason. They refuse to do it today.
Ask yourself why. Then go watch Fiddler on the Roof.
About the same length of time as the satellite temperature records, and longer than ARGO records.
yep.
Again, you want to take one value determined at one point in time and apply it equally to all points over all time.
Do you really not understand just how absurd that is from a physical reality viewpoint?
He apparently does not.
That is correct. I do understand why anyone would leave a +0.2 C bias in their measurements. In fact, I think the opposite. I think it is absurd that anyone would defend doing so.
I’m curious…just how far does your defense of this behavior go? Do you propose shutting down all of the NIST calibration laboratories. Do you propose banning the use of calibration offsets in industrial/manufacturing settings? Or do you limit your defense of this only to the physical sciences? Or is it just atmospheric and climate science that should be banned from this behavior?
That should read…That is correct. I do NOT understand…
No, I’m defending against the use of statistical analysis unfit for non-linear systems! You are in statistical la la land!
That’s not what is being discussed. What is being discussed is what you do with a +0.2 C bias. NIST, JCGM, myself, and the entirety of science says it should be corrected. You challenge that. I want to know how deep your challenge goes.
More lies, from the Father of Lies.
Systematic bias should be corrected for IF YOU CAN IDENTIFY IT AND QUANTIFY IT!
The issue is how do you identify it and quantify it in field measurement devices across time and space?
It’s all part of the Great Unknown.
Unless you are a statistician or climate scientist with an 8-ball that will tell you what it is.
They don’t know what they don’t know.
Once again you are not living in the real world. That +0.2C bias is for one point in time at one location for one device. We don’t live in a Zero dimension world. That bias value *can’t* be used across all of time and all of space.
The concept of uncertainty is how that is handled in the real world. The uncertainty interval encompasses all of time and all of space. The uncertainty can range from -0.5C to +0.5C for any specific instance as an example. You don’t know what the exact amount is, that is part of the Great Unknown but you know (or estimate) it is somewhere in that interval.
That is what Walter is trying to tell you, which you refuse to understand. It’s either willful ignorance or an inability to see the real world as it is and not as a statistics textbook with 100% accurate stated values used in its examples.
You know what, you sound just like a lot of medical researchers. Funny how that search for the lowest uncertainty number that can be calculated pervades climate science too. NIH, has finally tumbled on the replication problem in medical science and are started to push for using the SD and not the SEM as the general uncertainty interval that should be used.
When it comes to life and death maybe the SD is a batter indicator of the variance in treatments. Just like engineers have always done.
How do you know that +0.2C bias exists for all of the recorded interval of that measuring device?
Do you see it in your cloudy crystal ball?
What is the uncertainty interval associated with your GUESS at the +0.2C adjustment? Are you assuming it is 100% accurate for all of previous time?
This is the acme of obfuscation: this guy is essentially claiming that applying “bias” corrections is the same as what a calibration lab does to calibration an instrument.
The two are not even close to being the same.
…corrections after the fact to historic data…
And publish it as the official government time series.
What do you do? You increase the uncertainty interval estimate associated with the data and its average!
How do you know that all of the prior data points were off by 0.2C? You keep ignoring the fact that calibration drift happens over time. You can’t take the calibration point of today and apply it to data taken 10 years ago! You don’t know what the calibration point was 10 years ago!
Yep, absurd unless you are a statistician or a climate scientist!
He literally thinks that a 0.2C bias is an actual temperature.
Not at all. I think it is an error that is contaminating the record. As such it should be removed.
Still pushing FRAUD.
Liar.
This is data FRAUD.
That raises another question. The baselines are all for a specified period, so how do you handle stations which didn’t exist during that period? Stations which existed for the first half? Second half?
Models.
Create data from the ether.
Stations are grouped temporally into months and spatially into grid cells. A station that did report for a specific cell/month combination are ignored for that cell/month. Some grid cell/months have a lot of participating stations. Some have only one. Some have none. The number of stations participating in a cell changes over time as stations are commissioned and decommissioned.
Yes, but the baseline temperature to be used as an offset is calculated per-site, not per-gridcell. At least I hope it’s not opening that wiggly can of worms.
The changepoint jumps do *NOT* evaluate the size of any uncertainty associated with the jumps. Again, normalization only moves the distributions along the x-axis so that they overlap, it does *NOT* make them congruent. Movement along the x-axis that does *NOT* affect the variances of the distributions at all! And it is the variances that determine the uncertainty of the distribution!
That’s a quite different matter from the usual approach of choosing a base period and using the average from that period as an offset for that station.
You run the risk of getting into ENSO step function territory 🙂
Yep, identifying a valid changepoint is the challenge. That’s what Bill Johnston has been working on for a subset of Australian stations. It’s a very time-consuming exercise.
You are dealing with two random variables. Tmonth-avg is a random variable of ~30 data points with both a mean and a variance. Baseline is also a random variable with ~30 data points with both a mean and a variance. You can’t just add or subtract the means and ignore the variance.
Look at this video about adding random variables.
https://youtu.be/oUbC-KfesAU?si=nHeU_46ngepifKNf
Climate science and bdgex ignore the variance when subtracting random variables. The sum of variances gets thrown away and a new variance is calculated based on numbers that are at least one order of magnitude smaller. Do you ever wonder how uncertainty of ±0.5 becomes ±0.05 or even ±0.005? Smaller numbers!
This is what uncertainty is based on. It is where adding uncertainties in quadrature comes from. Both the GUM and NIST TN 1900 ultimately base uncertainty on σ of the data (measurements), i.e., standard deviation. To ignore it is not scientific. It is what programmers do to get smaller numbers.
Don’t be fooled by bdgwx’s holier than thou attitude of partial differentials canceling uncertainty, they do not. They are basically sensitivity values.
The ideal gas law is a perfect example. Use the equation
p = (nRT)/V.
What does a 10% change in each value one at a time do to “p”? Does a 10% change in T give a larger change than a 10% change in n?
Now think about the volume of a cylinder. The formula is
V = πr^2h.
Does a 10% change in h give the same change in V that a 10% change in r does? Maybe r should be weighted by a factor of 2?
Now think about 30 temperatures being added together. Does changing any one of them make a larger change to the sum than any other?
That was pretty much my starting point as well, until I considered the case of a subset of the base period. You would wind up double-dipping on the uncertainty and variance.
That’s why I think it’s actually valid to use the average of the baseline period as a stated value without uncertainty (beyond that implied by the number of significant digits) as the offset when calculating an anomaly.
Subtracting the offset from the baseline period gives an anomaly of 0.<however many 0s are appropriate> with the uncertainty and variance of the actual data points.
You are getting there! The uncertainty of the values used to calculate the anomaly certainly propagate into the anomaly. That’s what propagation of uncertainty is all about. Uncertainty grows whether you are doing an addition or subtraction.
I got there a long time ago, but while writing the earlier post I realised it was the wrong stop.
The problem there is that if the offset includes the base period uncertainties it doubles up the uncertainty when the base value is the period of interest.
The anomaly should certainly inherit the uncertainty from the period of interest, but the offset value needs to be treated as a stated value.
Even the offset value is “stated value +/- uncertainty”. You simply can’t assume uncertainty away from what is nothing more than a subjective guess.
Apply the offset value as “stated value +/- uncertainty” to the period over which it was calculated and see what happens to the uncertainty.
Is there any uncertainty specified in the offset when converting Kelvin to degrees C?
No—the 273.15 value is a constant defined by international agreement, the uncertainty is zero.
This is very much akin to how the modern value of c, speed of light in a vacuum, is a constant with zero uncertainty.
I know that. But why is is defined as a constant? “Just because” loses marks.
The second is also defined as a constant, as is the metre.
See https://physics.nist.gov/cgi-bin/cuu/Info/Units/current.html
and https://physics.nist.gov/cgi-bin/cuu/Info/Units/units.html
I am not a metrologist so this answer may not be the best.
Zero Celsius used to be defined as the triple point of water at standard pressure, but it is tough to replicate in a lab better than tenths or hundredths of a degree. This limits how well a physical ice bath can be used for calibrations. With the advent of absolute temperature (Kelvin), it became possible to merge the two scales just by fixing the value of 0°C. Whether it is actually an ice point or not doesn’t really matter.
The hard-core metrology people figured out that because of the way Cesium atoms are used in atomic clocks, it was possible to fix the values for time and length (details I can’t recite off the top of the head).
That is a blast from the past. I have a recollection that it was used for 0 degrees C at one stage, but it’s apparently 273.16 K give or take a smidgeon. Apparently the melting point is slightly lower than the triple point – https://physics.stackexchange.com/questions/505994/why-is-the-triple-point-of-water-defined-as-0-01-degrees-celsius-and-not-0
Too long ago and too many other things happened since those courses…
Kelvin was based on the Celsius degree size, like Rankine was based on the Fahrenheit degree size, so that was always the case.
As far as I know, the offset is defined as a constant to avoid double-counting uncertainty.
Otherwise, you could have 0 degrees C defined as, say, 273.15 +/- 0.005 K. Taking a measurement of the triple point of water as 0.01 +/- 0.005 degrees C and converting to K would give 273.16 +/- 0.01 K.
Converting this back to degrees C then gives 0.01 +/- 0.15, and so ad infinitum. Specifying the offset as a constant avoids this problem.
Yep, the same needs to apply to the rather arbitrary base offset used for anomalies.
The actual average will have uncertainty due to measurement uncertainty. That should be captured in its anomaly of 0.<however many zeros are appropriate> +/- uncertainty.
Converting from temperature in K, degrees C or anomaly and back shouldn’t change the uncertainty, so the offset used for the anomaly needs to be defined as a constant, just like the Kelvin / Celsius offset.
The questions I asked earlier about the uncertainty of the anomaly baselines pre-dated the realisation that the offset has to be defined as a constant to allow seamless bidirectional conversion between K, C and anomaly.
Almost all standards are “because”. Why is a meter a meter?
The speed of light is a fixed constant by definition. So is a mile. So is a second.
They can be redefined as needed. The pain in doing so is likely high. But it can be done. Just look at the definition of how long a second is.
Yeah, most of them are, but I was asking why the offset between the Kelvin and Celsius scales is defined as a constant.
I may have worded it poorly, but what was of interest is the fact that it is defined as a constant.
The value of the offset may be “just because”, but it’s a constant for a very good reason.
It’s a “constant” so everyone uses the same scaling factor making results comparable. Would you rather the relationship be a variable?
It has a value to allow switching between systems. It’s defined as a constant with no uncertainty interval so you can switch between systems without introducing additional error.
Measurements have uncertainty, offsets can’t.
Now that you mention it, hows does one convert 273.15K to Fahrenheit?
“Now that you mention it, hows does one convert 273.15K to Fahrenheit?”
Yep, 3 is probably the simplest.
That involves
1/ subtracting 273.15 to convert from Kelvin to Celsius?
2/ Multiplying by 1.8 (another constant) to rescale to Fahrenheit
3/ Adding 32 (another constant).
The rescaling in step 2 will have some rounding error, so converting between K and F multiple times will increase the uncertainty interval.
The gotcha, though, is that using the 273.15K offset to convert between K and C any number of times won’t introduce any additional error or uncertainty.
The ratio of one Fahrenheit degree to one Kelvin is 5/9 (another fixed constant):
(273.15K – 273.15) * 5/9 + 32 = 32F.
I outsmarted myself by using the melting point of ice.
How about 292.15K?
Oh, just noticed that you used 5/9 instead of 9/5. Don’t you just hate it when you do something simple like that?
Almost forgot. Marry Christmas, everybody.
s/Marry/Merry/
De nada, OC.
Have a Merry ChrIstmas and Happy New Year (AND A SAFE ONE TOO!).
Yup, got the ratio inverted.
You can’t “cancel” systematic error. It is not amenable to statistical analysis which is what would be required in order to cancel it, even partially.
“the random component gets reduced quite a bit already during both the baseline averaging step and the spatial/temporal averaging step.”
YOU STILL DON’T UNDERSTAND UNCERTAINTY! The average uncertainty is *NOT* the uncertainty of the average.
The uncertainty of the average is the range of values the mean might take on based on the variance of the data from which the average is calculated.
The average uncertainty doesn’t evaluate the variance of the population data. The standard deviation of the sample means does *NOT* give you the variance of the population. It only tells you how precisely you have calculated the population mean. If the population data is inaccurate then the average you calculate will reflect that population data inaccuracy. The more inaccurate data points you add to the population the more inaccurate the mean becomes. Finding the average uncertainty won’t change that!
Possibly. It may depend on the exact definition of systematic error. GUM defines it as the error left when you take an infinite number of measurements of the same measurand. If the error is drifting over time you wouldn’t converge to a single value, so that definition doesn’t work.
On the other hand, if you allow a trend to be a measurand, then the systematic drift will be a systematic error in the trend.
When I say that there can be a systematic bias in the trend, I thinking less of the possibility of the actual instruments drifting over time, and much more to do with environmental changes, or changes in how the data is recorded. An instrument may be 100% accurate, but if it gets moved from a naturally warm location, to a cooler one, there will be a bias in the trend. This needs to be corrected for, but no correction will be perfect.
“On the other hand, if you allow a trend to be a measurand, then the systematic drift will be a systematic error in the trend.”
And just how do you quantitatively identify what that systematic error is? You don’t know the systematic error in the data used for the first trend and you don’t know if for the data in the second trend either!
You are back to using your foggy crystal ball to make a wag guess.
“And just how do you quantitatively identify what that systematic error is?”
I’m not. If you knew what the error was you could correct it, but until you figure that out all you know is it exists given the difference in the trend between the two. That’s why it’s uncertain. It might come from differences in the instruments, or the modeling, or it could just be down to different definitions.
Why then do you always plot only stated values and/or the standard deviation of the sample means while ignoring the uncertainty of the data itself? The standard deviation of the sample means is *NOT* the accuracy of the mean.
The accuracy of the average of the data set is related to the standard deviation of the data for purely random data. The standard deviation of the population is: σ = SDOM * sqrt(n).
As the number of samples goes up σ goes up! And it is σ that is the proper measure of the accuracy of the mean.
Yep, his own pictures puts his story to the lie.
“The accuracy of the average of the data set is related to the standard deviation of the data for purely random data.”
How do you know the accuracy – you’re the one who keeps pointing out that the uncertainty estimates of the mean are not accuracy. If you mean the uncertainty from random factors, than that uncertainty is related to the standard deviation. The relation is SEM = SD / √N.
“The standard deviation of the population is: σ = SDOM * sqrt(n).”
Which is saying the same thing, but not in a particularity useful way.
“As the number of samples goes up σ goes up!”
No it does not. How can the population standard deviation be changed by the sample size? You keep making asinine claims like this and never listen to anyone pointing out you are wrong. It’s hard to avoid the conclusion that you are just trolling at this stage.
“And it is σ that is the proper measure of the accuracy of the mean.”
No it is not. At best you are equivocating between two different types of uncertainty. That of the uncertainty of the mean, i.e. how accurately the sample mean estimates the population mean. And the accuracy with which the mean will predict the next value, i.e. the prediction interval. Both are useful depending on the context, but I can see no meaningful way to claim the prediction interval is what is meant when we say the uncertainty of global mean anomaly.
“No it does not.”
Unbelievable! When I say σ = SDOM * sqrt(n) you agree that is correct.
And then you turn around and say that as “n” goes up “σ” does not!
“ How can the population standard deviation be changed by the sample size?”
The standard deviation of the population is changed BY INCREASING THE NUMBER OF INACCURATE SAMPLE POINTS!
You simply cannot increase the accuracy of the mean by adding inaccurate data points to the data set (i.e. increasing the sample size).
“You keep making asinine claims like this and never listen to anyone pointing out you are wrong.”
Not “anyone”. Just you, bdgwx, and AlanJ (at least in this thread). None of you have any basic understanding of metrology and uncertainty. All you have to offer are cherry-picked malarky which never actually address the whole context.
“At best you are equivocating between two different types of uncertainty. That of the uncertainty of the mean, i.e. how accurately the sample mean estimates the population mean. And the accuracy with which the mean will predict the next value,”
In the real world most of us live in just how useful is the precision with which you calculate an inaccurate mean compared to knowing the actual uncertainty of the mean which you have so precisely calculated?
I’ll say it again – you are stuck in statistical world. Assigning some kind of special importance to the precision with which you calculate an inaccurate mean. You don’t even understand what Taylor meant when he said the stated value of the measurand should have no more significant digits than the uncertainty associated with the meausrement!
It doesn’t matter if you can calculate an inaccurate mean out to the millionth digit if the uncertainty of that inaccurate mean is in the units digit! The stated value of the inaccurate mean shouldn’t go out further than the units digit even if you have calculated it out to the millionth digit!
As Taylor, Bevington, Possolo, and all other metrology experts will tell you the purpose of a stated value +/- uncertainty is to allow others making the same measurement to judge whether what they get for an answer is reasonable. When you say the accuracy of a mean is out to the millionth digit by using the standard deviation of the sample means as the accuracy of the measurement you are telling others that their measurement should be the same all the way out to the millionth digit. If it’s off in the tenths digit then they did something wrong!
Once again, YOU DON’T LIVE IN THE REAL WORLD.
“And then you turn around and say that as “n” goes up “σ” does not!.”
This has to be a wind up. I refuse to believe anyone is this stupid. But giving Tim the benefit of the doubt…
What do you think SDOM is? It’s just σ / √n. So as n goes up, so does the √n. But at the same time SDOM goes down. Your dumb equation is literally just
σ = σ / √n * √n = σ
The value of n is irrelevant.
I’m starting to think this is all a big act. I can understand not knowing what a partial derivative is, but conflating sums with averages, conflating addition (+) and division (/), and making trivial algebra mistakes that even middle schoolers can spot defies credulity.
The Block Heads give themselves high-fives while accusing others of being “stupid”.
I smell projection.
This from the guy that doesn’t even understand that the partial derivative in the uncertainty equation IS A WEIGHTING FACTOR for the uncertainty?
ROFLMAO!!
Ad hominem attacks are the last desperate act of people who have lost an argument.
Speaking of mistakes, how do the values of “a” & “b” used in f(a,b) also become values of uncertainty. How does a value of “-1” remain with a minus sign when you square it?
You are like the guys on X (Twitter) that try to convince people that since a single mean (average) has only one single value, it isn’t a random variable so you can add and subtract temperatures to your hearts content without worrying about uncertainty (variance).
See the term sensitivity coefficient? Another name is weighting factor. It is designed to account for variables with exponents in a functional relationship. This is because the uncertainty is in the actual measurement before to a power in the relationship so it should carry more weight! What do you think would happen if the functional relationship had a higher root?
“Ad hominem attacks are the last desperate act of people who have lost an argument”
Thanks. Not only have you destroyed all my irony meters, you’ve killed irony itself.
“See the term sensitivity coefficient? Another name is weighting factor.”
You’re really confusing yourselves over this. A weighting factor means that you are changing the relative importance of each value. It’s usually used when taking an average. If one value is given a higher weight it means the other values have a lower weight. Say you want the annual average based on monthly values, and to be accurate you know you have to weigh the months by the number of days in each month. It doesn’t matter if you multiply each month by the number of days, or if you multiply it by the fraction of the year that month represents, or by the ration that months days has to 30. The sums will be completely different, but at the end you divide by the appropriate amount, that is the sum of the weights. You get the same average in all cases.
This is not what is happening with the general uncertainty formula. The coefficients are absolute factors that change the size of that components contribution to the total uncertainty. If a coefficient is 2, the total uncertainty increases. If it is 0.5 it goes down. You may be shifting the retaliative importance of components, but that is not the main point. If all components have the same coefficient their relative importance remains unchanged, but the combined uncertainty changes.
This is the case with the uncertainty for an average. Compared with the uncertainty of the sum, you are scaling all values by 1/n. The sensitivity coefficient for each component becomes 1/n^2, and the combined standard uncertainty ends up smaller than that of the sum. But you are not changing the importance of any component, just seeing that the uncertainty decreases across the board.
bellman: ‘relative importance of each value.
bellman: “oefficients are absolute factors that change the size of that components contribution to the total uncertainty.”
Cognitive dissonance once again! Is that *all* you have to offer?
Are you *truly* trying to say that “relative importance” is not the same as “size of … contribution”??
” If all components have the same coefficient their relative importance remains unchanged, but the combined uncertainty changes.”
It’s not New Years Eve yet! PUT DOWN THE BOTTLE!
If everything has the same importance and nothing changes then how does the combined uncertainty change?
u(c)^2 = Σ (∂f/∂x)^2 u(x)^2
if the (∂f/∂x) is the same for everything then what changes to make u(c)^2 change?
“Compared with the uncertainty of the sum, you are scaling all values by 1/n.”
1/n is NOT* a scaling factor. What do you think you are scaling and what are you scaling it to?
“The sensitivity coefficient for each component becomes 1/n^2”
If n =1 then who cars about 1/n^2? IT IS STILL ONE!
In order for n to be greater than one you must have more than one average value in a distribution. For that to happen you have to have taken multiple samples from the population from which you can create multiple average values.
When you find the uncertainty of those multiple sample averages YOU ARE FINDING THE STANDARD DEVIATION OF THE SAMPLE MEANS! Or, as you and those in statistics world like to mischaracterize it, the standard error of the mean!
THAT IS NOT THE ACCURACY OF THE POPULATION MEAN. It is how precisely you have calculated the population mean. Specifying a mean with more precision than is in the measurement uncertainty of the mean is only fooling yourself! You can’t know that mean to any more significant digits than the measurement uncertainty allows!
Even if your measuring device reads out to the thousandths digit, if it’s measurement uncertainty is in the tenths digit then you are only fooling yourself (and OTHERS) that you know the measurand out to the thousandths digit. You don’t. It is just part of the GREAT UNKNOWN represented by the measurement uncertainty limits.
“Cognitive dissonance once again! Is that *all* you have to offer?”
“PUT DOWN THE BOTTLE!”
Ad hominem attacks are the last desperate act of people who have lost an argument.
“Are you *truly* trying to say that “relative importance” is not the same as “size of … contribution”??”
You missed of a few important words there. But yes. They are not the same thing. As you would see if you read and understood the rest of my comment. Say I have two contributions x and y, each with a contribution to the uncertainty of u(x) and u(y). If I multiply each uncertainty by 10, so the sum becomes 10u(x) + 10u(y), then I haven’t changed their relative individual importance, but I have changed their contribution to the total.
“If everything has the same importance and nothing changes then how does the combined uncertainty change?”
See above. Or just look at the equation.
“u(c)^2 = Σ (∂f/∂x)^2 u(x)^2
if the (∂f/∂x) is the same for everything then what changes to make u(c)^2 change?”
Try the equation where (∂f/∂x) = 0.01, and then with (∂f/∂x) = 100. Tell me if u(c)^2 changes.
“1/n is NOT* a scaling factor.”
It is if you multiply something by it. You scale the value.
“What do you think you are scaling and what are you scaling it to?”
I have a function that adds all the inputs and divides by the number of inputs. That is it scales the sum to 1/n it’s original size, we call this a mean. When you do that you also have to scale the uncertainty of the sum buy a factor of 1/n to get the uncertainty of the mean.
This can be shown using the specific rules for propagating errors when multiplication or dividing, and it can be demonstrated using the general rule for propagation of errors, and it works when using the general rule for combining uncertainties.
“If n =1 then who cars about 1/n^2? IT IS STILL ONE!”
Well yes. If I add one thing and divide by one the uncertainty doesn’t change. I’m assuming that you want an average of more than one thing, so n > 1. That’s usually why you take an average in my version of the “real” world.
“In order for n to be greater than one you must have more than one average value in a distribution.”
And every time I forget you just don’t understand how averaging world.
No, you are not necessarily averaging averages. I can take the height of 100 people and take the average of those heights. The individual heights are not averages, they are just a single measurement. I just need to know the uncertainty of that measurement, such as from a type B assessment.
But, yes, you could be hyper cautious and measure each person 100 times, and use the average of those as the best estimate of that persons height, in which case the uncertainty of that measurement would smaller as you would be using the so called “experimental standard deviation of the mean”. But it would mean taking 10,000 measurements, for little practical gain.
“You missed of a few important words there. But yes. They are not the same thing.”
The size of contribution is *NOT* important. Got it. Must be a rule in statistical world.
“Try the equation where (∂f/∂x) = 0.01, and then with (∂f/∂x) = 100. Tell me if u(c)^2 changes.”
Unfreaking believable!
In essence you are saying that z = x + y = 10x + 10y!
You can’t even tell that you are using TWO DIFFERENT FUNCTIONAL EQUATIONS!
(∂f/∂x) = 0.01 = 1/100. (∂f/∂x) = 100 IS NOT THE SAME FUNCTIONAL COMPONENT AS (∂f/∂x) = 0.01
“It is if you multiply something by it. You scale the value.”
It is *NOT* a scaling factor. It is a component of your claimed functional equation. Using your definition EVERY component of a functional equation is a scaling factor! So what does that imply?
“I have a function that adds all the inputs and divides by the number of inputs. That is it scales the sum to 1/n it’s original size, we call this a mean. “
It is a mean of a set of sample means. It’s the standard deviation of the sample means — IT’S HOW PRECISELY YOU HAVE CALCULATED THE MEANS. It is *NOT* the accuracy of the mean! You can have a very small standard deviation of the sample means while having a wildly inaccurate population mean!
“I’m assuming that you want an average of more than one thing, so n > 1”
A population has ONE AVERAGE! Not multiple averages. So how can n be greater than one?
Again, the only way for that to happen is for you to have means from a multiple of sample means taken from the population! The uncertainty of a set of sample means is the STANDARD DEVIATION OF THE SAMPLE MEANS. It’s the precision with which you have calculated the population mean. That population mean can be wildly inaccurate if the data is the population is wildly inaccurate – and the standard deviation of the sample means can’t tell you that! Only propagating the uncertainty of the population elements onto the average!
I’ve taken time out this Christmas morning to try and sketch out an explanation for you that will hopefully clear this up for you. I’ve attached it.
Again, if you have multiple averages then you have multiple samples and their standard deviation is a measure of how precisely you have located the population average. But it is *NOT* the uncertainty of the average of the population. The uncertainty of the average of the population is the standard deviation of the population or the propagation of the uncertainty of the individual elements in the population.
The equation is SEM = SDOM = SD/sqrt(n).
You *can* find the SEM (SDOM) without finding the SD (even though you say you can’t). The SD of the population is then the SEM (SDOM) MULTIPLIED by the sqrt(n).
And it is the SD of the population that defines the uncertainty of the population. It’s what Taylor, Bevington, Possolo, and the GUM all say!
It simply doesn’t matter how precisely you locate the average of the population if that average is inaccurate. The precision of the average should *never* be given more significant digits (decimal places) than the uncertainty magnitude. Averaging a set of sample means simply can’t increase the accuracy of your measurements!
A correlation of this is that a lot of smaller samples can give the same precision of calculation of the population average as one large sample. The LLN and CLT says so. But I’m pretty sure that’s going to go right over your head as well.
You are spinning like a top throwing out nothing that makes any sense. Perhaps you should use Christmas Day to think about that.
Egg nog could explain a lot.
He can’t read ANYTHING for meaning!
Eq. 10 from the GUM
Σ (∂f/∂x)^2 u(x)^2
If (∂f/∂x) = -1 WHO CARES???????
(∂f/∂x)^2 = 1 EVEN IF (∂f/∂x) = -1
And he accuses me (and you) of not being able to do simple math or understanding calculus!
If N = 1,(which it does for a single value like an average) or better yet (n)^-1 and (∂f/∂x) = -1
WHO CARES!
If you *do* have multiple values of an average then that tells me that what you have is a series of samples of the population and the averages are the averages of the samples.
When you find the uncertainty of that distribution of sample averages what are you finding?
IT’S CALLED THE “STANDARD DEVIATION OF THE SAMPLE MEANS”.
Or, incorrectly, the standard error of the mean.
The “standard deviation of the sample means” is an estimate of how precisely you have calculated the population mean.
IT IS *NOT* THE ACCURACY OF THE CALCULATED POPULATION MEAN!
The ACCURACY of that calculated mean is what Eq. 10 of the GUM gives you, the weighted sum of uncertainty in the individual elements in the distribution. There is no division by n or sqrt(n) in Eq 10!
“Buh-buh-buh it can’t be that big!” — Block Head J
He can’t tell you why o-rings exist or why the compression sleeve in his toilet fill valve has a radius of curvature perpendicular to the circumference.
He has absolutely nothing in his experience that has any meaning n the real world.
Nope!
Unfreakingbelievable.
You don’t KNOW the SD. All you know is the standard deviation of the sample means and the quantity of sample points!
So the population SD *is* SEM * sqrt(n).
As n goes up so does SD.
If the SEM goes UP as n goes up then you have a bad sample or set of samples. Otherwise it should remain fairly constant.
If it remains constant then SD *does* go up with the number of samples.
Again, the formula SEM = SD/sqrt(n) is misleading to someone living in statistics world and can’t understand why you don’t know the SD!
If you know the SD of the population then why are you worrying about the SEM?
“You don’t KNOW the SD.”
If you don;t know that then you don’t know the SEM Or are you still under the delusion that people take thousands of different samples, take the standard deviation their means, and then work out the standard deviation by multiplying it by root N?
“All you know is the standard deviation of the sample means and the quantity of sample points!”
Oh, you are.
“As n goes up so does SD”
Still utterly wrong. Try it, though prove me wrong. Try generating random samples on a computer using different sample sizes and see if increasing sample size increases your estimate of the population standard deviation.
Of course, if you think about it, you might realize this is a logical impossibility. The population is fixed. Whatever samples you take it will always be the same, so at best all you would have done is illustrate there’s a problem with your methodology.
“If the SEM goes UP as n goes up then you have a bad sample or set of samples.”
Definitely. It should be going down.
“If it remains constant then SD *does* go up with the number of samples.”
And you have a bad sample. Again though you are getting confused. n is the sample size, not the number of samples.
“Again, the formula SEM = SD/sqrt(n) is misleading to someone living in statistics world and can’t understand why you don’t know the SD!”
I guess every single statistician who ever wrote that equation in a book had no idea what they were talking about. What do statisticians know about statistics? Pity a genius like you wasn’t around a century ago to explain this to them.
“If you know the SD of the population then why are you worrying about the SEM?”
You don’t usually know the SD of the population, anymore than you know the mean. That’s why you take a sample and estimate it from that. You still don’t seem to notice that this is exactly what the GUM does with it’s type A estimates of uncertainty. Take a number of measurements, look at the sample SD, and estimate the population SD from it. Population SD is the standard uncertainty of a single measurement. And then they divide this by root n to obtain the experimental standard deviation of the mean, which is taken as the uncertainty of the mean.
“If you don;t know that then you don’t know the SEM “
PUT DOWN THE BOTTLE!
This is correct, he doesn’t understand the purpose of significant digits rules at all.
Just like he doesn’t understand that uncertainty increases.
GUM defines it as the error left when you take an infinite number of measurements of the same measurand.
Horse hockey. Why do you always, always ignore the context.
Look at the bolded part.
Do you know what repeatability conditions consist of for temperature measurements?
Do you KNOW the true value of each Tmax and Tmin when a measurement is taken?
What influence quantities can cause systematic bias? Do you realize that when Hubbard and Lin evaluated this using calibrated devices as a control, they concluded that each and
every station would need to be visited and tested.
There are so many influence variables that are different at each station, one correction value simply can’t applied.
“Horse hockey.”
That’s exactly the definition I game apart from some qualifications that were irrelevant to the point.
“Do you know what repeatability conditions consist of for temperature measurements?
Do you KNOW the true value of each Tmax and Tmin when a measurement is taken?”
Do you think anyone is taking an infinite number of measurements? You never seem to understand thew difference between what the definition is, and how you would calculate it.
As usual you avoided the actual issue.
If you don’t take infinite measurements then how do you know anything for sure? And that assumes you *know* the true value!
“If you don’t take infinite measurements then how do you know anything for sure?”
Do I really have to explain to you that you never take infinite measurements. You don’t know anything for sure – that’s why it’s uncertain.
“And that assumes you *know* the true value!”
No. I’m assuming you don’t know the true value / value of the measurand. If you knew that there would be no need to take any measurements.
You can’t calibrate field measurement devices in a lab before each measurement they take. The anomaly in winter can have a different trend than in summer merely from grass turning from brown to green or vice versa.
Calibration of a field measuring device will change from what it is in the calibration lab merely based on a varying measurement environment.
“That is the definition of systematic error.”
Systematic bias does *NOT* have to be constant. The systematic bias in a temperature measuring device can certainly be different at 0C than at 100C!
“As I’ve said there has to be such a bias in at least some data sets or they would all have identical trends.”
That’s not true either. If the data in the data sets are generated under different environmental conditions, e.g. Tmax and Tmin, the trends can be different, not identical.
“Systematic bias does *NOT* have to be constant.”
Yes as I corrected myself in the next comment.
“If the data in the data sets are generated under different environmental conditions, e.g. Tmax and Tmin, the trends can be different, not identical.”
Which comes down to the uncertainty caused by the definition of the measurand. This may be the case with satellite verses surface data, given that they are measuring different things – surface verses lower troposphere. But given both are being used as a measure of rising global temperatures, it is still uncertainty.
You just got run over by reality once again!
How can you define the measurand of Tmax being the same as the measurand for Tmin? They are taken at two different times from two totally different distributions from two totally different atmospherric samples.
If it is still uncertainty then how do you even know the sign of the anomaly let alone its true value?
“How can you define the measurand of Tmax being the same as the measurand for Tmin?”
Huh. Of course they can’t be the same measurand – I’ve no idea why ask the question.
If on the other hand the measuand is the rate of warming, and you don’t specify whether you mean the rate of warming of maximum or minimum or mean temperatures, then any of those could be a measure of the measurand, and the measurand could have multiple values.
He is trying to define the average uncertainty as the uncertainty of the average. They are not the same.
Yup.
First, you are using “error” and not uncertainty.
Secondly, you just dropped a variance calculation based upon the difference in data.
Dude, you are dealing with random variables consisting of a distribution of data. That distribution has a mean BUT it also has a variance from which uncertainty is calculated.
Read Sections 4 & 5 from the GUM. Why do you think uncertainty is based on s²(qₖ). That is VARIANCE. You can’t simply ignore it. Not even NIST TN 1900 ignores this as an element of uncertainty.
u𝒸²(y) = Σ (∂f/∂xᵢ)² u(xᵢ)². (10)
u𝒸²(y) = ΣiΣj (∂f/∂xᵢ) (∂f/∂xj) u(xᵢxj). (13)
Do you see any minus signs in these that would cancel any uncertainties?
That is why uncertainties always increase, they are added but never subtracted.
You have no business criticizing my algebra or calculus skills. You have no experience dealing with these issues.
Yes. It is in the partial derivatives. When the measurement model is y = f(a, b) = a – b then ∂f/∂a = 1 and ∂f/∂b = -1. That causes two subtractions to occur in the double summation since ∂f/∂a * ∂f/∂b = -1.
This is easier to see with the covariance form of equation 13.
u_c^2(y) = Σ[(∂f/∂xi)^2*u(xi)^2, i = 1 to N] + 2ΣΣ[∂f/∂xi * ∂f/∂xj * u(xi, xj), i = 1 to N-1, j = i+1 to N]
Σ[(∂f/∂xi)^2*u(xi)^2, i = 1 to N] is the independent term.
2ΣΣ[∂f/∂xi * ∂f/∂xj * u(xi, xj), i = 1 to N-1, j = i+1 to N] is the covariance term.
Notice that the covariance term is negative for y = a – b because of the partial derivatives when covariance between a and b exists.
Block Head G doubles-down on his clown act.
Yet he gets it correct.
You on the other hand just keep sniping from the sidelines, never contributing anything to the discussion, then whine when you’re downvoted.
He doesn’t get it close to right! “a – b” are measurements. He then takes those measurements and tries to stick them in an equation that is designed for variance.
No. The measurements are not what gets stuck into the equation, it’s the uncertainties of those measurements. You should understand this give it was you who brought up the two equations insisting there was no minus sign.
Look carefully at that partial differential term!
(∂f/∂xᵢ)²
Do you see that “²” exponent? You do realize that you cannot add standard deviations, you must treat them as variances, i.e., squared SD”s, there goes the -1!
Your whole post is whacky. y = (a – b) is the definition for one and only one instance of a value for a measurand. Where does the next and the next instances come from? Think
A = l • w.
You then start treating the measurements themselves as a standard deviation. The uncertainties are separate from the measurements. They are based on s², a varience, see equations in 4.2.2 and 4.2.3.
Then you don’t even address that when dealing with random variables the following applies:
μ(A + B) = μ(A) + μ(B)
σ²(A + B) = σ²(A) + σ²(B)
σ²(A – B) = σ²(A) + σ²(B)
It gets really tiresome dealing with programmers and statisticians who have never had any senior level physical science lab classes with nasty professors and discussing measurements and uncertainty. You all denigrate Pat Frank constantly but you have no inkling what a practicing analytic chemist does. This post just illustrates your inexperience.
“Do you see that “²” exponent? You do realize that you cannot add standard deviations, you must treat them as variances, i.e., squared SD”s, there goes the -1!”
You are not looking at the part of the equation where you do not square the partial derivatives.
ΣiΣj (∂f/∂xᵢ) (∂f/∂xj) u(xᵢxj).
For two variables a and b you are just multiplying (∂f/∂a) by (∂f/∂b) – no squaring. And if f is the function a – b, that’s (+1)(-1) = -1.
“Your whole post is whacky. y = (a – b) is the definition for one and only one instance of a value for a measurand.”
It’s a function. It can be used for as many different values as you want.
“You then start treating the measurements themselves as a standard deviation.”
He does not. You really demonstrate how little you understand what these equations are saying. u(x) means the standard uncertainty of x. At no point is x itself introduced into the equation.
I continue to believe that 90% of the idiocy you post stems from your inability to read.
The propagation of uncertainty in the GUM is:
See Eq. 10 in the GUM:
(u_c)^2 = Σ ((∂f/∂x))^2 (u_x)^2
The partial derivative of x with respect to f IS A WEIGHTING FACTOR for finding uncertainty.
It’s why Possolo,, when finding the uncertainty in measuring the volume of a barrel, used the factor of 2 for the radius uncertainty – because the volume is related to R^2. The partial of f with respect to R is (2)!
But hey! He can push the downvote button, so he must be right.
There is a reason why the GUM has deprecated the use of “true value” and “error” It requires one to know the true value – AND HOW DO YOU KNOW THE TRUE VALUE?
The true value is part of the GREAT UNKNOWN!
They don’t use the term “true value” because it’s redundant. The value of the measurand is considered to be true, and becasue a measurand might have any number of true values depending on how well it is specified.
“And how do you know the true value?”
You don’t. That’s why there is uncertainty.
Why then is that uncertainty never given for the daily median temperature in climate science? Why is it never propagated forward onto monthly averages, instead substituting the standard deviation of the samples means?
Nobody is using the “standard deviation of the samples means” as a substitute for the uncertainty of a monthly average. You are the only person who thinks there is such a thing as “standard deviation of the samples means”. Nobody is using SDOM, SEM or “experimental standard deviation of the mean”, or whatever you want to call it.
The estimates of uncertainty for a monthly average are going to be far more complicated than that.
Nobody is using the “standard deviation of the samples means”
Hit the wrong button!
So says the guru of making measurements. Maybe you should call this equation 5 from the GUM something other than “experimental standard deviation of the mean“.
s²(q̅) = s²(qₖ)/n
4.2.3
“So says the guru of making measurements.”
So says someone who knows next to nothing about making measurements, but does know how to read an equation, and words in a book.
“Maybe you should call this equation 5 from the GUM something other than “experimental standard deviation of the mean“.”
Which is not the same as “standard deviation of the samples means”.
“Maybe you should call this equation 5 from the GUM something other than “experimental standard deviation of the mean“.”
Look at the equations for SD and SEM at these sites. To paraphrase a common phrase made popular, “if the equations fit, then they are the same.
Standard Error of the Mean vs. Standard Deviation: What’s the Difference? (investopedia.com)
Read GUM Section C.3.8, it says this.
Here is another link to help your understanding.
5.2 The Sampling Distribution of the Sample Mean (σ Known) – Significant Statistics (vt.edu)
There are all kinds of names for how the various statistics . The key is to understand the equations.
You all need to spend some serious time studying measurement uncertainty under a professor. An example, is bdgwx professing that GUM Eq. 13 is an appropriate equation for temperature. It is incorrect.
Daily temperatures for a monthly average ARE INDEPENDENT. Dependence in measurement is when a previous measurement directly affects the next measurement. A good example is measuring the height of piece of Styrofoam. If you use a micrometer, it will compress the Styrofoam. If you measure again at the same point, you will measure a smaller value. Daily temps may be autocorrelated in time, but they are independent measurements because another measurement is not directly affected by the process of making a previous measurement. The key here is that time is not part of each measurement.
Eq. 10 is a proper equation for temperature measurements.
If you want to impress folks, read the GUM and tell us what NIST used to justify their treatment of a monthly temperature average in TN 1900. The information is in the GUM if you can dig it out.
He won’t.
He’s heavily into projection mode today.
“The value of the measurand is considered to be true”
ROFL!! Then of what use is the uncertainty interval?
You are showing your lack of knowledge concerning the real world. An abject, total ignorance.
How do you know the true value of the measurand? In essence what you are claiming is that the true value has a probability of 1 of being the true value and all other values have a probability of 0 (zero). I’ve been saying that for two years! The issue is that you can’t KNOW the value of the measurand in the real world. All you can do is ESTIMATE the value of the measurand. And your estimate is only as good as your uncertainty interval!
“a measurand might have any number of true values”
Cognitive dissonance at its finest!
As you quoted: “ the “true” value of the measurand (or quantity) is simply THE VALUE of the measurand (or quantity).” (capitalization mine, tpg).
The term “THE VALUE” is singular, not plural. There is ONE true value, not a number of true values!
Give it up! You can’t get ANYTHING right when it comes to metrology. No matter how hard you try to justify the GAT being statistically valid you just keep failing!
Laugh all you want. It’s what the GUM says
As usual, you are cherry-picking with absolutely no understanding of the context.
You pulled this from Annex D of the GUM. The very first sentence in Annex D states:
“The term true value (B.2.3) has traditionally been used in publications on uncertainty but not in this Guide for the reasons presented in this annex.”
You get upset when you are accused of cherry picking – and then you post cherry picked things like this!
You *NEVER* study anything for complete understanding. You just cherry pick things that you *THINK* justify your assertion and then you whine and cry when your lack of understanding of context is pointed out!
The very first line the quote you provided says this:
“The term “true value of a measurand … is avoided in this Guide”
It doesn’t even say what you think it says.
“The term true value (B.2.3) has traditionally been used in publications on uncertainty but not in this Guide for the reasons presented in this annex.”
And the bit you accuse me of cherry-picking is the part off the annex where they explain why they do not use the term “true value”.
At this rate I’m going to have to copy the entire GUM before you accept it’s not a cherry-pick.
“The very first line the quote you provided says this:
“The term “true value of a measurand … is avoided in this Guide”
It doesn’t even say what you think it says.”
I have no idea if you understand what point you think you are making now. I quoted the very line you stated. I’m explaining why the GUM does not use the term “true value”. I’ve quoted the entire section, and you still think I’m cherry-picking.
Once again you are trying to say the average uncertainty is the uncertainty of the average. They are *NOT* the same thing!
You keep falling back on the assumption that the standard deviation of the sample means defines the accuracy of the mean. It doesn’t. It just tells you how precisely you have calculated an inaccurate mean from inaccurate data.
This is what I mean. You don’t even know what an average is. You can’t even recognize the fact that my post in no way shape or form invokes an average…like…at all.
A statistical analysis of a random data set consists of an average and a variance.
The accuracy of that random data set is related to the variance of the data in the set.
A statistical analysis of a non-random data set, i.e. one where each data point has an uncertainty, consists of an average and an uncertainty interval propagated from the uncertainty of each individual data point.
The precision with which you can calculate the average value of that random or non-random data set depends on how many samples of the data set you use.
But that precision tells you NOTHING about the accuracy of a data set average whose individual members have uncertainty.
The average uncertainty doesn’t tell you the accuracy of the average nor does the precision with which you calculate the population average or the standard deviation of the sample means.
Again, for the umpteenth time, precision is not accuracy. The standard deviation of the sample means, which is what you are calculating when you use the sqrt(n) ONLY tells you how precisely you have calculated the population mean. If N is infinity then your value would go to zero. But you can’t have zero accuracy from inaccurate data! The probability of that happening also goes to zero!
Somehow you can’t seem to get it into your head that it simply doesn’t matter how accurately you calculate the population mean if the data you are using is inaccurate.
As km keeps trying to tell you, uncertainty is like entropy. It *always* grows, it never reduces. If there is *any* systematic bias at all then it is a physical impossibility for the accuracy of the mean to be 100% – but that is what you calculation implies by dividing by sqrt(n).
Not only are not addressing anything I just posted, but you aren’t even addressing your own confusion regarding what an average even is. And now you’re equating a concept you cannot even identify to entropy. And none of it has anything to do with GUM equation 13 and the fact that ∂f/∂b = -1 when f = a – b.
The partial differential is a weighting factor. All it does is act as a multiplier of the uncertainty associated with the value!
Uncertainties add, whether they are in the numerator or denominator.
The uncertainty of a/b (a * b^-1) is u_a + u_b. It is *NOT* (u_a – u_b).
If the formula is a/(b^2) then the uncertainty is u_a + u_b + u_b since the partial of b^2 is 2b. The uncertainty is *NOT* u_a – u_b – u_b.
You just keep getting further and further out in left field trying to justify using the standard deviation of the sample means as the uncertainty of the average.
Point 2 isn’t correct either. Winter temps have a different variance than summer temps so the anomalies will also have different variances.
How do you compare distributions with different variances? Just shifting them along the x-axis, i..e “normalization”, doesn’t account for the different variances.
The use of monthly baselines seems to be an attempt at a compromise. Daily baselines would be far too noisy, and quarterly would lose much more information than is already discarded.
Channeling my inner Nick, it’s shifting them along the Y axis.
No, it doesn’t account for different variances, so the monthly station baselines seem to be an attempt at a workable compromise.
Working from daily midpoints discards an enormous amount of information. Even using min and max would be a massive advance.
“The use of monthly baselines seems to be an attempt at a compromise.”
It’s not a valid compromise. It’s like saying that uncertainty is always random, Gaussian, and cancels.
Variance is a measure of the uncertainty of the average in a data set. The wider the variance the less certain the average becomes as a “true value”. It’s why standard deviation is considered to be the interval within which the average can be. If the average were always 100% accurate then there wouldn’t be any use in ever calculating the standard deviation (or variance) of a distribution.
“Channeling my inner Nick, it’s shifting them along the Y axis.”
The y-axis the value of the dependent variable. How do you “normalize” the value of the dependent variable? It’s value is its value.
I agree using min and max would be an advancement. Even better would be the use of degree-days, i.e. the area under the temperature curve. That would account for the differing distribution shapes (i.e. sinusoid vs exponential decay).
Ag science has moved to using degree-days. So has HVAC engineering. Why hasn’t climate science. The excuse is that they need to be able to use long records. It’s an unjustifiable excuse. You can run both median values of the temperature record right alongside the use of degree-days. At some point the degree-day data *will* become a long record!
But climate science just absolutely refuses to even *start* using degree-days. Why?
One example is to measure in degrees Celsius and chart in Kelvin, or vice versa.
You can’t scale one distribution without scaling all of them. That’s different than sliding one distribution along the x-axis in order to overlay it with another one.
It’s not scaling, it’s offsetting or “sliding them up or down”.
Under what circumstances would you offset the X axis?
I can think of a couple of overlays one might like, but they tend to apply to both axes and would require separate scales.
Sliding them up and down in value by using an offset doesn’t change their relationship.
Sliding them left or right on the x-axis doesn’t change their relationship, including variance of a distribution.
Distributions can be normalized to 0 (zero) on the x-axis to make comparing them easier. That’s doing nothing but sliding them left or right on the x-axis. It doesn’t change variance or y-value at all. Think of having one distribution in miles and another in kilometers. You want to use kilometers as the x-axis so you have to “normalize” the distribution in miles to kilometers. That shifts it along the x-axis but it remains the same distribution. You can even shift both distributions along the x-axis so the mean of both is at 0 (zero) to make comparing them easier.
Nothing in this changes the actual variance or range of the distribution, only the units used along the x-axis.
It *still* doesn’t allow you to added the distributions together without considering their differing variances and ranges.
Of course not.
You can either convert the miles to kilometres with the attendant conversion errors, or use 2 scales on the X axis. To bring them both into the same units you do have to convert miles to km, but that stretches the distribution rather than sliding it along the scale.
Yeah, renormalisation makes sense, provided it’s clearly noted. That’s effectively the same thing as using 2 scales on the X axes with different origins, but it would look neater.
Of course you can use two different scales but that still makes comparing each distribution a little more difficult. using the same scale for both makes it easier for the reader to compare them. Differences in variance become more pronounced.
You can actually put both at zero and use the same scale. Thus you get the benefit of both when visually trying to see what the statistical descriptors are telling you.
Yep, there’s more than one way to skin a cat.
No it does not. Each station has it’s own baseline. There is nothing “common” between two anomalies other than the period of time the baselines are calculated from.
Anomalies from different months at the same station don’t have a common baseline.
You’re just trying to throw stuff out and see if it sticks.
Its all hand-waved magical thinking—they need these claims to be true, ergo they must be true.
Anomalies do *NOT* remove systematic bias.
This is just you believing that the standard error of the sample means defines the accuracy of the mean. If the samples are inaccurate then the mean will *always* be inaccurate. No increase in the amount of inaccurate samples can fix that!
The standard error of the mean, or more correctly the standard deviation of the sample means only describes how precisely you have calculated the mean from the data. It tells you *NOTHING* about the accuracy of the mean you have calculated!
How many times does the graphic of shots on target need to be provided to you laying out the difference between precision and accuracy before it sinks in?
He still doesn’t understand the difference between error and uncertainty, yet he climbs up on his soapbox and tries to lecture about the subject.
The only ones listening are the alley cats.
Maybe it would be easier if you explained what you think the difference between error and uncertainty is. And then explain when the distinction matters.
“normalizes two timeseries onto a common baseline”
All it does is shift the distributions around on the x-axis. It does *NOTHING* to the variances of the distributions. How do you compare distributions with different variances?
The variance of winter temps IS different than the variances of summer temps so therefore the anomalies in winter will have a different variance than summer temps. How do you account for that?
I should clarify: I meant the highest recorded maximums and lowest recorded minimums over time. For example: the highest maximum temperature recorded in November 2023 was 65 on Nov. 13.
Here’s a rural weather station near where I live.
Coordinates are 42.12253, -111.314698.
This is no different than hundreds of locations around the globe. Sooner than later enough of the no warming stations are going to be seen through the magic of the internet. Climate science will be required to show how their numbers are arrived at. Folks like Nick need to do a better job of showing the computations used and how they meet standard assumptions for statistical analysis. Nick needs to find a paper that addresses measurement uncertainty from the ground up. That means from individual day Tavg.
“Nick needs to find a paper”
Why me? I am simply talking about temperatures in the same way that Larry Hamlin does in this WUWT article. Or many other WUWT articles. WUWT displays such temperature graphs on the front page. It has a whole information section devoted to them.
Nick, you are mistaken in your assumption that all individuals think the same thing with each other; I know that’s hard to understand because of your religious hive mind thinking.
Nick,
You are misleading with your use of anomalies as if they accurately represent our climate.
Hamlin is only using the same methodology as climate science. It’s ironic that you are criticizing him over doing so when it’s all *you* have as well!
Climate Science as a discipline needs to do exactly what Jim said, address measurement uncertainty from the ground up. The climate science meme of “measurement uncertainty is all random, Gaussian, and cancels” is just not supportable at all.
Even the daily average of (Tmax+Tmin)/2 is not supportable because each temperature comes from a different distribution. It’s like calculating the average heights of Shetland ponies and quarter horses and expecting the average to tell you something that is physically meaningful!
You’re basing that on just a single day for each month, correct?
What’s the trend over that period?
Just eyeballing it I would guess there has been a degree or two of warming.
Bellman, the trend comes from a rise from 1999-2008 or so, but since 2008 has been decreasing.
“but since 2008 has been decreasing.”
The problem is – when you are looking at small parts of the world, for single months, over a short period, you will see all sorts of trends, because weather has a huge effect locally.
Here’s an ugly graph I’m working on, showing the rate of warming at individual locations just for November. Looking at just the 2008 – 2022 period the trends are all over the place, with some areas warming at a rate of multiple degrees a decade, and overs cooling at similar rates. Your station marked with a green mark on the graph, is just on the boarder between rapid cooling to the North East and rapid warming to the West and South East. But it’s all pretty meaningless given the short time frame.
When extrapolating the trend for the same month to the early 20th century, the data reveals a negative trend in the lowest recorded minimum temperatures. I’ve noticed that when calculating the trends particularly during months that are said to be warming faster than others. Some winter months show faster warming of highest recorded maximum temperatures than lowest recorded minimum temperatures. At this station, the lowest recorded minimum temperature during the month of December is warming slower than the highest recorded maximum temperature for certain summer and spring months. This observation is intriguing. Is it not expected that maximum temperatures should exhibit a slower warming rate compared to minimum temperatures? Especially for winter temperatures? The R-squared value for all months were below 0.15. This doesn’t even factor in the assumption that these temperatures are being recorded as accurately as possible with no statistical measurement uncertainty.
You need to be careful in analyzing trends from raw station records. In this example, there is a rather obvious discontinuity around 1955, indicating that the station was likely relocated. The trend you’re seeing is an artifact of the station’s history, not changes in your regional climate. People on this website balk at the though of adjusting data, but it’s absolutely necessary in cases like this.
That only reinforces my earlier point that this analysis doesn’t account for the assumption that these temperatures are being recorded with utmost accuracy, without considering statistical measurement uncertainties. Looking at the metadata, the station’s location has moved to a different elevation 4 times. These are just the coldest temperatures recorded every month not the average. How is it possible to take data from the real world and decide what the real temperature should be? How can that possibly improve that accuracy of the data?
Also, I should point out that the step-up removal bias, presumably associated with PHA, doesn’t negate the observation that none of the seasonal trends—whether it’s the highest recorded maximum temperature in summer or the lowest recorded minimum temperature in winter—demonstrate consistent and significant seasonal differences. Even with adjustments, this fundamental aspect would remain unchanged.
“That only reinforces my earlier point that this analysis doesn’t account for the assumption that these temperatures are being recorded with utmost accuracy, without considering statistical measurement uncertainties.”
In metrology measurements are always given as “stated value +/- measurement uncertainty”.
In climate science temperature measurements are always given as “stated value” with an assumed +/- 0 measurement uncertainty.
In climate science, calibration never drifts and systematic uncertainty doesn’t exist. Leaving only random Gaussian error which is assumed to cancel!
Adjustments don’t take the data and decide what the “real temperature” should be. The recorded temperature is taken as the actual temperature value at the station’s (then current) location (unless an actual error is identified in the reading). The adjustment does nothing more than to align the measurements prior to the move onto the baseline of the measurements after the move, i.e. to remove the discontinuity. In other words, the work is not intended to “correct” incorrect temperature values, it’s intended to provide a homogenous record. Remember, the thing we need is that changes in the record over time reflect changes in the climate, not changes in the station history.
Here’s a simple illustration. Take a series with a big discontinuity representing a station move:
You can see that the station’s mean before and after the move are quite different. Apply a rudimentary adjustment of replacing the “before” mean with the “after” mean:
We haven’t changed the data values, just move the whole record to remove the discontinuity. We can no longer use this adjusted record as a log of temperatures at the two station sites, but that isn’t what we need to use it for, so that’s fine. We’ve removed the spurious (non-climatic) trend.
“The adjustment does nothing more than to align the measurements prior to the move onto the baseline of the measurements after the move, i.e. to remove the discontinuity. In other words, the work is not intended to “correct” incorrect temperature values,”
You can’t correct anything unless you know what correction to make. You can’t know that unless you have a time machine.
You are using fake data to try and fool everyone. Since when do temperature readings have a constant baseline? If they did then where is global warming coming from?
There isn’t a single field measurement device that I know of that remains 100% calibrated over time. Yet that is what you are trying to imply. It just tells me that you don’t have a good basic foundation in the real world of metrology.
Well, yes, of course.
Well, no, we can use deductive reasoning to infer inhomogeneities based on the available evidence (it could be documentary evidence of programmatically deduced inhomogeneities identified by breakpoints). We don’t have time machines, so scientists apply adjustments where they believe they are needed based on sound and well documented reasoning and methodology. Then present the results of the analysis.
We are talking about analyses based on historic data, and you seem to be acting as though there is some alternative to doing the best we can with the available data. I’m curious to know what your solution to the problem would be (and if it’s to throw your hands in the air and proclaim that we can’t know anything then I think your approach is less than useless).
“We don’t have time machines, so scientists apply adjustments where they believe they are needed based on sound and well documented reasoning and methodology”
Sound and well documented reasoning and methodology would include an uncertainty interval surrounding the adjustment values. That uncertainty would get added to the measurement uncertainty of the instrument itself.
Yet what we get is an adjustment value that is assumed to be 100% accurate across time and space!
That is sound reasoning in your estimation?
“I’m curious to know what your solution to the problem would be (and if it’s to throw your hands in the air and proclaim that we can’t know anything then I think your approach is less than useless).”
You keep getting pointed out to you that uncertainty intervals need to be included with EVERYTHING done in climate science. That is how you handle data which is uncertain! You document as best you can what the uncertainty *is*. The GUM typically calls this a Type B uncertainty based on good judgement!
That uncertainty interval allows others to judge how accurate your measurement is and what they can expect to see when making the same kind of measurement.
What do we get from climate science? Fortune tellers making supposedly 100% accurate prognostications!
Take nothing more than the so-called “daily average temp”. It is made up of two temps from a measurement device whose measurement uncertainty is likely to be +/- 0.5C at best. When you add two measurements the final result has an uncertainty that is an addition of the two component’s uncertainties. In this case it would be +/- 0.75C at best. Show me a climate study that uses this kind of uncertainty interval in calculating a monthly average, an annual average, or a decadal average.
What we get from climate science is the meme: “all measurement uncertainty is random, Gaussian, and cancels”. So the stated values are 100% accurate and therefore the daily average is 100% accurate!
It is crap from the word go! And it gets worse with every averaging step!
Why does every single discussion you are involved in pivot into an argument about your weird opinions on taking averages?
My opinions are *NOT* weird.
Statistical descriptors describe the data set. *ALL* appropriate descriptors must be included in order to actually understand the data. A single value, i.e. the average, simply is not sufficient.
A data set of (3,3,3) has an average of 3 with a variance of zero. A data set of (2,3,4) has an average of 3 but a variance of 1.
If all you give me is the average I have no way to distinguish how the data sets are different.
As the data set variance goes up so does the uncertainty of the actual average. Do you even understand that simple concept?
An average, by itself, LOSES valuable information. It’s why averaging winter temps with summer temps and just providing that average as some kind of an indicator or metric is simply unusable. It tells you nothing meaningful. And that applies to climate as well.
It was one of Freeman Dyson’s main critique of climate science. Climate science today is as far from being holistic as it is possible to get. An anomaly of 1C evaluated as being from -30C to -29C is totally different from an anomaly of 1C being from 20C to 21C as far as climate is concerned. That’s a HOLISTIC evaluation.
By ignoring everything but an average temp climate science is making judgements on incomplete data. You may think it is weird to point this out but take my word for it – in all other disciplines, be it physical science or engineering, using only averages leads to all kinds of consequences – and none of them are good for those who do so. As I said, it’s why bridges and buildings collapse. You *have* to consider the accumulated measurement uncertainty across multiple items when designing something that literally carries civil and criminal liability.
If we do move into a long cooling period over the next 100 years do you think there won’t be some kind of consequences for those in climate science today predicting that we are going to see mass starvation and migration from the Earth burning up? All based on a single average with no consideration of other needed statistical descriptors?
“A data set of (3,3,3) has an average of 3 with a variance of zero. A data set of (2,3,4) has an average of 3 but a variance of 1.”
Your opinions are weird. You pontificate a lot about stats, but when you get into actual numbers, you never get it right. The variance is 2/3.
Nitpick Nick strikes again!
The adjustment is flawed because it assumes uniform temperature behavior everywhere. If one attempts to interpolate or, in this case, eliminate the step-up trend using data from a neighboring station with different topography, snow cover, cloud cover, etc., it introduces inaccuracies. For instance, on the recorded date in my records (Nov. 16, 1955), when a minimum temperature of -18°F was noted, it is highly likely that the temperature was not recorded solely from the air. On that day, there was also a recorded snow depth of 4 inches. Considering the region’s mountainous terrain, there could have been a temperature inversion, influencing lower elevations to be cooler and higher elevations warmer. These are just some of the issues I can highlight off the top of my head; correcting these errors COMPLETELY would require a time machine.
That’s not true. PHA is a robust method that is tolerant of the non-uniform temperature behave of neighboring stations. See [Menne & Williams 2009] for details on how it works.
That study only shows how to determine when a shift occurs. It does nothing to help evaluate how much or why it occurred, both of which are necessary in order to determine an appropriate adjustment factor, especially for past data.
Don’t look here, look there! There is nothing to see here!
If you can’t use the adjusted temperatures then why are they published at all?
Tell us one other SCIENTIFIC endeavor that allows one to adjust their data just to obtain a “long record”! Tell us one financial endeavor that is allowed to adjust past data to achieve a long record.
What if the IRS did that after you received a raise? Would you think the additional taxes being owed would be ok?
How about a nuclear plant adjusting released radiation data downward to obtain a long record to match new equipment?
With a station move, how do you justify saying the previous data is incorrect. Temperatures vary over really small differences. The only, I repeat only reason data is adjusted is so climate science is able to say, “Look, we have long records that show warming”.
That isn’t what I said, I said you can’t use the adjusted record as a log of temperatures at the two station sites. You can now use the adjusted record as a long term record of climate change, which is the thing we want to use it for. You couldn’t use it for that before it was adjusted.
You aren’t saying the previous data are incorrect. You’re saying they’re incongruous with the recent part of the series. When the reader recorded the temperature at the previous location, they dutifully recorded the temperature displayed by the thermometer. That was the correct temperature at that location. Had the station been in its new location at the time, the temperature that the reader recorded would have been different. Both temperatures would have been correct. The adjustment isn’t correcting an incorrect measurement, it is homogenizing the series so that it’s as if the station always existed at its present lat/long/elevation.
Yes, you are saying the old data was incorrect and needs adjustment.
You even said that the choice of changing old vs new was arbitrary. Guess what will happen if you adjust new temperatures and calculate anomalies.
If I want to compare my salary with my grandfather’s salary, I need to adjust for inflation. I can either do this by adjusting my own salary down based on inflation to my grandfather’s time, or I can adjust my grandfather’s salary upward to reflect inflation since he retired. It doesn’t matter which way I go, it won’t change which of us is the higher earner. I am not saying his salary or my salary are incorrect, I am saying they are inhomogenous and can’t be directly compared without adjustment.
This is what I mean when I say the adjustments to historic temperature data are not intended to correct measurement errors. We aren’t saying, “someone went out and recorded the wrong temperature at the station on June 5th 1903,” we are saying there is an inhomogeneity in the series that needs to be accounted for if we are to use the series as a long term climate record – there is some phenomena imparting a trend into the series that isn’t related to the climate.
You don’t have the same series any more. The station is at a new location. You were recording over THERE, and now you’re recording over HERE, and they’re not the same.
Let’s take the extreme example: the station is moved from Miami to Fairbanks. How do you “adjust” the data to eliminate the discontinuity? If you (rightly) say that data can’t be adjusted, where do you draw the line? Is moving from the beach to the tiki bar “adjustable”? From the beach to Fort Lauderdale? To Boca? Charleston, SC.
What’s your scientific basis for an “adjustable” difference beyond a WAG?
I’m not aware of any station being moved across the continent, but such a move would preclude use of the station as a representative sample of the regional climate, so you wouldn’t try to adjust the offset in this case. But again, I think it is a purely hypothetical question. Station moves are typically a few km at most.
Was there any doubt that was a hypothetical? You still didn’t answer the question: where do you draw the line? I have a simple answer — if the station is moved far enough that a discontinuity is apparent in the record, you start a new record.
You could move a station from the ground up to a rooftop ten feet away and still produce a discontinuity. But, sure, your approach is valid. So is identifying the discontinuity and adjusting for it in-place. As long as you deal with the station move’s impact on the series trend, you’re golden.
And you are a data fraudster.
You should start a new record regardless. You have no idea of what past data represents as far as uncertainty.
What you should do when analyzing the combined data is increase your estimate of the total uncertainty interval to encompass all the possible values the temperature could have taken on over the interval.
“If I want to compare my salary with my grandfather’s salary, I need to adjust for inflation.”
Why do you keep on using situations that simply don’t apply? For salary you have fixed values with no uncertainty!
You don’t have that for temperature measurements.
If your measurements have uncertainty then your trend line has uncertainty as well.
Exactly what is your estimate of the uncertainty in the GAT trend line? Do you even have a clue? Or do you just assume that it is 100% accurate?
The scenario I described applies very well to the conversation I was having with Jim. It does not necessarily apply to some other, unrelated conversation you want to have instead. But I’m not sure why that would matter.
Why do you think you haven’t changed the data values? You obviously HAVE changed the value, by “replacing the ‘before’ mean with the ‘after’ mean.”
You want it this way because it ruins the narrative if you start the record anew. You “need to use it” and so you change it to what you “need” it to be.
Yes, but your unique station site might be experiencing a different pattern of change than the larger region or the globe. What drives the global trend is the fact that more places are experiencing a positive trend than places experiencing a flat or negative trend.
“ People on this website balk at the though of adjusting data, but it’s absolutely necessary in cases like this.”
Total and utter malarky!
Unless you have a time machine you have no knowledge of that the calibration drift over time for the old location and station was. Without that knowledge you cannot effectively “adjust” any past temperature data accurately!
All you can say is the calibration of the station was off by XdegC today! You simply cannot apply that value to temps even a day old let alone months or years old.
The *ONLY* thing you can do that is scientifically valid is to start a new temperature record for the new station while ending the old record.
Does that mean you can’t artificially create long records in many cases? ABSOLUTELY!
So what? Doing anything else is LYING about the “long” record being factually accurate. It won’t be. It can’t be. No amount of “statistical analysis’ will help. Statistical analysis simply can’t identify systematic bias in a measurement device. It’s just not possible.
Unless you are a climate scientist of course.
Just another climate fraudster.
I’m not talking about a calibration drift, but an actual, physical relocation of a station from one point on the planet’s surface to another. This change can and often is recorded in the station’s logbook, but can also often be inferred programmatically by identifying breakpoints. A station move does not mean that the temperature values records by the station prior to the move are wrong or invalid, it just means the station’s record is not homogenous. This is a problem if you want to use the station’s record as a homogenous time series for the purpose of analysis, so we apply an adjustment.
It doesn’t have to be calibration drift of the measuring device. There are any number of influence quantities that can drift measurements. These all must be treated as uncertainties that add to the total uncertainty. None are included in any meta records I have seen. How about some of these:
different grass under a screen,
paint fading on a screen,
tree growth blocking wind,
tree growth changing wind direction,
tree growth blocking sunlight,
nearby land use changes.
Most of these are gradual and can’t be found statistically.
Why do you think UHI is beginning to have more and more attention?
When you are dealing in one-hundredths or even one-thousandths of a degree, you are your own worst enemy because you drag more and more uncertainty influence quantities that need attention, which no one in climate science ever deals with. At these levels, there are lots of uncertainties that are no longer negligible.
Pairwise homogenization algorithms actually do identify trend drift in addition to step-discontinuities like the one identified above. Some of the things you mention introduce negligible differences in trends, some of them (land use change) actually produce a change in the regional climate and are not spurious trends at all.
“Pairwise homogenization algorithms actually do identify trend drift in addition to step-discontinuities like the one identified above.”
Malarky! Pair-wise homogenization of WHAT? The old and the new device? A new device and one 100 miles away?
If it s the old and the new device then how does that algorithm figure out what to apply to temperature measurements made a decade ago?
If it is the new station and one that is a distance away then how does terrain, geography, etc. get factored into the adjustment value for a decade ago?
What people on this website do is look at the results of what you do when you make adjustments.
It has long been obvious that anyone can concoct elaborate sophistry, and talk long and hard in sincere sounding tones.
But none of that makes what they say true.
The plain truth is, whenever data sets have been altered, whenever infilling and homogenization and whatever other “techniques” you have devised are used, the result is the same, and it is nothing like what is seen in unadjusted data and/or measured data sets.
Whenever warmistas concoct anything, lo and behold, all of their ideas are confirmed! Which is surely, to them, far preferable to historical records and measured results that refuse to comport with warmista jackassery.
How come the coldistas aren’t preparing global temperature estimates? Why doesn’t Anthony turn the might of his readership onto the challenge of building the WUWT official temperature index? It’s easy to sit on the sidelines and hurl rotten vegetables, a bit harder to actually get in the ring. The folks at Berkeley Earth tried to do it, but came away convinced that the warmistas had it right all along.
Here’s my own effort at compiling a land-only surface temp estimate:
The black line represents the raw data with no adjustments, no infilling, no homogenization. Here’s a comparison of NOAA’s adjusted global land+ocean dataset with the raw data:
If it’s all fraud and fabrication intended to prop up false claims of global warming, why are the scientists adjusting the data downward to show less warming? The whole conspiracy theory angle makes no sense on its face.
You are starting to see some of the problem. Why is the U.S. not seeing this in the CRN. Why are numerous other non-UHI affected stations not seeing a hockey stick.
Many of us have started accessing stations whose location is far from UHI and they are like CRN. Sooner or later you are going to need to deal with this. Your “homogenization” spreads UHI and You’ve never bothered to look at it since simple averaging hides it.
“’m not talking about a calibration drift, but an actual, physical relocation of a station from one point on the planet’s surface to another. This change can and often is recorded in the station’s logbook, but can also often be inferred programmatically by identifying breakpoints.”
No one is saying you can’t identify break points. The issue is how you adjust past data (or future data) to continue a long record. If you don’t know the calibration drift over time of the original measurement device then how do you do any adjustments to the past (future) data?
“A station move does not mean that the temperature values records by the station prior to the move are wrong or invalid, it just means the station’s record is not homogenous.”
If they are not homogenous then they should be treated as separate measurement data sets and *NOT* adjusted using someone’s guess to create some kind of “long record”. That is, at its base, nothing more than creating a fraudulent record.
“so we apply an adjustment.”
And how is that “adjustment” determined for a decade or more in the past? From the *current* difference between the old and new measurement device? So that temperature measurements mad a decade ago get the same adjustment as those made today?
I mean, that’s just choice you can make during your analysis. Treating the same station as two separate records before/after the breakpoint requires the exact same amount of work and the exact same series of steps as homogenizing it in-place as a single series.
I’m not sure that I understand what you’re asking. Adjustments are determined either via the existence of documented evidence of the biasing agent (e.g. recorded changes in time of observation), or programmatically, by applying a set of logical rules (e.g. identification of breakpoints via an algorithm). What matters is that you justify and document your decisions so that others can evaluate your analysis. If you think different adjustments should be applied using different rules, you are free to propose your own methodology and present the results of your work.
It’s also important to note that the adjustments are an optional analytical step. You could argue for preparing a temperature analysis that employs no adjustments to the raw dataset whatsoever. Perhaps you think the risk of introducing an error via your analysis is greater than the risk of inhomogeneities in the station network. You just need to present your analysis and justify your decisions.
Doing that for YOUR analysis is not a problem. Doing it and publishing it as THE OFFICIAL government data IS A PROBLEM!
The other issue is that what you are describing should be a one-shot deal. Yet we know that multiple changes are made to the same station data and other nearby stations. The only conclusion to make is that changes are being propagated multiple times. Fishy.
Why is it a problem? The NOAA/NASA are mandated to produce climate indexes for the US and globe. This requires analyzing historic temperature records. They publish their methods and results in peer reviewed journals and operate transparently.
If you’re suggesting that government agencies shouldn’t be conducting/publishing scientific research, I think that’s a pretty goofy stance.
Tell everyone why changes are not being made to new temperatures? If your desire is a long record, why not make new data connect to old data instead of vice versa.
Taking my example from above, where I adjusted the earlier part of the record to be consistent with the later part, you could just have easily don the reverse, and brought the present “down” to align with the past. The amount of climate change reflected in the record would not change one iota no matter which direction you went. Do you see this? Instead of saying, “what if the station had always been sited where it is located today?” We just as easily could have said, “what if the station had never been moved from its original site?” But the answer is the same either way.
The reason adjustments are made relative to the present is simply convention – we live in the present and it is our frame of reference, so that is a sensible choice. But it doesn’t matter which you pick, you just have to make a consistent choice.
Exactly what are the biasing agents at the temperature measuring device at Forbes AFB in Topeka, KS?
If you can’t document and evaluate every single biasing agent then how can you assume the temperature measurements are 100% accurate?
That is how Berkeley Earth does it.
If the station’s record is not homogenous, then it is not homogenous, and nothing can be done to make it so, except in your imagination.
Do you even read what you write? “A station move does not mean that the temperature values records by the station prior to the move are wrong or invalid, it just means the station’s record is not homogenous. This is a problem if you want to use the station’s record as a homogenous time series for the purpose of analysis, so we apply an adjustment.”
If it’s not homogenous, it’s not homogenous. If you call a dog’s tail a leg, how many legs does it have?
That makes no sense. Homogeneity is a property of a group of stations, not the individuals. It means that they are operated undet the same conditions.
The key is that you want to use the measurement as representative of some region. If something happens to the station,, like a move, that creates a discontinuity, then that change is not representative of the region.
Representative doesn’t mean all other stations in the region would show the same temperature. That is why the climatology of each is subtracted to form an anomaly for that station. That is the first and greatest homogenisation step. It is far more likely that they will show the same anomaly.
Your logic doesn’t hold.
Why is a station move that causes a difference with data from the old location not representative of the region where it is now located?
You appear to not have any appreciation of physical science.
If I measured the total harmonic distortion In a device and recorded it over 10 years and then made a change that lowered the THD, would you believe me if I went and changed all the old data to match the new data then told you the device has always operated that way?
Take a station on a mountainside and move it down into the valley. The mountainside has a cooler mean temperature than the valley does, so the station’s temperature will now read higher on average. Fit a linear trend to this series and you will see that the move has imparted a positive trend. But the positive trend is not because the regional climate warmed, the trend is because the station was moved from a cool place to a warm one. Thus, there is a “change” indicated by the station record, but it does not represent a regional climate change, it represents a change in the station’s history.
Once again, the GAT is a meaningless quantity that cannot represent “the climate”.
“Thus, there is a “change” indicated by the station record, but it does not represent a regional climate change, it represents a change in the station’s history.”
How do you *KNOW* it doesn’t represent the regional climate change?
There is a lot more valley area than there are mountain tops! How do you know that it is the mountaintop data that is representative of the regional climate change?
Well, I’m not the one who referenced a single station’s record as being homogenous; that was AlanJ.
How far would a station have to move to affect the homogeneity of the group of which it was previously a part? Just enough to create a discontinuity in the record?
That is just patently false. Scientists homogenize timeseries in nearly every discipline of science all of the time.
So much bull crap!
Name one science endeavor using measurements that “homogenize” data measurements even in a time series by actually changing data.
They may normalize measurements to a common base, but homogenizing data by changing values immediately throws results into suspicious bucket. Where do you think the “replication crises” has originated from?
1000+
How these persons can defend these fraudulent data practices is totally beyond my comprehension.
“That is just patently false. Scientists homogenize timeseries in nearly every discipline of science all of the time.”
So says an amateur statistician who has repeatedly shown an inability to relate to the physical world.
Ask any scientist if they can “adjust” values from one experiment to match the results from a different experiment. In medicine you would be prosecuted for fraud should someone die from believing your “homogenized” results.
Bingo! You got it!
Adjusting the shear strength of beams purchased a decade ago to match the shear strength of beams purchased today would create a long “homogenous” record.
Would you trust a bridge built from a combination of beams a decade old and new beams from today?
No, the proper scientific solution is to end the record at the first site and begin a fresh record at the second site. The idea of a weather station is to record data at a particular site, and if the weather station is moved, it is NO LONGER recording data at that particular site.
Again, that’s a design choice you could make, but you end up following the same process. And sometimes you don’t know if the breakpoint occurred because of a station move or something other, undocumented reason. So you need a strategy to deal with undocumented breakpoints.
That’s why the weather station was initially installed, but that is not what scientists compiling climate indexes want to use the station record for. They want to use the station record as a representative sample of climate change in the surrounding region, so it doesn’t matter if a station was moved around within the region so long as the move doesn’t impart non-climate related trends.
If scientists wish to use your adjustments in their research, that is their decision. They can justify the use of modified data when documenting their research.
It is another matter entirely for the national government to make those adjustments and then show them as the OFFICIAL temperature record.
If the purpose is to create a long record, then why isn’t new data adjusted to match the previous data?
You haven’t answered this question with any kind of scientific reasoning! Only that it is an arbitrary decision! That is not the way science is accomplished.
Show us a paper that has addressed biases arising from changing previous data to match new data versus changing new to match old data.
You have not answered what other scientific endeavors or legally bound labs exist that are allowed to change past data because it doesn’t match new data. That should give you pause about your claims if you can’t find any.
Your refusal to answer questions makes you into a troll!
Just like Nick Stokes.
Why? Are you saying that government agencies should only construct climate indexes using unadjusted datasets? How is this better than using datasets adjusted for systematic bias and clearly documenting that this has been done?
I’m not sure what alternative you’re trying to propose, here.
There is no bias imparted. You can’t even come up with a hypothetical scenario for us in which there is even a possibility of a bias being imparted based on this arbitrary decision, so I don’t know why you keep hounding the point. It’s a non-issue.
When does this EVER happen?
Certainly not with this GAT nonsense.
“How is this better than using datasets adjusted for systematic bias “
How do you identify the adjustments needed for systematic bias? Both Bevington and Taylor say statistical analysis can’t do it.
How do *YOU* do it?
By picking a station at random and assuming it has no systematic bas and then calibrating other stations using its readings?
“There is no bias imparted.”
OF COURSE THERE IS! No field measurement device escapes calibration drift between the calibration lab and the field site. If nothing else it’s from the calibration lab not duplicating the microclimate at the field location!
This is just one more unsupported assumption made by climate science – no such thing as systematic bias! it goes right along with assuming all uncertainties are random, Gaussian, and cancels.
Do you even recognize that the measurement uncertainties of electronic measurement devices can easily be asymmetric? That’s because things like resistors typically always drift in the same direction. Same for other electronic devices. Even in mechanical devices the uncertainties can be asymmetric. Stop watches very seldom speed up, they typically slow down – meaning their uncertainty estimates are asymmetric.
It’s simply not obvious that you have *any* experience in metrology at all!
He can’t even tell you the sign of any systematic thermometer error.
“Just put a bunch of them together and POOF! They all disappear!”
They are all trained in statistics using examples that *NEVER* once showed how to analyze a data set that didn’t have 100% accurate data.
Their training was all based on data sets like (1, 2, 3, 4, 5, …) and not on (1+/- 0.5, 2+/- 0.7, 3+/-0.1, …..)
They simply don’t know how to do anything but find the average of the stated values minus any uncertainty interval. They then treat any uncertainty values as just another data set whose average is the only descriptor of interest and not the variance of the stated values.
And they simply refuse to question their beliefs in how metrology actually works.
Which is exactly what BEST does. Guess what…BEST shows nearly exactly the same amount of warming as every other dataset.
And they are trusted by the same amount.
“Nearly exactly”, huh? Don’t remember seeing that term in my physics textbooks at university.
Very close. BTW…my grammar is terrible. It is an deficiency I humbling admit.
It’s no different than measuring the shear strength of a set of beams from Manufacturer A and then using that average to apply to a set of beams from Manufacturer B in order to create a “long” record over all of the beams!
Would any civil engineer remain employed if they did that for use in constructing a bridge?
“ because weather has a huge effect locally.”
You are your own worst enemy!
Climate is supposed to be weather over a long period. If the weather at different locations is different then their climates are different as well. And the average of the two climates is meaningless in physical terms.
But that’s if you are really serious about trendology. Here’s what monthly spread for latest one was. Look at the variability. See how even just using single number for a month on a chart is daft:
Day:
Here’s the minimum temperature over time. Different pattern than the maximum temperature; look at how the trends are both different.
The variance associated with the data is large. Yet it is totally ignored by climate science when calculating their averages and anomalies. Temperatures in Boston and San Diego tend to have small variance because of the moderating influence of the oceans. Temperatures far inland, such as on the high plains of the central US can have a huge daily, monthly, and annual variance. Trying to find the “average” of places like Boston, San Diego, and Lincoln, NE when you see such differences in variance is a fool’s errand. It winds up being meaningless physically.
Nick why don’t you use your undoubted research, mathematical, technical and analytical prowess to put the very basics of “global average temperature” under scrutiny.
By doing this, you will undoubtedly arrive at the only rational conclusion that “global average temperature” is a nonsensical construct.
(averages of dissimilar readings over dissimilar sitings at dissimilar timeframes etc etc etc. averages of averages of averages of averages of averages of averages as nauseum)
“to put the very basics of “global average temperature” under scrutiny.”
Of course I do that. There is a complete exposition here.
You are using GISS
You are not a totally ignorant zealot.. therefore….
You must KNOW it is JUNK DATA. !
Go and scream at Larry Hamlin, above. He has given graph after graph of GISS and NOAA data.
That answer is just dancing around the point. The issue Hamlin points out is that the “global average temperature” that is usually referenced comes from this. Why don’t you address the question about this metric being inadequate for making policy decisions. Tell what the best temperature for the earth is, then using your skill in manipulating the temperature data, show where we currently lie based on that.
The author makes very specific arguments, he is not making broad generalizations here.
That he is able to make these points using data published by the climate liars themselves is telling.
I for one am still waiting for anyone to explain how it is in any way possible for an entire large continent to have an entirely different set of trends from the planet it is sitting on?
Or the likelihood of the only large continent-sized area with extensive long term data over the entire historical period, somehow having long-term trends that show no long term warming while the rest of the planet, including the oceans that surround this continent, gets ever hotter?
Only models and fake data show record heat. Actual temperatures, as measured by actual scientific devices, by actual human beings that were looking at those devices at the time of the observations, show nothing of the sort.
No actual places are hotter than ever, but somehow they all add up to a hotter than ever planet?
Anyone who believes that is even possible, let alone the truth, is seriously deluded.
“I for one am still waiting for anyone to explain how it is in any way possible for an entire large continent to have an entirely different set of trends from the planet it is sitting on?”
Me. too.
The United States was hotter in the 1930’s than it is now. No CO2-induced warming here.
Climate alarmists should explain why the United States is cooler now than in the recent past even though there is more CO2 in the air now, than then.
Ditto for the MWP. Alarmists try to make it disappear by asserting that it was only present in Northern Europe. They never explain why nor how.
Yeah, as if one little spot on the globe, Europe, will have elevated temperatures for years while the rest of the globe is not experiencing elevated temperatures.
I don’t believe things work that way.
YAWN.!
He is showing that GISS data is meaningless.
It is just that you haven’t figured that out yet.!
Wasn’t GISS the one that they found had used arbitrary adjustments to try to keep it in lockstep with rises in CO2?
You do keep citing that site run but a totally twisted zealot, though..
Maybe you don’t know any better. !
Maybe you are that twisted and ignorant.
An hypothesis which produces zero accurate predictions is wrong, and nothing which has been predicted has come to pass.
Not one single thing.
More coral than ever, larger harvests than ever, islands larger than ever, sea levels have not budged from trends that go back 150 years, no trend in Arctic ice, glaciers not disappearing, no permanent droughts, snow not disappearing, skiing not a thing of the past, no new normal for tropical cyclone activity or intensity…wildfires, heat waves, SST, polar bears, flooding, ocean pH, floods, tornadoes…everything is just like always, fluctuating as ever has been the case and in every case well within levels and numbers defined by recent historical precedent.
What is the hypothesis? What are the wrong predictions? This is just displaying measured temperature.
Measured URBAN temperatures… meaningless.
And I suspect you are well aware of that fact.
What hypothesis?
Indeed.
Sorry to confuse you.
I shall endeavor to hew more closely to the exact topic under discussion at a given moment.
Absolutely right. Don’t ever try to make Nick have two thoughts in his head at the same time, he just can’t cope.
from your link:
“People think of averaging as just adding N numbers and dividing by N. I often talk of weighted averaging – Σ wₖxₖ / Σ wₖ (x data, w weights) Dividing by the weights ensures that the average of 1 is 1; a more general way of implementing is just to divide by trhe result of applying what you did to x to 1.”
It’s nonsense. This basically does nothing but shift the data from each station along the x axis so all stations temps overlay each other.
It does NOTHING to address the variances of the temperature data due to seasons, terrain, geography, etc. It can’t make the individual station data into identically distributed distributions. If that isn’t done then nothing you do with statistical analysis means anything. It’s like finding the average height of a group made up of Shetland ponies and quarter-horses. What does that average height have to do with anything? If that average height changes how do you know what caused it? Did someone turn more horses into the corral? Was the change due to fewer Shetland ponies? More quarter-horses? Vice versa?
Anomalies don’t help. If the variance of StationA data is different than the variance of StationB data, then the anomaly calculated from StationA will have a different variance than the anomaly from StationB. Shifting the data along the x-axis won’t change it either.
Why don’t you actually address this issue instead of just using the argumentative fallacy of the False Appeal to Authority – and it is false because the authority you chose is as wrong as you are.
“estimate the integral of each as that area times the average of the sample values within.”
BTW, all the talk about Riemann and integration is just fog. If you were integrating temperatures to come up with degree-days and then finding the average degree-days, then it would apply. But that is *NOT* what is being done with the global temperature average. Nor is the discussion about weighting useful. It assumes all data points in a grid have the same variance. They don’t. It’s why the “global average temperature” is useless to describe anything.
“We have dozens of climate regimes on the earth right now, not one, and they all behave somewhat differently. The notion that there is one number, a temperature of the earth that they all work in lockstep with is absurd.”
“I could ask you ‘What is the temperature of the Earth?’ How do you answer that?”
Richard Lindzen
Thanks Tim for laying bare in detail the nonsense that is “global average temperature”.
They should show the base temperature they are using to determine if another temperature is an anomaly.
Very well said. GAT is an unphysical nonsense.
Thanks Nick.
That’s an impressive description you’ve produced of the mathematical gymnastics used to arrive at a “global average temperature” construct.
But my criticism of g.a.t. is not the mathematical “how” this construct is produced, rather it’s the “what”, “why”, “when”, “where” considerations and origins of inputs that are.
And ultimately, the uses and misuses made of the end constructs.
Like many technological developments, just because they CAN be produced, does not hold that they are actually needed, valid, proper or practical applications.
It’s the irrationality of it all.
And with the g.a.t. construct, it’s like an embezzler replacing the notes from the cash safe that he’s trousered with same-value Monopoly money notes, and then thinking that the auditors will never discover his trickery.
It’s just lame.
BTW, I read your paper. The only mention of measurement uncertainty was incorrect and you failed to correct the poster. I am assuming you agree. Anomalies are a subtraction of the means of two random variables. The rule for doing this is that the variances add. This means the uncertainties add! They do not get smaller!
Of course like all climate scientists, you can ignore this and just find the variance of numbers that are one ot two orders of magnitude smaller than the random variables used to calculate them. It is no wonder that the variances are much smaller even though they are also wrong.
“The rule for doing this is that the variances add. This means the uncertainties add! They do not get smaller!”
I discussed this rather extensively in some posts, linked in the final one here. The variances add only if the variables are independent. But within the anomaly base range, they are not independent, as a matter of arithmetic, but correlated, and the uncertainty does reduce.
But the main thing is that the variance of the base average is small.
Should I be impressed?
And you are still wrong.
Scafetta published a paper earlier this year which compared decadal temperature averages to model outputs, showing that those with a higher ECS ran hot.
Schmidt published a response, based on higher variances for the decadal averages. This showed that there was sufficient overlap to not rule out not running hot.
How does this compare to the calculated variances for the anomoly base periods for individual stations?
Meaningless word salad. Temperatures in different locations are *NOT* correlated to each other, they are correlated to a confounding variable known as TIME! The claim that temperatures are not independent, a typical assumption in climate science, only shows that statisticians and computer programmers make up most of the climate science crowd.
The temperature curve on the west side of a mountain *IS* independent from the temperature curve on the east side of a mountain. That’s due to terrain, geography, and weather. They are both correlated to time due to the travel of the sun across the earth as time progresses. That does *NOT* mean they two curves are correlated to each other.
Anomalies are calculated from the difference between a constant, the average temperature, and a variable, the current temperature. How can a variable be correlated to a constant? The covariance between a constant and a variable will always be 0 (zero). If correlation is then calculated using covariance it will also always be 0 (zero).
This is *NOT* the same thing as calculating measurement uncertainty. Each measurement value being combined will have a measurement uncertainty unless you are in climate science and assume that all measurement uncertainty is random, Gaussian, and cancels. When the values are combined the measurement uncertainties ADD, whether you are adding the values or subtracting them. The addition may be direct or quadrature but they *still* add.
Do *YOU* assume that all temperature measurements across multiple measuring stations and devices are random, Gaussian, and cancel?
“How can a variable be correlated to a constant?”
You seem to be unable to manage elementary arithmetic. The anomaly base is an average of temperature readings over a period. It is a random variable, because it is the sum of random variables. And it is correlated, within that period, by arithmetic. If a nd b are iid, then a+b a random variable is correlated with a (and b) with coefficient about 0.5. Doesn’t matter if it’s temperature, on a hillside, or whatever
“The anomaly base is an average of temperature readings over a period. ” (bolding mine, tpg)
The average BASE is A SINGLE VALUE! It is, therefore, a constant when it is applied against a changing variable.
The average doesn’t change on a daily basis and *is* a constant when applied to daily temps.
correlation = cov(x,y)/ [s(x)s(y) ]
cov(x,y) –> Σ [(X_i – X_avg)(Y_i – Y_avg)]
If you are using a constant as the value for X then (X_i – X_avg) = 0 (zero) since X_i and X_avg will always be the same value.
If the covariance is zero then the correlation becomes zero as well.
And you accuse me of not knowing elementary arithmetic?
You don’t even know elementary statistics and yet here you are trying to defend the improperly applied statistics!
The long-term climate of the Earth is a 2.56 million-year ice age named the Quaternary Glaciation. The Earth is in a warmer, but still cold, interglacial period that alternates with very cold glacial periods.
https://en.wikipedia.org/wiki/Quaternary_glaciation
There is also a Grand Solar Minimum that has just started which is expected to last 30 years.
Modern Grand Solar Minimum will lead to terrestrial coolinghttps://www.tandfonline.com/doi/full/10.1080/23328940.2020.1796243
NOAA predicts the Sunspot Number, which reflects solar output, will start dropping in 2025 and continue dropping until it reaches zero in 2040 when their prediction ends.
https://www.swpc.noaa.gov/products/predicted-sunspot-number-and-radio-flux
If anything we should be cheering for the warmth.
Oh look, another Nick-pick JUNK graph.
Showing differences which are totally immeasurable and INSIGNIFICANT at a global scale..!
And of course, we all know that GISS is massively affected by urban and airport data…
… and has ZERO possibility of producing anything remotely real at a global scale…
… and generally isn’t worth even a stale mouldy cracker.
Well, look at that. We’ve hit the 1.44°C statistically identical to an imperceptible 0.06°C below the dreaded 1.5°C that is supposed to be Thermogeddon… AND…Crickets.
No great tipping
No minor tipping
No thermal runaway
Guam is still right way up
Great Big Nada
Now XR can go home and find a new cause
gonna be 60F here in Wokeachusetts later in the day- nobody is complaining
How do you explain that during the so-called “hottest year evah”, the US and in fact the planet just produced a record shattering harvest of all the basic grain crops?
During the actual hottest year on record, back in the 1930’s, tens of millions starved to death in the resultant famines, and entire country sized areas in various regions were turned to dust and blown away.
The truth is that all of the data sources are being run and managed by a gang of corrupt liars and is thus utterly useless for any purpose of rational fact-based discussion, let alone for any rigorous scientific analysis.
In the case of most Climastrologists it isn’t “Rigorous Scientific Analysis” but rather Religious Scientific Analysis
Higher temperatures in the 2.56 million-year ice age the Earth is in, named the Quaternary Glaciation, is a good thing, not a bad thing.
The US is so cold that everybody must live in heated houses, drive heated cars or take heated public transportation, and own warm clothes and shoes, for most of the year.
Nick, it is a super el niño just like 1997, temperatures will come down, i promise.
They will come down. But to where? It is actually just an average Nino, much weaker than 1887/8. But here are the monthly averages from the GISS chart Larry showeded:
1997 31 40 52 34 34 54 34 41 52 61 64 59
1998 58 88 63 63 68 77 66 65 42 41 43 55
And here are the 2023 numbers
2023 87 97 120 100 93 108 118 119 147 134 144 ****
See the difference?
1887/8 – looks like I’m not the only one really missing the edit function!
Nick,
Those are some really ugly graphs. I can’t imagine any private sector BoD or Ex-Com that wouldn’t immediately suspect that someone in the organization was either trying to cover up a problem or pull a fast one. Generally speaking, if a point can’t be conveyed in a straightforward manner, it’s probably invalid.
That’s an absolutely hilarious response. Please provide the portions of the L A Times article that detailed such material and further explain how such items change anything claimed by the Times.
If it helps, to understand the difference between global and USA temperatures, here’s a comparison of November 2016 and 2023.
All around the equation. FROM THE EL NINO !!
But hey.. El Ninos are all you have.
So use them to get your climate panic fear going. !
Really? Actual honest-to-god temperatures are they? Are you sure?
They look a lot like artificially contrived anomalies to me and one thing I am certain of is that anomalies are not temperatures.
Have you ever asked yourself why the hot and cold areas always move around? Why don’t the hot land areas especially stay hot or cold if CO2 is the problem?
One of your depictions shows Antarctica cold and the other shows it hot. Do you really think the temps have changed that much?
“Have you ever asked yourself why the hot and cold areas always move around?”
Not really – I’m used to changeable weather. It’s just a single month, and I wouldn’t expect everywhere to have identical patterns.
“Why don’t the hot land areas especially stay hot or cold if CO2 is the problem?”
Why would you expect that?
“One of your depictions shows Antarctica cold and the other shows it hot.”
They’re not my depictions – they are the official UAH maps. I am working on some gridded maps myself, but the data only goes up to March of this year.
I doubt if Antarctica is hot, even in November. The map is showing it was above the 1991 – 2020 average in November 2016, and below it in 2023.
“Do you really think the temps have changed that much?”
Are you claiming UAH is wrong again?
It doesn’t seem like that much of a change. Using the figures for the whole of the SoPol, (south of 60°), then November 2016 +1.27°C, whilst 2023 was -0.23°C, a difference of 1.5°C. Compare that with some of the graphs shown in this article for November in USA. There a frequent changes of over 5° or more.
If hot and cold areas move around then how can temperatures in different locations be correlated to each other?
Funny how way back in 2016 it was being touted as the hottest year ever. Yet your chart shows 2016 as mostly average with many cool spots. Sure don’t look much like Hottest Ever
The chart is for November 2016 and November 2023. November 2016 does not look like the “Hottest Ever” because you are comparing it with 2023 which is warmer.
I used November 2016 as it’s the month quoted in this article.
If the map is mostly average it’s because UAH uses the most recent base period – it’s average compared with the 1991 – 2020 base period. Despite that, it was still 0.35°C above that average.
It was at the time the hottest November in the UAH data set, though somewhat cooler than the spring of that year. Since 2016 the record has already been beaten by 2019 and 2020, before this year which was half a degree warmer than the previous record.
You know, I may take some heat for this, but so be it: Ever since a few years back when some maniac nutjob fired actually bullets into his office from outside, I am not going to automatically trust that someone has not made someone an offer they could not refuse. So to speak.
What?
Ok it’s convoluted but I understood it. April 2017, shots were fired at John Christy’s office on the University of Huntsville campus, luckily missing and hitting the windows of the office next door. Police believed it to be a random drive-by shooting but the timing and dates were suspicious – some felt it was a proponent of the AGW consensus that did it, although no-one has ever been caught.
Interesting. I had no idea.
A sane human would have to ask themselves what sort of person does this, and what else might they do?
Now, I have no idea if anyone working there even cared, but it is a data point.
People have been threatened financially and professionally for a very long time over this, but this is an indication of possible threats to actual life.
Besides for all of that, and separately, I have recently been trying to recall, how exactly are these measurements, taken from satellites, calibrated to actual temperatures?
They are more of an indication of the amount of thermal energy contained in a column of the atmosphere, IIRC, but I confess it has been some years since the last time I looked into the methodology in detail.
Every device and technique has to be calibrated.
In the olden days, they made thermometers that were blank, then dipped them in a mixture of ice and water to get the melting point of ice, then in boiling water to get the boiling point of water, marked those two spots, then divided the column into 100 equal intervals between these points, and extrapolated using these same one degree interval distances to get temp outside the two points.
That was physical and unlikely to vary over time.
Such a direct physical method seems best to me, but that is not how things are done anymore, in at least some well known instances. Like the ocean probes that were re-calibrated to the TOA imbalances when these devices, made to be the most accurate/precise ever manufactured, gave and result indicating the ocean was not warming but cooling.
Since it had been predetermined that the ocean is of course warming, they had to scramble to find a way to make sure the measurement agreed with the pre-determined result.
And if you do not know what I am talking about again, here is one of my reasons for making that last statement:
Correcting Ocean Cooling (nasa.gov)
For lots more on all of this, we used to have many more people here saying many more useful things on such topics, like the article and comment thread:
Systematic Error in Climate Measurements: The surface air temperature record • Watts Up With That?
And such as this article and comment thread (mostly for lurkers who may have no idea what I am talking about and who are new to this site):
The Ocean Warms By A Whole Little • Watts Up With That?
The satellites measure irradiance, not temperature. Irradiance is affected by many things that absorb at the frequency being measured, e.g. water vapor (clouds). Since the satellites can’t measure cloud cover and its impacts adjustment parameters are used to adjust all readings, i..e an average cloud cover factor for the globe. It’s exactly what the climate models do – they use fudge factors called parameterization – in other words wild a** guesses. These guesses *add* measurement uncertainty to the results from the satellites. These are *never* actually considered. Instead they substitute the standard deviation of the sample means for the uncertainty – this allows making the uncertainty vanish by using enough samples. But all it really tells you is how precisely you have calculated the mean value of the data set, it tells you nothing about the actual accuracy of the calculated mean.
NASA says Tonga could cause temporary heating.
“temporary”
But not turning up two years later.
Absolutely it can show up 2 years later. The affects of the sun are not instant, just like the affects of sunspot minima show up 2-3 years later at La Nina (see image). Regarding Tonga … how long did it take its water vapor to destroy enough ozone to allow significant UV radiational warming … or how long did it take for the ongoing sunspot maxima to affect existing ozone warming – which enhances the Brewer-Dobson circulation – which strengthens the polar vortex – which increases global warming? Then we can talk about the OBO and subsequent gravity waves upon the above forcings — and how they can create “temporary” warming.
The oceans store a lot of heat and their cycle time is around 50-100 years, so the current land temperatures are influenced by what the Sun did 50-100 years ago.
Well, it has to be a natural occurrence. Unless Co2 just took the great leap of faith, I’m not sure how it can be attributed to the sudden spike. Additionally, despite many people emphasizing the energy imbalance, Outgoing Longwave Radiation has shown an increase rather than a decrease, which contradicts the anticipated greenhouse gas signature. Moreover, the energy imbalance demonstrates minimal correlation with global temperatures. Even during a slight cooling period from the late 1990s to the mid-2010s, the energy imbalance didn’t align with expectations.
Where is the hot peak here, over Australia?
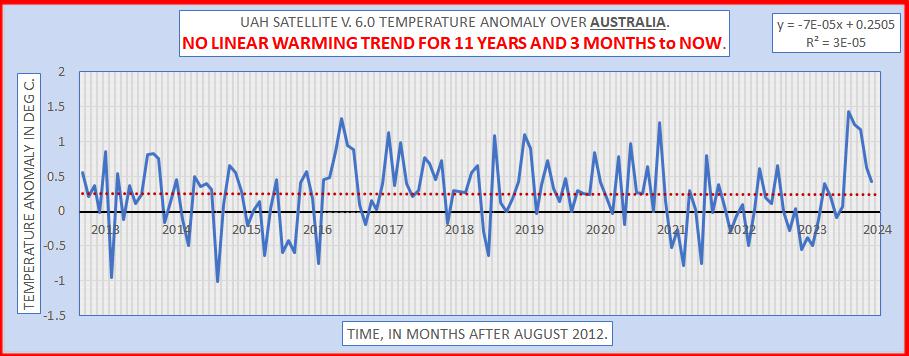
What type of volcano affects northern hemisphere much more than southern?
Geoff S
It’s unknown. It’s the last abrupt event anyone could think with a possible meaningful impact on the climate.
How do you know.
Yet another BASELESS comment !
The Tonga eruption is now being blamed for all the rain in Australia. You know, coz it was predicted to be ”drier than normal” this year according to the BoM.
Here in the US, the reservoirs in California and along the Colorado river were never ever going to fill up again, and the Great Salt Lake was going to disappear.
Welp, it took less than a single wet season for every reservoir in CA to fill to overflowing, and in fact for an inland sea to form, and a few months later for Death Valley to once again become a lake.
I will bet money that Lakes Mead and Powell will be overflowing in the near future, even with that region having tens of millions more people than ever, and with other countries allowed to buy land in the desert nearby and grow large acreages of the thirstiest crop on the planet.
The Lake Eildon irrigation water storage reservoir in Victoria, Australia (not far from where Nick lives) was predicted to take 6 years to fill based on “average” annual rainfall.
It took one season.
Another prime example of predictions relying on anything “averaged” from weather records looking extremely dumb in reality.
Even James Dyke from Exeter University and author of ‘Fire, Storm and Flood: The violence of climate change’ admitted in an article in the UK i newspaper that this years high temperatures had been affected by both the Hunga Tonga eruption and the agreement to phase out sulphur fuels for world shipping.
“But not turning up two years later.”
How do you know?
Sounds like pure speculation to me. Par for the course for alarmist climate science.
The post reads (their boldface): “The Times article ridiculously hypes (shown below) that November 2023 is the “sixth straight month to set a heat record” that “has truly been shocking” with people “running out of adjectives to describe this” when the NASA GISS data shown above clearly establishes that this many month-long pattern of increasing anomalies is completely consistent with the year 2016 Global El Nino event which experienced 7 straight months of increasing anomalies from October 2015 through April 2016.”
The obvious problem with this comparison is that the 6-month period of June through November 2023 does not coincide with the 7-month period of October 2015 to April 2016. Also, global temperatures typically take a number of months to respond to an El Nino. That is, the global temperature response to an El Nino is normally a number of months after changes to the NINO3.4 SST anomalies…not in synch with them.
Regards,
Bob
“The Times article ridiculously hypes (shown below) that November 2023 is the “sixth straight month to set a heat record” that “has truly been shocking” with people “running out of adjectives to describe this” when the NASA GISS data shown above clearly establishes that this many month-long pattern of increasing anomalies is completely consistent with the year 2016 Global El Nino event which experienced 7 straight months of increasing anomalies from October 2015 through April 2016.”
I may also run out of adjectives to describe the awesome 2023 climate response to solar cycle #25.
It was neither shocking nor surprising to me to see temperatures soar this year as solar irradiance in 2023 so far was higher than any year since 2000 and likely higher than any but the highest years of TSI in solar cycles 20 or 21, 30-40 years ago, according to the NASA CERES TSI composite data.
The 2023 climate reaction follows the script of ‘Extreme Climate and Weather Events are Limited by the Duration of Solar Cycle Irradiance Extremes‘, the title of my 2018 AGU poster. Lessons learned in 2014-2018 about the solar cycle #24 influence on the ocean that led to the 2015/16 El Niño were then successfully integrated and applied to this solar cycle, leading to an accurate forecast of the onset of this El Niño, dependent exclusively on solar activity conditions. More on that another day…
I have reported here before that during the last nine solar cycles, an asymmetric tropical step-up/down of ~ ±1°C occurred in sync with the solar cycle maximum/minimums, with odds against it happening without solar forcing at 1.6×10^19 to 1. The pattern is so far half completed in this tenth consecutive cycle, which will only increase those odds in favor of solar irradiance forcing as the driving mechanism.
Which might explain why those increases are more prevalent in regional summer temperatures and less so in regional winter temperatures. Of course, using an homogenised ‘Global Average Temperature’ of averaged anomalies will hide all regional data and make it look as though the whole world is heating up when it is only specific regions at different specific times experiencing higher than normal temperatures. Truly the devil really is in the detail!
Hello Bob
What you wrote deserves an article on whattsupwiththat.
Could you do that ?
The Grand Solar Minimum looks like it has started. The last Solar Cycle was weak and this one looks to be weak as well. NOAA predicts that the Sunspot Number will start dropping in 2025 and continue dropping until it reaches zero in 2040 when their forecast ends.
https://www.swpc.noaa.gov/products/predicted-sunspot-number-and-radio-flux
Solar physicist, Valentina Zharkova, discovered how two magnetic dynamos at different depths in the Sun give the 11-year sunspot cycle and another cycle of around 400 years. She says that the Sun is going to be cooling enough to lead to a mini-ice age for around 40 years with probable crop failures starting in a few years.
‘Modern Grand Solar Minimum will lead to terrestrial cooling’ 04-Aug-2020
https://www.ncbi.nlm.nih.gov/pmc/articles/PMC7575229/
A few observations
a) measuring the average to 0.01 or 0.001 Kelvin is nonsensical.
b) to say this is the warmest November is equally absurd, over what time period has GISS been operating? Even the long term satellite data covers less than 50 years.
c) Why is the immediate pre industrial temperature the benchmark?
It *is* nonsensical. It’s accomplished using the climate science meme of “all measurement uncertainty is random, Gaussian, and cancels”. Leaving the standard deviation of the sample means as the uncertainty, so the more samples you can take the greater the precision of the calculated mean.
The problem is that measurement uncertainty in temperature is neither random or Gaussian. Therefore it *can’t* cancel. Leaving the uncertainty of the average at least equal to the typical measurement uncertainty of the measuring devices – about +/- 0.5C. So basically, anything past the units digit is part of the GREAT UNKNOWN. Thus the “global average temperature’ is a foggy crystal ball out in the tenths, hundredths, and thousandths decimal places. Climate science is therefore more like the carnival fortune teller divining your future from a cloudy crystal ball than it is like actual physical science.
This is a whole can of worms, as we have long since and at great length discussed here at several times in the past.
Device resolution, precision vs accuracy, etc…
All the way down to such things as considering that measuring the temperature at different times at different places can be treated as though you are measuring the same thing multiple times!
And yet the trendologists show up here again and again in their holy quest to keep the rise alive, by denying reality.
Yeah but even they are only going through the motions now – a year or more ago they’d have fought tooth and nail over every word in the post, with dozens and dozens of replies. Now they just turn up with a comment, get shot down and go away again. They’re not even trying any more, all the fun and the sport of it all seems to have gone!
bg-whatever seems to have giving up spamming the link to the NIST Uncertainty Machine over and over and over.
Wasn’t the immediate pre-industrial time the end of the Little Ice Age?
It is still cold. Even now about 4.6 million people die from cold-related causes compared to 500,000 people who die from heat-related causes. The cold or cool air causes our blood vessels to constrict to conserve heat and this causes our blood pressure to rise causing increased heart attacks and strokes in the cooler months.
‘Global, regional and national burden of mortality associated with nonoptimal ambient temperatures from 2000 to 2019: a three-stage modelling study’
https://www.thelancet.com/journals/lanplh/article/PIIS2542-5196(21)00081-4/fulltext
Shock Horror Never-Before News for A Desert: There’s recently been a rainstorm & flood in Northern Australia.
Fault entirely laid at the door of El Nino
What did I get wrong, I thought Nino brought rain to the opposite side of the Pacific?
There again, what’s 10,000+ miles when you’re a Climate Expert avec Un Sooper
Commpuuuuter.
et aussi, Une Modele ooooh la la
This Nick Stokes person seems quite clever and earnest in the manner of an ancient astronomer who would maintain that the Sun goes round the Earth and produce ever more convoluted torturings of data to show it to be so.
However to me he seems to be no more than an adult who still believes in Father Christmas because that was what he was told as a child and, as Christmas presents still turn up in December, what more tangible evidence is required? He is not alone in being stuck in the wrong paradigm.
I urge everyone to take the opportunity to try to reject dogma and question authority.
Suppose there is no God, suppose there is no Father Christmas, suppose carbon dioxide is not the Devil.
——
David Tallboys
“Suppose there is no God, suppose there is no Father Christmas, suppose carbon dioxide is not the Devil.”
True, but there’s definitely a tooth fairy, my dentures are a perfect fit –
https://external-content.duckduckgo.com/iu/?u=https%3A%2F%2Ftse2.explicit.bing.net%2Fth%3Fid%3DOIP.2TuRKf7IEccbI496LAo-RgHaE8%26pid%3DApi&f=1&ipt=c320baf8d15804dcde92d9f7cd29a4718834a351206734b44ee6099b0ec9b061&ipo=images
You just stay away from the Easter Bunny now, y’hear?
I reckon Nick would be one of the brainiest people on the planet.
But brainy people are not immune from getting caught up in irrational pursuits.
And I’m on board with a 98% consensus of contributors here that accept that Nick isn’t in this irrational pursuit for any $$$$s.
(unlike almost all of the more publicly-recognised names in the climate boondoggle)
Nick just has a basic grasp of statistics and is handy with a computer to turn those statistics into pretty pictures. The same skills as most climate enthusiasts but not an indicator of intelligence.
Larry,
WUWT kindly published 3 of my articles starting with this one in August last year.
https://wattsupwiththat.com/2022/08/24/uncertainty-estimates-for-routine-temperature-data-sets/
In that article, I quoted a question I had several times asked our Australian Bureau of Meteorology, BOM.
“If a person seeks to know the separation of two daily temperatures in degrees C that allows a confident claim that the two temperatures are different statistically, by how much would the two values be separated?”
BOM staff provided some papers and references, but no answer to the question, which is much the same as these “record” US temperatures being close together as quoted “the “hottest November” even when the latest measured GISS global anomaly value is only 1/8th of a degree F changed from the highest prior year 2016 EL Nino value.”
Can any reader tell us if this difference is statistically significant, please?
Geoff S
It isn’t! Measurement uncertainty far exceeds these values and therefore they are guesses only! Only a fool would measure something to the one-tenth and average it with a measurement to a similar one-tenth of a different measurand and say “I just reduced the uncertainty to five-hundredths for the average.
There is a reason the GUM has this basic equation for uncertainty;
(y) = Σ (∂f/∂xᵢ)² u(xᵢ)²
You’ll notice there is no divide by “n” to obtain an “average” uncertainty.
You would at least have to look at a bunch of El Nino years to find the mean and variance, but the temperature is more like something dynamic and regional rather than something statistical.
El Ninjo has no permanent Influence on the global temperature or the Climate.
Not true. 30-year climate warming happened since 1980 in sync with predominately Niño events.
What is iMEI?
Integrated MEI
I wonder how it was integrated exactly? I ask because the integrated MEI over the last 30 years is -89 MEI.months while the 30yr HadSST average increased 0.46 C over the same period. I’m just curious what exactly the graph is showing.
You demonstrate a nice correlation, but no causality. The temperature trend of UAH MSU, from Roy Spencer is 0.14˚C/decade. This is a natural increase in the global temperature, ending up +0.6˚C from 1980 to 2023. This graph of the NOAA air temperature, shows no increase in the temperature between 1880 and 1930. Thus, no Influence of El zNinjo.
I am sorry, this was not the correct picture. This is the correct one, with the air temperature (Norwegian text)
Large sea surface temperature peak spikes happen during Niños, not independent of them. So to say the global SST (ie climate) is not permanently influenced by El Niño is to ignore this real relationship.
In order for you to be correct, this pattern wouldn’t exist. Can you find such a time when SST peaks failed to track with Multivariate ENSO Index (MEI v2) peaks?
http://climate4you.com/images/SunspotsMonthlySIDC%20and%20HadSST3%20GlobalMonthlyTempSince1960%20WithSunspotPeriodNumber.gif
Notice that El-Nino strength is getting weaker since 2000 while La-Ninas are getting stronger.
We could possibly be cooling, and we wouldn’t catch it with GAT nonsense.
How do you propose catching the cooling?
Examining sums – the total extent of snow cover every year or the arctic sea ice extent in the summer.
Cryosphere mass is decreasing. How is that going to help you catch the cooling?
It shows natural variability though; inconsistent with a persistent force being the dominant driver.
This fallacy is so common it has a name. Affirming a disjunct. The existence of variability does not preclude the existence of a persistent force.
And don’t think I didn’t notice the goal post move from the GAT to snow/ice cover and then to variability.
I am not moving the goal post. I’ve highlighted the inherent natural variability in Global Average Temperature (GAT). I have underscored the point that if the world has the capacity to remain without warming for 17 years independently, it is equally capable of experiencing warming without our intervention. Now I am doing the same with other metrics. It all paints a more complicated picture than mainstream climate science would have us believe.
The Earth as a whole has not remained without warming for 17 years either. [Schuckmann et al. 2023]
The metrics you have mentioned all show warming.
Nice hockey stick.
This is meaningless mumbo jumbo. Zetajoules in the ocean translate into something like 0.009 degrees.
What temperature on the land results from the zetajoules absorbed? That should lead you to conclusion that zetajoules comparisons gives absolutely meaningless information.
Your graph also implies that the ocean receives more energy than the land. Actually it does, but not for the reason you indicate. The oceans receive three times the insolation of the land just based on area.
That occurred to me too – GAT hides a multitude of sins, along with errors, poor methodology and outright fakery. They are so caught up with their own cleverness that they don’t realise that by creating a warming signal every time they might be hiding indications of a very dangerous situation that we need to be aware of.
Averaging throws a lot of information away, and climate pseudoscientists don’t even bother to report basic stats like the variances of all their myriad averages.
And yet the planet warms.
Au contraire – all we know is that the published figures show an amount of increase. What the planet is actually doing may or may not bear any relation to the figures.
Maybe I’m wrong, but it sounds as if you are arguing that observations do not matter. Am I understanding your argument correctly?
The baseline for MEI-2 changes every 5 years (goes up). That reduces the El Nino anomaly and increases the La Nina anomaly.
Your picture does not show any temperature increase, only the ENSO-pattern. My picture from NOAA indicate no temperature increase in the period 1880 -1930. Hence, no permanent Influence of the temperure by El Ninjo. Here is the graph:
lufttemperatur is air temperature, in Norwegian..
As I write the Southern Oscillation Index or SOI is currently at minus 1.79 virtually in the neutral zone mid-way between El Nino and La Nina. https://www.longpaddock.qld.gov.au/soi/
On 19 Sep 2023 the Australian BoM called an El Nino when the SOI was approx minus 15. From the end of Sep 2023 for two and a half months now the SOI has wended its way to now be near neutral.
So I think any talk about being in some El Nino state is ignoring the SOI.
wazz:
?? The World Meteorological Organization officially declared an El Nino event on June 8
You only need a Continent the size of Oz to split the climate into those 5 main types and here’s a sample of what you can get at this time of year-
Bushfire burns close to homes in Perth | Watch (msn.com)
Cairns cut off by floodwaters, towns evacuated and drinking water at risk as former Cyclone Jasper continues to devastate | Watch (msn.com)
Them thar clever climate changers are going to change all that to what they know it really should be.
and at the same time there is apparently just one temperature number that is representative of the whole continent of Oz
(which, as it just so happens, is always a higher number than the last-published one temperature number that is representative of the whole continent of Oz)
Really truly they have their computer models and hands on the climate thermostat-
NSW weather: Cold snap hits Sydney; snow falls in parts of state – ABC News
NSW heatwave sparks energy shortfall warning, residents urged to conserve energy from 5pm to 9pm | news.com.au — Australia’s leading news site
and they know what temperature it should be if you’d only listen and stop using fossil fuels.
I’m waiting for a story from ABC entitled “Hot air generated by Chris Bowen’s renewable energy claims raises temperature of Australia’s energy policy debate.”
End of Little Ice Age(per-industrial) type cold temperatures. The Earth is still in an ice age with over 20% of the land frozen.
The propaganda assault has become insane, as we move into a major election year.
In a June 2023 Pew Research poll, they found that 69 percent of Americans favored the steps to become carbon neutral by 2050.
https://www.pewresearch.org/short-reads/2023/08/09/what-the-data-says-about-americans-views-of-climate-change/
Insane and effective.
You all keep saying this, even though the USCRN shows a quite obvious upward trend that is significantly higher than the trend for the whole globe. Why do you never add a trend line to the graph when you present it? It makes me wonder if you aren’t being intentionally deceitful, rather than merely ignorant.
But the trend comes from the step up of the giant El Niño. From 2005-2015, there was cooling, and then from 2015-present there is cooling.
If you don’t want to learn new things about our climate, then that’s your loss. You can patiently use your trendology ruler, forever waiting for a meaningful insight to emerge.
By the way, I find it hilarious how you guys like to mash the downvote button on peoples comments here.
You just skipped from CONUS USCRN to a “global average temperature” graph.
Show the same thing using the USCRN data.
Our dear friend Mr. Walter has already done this. He’s given us to “no warming” steps in the USCRN data that he believes have been punctuated by sudden step warmings.
If climate alarmists didn’t have bastardized Hockey Stick charts, they wouldn’t have anything.
Climate change alarmists think trends go on forever.
The historical trend is that the climate warms for a few decades and then it cools for a few decades and then the pattern repeats.
Climate change alarmists think that since CO2 is involved the cyclical trend will not repeat.
I’m not even sure climate change alarmists are aware of the cyclical nature of the climate. Many of them seem to think climate history began in 1979.
The truth is climate history goes further back than 1979, and this written record shows the cyclical nature of the climate and shows that the bastardized Hockey Stick charts are a climate change alarmist fraud.
If you show a Hockey Stick chart as evidence of anything, you are perpetrating a fraud, wittingly or unwittingly.
Yep, once again Anal J is using anomalies and GAT for his fatuous Skeptical “Science” graph instead of real, measured temperatures.
BWAHAHAHAHAHAHA!!!
The SKS chart shows how ineffectual CO2 is when you have long periods of NO warming in between the step up warming pulses that associated with El-Nino phases.
Thank you for that.
The fact is that the is NO real temperature data that looks remotely like that. !
It is fake, built upon fake…. just like the rest of the AGW scam these mindless dolts have fallen for in their ignorant gullibility.
Good to know that business is a’boomin’ over at Fake-Graphs-R-Us.
Is that one the Thursday Blue Light Special?
The FAKEST of FAKE graphs.
Your ignorance in even posting it is duly noted. !!
When you discount the step warming effect of the energy released by major El Nino..
…there is basically NO UNDERLYING WARMING TREND.
Looking at UAH data… we see , as Bob Tisdale has shown elsewhere….
1979 – 1987 flat trend value around -0.3C anomaly
1987 medium El Nino adds about 0.1C
1988 – 1997, flat trend around value -0.2C anomaly
1998 strong El Nino adds about 0.2C
2001 – 2015, zero trend at about 0C anomaly
2015/2016 strong El Nino adds about 0.22C
2016 – 2023 (May) slight cooling, average around 0.22C anomaly
There were a couple of other El Nino, eg 2010, 2020 but these don’t seem to have caused a step change…. so have been left out.
If we remove these warming steps from the UAH data we get a graph like the one below (I’ve used the 1988-1997 period as a reference.)
As anyone can plainly see, ..
…there is NO underlying warming trend.
Wrong graph.. This one is up to date.
Now which of you moronically brain-numbed AGW zealots has any evidence of any human causation of these El Nino events.
Without that evidence, you are admitting the warming is TOTALLY NATURAL !!
For those curious the average El Nino bump using this hypothesis is 0.15 C. The average recurrence interval of El Nino’s is 5 years. So if we run the clock backward with this hypothesis we see that 200, 500, and 1000 years ago it should have 6 C, 15 C, and 30 C respectively cooler than today. I’m curious what the WUWT community thinks. Does that sound realistic?
OMG! the ignorance is TOTAL with you isn’t it.
Thinking every El Nino event is the same.. Hilarious !!
The Sun provides the energy for El Nino event.
The last 50 years has been a GRAND SOLAR MAXIMUm
Wake the f*** up, moron !
You are trying to extrapolate something for which you have no data.
When are you all going to learn that TRENDS are only good for the period for which you have data. Even then, trends tell you nothing about causes. Study some time series analysis to learn how to disect a time series.
BTW, I would ask the folks displaying hockey sticks just when is the warming going to stop. Extrapolating some of the predictions literally show 20 or 50 degrees of warming if nothing changes. Answer why.
They will run far and fast away from this question.
“BTW, I would ask the folks displaying hockey sticks just when is the warming going to stop.”
If CO2 is the cause, then it will end some time after CO2 stops rising.
If those solar sine waves are causing the warming, it will end in a few hundred years when the sine wave reaches it’s peak and global temperatures will be around 50°C warmer.
“Extrapolating some of the predictions literally show 20 or 50 degrees of warming if nothing changes.”
Which is why you don’t extrapolate a linear regression into the future. The trend is unlikely to be exactly linear – and things change.
The simple model relating CO2 to temperature is that temperatures rise by X degrees for each doubling of CO2. How much warming that will cause depends on the value of X, and the number of times CO2 doubles. If you take the current best estimate for sensitivity of 3°C, then to get to 20 degrees would require almost 7 doublings, CO2 would have to increase 100-fold, to around 28000ppm. To get to 50 degrees would require 100 times that amount.
This is not going to happen. I doubt there’s enough carbon in the world for this to happen, and in any event by the time you’ve got to double digit warming, I doubt there will be enough of a civilization to burn any fossil fuels.
Then why does your trend show a leveling? I see no logarithmic bending of your trend due to CO2. Going from 280 to 360 ppm should show some reduction in CO2’s effectiveness.
Dam*. 180 to 360.
Why doesn’t your trend show leveling?
CO2s increasing, the log of CO2 is increasing.
Don’t most of the recent papers show it as somewhere between 1.6 and 2.2?
I couldn’t say. I just plucked the figure from the Wiki page. But if it’s lower it only makes the point more clearly – there is no way temperatures are going to increase by 20 or 50°C due to increases in CO2.
bdgwx:
NO.
See: ” The definitive cause of La Nina and El Nino events+
https://doi.org/10.30574/wjarr.2023.17.1.0124
and “El Ninos: Their magnitudes and durations”
https://doi.org/10.30574/wjarr.2023.1.1306
I agree. bnice2000’s hypothesis is not realistic.
However, I must disagree with you that the cause is SO2.
This is not a thing. El Nino redistributes warm water from one part of the surface ocean to another. For El Ninos to keep getting warmer and warmer and warmer over time, there must be something driving a change in the base state. We should give that a name. Something like… I dunno, something like “global warming?”
El Niños do not exhibit increased warmth themselves, but any rise in global warming consistently follows significant El Niño events. There is no warming observed between these intervals of large El Niños. Something natural is clearly at play.
El Niños are a high point, La Ninas are a low point, so global temperature time series will always seem to exhibit a pattern of “step jumps” in temperature after each El Niño event, followed by what appears to be a lower or flat period until the next El Niño. This is the pattern you get when you superimpose sinusoidal variability atop a term linear trend. It does not mean the El Niños are the cause of the observed trend.
In order for El Niño peaks to get higher and higher, something must be causing a change in the base state. Otherwise you’d see a quasi-cyclic pattern of repeated similar El Niño peaks never getting any higher. In other words, it isn’t enough to do what Bnice is doing and say, “increasingly warm El Niño is causing global warming,” because you haven’t explain why El Niño is getting warmer and warmer and warmer over time.
Again, showing you are CLUELESS abot El Nio and La Nina.
Truly hilarious. !
Please keep going.
MIRTH for Christmas !!
Look at the Grand Solar maxium, and the energy added to the system
And stop pretend everything is always the same.
You have yet to produce one single piece of evidence of any human causality for El Nino, the ONLY warming in the last 45 years.
So that isn’t it. What else have you got?
Or reduced evaporation.
Just to be clear since placement of comments is not always Ideal, I was referring to this claim by AlanJ:
I call it reduced evaporation, a cooling process for oceans, that has led to our warming. With less heat loss the oceans warm and share some of the heat with the atmosphere.
The next question is usually … why? One logical possibility is changes in ocean salinity. Pure water evaporates the most and when you add anything to it, the evaporation slows down. What drives these changes? It could be this is an aftereffect of an interglacial onset driven by Milankovitch cycles.
As the glaciers melted during the onset of the Holocene, a large pool of fresh water built up in North America. When the ice finally gave way this very cold (fresh) water poured into the Arctic and North Atlantic oceans.
This created a large salinity difference with the rest of the oceans. I suspect this stopped the Meridional Overturning Current (MOC) completely. What followed was the Holocene Optimum. Nice and warm for 3000 years.
Since the MOC is driven by Earth’s rotation, it slowly started back up. As it did we have seen alternating periods with higher and lower salinity water dominates the surface. The difference in evaporation rates is what drives the difference in temperature.
Close scrutiny of many proxies shows the periods are getting shorter and shorter as the MOC has sped up. That’s why the peak of what is often referred to as the Millennial Cycle is occurring faster.
Humanity has added another variable recently. When plastics break up they form micro-plastics which float. Naturally, this also acts to reduce evaporation. We have been adding massive amounts of this warming agent to the oceans over the past 60 years.
Interestingly, one of the most polluted ocean areas is the South China Sea. This is at the heart of what is called the Pacific Warm Pool (PWP) which is also referred to as the driver of El Nino events.
It now makes perfect sense that El Nino events would be increasing. It’s also not the El Nino itself that is causing the warming, it is simply a symptom of the reduced evaporation which is the real driver. The PWP stores up the added energy and releases it more often now with increased El Nino events.
A wild, crazy theory? Maybe not.
“When you discount the step warming effect of the energy released by major El Nino”
What do you think happens to that energy once it’s been released?
OMG!. Energy released.. heats up the atmosphere.. in small step at each major El Nino as it spreads around the globe.
Don’t be so incredibly ignorant an brainless all the time.. it is pitiful !!
Now.. that evidence for human causation. ???
still totally lacking. !!
It would be nice if you could for once reply without these pathetic insults. It’s usually a good indication that you know you are wrong.
“heats up the atmosphere”
And then what? Do you think it just stays there in perpetuity, or do you think it’s possible it will just radiate into space.
Consider what happened at the end of the last century. A big spike in temperatures caused by the 1998 El Niño. Next two years temperatures right down to where they had been before the spike.
Yet according to your theory the globe warmed by 0.2°C as a result of just that El Niño and that heat remains in the atmosphere 25 years later. So where did it go in 1999 and 2000?
Is the trend not effected by La Nina?
Seemingly not as meaningful as large El Ninos.
Is your hypothesis that El Nino cause more warming than do La Nina cause cooling?
No, my hypothesis is that just by looking at the data and recognizing consistent patterns, I can see large El Ninos are playing an important role.
Good observation. You should also be able to see that large La Ninas are playing an important role as well and that the long term average of the ENSO cycle is zero.
Bdgwx,
The long term average in the ENSO is 0, but the world’s climate isn’t just restricted to the Nino 3.4 region. There’s some type of mechanism we may not understand that is associated with only large El Ninos to the rest of the world.
So it’s not ENSO anymore, but a magic mechanism that no one can describe?
Not magic, just not identified as yet. To CAGW supporters CO2 is “magic”. So what?
There’s some type of mechanism that I* don’t understand that is associated with only large El Ninos to the rest of the world.
If you don’t know what it is then how you do you know it is there?
There is no evidence that La Nina affects the NATURAL temperature trend.
If you understood the mechanism, you would see why.
But your ignorance cannot be remedied, because you don’t want it to be.
Looks pretty flat to me.
Ditto. Tending towards lower temps over time is my overall impression.
That orange line is the only visual indication of anything resembling a trend upwards.
If that is the actual trend, why does the left side have most of the big spikes above the trend line, while the right side has most of the big spikes below the line?
Because the big spikes aren’t enough to swamp the underling trend. But I urge you to go and calculate the trend for yourself, you needn’t quibble with me or Microsoft Excel over whether it’s the “actual trend.”
If that was the chart of the price of a stock, who would be rushing to buy up shares of that company? Not me, that is for sure.
If the USCRN anomalies in C were instead a share price in $ and if you DCA’d 1 share every month you’d have spent $43.32 by November 2023. The value of your holdings would be $181.60 today. That’s a pretty good return on your investment.
The fact that you just attempted to make an accurate comparison of the climate with real world currency just says a lot.
It wasn’t my idea. It was Nicholas McGinley’s idea. BTW…there are prediction markets in which participants are already placing wagers with real world currency.
No, anomalies do not represent actual climate -a dollar can be represented by a single number.
I’m not sure you point rings true there. The economy cannot be fully represented by a single dollar amount in the same way that climate cannot be fully represented by a single temperature anomaly. That doesn’t prevent both from being descriptive metrics of their corresponding context.
“ climate cannot be fully represented by a single temperature anomaly. That doesn’t prevent both from being descriptive metrics of their corresponding context.”
Cognitive dissonance at its finest.
climate can’t be fully represented by a single anomaly but it *can* be a descriptive metric.
Unbelievable.
The big point is that as you watch the “global” animations over time, the warmth manifests over different areas as time progresses. If CO2 and H2O are the problem, that simply would not occur.
If a localized or regional area’s metric shows warming at a hockey stick level, why would it return to a more normal level while another spot goes from neutral to warm thereby maintaining the hockey stick?
As far as the economy goes would you expect this kind of variance in economic conditions between Hollywood, Ca. with 10% median growth of income and Buloxi, Ms. That has a -3% growth?
“If CO2 and H2O are the problem, that simply would not occur.”
Do you seriously believe that?
“If a localized or regional area’s metric shows warming at a hockey stick level, why would it return to a more normal level while another spot goes from neutral to warm thereby maintaining the hockey stick?”
You’re asking why weather happens.Assume there’s a fixed amount of energy in the atmosphere at any point in time. Weather moves that energy around. Maybe a lot of energy is pushed over a particular country – that country gets hotter, but that means other places have to get colder. The next month the hot weather shifts somewhere else, and cold air moves over the previously hot country. It gets colder, but the total energy is fixed, so it has to even out.
You are your own worst enemy. If WEATHER controls the temperatures then it isn’t CO2 doing so!
Unless, of course, CO2 also controls the weather as well as the temperatures!
Is that what you meant to imply?
“If WEATHER controls the temperatures then it isn’t CO2 doing so!”
¿Porque no los dos?
Really, this is so simple even you could probably figure it out if you wanted to.
CO2 affects the climate – if it makes the climate warmer it means that on average temperatures in a specific location are on average warmer than they were say 50 years ago. But in any given month weather conditions affect that local area. Sometimes they are hotter than the average, sometimes colder. The warmer climate means the average weather conditions are warmer. It does not mean that at any point in time you will not see cooler or warmer locations.
Cognitive dissonance at its finest!
CO2 causes global warming but weather doesn’t even though weather affects average temperatures in local areas which are then used to form the global average!
Unfreakingbelievable.
“Cognitive dissonance at its finest!”
Sad you’ll never realize how ironic these diagnostics are coming from you.
“CO2 causes global warming but weather doesn’t even though weather affects average temperatures in local areas which are then used to form the global average!”
No. Weather does not “cause” climate. You’ve really got this all backwards. The climate in any location or time is caused by its environment. This in turn produces the types of weather typical of the climate.
Exactly when is CO2 going to start warming those stations with no warming?
After these data fraudsters perform enough mannipulations.
I’m sure you will always be able to find stations with no warming over a carefully chosen period. There will always be some places that have cooled whilst the rest of the world warms. But so far, just about every claim I’ve seen about a station that shows no warming is either obviously flawed, or does actually show warming.
Here’s a map of UAH the regional trends using their gridded data. (Note this only goes up to March this year.)
Apart from the Antarctic, most the places that haven’t been warming are in the oceans. The only land area that shows no warming is the North USA / central Canada blob. That doesn’t are no stations that would show a cooling trend within individual grid cells, but if the satellite data is to be believed, they are going to be the exception rather than the rule.
And yet CO2 is supposed to be well-mixed globally and, therefore, should have the same insulating property of a blanket everywhere thus causing rising temperature everywhere.
You simply can’t have your cake and eat it too.
Is CO2 well mixed as the climate models assume or is it not well-mixed?
Only in your simplistic world.
You can’t assume that surface temperatures will respond equally to the same amount of CO2, and you can’t assume that weather patterns won’t change as a result of warming.
You didn’t answer the question. Why not?
Is CO2 well-mixed glboally or not?
“You can’t assume that surface temperatures will respond equally to the same amount of CO2″
That’s the whole point! Global models don’t handle varying cloud cover. Global models don’t handle differing pressures and humidities.
It’s why a better metric would be enthalpy and not temperature. At least enthalpy includes more of the controlling variables then does temperature alone. Las Vegas and Miami can have the same temperature and resulting anomaly yet have vastly different climates. How is that handled in the GAT?
“You didn’t answer the question. Why not?”
I did answer it. I can’t help it if you still don’t understand.
No, you didn’t answer it.
Is CO2 well-mixed glboally or not?
All you gave was a red herring fallacy having to do with surface temperature not responding the same to the same amount of CO2.
That’s not an answer to the question.
Is the amount of CO2 the same everywhere?
“Is CO2 well-mixed glboally or not?”
Yes, it’s glboally well-mixed. But your point was trying to claim that this should mean everywhere on the globe warmed at an equal. That’s the assumption you were making that I was correcting.
Really? What impact does the NH jet stream have on the mixing of CO2? Is the density the same right under the jet stream as it is at the equator or north pole?
If you use the radiation budget method for evaluating global warming due to CO2 (i.e. back radiation) then every point on the globe should get equal forcing from the CO2. That implies equal warming – as does a global average temperature.
If that is *not* the case then why is every place on the globe being asked to suffer the same impact to their lifestyles? If the US is cooling then why does it need to do more than a place that is warming? Perhaps the warming regions need to do something other than reduce CO2 emissions.
As usual, you fail at relating to the real world. So does climate science.
Ah, there you go, using the bulge from the 2015/16 El Nino to pretend there is a trend.
Bless your ignorant little mind !!!
What affect does NOAA’s adjusted past temperatures have on the anomalies? The rate of change, i.e., the anomalies, have to be affected if the past temperatures have been manipulated. Thanks for any answers. Not my field.
The net effect of all adjustments reduces the overall warming trend relative to the raw data.
[Hausfather 2017]
And if that chart actually used raw data you might be on to something. However it doesn’t. It’s a comparison of adjusted data and heavily adjusted data. Crap piled on top of crap.
The blue line is the raw data.
That graph…
…..is crap
BEST and HadAT2 both show +0.16 C/decade or +0.87 C of total warming from 1958 to 2012. You download BEST here and HadAT2 here.
BEST uses all the WORST urban affected data.. then mal-manipulates it to get whatever their little agenda needs them to get… A total FARCE. !!
Had….. that’ll be the home of the AGW scam, Phil Jones et al.
Why do you insist on using data you must KNOW is total JUNK ???
1958 to 2001 is shown here. You can say what you like. That chart shows them at the same temp more or less. Certainly not half a degree difference.
HadAT2 goes up to 2012.
Your own data source shows 0.87 C of warming.
Where in this graph is there 0.8 warming from 1958 to 2001?
There isn’t warming of 0.8 C in that graph. First, that graph is at 500 mb. Second, that graph stops at 2001. If you download the HadAT2 data and do a linear regression trend from 1958 to 2012 you get +0.16 C/decade or 0.87 C of warming at 850 mb. BTW…that is starting at a strong El Nino and ending at a strong La Nina.
What difference does that make? I am comparing 1958 with 2001 on one radiosonde graph. It agrees with HAH
It’s like pulling teeth! I said above..”1958 to 2001 is shown here”
I did NOT mention anything past 2001.
Why would I do that? It has nothing to do with what I was talking about The fact is that was negligible warming (if any) for the 43 years starting 1958. Not half a degree of warming the universally used surface ”data” shows.
No, I’m afraid your surface graph above is not fit for purpose.
It agrees with
HAHUAHThat is patently false. See my post here.
Mike: What difference does that make?
It is not an apples to apples comparison.
Mike: I did NOT mention anything past 2001.
I know. That’s the problem.
Mike: Why would I do that?
That is the whole dataset and as close to the surface as is available.
Mike: The fact is that was negligible warming (if any) for the 43 years starting 1958. Not half a degree of warming the universally used surface ”data” shows.
That is patently false. Even when considering 500mb to 2001 it is 0.5 C of warming.
Mike: No, I’m afraid your surface graph above is not fit for purpose.
And I’ll repeat…your preferred dataset HadAT2 shows the same amount of warming as the surface datasets. I’ll also add that it shows more warming than UAH over their mutual overlap period. This is an indisputable and unequivocal mathematical fact.
Bdgwx put your trendology ruler down and look at the pattern of the warming. The initial part of the graph indicates a cooling trend reaching its lowest point in the 1960s and 1970s, followed by a subsequent rise until 1980. However, the trend appears to flatten thereafter. Recognizing patterns can be challenging when simply drawing a straight upward line.
”However, the trend appears to flatten thereafter.”
yes there appears to be a 0.1 or 0.2 difference in the sat data over the same period. Next to nothing. It’s a pretty good match IMO.
Same period here..
UAH-TLT 1979-2012: +0.11 C/decade.
HadAT2-700mb 1979-2012: +0.15 C/decade
UAH-TLT is weighted close to 700mb so I compared it to the 700mb level from HadAT2. As you can see over UAH and HadAT2’s mutual overlap period HadAT2 shows a significantly higher warming rate.
You can download UAH here and HadAT2 here and verify this for yourself.
You can download UAH here and HadAT2 here and verify this for yourself.
For the last time, I don’t need to download anything. I can see with my own 2 eyes that the there was NO WARMING between 1958 and 2001. I even showed you on the your own graph. 43 years of no global warming. (remember too that the downward trend to the 70’s was coming from an even warmer period pre 1958. That too is obvious from the chart)
Why do you refuse to accept reality? The late Professor Bob Carter said the same thing in his famous 2015 lecture. You can play with downloaded data until the cows come home. It won’t change the above fact.
“I can see with my own 2 eyes that there was NO WARMING between 1958 and 2001.”
No, it’s only the number generated from his computer that matters 😂.
He thinks that drawing a line over the data points reduces the variability.
Yup.
Oh…you don’t need to do any kind of mathematical analysis? You can just eyeball a graph with a compressed y-axis and conclude there is no warming?
Then your eyes are either deceiving you or you are cherry-picking the start and end time for your analysis and doing a trivial difference.
If it is the later then what is stopping the next person from selecting 1964/12 to 2010/08 and coming up with 1.7 C of warming?
First…I’m going to respectively decline to stop using math or “put your trendology ruler down” as you say. That is what leads people to wrong conclusions.
Second…which graph to you want me to look at? BEST? HadAT2-850mb? HadAT2-500mb? UAH-TLT?
That’s why it is best to avoid “eye-balling” a graph. Variability can be particularly difficult for some to handle. See [Filipowicz et al. 2023] for details.
It’s why karlomonte coined the term “trendologist”. The data and trend *is* the reality for them.
That’s not what “trendologist” means. A trendologist means someone who tries to predict future trends in fashion and marketing. You are just confusing this with the use of the word trend to describe the slope in a linear regression.
“The data and trend *is* the reality for them.”
It is not the reality, but it is a sometimes useful way of determining reality. As opposed to your approach which is to ignore all data and just go by wishful thinking.
“It is not the reality, but it is a sometimes useful way of determining reality.”
Only if you consider the uncertainty in the data and the trend. Something which you and climate science ALWAYS fail to do!
And, no, a trendologist in climate science sees the trend as the reality without considering the actual physical reality. It was Freeman Dyson’s biggest criticism of climate science.
A trend created from combining winter temps anomalies with summer temp anomalies truly tells you nothing about physical reality. Yet you continue to post such trends as if they *do* have some meaningful relationship to reality.
You triggered bellcurveman! He does not like being called a trendologist at all.
Oh look. Someones woken up the troll again.
A trendologist believes in the trend and has no interest in the cause(s) of the trend. This used to be done all the time in financial markets until time series analysis research showed different and better methods.
My whole career was dealing in products, revenue, expenses, and productivity. Time series like temp vs time tell you nothing about the causes of either!
Trends are useful for propagandists who want to claim “we are all going to die”. No explanation about why, just that the trend shows it.
Bingo, trendologists don’t care about “the climate”, instead they only care about the slopes of their meaningless GAT graphs.
“A trendologist believes in the trend and has no interest in the cause(s) of the trend.”
Citation required. A search for the word mainly shows up instances of food trendologists. E.g.
https://food-quests.com/10-obscure-food-jobs-that-will-surprise-you-and-make-you-ponder-life/#
But your made up definition is your usual straw men and lies. I have spent most of my time here fruitlessly trying to persuade people not to “believe” in the trends. Pointing out the dangers of cherry-picking a short term trend, pointing out the uncertainty in a trend of just a few years etc.
That doesn’t mean that linear regression over time is useless, but it isn’t going to be the whole story, and can be used for propaganda, as you say. How long until the next pause is published?
“Trends are useful for propagandists who want to claim “we are all going to die”.”
We are all going to die. It’s a fact of life and you don’t need to use any trend to project that.
He’s apparently as ignorant about the English language as he is measurement uncertainty—doesn’t understand that words can have multiple meanings in different contexts.
Or he’s just blowing smoke again to cover his hindside.
I’m just asking where I can find this particular definition of “trendologist”. It wasn’t a term I’d heard before, and your definition doesn’t appear to have reached the internet yet.
Either you have a serious comprehension problem or you are stupid. Show me where the 0.5 degree rise in temperature is….
Mark it out for me on this….I have indicated the start and finish just in case you are confused.
At the 500mb level it is +0.67 C by 2001 and +0.84 C by 2012 with a rate of +0.15 C/decade.
Download the data here. Plug the 500 mb column into Excel column A. Enter “=@linest(A1:A660) * 120” to get the rate in C/decade. Enter “=@linest(A1:A660) * 528” to get the increase through 2001 in C. Enter “@linest(A1:A660) * 660” to get the increase through 2012 in C.
What part of ”mark it out for me ON THIS” don’t you understand?
Excel does not let me use LINEST on image files. It only works with real x/y data points.
Lame, even for Block Head G.
AAAAAAAAAAha ha ha ha ha. Don’t let a program tell you what to do. Use your eyeballs. You have eyeballs don’t you?
Yes. I have eyes. But my eyes aren’t as reliable as objective mathematical techniques. This is especially the case when the y-axis is compressed.
Oh look! I can draw a line too!
Yes I see that. What mathematical technique produced that line?
What mathematical technique produced a starting point 0.5 degrees blow where it should be?
Ordinary least squares of all data points. I have boldened the world all to drive home the point no data point was ignored or cherry-picked in the analysis.
Back to my question…what mathematical technique did you use to construct your line?
I did not. I’m not an idiot. No amount of bullshit from you will convince me that the temperature in 1958 and in 2001 were not the same. Your own graph shows it. Tell me, do believe it was warmer for at least a decade prior to1958?
No warming (overall) for many decades (probably 7) was there bdgwx?
Where does that leave you?
Oh…so you’re cherry picking start and end dates. Let’s see how well I do with that technique.
According to your preferred dataset and method it warmed 2.1 C from 1965 to 1998.
Oh…so you’re cherry picking start and end dates.
Just wow.
What’s really sad is that you believe you have refuted what I claim. You reject reality and substitute it with your own. I get it now.
It’s your methodology. Do you now see the problem with it?
Just to be clear…I’m rejecting the methodology showing 2.1 C of warming from 1965 to 1998. Are you saying the reality is that it really did warm 2.1 C?
OLS isn’t particularly appropriate for that data set because of the extended excursions from the slope.
Those should be investigated.
Try detrending and check whether there are any patterns.
I’m open to the usage of other analysis options. But removing the trend will remove any warming if it exists. I fail to see how removing warming will help us determine how much warming occurred.
It’s often Asimov’s “isn’t that interesting?” moments which lead somewhere.
The warming is probably there, but there is clear evidence of some extended excursions from the trend. Detrending will give an indication of their height, and show any quasi-periodicity.
OLS can give you the slope (rate) and the R^2 (very flaky for autocorrelated data anyway).
For “how much” you’re better off taking a reasonable subset of data points (say 5 years) at each of the start and end of the slope and calculate their averages and standard deviations. Once a single-tailed t-test rejects the hypothesis that they come from the same population, you can subtract the lower average from the higher.
See the Schmidt vs Scafetta dispute for details.
p.s. Just eyeballing that chart, one could make an argument for a cooling trend from 1955 to 1977, followed by warming on the trend line shown from 1977 to 2015.
Short, noisy data with long excursions can be very difficult to make sense of.
Smoothing it can sometimes help in that regard, but discards a lot of information.
pps. Once it’s detrended, it would be interesting to compare to ENSO –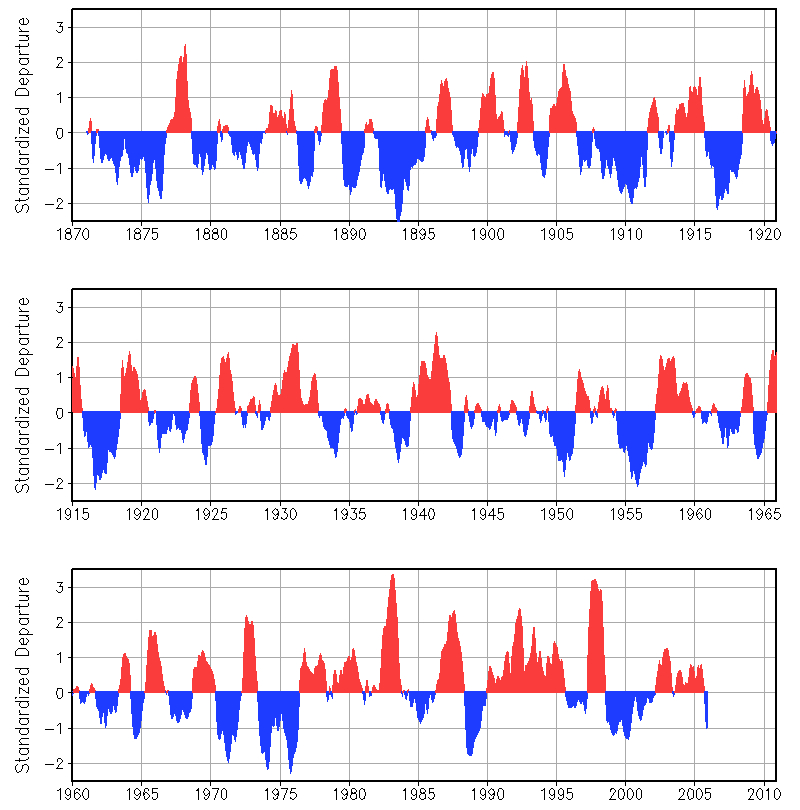
Not sure where the underlying data is, sorry.
Are you just drawing random lines then?
1958: avg(0.1, 0.3, 0.1, 0.1, 0.0, 0.0, 0.1, 0.0, 0.0, 0.3, 0.0, -0.1) = 0.1
2001: avg(0.2, 0.3, 0.3, 0.4, 0.5, 0.3, 0.4, 0.6, 0.5, 0.5, 0.3, 0.3) = 0.4
They data says they are clearly not the same. Again, this is HadAT2
No it doesn’t. My graph shows the data given above.
We don’t know based on HadAT2. However, if you use BEST and compare the 5yr centered average at 1948 with that of 1958 we get about a +0.08 C difference. If we do a linear regression we get a +0.10 C difference.
Ok, lets try this.
What do your numbers say the trend is between 1958 and 1996?
First…they’re not my numbers. They come from HadAT2…your preferred dataset. Anyway, +0.14 C/decade @ 850mb, +0.12 C/decade @ 700mb, and +0.11 C/decade @ 500mb.
”Anyway, +0.14 C/decade @ 850mb, +0.12 C/decade @ 700mb, and +0.11 C/decade @ 500mb.”
Finally. So no warming for <> 60 years starting 1940. It took a while but we got there in the end… See, you don’t even need a mathematical technique! 🙂
They can’t see anything except what their rulers tell them.
BEST is junk. One only has to compare it to USCRN.
You keep asserting things like this – never show any evidence.
As I’ve said elsewhere, the rate of warming using the same USCRN data from this article is 0.35°C / decade.
I’ve looked at BEST gridded data and made a rough estimate of the US anomalies from there. Over the same period BEST shows the USA as warming at a rate of 0.21°C / decade.
The real figure may be a bit different, but it’s difficult to see how it’s going to be significantly different to CRN data.
Here’s my map of the BEST trends since 2005 for the US, and a bit of Mexico.
It illustrates the general difficulty of just looking at individual locations, especially over a short period. The North of the country has been cooling, quite rapidly in places, whilst Florida has been warming at a much faster rate. It also shows the seas as warming faster over this period than most of the land.
Except we’re not looking at ‘different places’.
USCRN does not show 0.35 warming. Look at the graph from NOAA. CRN shows no warming or even a drop over the time period it has been in service.
You are obviously calculating your value when ClimDev is spliced to USCRN. That’s as bad as what Mann did with his hockey stick.
Use CRN only to find CRN warming!
You made that claim before and I explained it wasn’t true. Now you repeat it and are just lying. I only used CRN data in my linear regression. If you think I’ve made a mistake you can download the data yourselve and say what result you get. Until you do that, just saying it doesn’t look like there’s any warming cutsno ice with me.
It’s always going to be difficult to see the trend over such a small period with highly variable data. The trend is only going to be about 0.7°C over monthly data that varies by several degrees.
Here’s the graph, showing the trend and standard uncertainty. (The uncertainty should be bigger if you adjust for autocorrelation)
Can you not see the oscillation in this data? Why does a linear regression tell you anything?
Really. It’s 18 years of highly variable, but auto-correlated data. And you expect to be able to detect oscillations.
The linear regression, as I keep saying tells you little. The point is – it’s your claim both that there has only been minimal warming, and that it proves BEST is junk. It’s your claim and you need to show the statistically significant evidence to justify those claims.
OMG!
No you dinnint!
Oh no you did not!
Here is the thing: No one cares about adjustments to fake, made-up graphs of global temps that go back to when there was about zero global data, and that furthermore claim to have a resolution in the hundredths of a degree despite it being almost all made up, and despite it being completely at variance with what every single researcher believed to be the case prior to the era of global warming alarmism.
IOW, before they, you know, decided to just start makin’ stuff up then did a switcheroo with the real historical data sets.
Can you post a graph of the global average temperature from these “real historical data sets” that you speak of?
You have been told numerous times that GAT is a nonsensical and meaningless number with zero physical basis.
And yet WUWT continues to post monthly GAT update articles and features it on the home page.
Perhaps some individuals have different opinions and place a higher value GAT than others. Not all skeptics think the same; I know that’s hard for people like you and Nick to comprehend.
Then perhaps you don’t know me because I don’t place a higher value on the GAT. In fact, as I’ve said many times total heat uptake and the Earth energy imbalance are better discriminators of past and future warming/cooling.
How are these numbers derived?
[Schuckmann et al. 2023]
It’s what the CAGW advocates use. Why shouldn’t WUWT post it? Hiding it would be censorship. Are you for censorship?
ROFLMAO
This is an adjustment after many manic adjustments
There is nothing RAW about any global temperature construction.
Why are you SO , SO GULLIBLE that you fall for such obvious nonsense !!
Here’s a hint… if its coming from Zeke.. IT IS A CON.. aimed straight at gullible fools like you !!
Bogus, bastardized Hockey Stick charts are only evidence of fraud, nothing else.
It was warmer in the Early Twentieth Century than it is today according to the written, historic temperature records. Your bogus Hockey Stick chart doesn’t show that. And we know why.
If you look at a temperature chart and it does not show the Early Twentieth Century as being as warm as today, then you are looking at a bogus, bastardized Hockey Stick chart created in a computer, by climate change fraudsters, to make it appear that the temperatures are getting hotter and hotter and hotter and now is the hottest time in human history, trying to make a case that increased CO2 leads to increased temperatures.
And it’s all a BIG LIE. The only thing that holds up the human-caused climate change narrative, the Hockey Stick chart, and it’s a BIG LIE.
You keep saying that yet always fail to show evidence not only in support of it but even relevant to it at all.
Let me get this straight. Would you say your philosophy of understanding is making a hypothesis, testing it, and if the test is contrary to the hypothesis it means the hypothesis is correct and the test was wrong?
You have seen numerous graphs on this site with no warming. Twitter has many more.
If you want validate the graph, show us, let’s say 50 long term stations with no UHI that have 2 to 3 degrees of warming to make the average reach the ~1.3 degree rise this graph shows.
“show us, let’s say 50 long term stations with no UHI that have 2 to 3 degrees of warming to make the average reach the ~1.3 degree rise this graph shows”
OK, Moyhu has just such a facility. Using Google Maps, you can choose stationsaccording to trend, rural status, or many other things, and you can click on markers to see details. It’s a bit dated now, uses GHCN V3. V4 would have many others. But here are stations with trend > 2C/Century, 50+ years of data, rural only:
A bit of background:
Between 1900 and 2022 there were 35 El Ninos, and I have made a comparison of their anomalous start and end date temperatures, and the maximum anomalous temperature change recorded during their existence.
As of this November, 28/35 of the El Ninos had a larger temperature increase from beginning to end than the 2023 El Nino (so far), although its current temperature is 0.1 deg C. higher than that of any of the other increases.
All but 4 of the earlier El Ninos were quenched by a volcanic eruption. Since this El Nino was caused by the Hunga-Tonga eruption, we will need another VEI4 or larger one to end it.
.
https://doi.org/10.30574/wjarr.2023.19.1.1306
“Since this El Nino was caused by the Hunga-Tonga eruption”
Where’s the evidence for this?
Were previous El Ninos started by underwater volcanic eruptions?
Tom Abbott:
ALL El Ninos are caused by decreased levels of SO2 Aerosols in the atmosphere, primarily due to VEI4 or larger volcanic eruptions, although on-going Clean Air and Net Zero efforts are also decreasing SO2 aerosol levels, which will cause temperatures to rise, because of the less polluted air.
Regarding the evidence for the Hunga Tonga eruption causing the current El Nino, see
https://doi.org/10.30574/wjarr.2023.19.2.1960
Oops; https://doi.org/10.30574/wjarr.2023.19.2.1660
Only FIVE digits?
HAHAHAHAHAHAHAHAHAHAHAH
That is Larry Hamlin speaking, not GISS.
So what?
Just another example of the total ignorance of climastrologers about basic rules of scientific calculations.
Using GISS fabricated nonsense.
You have now ADMITTED that GISS is total nonsense…
… so maybe you will stop using it… or not !!
USCRN is showing ,minimal growth. Unless Canada or Mexico has outrageous growth, North America has little warming.
I believe Geoff S is finding about the same for Australia. That is a sizeable potion of land mass of the earth. That means there should be sizable portions of land mass with constantly warm temperatures (in the range of 2 to 3 degrees).
Where are these land masses? Can the AGW folks show any?
Yet we are told that all manner of weather disasters are caused by this nonexistent, unmeasurable temperature growth, and that society must be destroyed to prevent something that isn’t happening.
“USCRN is showing ,minimal growth.”
Care to put a figure on that “minimal growth”?
My own calculations show a warming rate since 2005 of 0.35°C / decade, but maybe you have some different figures to share.
What’s the R^2 value Bellman?
And so the evasion continues. You want to claim USCRN is good enough to prove other data sets are wrong, you claim it shows minimal warming, yet assoon assomeone checks the figures you insist it’s too variable and too short a period to actually tell how much warming there has actually been.
For the record, the stats for USCRN using monthly values are
0.35°C / decade, with a standard error of 0.15°C / decade.
The p-value is 0.019, with an adjusted r^2 of 0.021.
These values are not adjusted for auto-correlation, and I doubt the trend is statistically significant so far.
By comparison the UAH data for the same period for the USA48 area are
0.27°C / decade, with a standard error of 0.08°C / decade.
The p-value is 0.0017, with an adjusted r^2 of 0.039.
The trends are meaningless unless you are willing to make a statement defining what makes up the trend and what the trend portends in the future. Otherwise you are just playing with some numbers just like all climate scientists.
The r^2 and standard error of the trend only define the trend and not what causes the trend. The best you can say is that the trend shows warming and warming will continue to get worse and worse. You can’t say why or if and when it may cease.
Instead of simply touting a trend, make an educated hypothesis of what and why. Make a forecast of what you believe the future warming will be based on your trend.
“The trends are meaningless unless you are willing to make a statement defining what makes up the trend and what the trend portends in the future.”
You do like to dictate these meaningless rules. Funny, how you never insisted that Monckton’s pause trend was meaningless unless he made a statement about what the trend portended for the future.
But this is about your claim, that USCRN was showing minimal growth. That’s a meaningless statement unless you explain what you define as minimal, and what statistical tests you have applied to establish that the data does indeed show minimal growth.
“Otherwise you are just playing with some numbers just like all climate scientists.”
The numbers I’m “playing” with are the same you claim prove BEST is junk. Yet you refuse to do any actual work to justify your claim.
“The r^2 and standard error of the trend only define the trend and not what causes the trend.”
And there go those goal posts again. This has nothing to do with the cause of the warming – it’s just pointing out that there is nothing in the USCRN data to suggest minimal growth. (And in case you hadn’t noticed I only mentioned R^2 because someone else thought it was relevant.)
“The best you can say is that the trend shows warming and warming will continue to get worse and worse.”
That’s absolutely not something you should say based on the trend. You can’t extrapolate beyond the range of the data. The best you can say is that there is some indication of warming over the last 18 years, but probably not statistically significant. What you cannot say is that it demonstrates any other data set is wrong or that it demonstrates minimal warming. There just isn’t enough data at this point in time.
“Instead of simply touting a trend, make an educated hypothesis of what and why.”
My not very educated hypothesis is that the US is, on the whole, warming as it’s part of a globe that is warming, and that the global warming is likely to be caused by the thing that scientists have been saying for decades, rising CO2.
“Make a forecast of what you believe the future warming will be based on your trend.”
Not something I would do.
Who cares? R^2 is meaning free for trends. If Bellman’s trend was properly detrended, it would have the same standard error, but an R^2 of zero.
That’s not the point I’m making. A very low R^2 showcases the nonlinearity of the climate; Bellman doesn’t seem to fully understand what that means when applying his trendology ruler. What does a growth of 0.35C per decade represent in the real world?
“A very low R^2 showcases the nonlinearity of the climate;”
If it changes with the trend, then it is use free.
When the measurement uncertainty is more than 0.35C per decade then the actual value is part of the GREAT UNKNOWN.
That value should be given as “0.35C +/- u per decade”. What is “u”?
I’ve just finished calculating the trends (in degrees Celsius per decade) for each month in CRN. December stands out with the fastest warming rate at +1.176°C per decade. This is obviously unusually high; too high to be explained by global warming. The trends observed show no clear seasonal distinctions, contrary to the expected pattern in climate science where winter months should exhibit faster warming. These observed trends are indicative of natural variability; these clowns just have no experience in real world meteorology. These trends are completely useless; averaging them together only just reduces their representativeness of the real world.
January
+0.245C per decade
February
+0.055C per decade
March
+0.0243C per decade
April
-0.2315C per decade
May
+0.364C per decade
June
+0.3801C per decade
July
+0.30105C per decade
August
+0.3668C per decade
September
+0.795C per decade
October
+0.472C per decade
November
-0.18783C per decade
December
+1.176C per decade
“December stands out with the fastest warming rate at +1.176°C per decade.”
Which is the problem you get when you only have 17 data points. It’s impossible to tell if that represents and actual underlying warming trend (almost certainly not), or is just the result of a couple of cold Decembers at the start, and some warm ones later.
“These observed trends are indicative of natural variability; these clowns just have no experience in real world meteorology.”
Us clowns are not the ones making any claims about CRN. All I’ve ever said is that there isn’t enough data to draw any conclusions. It’s those who keep hoping it in some way disproves previous data sets, and claim there is not trend I’m arguing against.
Bellman, you are a complete idiot. My point about averaging just went right over head. Even upon scrutinizing these numbers, individuals with even a basic understanding of meteorology can recognize the inherent variability present. Attempting to extract a trend from these figures, as demonstrated by the rates for each month per decade, is completely useless, especially given the absence of consistent seasonal differences in the rate of warming that defy established climate science. Therefore, an assertion suggesting minimal warming cannot be definitively supported or refuted using silly trendology.
“Bellman, you are a complete idiot. ”
Thanks. I’ll take that as a complement coming from you.
“individuals with even a basic understanding of meteorology can recognize the inherent variability present”
Hence my point about there only being a few data points. When you have very variable data you will get spurious trends, and it’s impossible to tell if any trend is due to some underlying cause or just random noise.
You seem to be attacking me for agreeing with you. You can’t say there is minimal warming, or a faster than average rate of warming. You cannot use it show that BEST is junk.
BEST and every other warming dataset are unreliable as far as representing the real world is concerned. That’s the point being made. Averages and trends are physically nonsensical constructs. You, however, still use trends as if they are meaningful.
Averaging and y = mx +b linear regression are the only tools in his toolbox, and will defend them to the deth.
What do you suggest as an alternative? People here want to claim that it was as warm in the 30s as it is today, or that warming stopped in ’97, and yet don’t want to define any construct that would allow these claims to be tested.
I’ve never suggested that a linear trend is the only way of determining change – I’ve criticized people who put linear trends over data that is clearly not linear. But, if you want to claim there has been no change over a period of time, or the globe isn’t warmer today than it was 100 years ago, how do you justify that claim without averaging or trends?
The weather is inherently variable and chaotic, making a monthly average insufficient to encapsulate the full spectrum of variance and its potential ‘combinations’. That’s almost definitely an understatement. Even two months with identical anomalies can exhibit significant differences. This principle extends to any temperature average. I’ve explained this to you before, but you failed to comprehend. The more extensive the averaging, the greater the loss of representation of the real-world conditions. The datasets scrutinized by climate scientists are literally just points on a graph.
When you express criticism towards individuals who apply linear trends to non-linear data, and then question the resistance towards examining potential changes across the globe through averages and trends, or when bdgwx overlays gray lines he refers to as uncertainty bars over the UAH ‘trend,’ it showcases an obvious lack of true understanding of nonlinearity in the context of the real world.
First…I’ve never claimed a linear regression is the be-all-end-all method for adjudicating the question of whether Earth is warming. Second…if you think you have a better method then present it..
Freeman Dyson has already presented such. And climate science (as well as you) have totally ignored it.
Does the greening of the earth and continual record global grain harvests not present some kind of question as to whether the earth is warming or not?
Can you provide a real example of this happening?
What alternative method would you suggest for dealing with it?
https://wattsupwiththat.com/2023/12/01/uah-global-temperature-update-for-november-2023-0-91-deg-c/#comment-3824949
Oh…I thought your point was that variability creates an issue with the (Tmin+Tmax)/2 method. It can and that is topic worthy of discussion.
However, you’re saying something different. Correct me if I’m wrong, but you’re saying that two different months with the same average had different day-to-day weather. Right?
I mean, yeah. No offense, but duh. That’s how averages work. That is two different samples can yield the same average. For example, two different high schools can have the same SAT score average even though different students took the test and with different individual scores.
That doesn’t mean an average isn’t a valid descriptive metric of the sample. It just means that you can’t use the average to draw conclusions about individual variability. For that you’ll need a different metric. Which is fine and even encouraged if your study is focused on variability. But that does not invalidate an average as being a valid metric as well or someone’s focus of study to the broad state of the sample as opposed to the variability of the individual elements.
My point applies to all temperature averages regardless of whether it is annually, monthly, or daily. Here’s a good example:
Denver’s weather, influenced by Chinook winds, can be extremely unpredictable, with daytime temperatures reaching the mid-40s and nighttime plunging to single digits. A day with a high of 43F and a low of 8F averages to 25.5F, similar to another day considered “normal” with a high of 37F and a low of 14F. Despite their apparent differences, both are considered the same in climate science.
Nah. They are different days with different weather and different temperature profiles that happen to have the same average temperature. That’s it. It is only the average that is the same.
Again…if you want to know the details of how the temperature evolved throughout the day then you need to use a different metric. Your use of that metric (whatever it may be) does not invalidate someone else’s use of the (Tmin+Tmax)/2 metric.
If the argument is…an average temperature isn’t the be-all-end-all metric that be used in all scenarios then it cannot be used in any scenario…then it is, of course, absurd. And that applies to any metric. For example, I would never claim that just because storm relative helicity isn’t useful in analyzing daily highs that it isn’t useful for other scenarios.
Atmospheric circulation doesn’t have a set pattern every 5, 10, 30, 100, or 365 days; it is chaotic. My point to you was that averaging increases NOT reduces variance. An average temperature is NOT a meaningful construct. A temperature in a specific area is contributed to by many factors; microclimate and topography are two important examples. The more variance increased the more the real signature of the climate becomes lost in the averages. I don’t know how else I can best simplify it for you; you are just have no meteorological experience whatsoever. Go take a break from your computer and actually experience the weather outside.
Yes. I am aware.
That is not correct.
The square multiple rule is: Var(aR) = a^2 * Var(R).
The sum rule is: Var(R+S) = Var(R) + Var(S).
Let…
Y = (A+B) / 2 = 1/2A + 1/2B
Var(X) = Var(A) = Var(B)
Apply the rules…
Var(Y) = Var(1/2A) + Var(1/2B)
Var(Y) = 1/4Var(A) + 1/4Var(B)
Var(Y) = 1/4Var(X) + 1/4Var(X)
Var(Y) = 1/2Var(X)
As you can see the variance of an average is less than the variance of any one individual element that went into the average.
It may not be a meaningful concept to you. But it is a meaningful concept to others.
That’s right. And a change in many of those factors could cause a change in the average temperature.
Again…your argument is very close to the form…metric A is not adequate for every analysis type therefore it is not adequate for any analysis type. Nevermind that variability of weather is an aspect of climate. It is itself a signal that you could formulate a metric and use for analysis. Nobody is stopping you from doing that. In fact, you are encouraged to do.
Perhaps you don’t know me as well as you think then.
LIAR, FOOL, and FRAUD.
No you’re WRONG. I just gave you an example from the REAL WORLD. You don’t understand because you live under a rock. You don’t understand the true meaning of NONLINEAR.
He’s never going to get it!
“As you can see the variance of an average is less than the variance of any one individual element that went into the average.”
He states it perfectly here but is too willfully blind to understand what he said himself!
It is the variances of the individual elements that determines climate, not the variance of the average!
3 inches of rain in 24 hours gives the same average value as 3 inches in 7 days. The variance of the average from month to month using the 3 inches per month can certainly be less than the variance of each element.
BUT IT IS THE VARIANCE OF THE INDIVIDUAL ELEMENTS THAT DETERMINES CLIMATE! 3 inches in 24 hours can ruin crops. 3 inches in seven day probably won’t. So which climate is better? The one where you get 3 inches in 24 hours or 3 inches in seven days?
About?
The fact that you can’t connect the dots between my subsequent sentences and the ongoing conversation highlights a SEVERE lack of meteorological understanding on your part.
Learn what variance means in the real world.
So now it is my “SEVERE lack of meteorological understanding”? Tell me…what meteorological understanding is it that invalidates the use of an average?
Maybe you can also explain why the hypsometric relationship, convective available potential energy, and equation after equation in my Dynamic Meteorology book by Holton & Hakim uses an average of all kinds of atmospheric properties including temperature if you are so convicted that an average is invalid.
In the real world variance is defined as σ^2 = Σ[(xi – xavg)^2, 1, N] / N
Now that you know that I know what variance is how about you tell how you are going to use variance to invalidate the use of an average to analyze data.
This comparison is flawed in its assumption that these fields of physical sciences are created equal in terms of their methodologies, characteristics, and most importantly analytical approaches. Averaging is physically meaningful if the underlying phenomenon you are attempting to track works in a predictable manner. Atmospheric circulation is chaotic and does NOT work in a patterned fashion. This is where your cited equation for real-world variance becomes problematic; it is NOT suitable for nonlinear systems. Applying the same statistical practices intended for physically meaningful constructs to a nonlinear system is completely absurd. One temperature anomaly does not capture all of the variance associated with, as I clearly showed with my Denver example – NOT EVEN CLOSE. Yet, that anomaly represents the SAME THING in climate science – just as warm or cold despite being completely different. As mentioned earlier, the temperature at a specific weather station location can differ significantly just a few miles away or even a few steps away, influenced by factors such as topography, the presence of a nearby large body of water, wind patterns, local vegetation, and so on. Uncertainty is not random, so variance increases, even in a completely homogenous environment.
With respect to the microclimate at that local weather station. Even if two weather stations were placed on the exact same field 4 miles away from each other with the exact same surrounding microclimate, uncertainty would still not be random.
And yet atmospheric scientists use averages including averages of temperatures ubiquitously. The atmosphere is a chaotic nonlinear system.
Duh. No one is saying it does. Likewise variance does not capture all of the minutia of details of weather either. No single metric fully captures weather. That does not mean variances and averages are useless.
That’s not true at all. Uncertainty is composed of both random and systematic components. If the random component is nonzero then an average will necessarily have a lower uncertainty than the individual elements that went into it. That is a indisputable and unequivocal mathematical fact.
And yet just like entropy, uncertainty always increases.
A fact that you and the rest of your lot continually deny.
Only if you make multiple identical measurements of the same quantity under identical conditions!
I shall remind you (again) this is impossible with air temperature measurements.
No, uncertainty only decreases when all conditions are stable and comparable across the measurements. In the case of monitoring temperature at an individual weather station, ITS NOT. You are averaging chaos, and chaos has no set pattern. Each measurement is influenced by its specific context. Literally every small section of the Earth receives varying amounts of sunlight due to the planet’s rotation on its axis,
All they have now are lies, vainly trying to paper over the previous lies.
A few days ago, I explained this to my grandmother in just a couple of sentences, and she grasped it easily.
I used to think that responding to bgwyz was a bit on the cruel side because his behavior seems pathological, but the more I’ve seen the way he pushes his pseudoscientific nonsense, the more it seems to be well-deserved.
What you are basing your position regarding uncertainty on?
I’m basing my position on NIST TN 1297 and JCGM 100:2008. They, along with every other text regarding uncertainty, say that the uncertainty of the average is less than the uncertainty of the individual elements that went into it.
The real world
LOL
Are you saying that NIST, JCGM, ISO, UKAS, etc. all wrong about the real world?
Which text on uncertainty do you feel best documents the real world?
They aren’t wrong. You just can’t read.
https://wattsupwiththat.com/2023/12/17/nasa-giss-data-shows-2023-el-nino-driving-global-temperature-anomaly-increases-noaa-data-shows-u-s-nov-2023-temperature-anomaly-declining/#comment-3835864
!!^^^^^!!^^^^^!!^^^^^!!
Let me get this straight…your authority on uncertainty is a WUWT commenter who made 7 algebra mistakes in a single post challenging JCGM and then defended those 7 mistakes by making 16 others. The posers has called NIST a heretic and has said computer algebra systems are wrong and refuses to use the NIST uncertainty machine to check his work? You think this posters has such a handle on the real world that it convinces you that NIST, ISO, JCGM, UKAS, other standards bodies and texts on uncertainty, and the entirety of science are all wrong?
Give it up, clown, and learn how to read.
I definitely won this exchange :-D. It’s a battle he cannot win.
Indeed. bgwxyz has proven himself to be remarkably clue-resistant, however.
Pat Frank knows more about measurement and uncertainty than you will EVER know.
*YOU* still think that precision and accuracy are the same thing no matter how many people, including experts, tell you.
And we are supposed to believe *YOU*?
*YOU* still think that an average value, a single number, has a distribution associated with it and you can use GUM Eq 10 to evaluate the accuracy of that average value.
And we are supposed to believe *YOU*?
You still think that the partial derivative in GUM Eq 10 is NOT a weighting factor for the uncertainty components.
And we are supposed to believe *YOU*?
My viewpoint on uncertainty in this particular context draws from my experience in meteorology. While my grasp of statistics may not be extensively robust, I can still discern that Mr. Gorman and I share a similar position, albeit approaching it from different angles—he from a statistical standpoint, and I from the perspective of meteorology. The principles outlined by NIST, ISO, JCGM, UKAS, and other standard bodies regarding statistical uncertainty are valid. There is just a gap in your understanding of how to effectively apply these concepts in the real world.
A theory that only works sometimes and in some places and not others is of less use than one that simply never works. If it never works you can abandon it and move on. If it works sporadically then it sometimes tends to capture attention and money. Lots of effort is put into making it work all the time and everyplace but, if over the decades no progress whatsoever in improving the theory has been made it needs to be abandoned as well. It’s just a lot harder to do so.
It’s gotten to the point in climate science where most of the money and attention is being put into making the data match the theory rather than the other way around.
I hate to keep going back to Freeman Dyson but he was absolutely correct. It’s idiotic to focus on CO2 alone. What is needed is a holistic metric that shows all the impacts, both small and large. A sort of unified field theory for climate and its relationship to the earth and humanity.
It’s sort of like environmentalists focusing on saving eagles but ignoring the fact that wind turbines kill eagles by the hundreds. What kind of holistic approach is that?
If climate is weather over a period of time then the study of climate needs to include the chaotic nature of weather in its climate studies. But it doesn’t. It’s all linear projection of averages of one thing to the exclusion of everything else. What kind of holistic approach is that?
Whenever I see this “meet the 1.5C target” phrase I feel like vomiting.
This is an extrapolation from the linear trends on which these trendology fools hang their hats.
You think addition (+) is the same thing as division (/)?
You think a sum Σ[xi] is the same thing as an average Σ[xi]/N?
You think the partial derivative of f = Σ[xi]/N is ∂f/∂xi = 1?
You think JCGM 100:2008 equation 10 reduces to u(y) = sqrt[Σ[xi^2]] when y = Σ[xi]/N?
You think JCGM 100:2008 equation 10, 13, and 16 only works for measurements of the same thing?
You think the NIST uncertainty machine is wrong?
You think NIST TN 1900 E2 computing the uncertainty of the average using σ/sqrt(N) is wrong?
You think NIST is a heretic?
You think u(Σ[xi]/N) is the same as Σ[u(xi)]/N?
You think computer algebra systems like Mathematica are wrong?
You think a systematic error should be ignored and/or left as-is?
So when NIST, ISO, JCGM, UKAS, and all of the standards bodies say to compute the uncertainty of the average by scaling the uncertainty of the individual elements by 1/sqrt(N) for uncorrelated inputs they never intended people to do so in the real world? Really?
I’ll ask again…what text on uncertainty am I supposed to be applying in real world scenarios?
https://wattsupwiththat.com/2023/12/17/nasa-giss-data-shows-2023-el-nino-driving-global-temperature-anomaly-increases-noaa-data-shows-u-s-nov-2023-temperature-anomaly-declining/#comment-3836328
I guess I don’t have any other choice but to accept that your answers are yes to my questions regarding your shared position with the Gormans and that you don’t have an alternative text on uncertainty that you can present.
No, you are just unable to grasp even the simplest of explanations. I’ve been very patient with you, making a genuine effort to help you understand to the best of my ability. You think you possess more knowledge than others here, but in reality, you blindly echo the views of IPCC. You lack the ability to think skeptically. I’m 20 years old, and I’m telling you this – how sad is that? Either that or you are intentionally misleading. Either way, you are a lost cause. Happy holidays.
Another idiot.
Oh look, bozo-x posts his error lits again … yawn.
Clown.
Here is your problem in algebra. You need to read thoroughly to determine what are input quantities and what are output quantities. In essence, with what you are defining f(x₁, …, xₙ) to be, you end up with one value in the equation:
y = Y̅ = (1/n)ΣYₖ
and you are dividing by “n” twice.
You could help yourself tremendously if you would work through section 4 in the GUM with actual numbers instead of pretending to be a math whiz manipulating variables.
Try this method to validate your complaint.
That is, uᵢ(y) is evaluated numerically by calculating the change in y due to a change in xᵢ of +u(xᵢ) and of −u(xᵢ). The value of uᵢ(y) may then be taken as │Zᵢ│ and the value of the corresponding sensitivity coefficient cᵢ as Zi/u(xᵢ).
Show us your calculations using numbers.
“You think a sum Σ[xi] is the same thing as an average Σ[xi]/N?”
An average is ONE value associated with a population distribution.
There is no such thing as Σ[xi]/N being a distribution. It has no standard deviation. It is one value. One value can’t have a distribution.
xi are MEASUREMENTS, nothing more. An average can be found for the distribution of the measurements. But there can’t be a sum of averages from a population.
If you have more than one xi, i.e. more than one average, for a population then what you have are multiple samples from a population. The standard deviation (i.e. the uncertainty) you find from the averages of those samples is the spread (the standard deviation) of the sample averages – which is *NOT* the uncertainty of the population average.
What you get is a metric for how precisely you have located the population average using the samples. That simply does not define the accuracy of the population average.
A population average consists of only one number calculated from the stated values of the component elements of the distribution. That average is *NOT* a variable, it is one and only one value.
If you have multiple samples then the statistical descriptor for those samples would be the average of the sample and the standard deviation of that sample average as propagated from the uncertainty of the individual elements in each sample.
Your sample values should each be given as stated value +/- uncertainty
Sample1_avg +/- u_sample 1, Sample2_avg +/- u_sample2, SampleN +/- u_sampleN.
THAT will give you a distribution. And the standard deviation of the sample stated values can be considered as the Standard Deviation of the Sample Means, incorrectly called the standard error of the mean. However, even *that* is only partially correct if you don’t check to see if the combined uncertainties (i.e. quadrature addition of the u_sample_i) is smaller than the standard deviation of the stated values.
And none of this tells you how accurate the population average is. The uncertainty of the population average is typically considered to be either the standard deviation of the population or the additive uncertainty of the individual elements in the population.
The only reason to find the standard deviation of the sample means is because you don’t know the population standard deviation. So you find the standard deviation of the sample means instead and then multiply it by the size of your samples.
SD(population) = SDOM * sqrt(n)
The SDOM is simply not what you use in the real world. It totally underestimates the actual uncertainty of the population average. You can’t afford to do that if you are designing something that might impact your professional standing or cause you to incur civil/criminal liability.
When the space shuttle exploded do you suppose the root cause committee was looking at the SDOM of the rubber o-ring that failed (i.e. how precisely the average was calculated) or the uncertainty of the population average, i.e. the actual dispersion of values that the average could take on?
My background in uncertainty comes from the calibration lab side, which required lab accreditation according to ISO 17025. I had to revise our formal uncertainty analysis documents that the accreditation agency evaluated and approved as part of the accreditation process. These are required to follow the GUM.
One of our calibrations involved multiple measurements for a each test sample, and averaging the results. However, the measurement conditions for each repetition changed, which of course means that calling the uncertainty sigma/root(n) isn’t valid.
Exactly. Only recently did I recognize that this applied to measurements at individual weather stations. Upon this realization, I began connecting the dots, drawing insights from reading your posts and the Gormans’ regarding uncertainty over the past year. So I owe you all thanks. 🙂
Glad to have been of help!
What the trendologists have been told (repeatedly) is that for time series measurements, like air temperature, you get exactly one chance to record the number, then that data point is gone forever.
N is always exactly equal to one!
This not-very-subtle point has never penetrated their information spaces, and probably never will.
BTW—Nick Stokes calls anyone who doubts the tiny air temperature uncertainty number they spew “uncertainty cranks”. But he has his own website, so he must be an expert—not.
Keep up the ad homs dude. It just makes you look less and less knowledgeable.
Tell us how many hours of vector calculus have you had and where? Do you know why EE’s need to pass that class? What do EE’s deal with that requires vector calc?
Go through your F(a-b) example again and show us how and why a subtraction of two means, i.e., “a” and “b”, have “a” and “b” also end up in the combined uncertainty equation as subtracted terms after squaring.
Talk about algebra errors!
Can you give us a peer reviewed paper that refutes Dr. Frank’s paper?
If not, all you are doing is using an argument fallacy of Appeal to Authority.
Texts that you don’t understand, but pretend that you do.
No, that is *NOT* what they say. Stop lying!
u(c)^ = Σ u(x_i)^2 (simplired).
There is no way that equation can make u(c) less than the quadrature sum of the individual uncertainties!
“ uncertainty of the average”
You are using the argumentative fallacy of Equivocation on a continuous basis. That phrase is typically used by statisticians to describe the precision with which the mean has been calculated from samples. It has *NOTHING* to do with the measurement uncertainty of the mean as propagated from the individual measurements, either by using their standard deviation or the quadrature addition of the individual uncertainties.
NO ONE CARES HOW PRECISELY YOU CALCULATE THE MEAN OF A GLOBAL TEMPERATURE DATA SET! Or at least they shouldn’t.
The last significant digit in that average should be of the same order of magnitude as the measurement uncertainty of the average. Calculating the average to digits past that justified by the measurement uncertainty is statistical fraud. It is implying that you know something that is actually part of the GREAT UNKNOWN.
It’s why medical science is moving away from the SEM as a measure of uncertainty. Tooo many lawsuits from medical treatment that was justified based on using the SEM instead of the actual measurement uncertainty of the study sample elements.
Why do you make proclamations with no reference. If you can find that in those documents you can certainly end any argument by posting the references in those documents.
GIVE US THE TEXT IN THOSE DOCUMENTS THAT YOU ARE BASING YOUR PROCLAMATION ON.
I notice you didn’t mention TN 1900 Example 2 at all. Is that because it doesn’t fit your proclamation.
“I notice you didn’t mention TN 1900 Example 2 at all. Is that because it doesn’t fit your proclamation.”
They show the uncertainty of the average as being less than that for the individual elements. Standard deviation is 6.4°C, standard uncertainty of average is 6.4 / √22 = 1.4°C
Sorry, not sure where I got those figures from. It should be 4.1°C and 4.1 / √22 = 0.88°C.
If you understood what is being done you would realize why NIST did what they did.
From TN 1900;
First, if you want to use up your data in calculating an average, then you end up with one value. Section 4 & 5 of the GUM doesn’t work with just one observation. To use these properly you need to treat them as individual observations.
You will end up using the observation equation with g(y) being the average of the data, just as NIST did..
“If you understood what is being done you would realize why NIST did what they did.”
Followed, as so often with a whole gobbet of text which in no ways demonstrates what what you are claiming.
You claimed that TN1900 Ex2 did not fit bdgwx’s proclamation that ” the uncertainty of the average is less than the uncertainty of the individual elements that went into it”. I pointed out that it did indeed show the uncertainty of the average being less than the individual elements. Rather than accept or argue against that point, you just do the usual ad hom of claiming I don’t understand it.
“Section 4 & 5 of the GUM doesn’t work with just one observation.”
Yes it does. And if you don’t think it doesn’t, you need to explain to Tim why the Possolo’s example of the volume of a cylinder doesn’t work, given it’s based on single observations.
“You will end up using the observation equation with g(y) being the average of the data, just as NIST did.”
And get a smaller uncertainty value for the average than for the individual measurements, just as NIST did.
For those who don’t know, this conversation is using an example of constructing an uncertainty that is contained in Measurement Uncertainty: A Reintroduction by Antonio Possolo, National Institute of Standards and Technology and Juris Meija, National Research Council Canada
You do realize that it works because the uncertainty of each measurement is a Type B uncertainty that isn’t determined by multiple measurements of the measurand.
You continue to fail in your understanding. You want to the daily temperatures to determine a single measurement of the measurand, i.e., the average of the data. That gives you one measurement to work with. You can’t say you have one measurand and complete equations in the GUM. You can’t have a distribution of experimental measurements when you only have one measurement of the measurement.
TN 1900 treats each daily temperature as an independent measurement of the measurement. That is, multiple measurements of the same thing. You can’t do that with just one measurement of the measurand.
NIST didn’t get a smaller number, they decided to use an expanded experimental standard uncertainty of the mean. If it is made plain as to what the uncertainty is that is being shown, no one would argue with that. Just as no one should argue if someone wanted to use the experimental standard deviation.
I spent the time to use TN1900 temperatures in this equation and you won’t like what came up.
From the NIST ASOS manual:
Max Error = 1.8 –> ±8.7
RMSE = 0.9 –> ±4.4
Assuming Integer Recorded Temps
Half Width Resolution = 0.5 –> ±2.4
Uncertainty for each:
Max Error –> ±8.7
RMSE –> ±4.4
Half Width Resolution –> ±2.4
I find amazing that different methods of finding uncertainty arrive at very close numbers, i.e., ~4 and ~2.
It would help your case if you went through calculating actual numbers to arrive at what you think the uncertainty is. I have been using numbers all along, yet all you have said is that they are wrong without specifying what you think is right.
Show us your calculations.
Again, jeez! My proof reading sucks this morning.
Here it is again with corrections.
For those who don’t know, this conversation is using an example of constructing an uncertainty that is contained in Measurement Uncertainty: A Reintroduction by Antonio Possolo, National Institute of Standards and Technology and Juris Meija, National Research Council Canada
You do realize that it works because the uncertainty of each measurement is a Type B uncertainty that isn’t determined by multiple measurements of the measurand.
You continue to fail in your understanding. You want to the daily temperatures to determine a single measurement of the measurand, i.e., the average of all the data. That gives you one measurement of the measurand to work with. You can’t say you have one measurment of the measurand and complete equations in the GUM. You can’t have a distribution of experimental measurements when you only have one measurement of the measurand.
TN 1900 treats each daily temperature as an independent measurement of the measurand, i.e, the monthly average temperature. That is, multiple measurements of the same thing. You can’t do that with just one measurement of the measurand.
I don’t know why you refuse to the see the difference between;
NIST didn’t get a smaller number, they decided to use an expanded experimental standard uncertainty of the mean. If it is made plain as to what the uncertainty is that is being shown, no one would argue with that. Just as no one should argue if someone wanted to use the experimental standard deviation.
I spent the time to use TN1900 temperatures in this equation and you won’t like what came up.
From the NIST ASOS manual:
Max Error = 1.8
RMSE = 0.9
Assuming Integer Recorded Temps
Half Width Resolution = 0.5
Uncertainty for each:
Max Error –> ±8.7
RMSE –> ±4.4
Half Width Resolution –> ±2.4
I find amazing that different methods of finding uncertainty arrive at very close numbers, i.e., ~4 and ~2.
It would help your case if you went through calculating actual numbers to arrive at what you think the uncertainty is. I have been using numbers all along, yet all you have said is that they are wrong without specifying what you think is right.
Show us your calculations.
The way these clowns abuse the GUM reminds me of undergrad physics and engineering students who think that if they can grab the right formula to plug into, all is good. They are unable to construct a path from the problem to the solution with analysis. These kinds of students typically don’t last very long until moving to other pastures.
Plus their pseudoscience biases tells them to jump at anything that provides the answer they want — very much circular reasoning.
You got that right. I remember helping a kid that designed an amplifier, page after page of calculations, characteristic curves for the transistor, sensitivity calculations. But when he built it, the bottom of the sine wave was flat, and he had no idea what he had done wrong. He thought every resistor that had a color code was EXACTLY that value, every capacitor was exactly what was marked, the transistor behaved exactly like spec sheet. He had no idea how to breakdown the bias circuit and use a good power supply and VTVM to determine the actual values of the resistors. God forbid trying to explain a Wheatstone bridge. On and on, until you have a circuit that worked. He thought that engineering was doing paper design with exact values and that was all it took.
Does this remind you of anything on WUWT?
Would you trust any of these people analyze a truss?
“You do realize that it works because the uncertainty of each measurement is a Type B uncertainty that isn’t determined by multiple measurements of the measurand.”
Which is what I’ve been trying to tell you all along.
I want to find the average of 100 thermometer readings. Each is a single reading, with an assumed uncertainty of 0.5°C – a Type B evaluation. I use Equation 10 in the GUM to work out what the uncertainty iof the average is – it turns out to be 0.05°C.
For some reason you and Tim have got it into your heads that eq 10 only works when the uncertainty is a type A evaluation, and that therefore you are averaging averages of temperature.
“You want to the daily temperatures to determine a single measurement of the measurand, i.e., the average of the data.”
You keep making these assumptions, as a way of deflecting from the simple point – that however the individual uncertainties are derived, the general equation shows that the uncertainty of the mean will be less than the individual uncertainties, and not greater.
“You can’t have a distribution of experimental measurements when you only have one measurement of the measurement.”
Taps the sign saying “Type B”.
“TN 1900 treats each daily temperature as an independent measurement of the measurement. That is, multiple measurements of the same thing. You can’t do that with just one measurement of the measurand.”
You’re really tying yourself in notes to avoid the obvious conclusion.
TN1900 is not using Equation 10 to get the measurement uncertainty of an average of measurements. It’s treating the average as a set of measurements of the same thing, i.e. the average temperature, and using the standard formula from 4.2.3 to get the uncertainty of the average. This is exactly what you do when you take any sample of things to estimate the population mean. Same formula, same derivation, just different words.
“NIST didn’t get a smaller number”
Yes they did. Using the concept that the daily values are measurements of the measurand (average monthly value), then the uncertainty of those measurements is given by the standard deviation of all measurements, estimated by using the sample standard deviation. The uncertainty of the measurand is given as the individual measurement uncertainty divided by the square root of the sample size. The uncertainty of the mean is less than the uncertainty of the individual measurements.
“they decided to use an expanded experimental standard uncertainty of the mean.”
That’s completely missing the point. Reporting an expanded uncertainty doesn’t change the actual uncertainty, it’s just a way of describing the uncertainty as an interval. You could have just as easily described the individual uncertainties as expanded uncertainties.
“I spent the time to use TN1900 temperatures in this equation and you won’t like what came up.”
Sorry, but what equation?
“I want to find the average of 100 thermometer readings. Each is a single reading, with an assumed uncertainty of 0.5°C – a Type B evaluation. I use Equation 10 in the GUM to work out what the uncertainty iof the average is – it turns out to be 0.05°C.”
No, you find the precision with which you calculated the average value!
You assume that each value is a sample average. And then you find the standard deviation of the sample means. It is *NOT* the measurement accuracy of the average.
The average value should have the same magnitude as does the measurement accuracy.
That is u(t) = sqrt(u1^2 + … u100^2) = 5
You would state your measurement as Tavg +/- 5 where last significant digit in Tavg would be the units digit.
You continue to totally ignore those graphs I gave you. The values the average can take on is between the standard deviation marks for the population, not the standard deviation marks for the sample means.
You continue to totally ignore that mathematically you can drive the standard deviation of the sample means to zero while still having a wildly inaccurate average if the data values are also wildly inaccurate.
So you would wind up T_inaccurate +/- 0
Look at the attached graph. If your sample sizes are large, the standard dev of the sample means will be close to the average. The dashed lines. Theoretically you could get the dashed lines right on top of the average with samples that are large enough – i.e. the same size as the population.
The circles represent the values the average *could* take on based on the data in the population. That won’t change no matter what you do with your samples. You can’t change the population distribution by dividing by an arbitrary number such as sample size. The SD stays the SD. Only the standard deviation of the sample means changes, mistakenly called the standard error of the mean.
The uncertainty that is of primary importance in the real world is the value the average *could* be, the standard deviation of the population, the circle lines.
If I am designing a beam to carry a load I don’t care what the standard deviation of the sample means is, I care about where that left circle line is. If I ignore it and the beam breaks and someone dies, then someone related is going to be after my backside in court!
As a professional engineer I would probably even add a safety factor and move that population standard deviation out even further, going out at least two and maybe even three standard deviations of the population. That way if there was a bad beam used I could justify the fact that I made the best design possible and the accident happened from factors outside my control! Sue the manufacturer, not me.
The GAT is no different. Lot’s of money and human impacts are involved, some even including the death of humans. At some point lawsuits will happen. Going to court and saying, “well, I calculated the average value as precisely as possible” won’t be enough. The plaintiffs are going to ask “what was the measurement uncertainty of your calculation of the average?”.
“I want to find the average of 100 thermometer readings. Each is a single reading, with an assumed uncertainty of 0.5°C – a Type B evaluation. I use Equation 10 in the GUM to work out what the uncertainty iof the average is – it turns out to be 0.05°C.”
They (he) will never understand this.
Along with pointing out the statistical fallacy of extrapolating from linear regression results…
“No, you find the precision with which you calculated the average value!”
Call it what you want, but the GUM calls it uncertainty as does Possolo. The GUM calls the equation the “law of propagation of uncertainty”.
“You assume that each value is a sample average.”
You’ve just quoted the part where I explicitly tell you I am not. Each value is an individual temperature reading – not an average. Do you only understand things when if they are written in capitals?
“And then you find the standard deviation of the sample means.”
I am not. I’m propagating the uncertainty of individual measurements.
“The average value should have the same magnitude as does the measurement accuracy.”
In your world, maybe. In the real world I’m just following the standard equation.
“That is u(t) = sqrt(u1^2 + … u100^2) = 5”
How is 5 the same magnitude as 0.5?
Still good to see we are back to square one. You are still claiming the uncertainty of the average is the same as the uncertainty of the sum, that the larger your sample the larger the uncertainty.
“You continue to totally ignore those graphs I gave you.”
No. I looked at them and had a good laugh. Still no idea what you think they proof, or why you were so keen to waste time at Christmas doodling them.
“The values the average can take on is between the standard deviation marks for the population, not the standard deviation marks for the sample means.”
How does your graph proof that? And make your mind up. Is the uncertainty of the mean the standard deviation of the population, or is it the standard deviation times the root of N?
“You continue to totally ignore that mathematically you can drive the standard deviation of the sample means to zero while still having a wildly inaccurate average if the data values are also wildly inaccurate.”
I’ve told you repeatedly I am not denying this. If your measurements are inaccurate so will you average. But that doesn’t mean you abuse the maths in order to get a much larger uncertainty, “just to be on the safe side”. Claiming the uncertainty of the sum is the uncertainty of the average is in no way accounting for the possibility of inaccurate measurements.
And for some reason you only worry about this when talking about an average. If the measurements are inaccurate the sum will also be inaccurate, if the measurements are in accurate the volume of your water talk will be inaccurate.
“The uncertainty that is of primary importance in the real world is the value the average *could* be, the standard deviation of the population, the circle lines.”
Why?
“If I am designing a beam to carry a load I don’t care what the standard deviation of the sample means is”
Then don’t use it. Just don’t assume that everywhere else in the real world is doing the same jobs as you.
“If I ignore it and the beam breaks and someone dies, then someone related is going to be after my backside in court!”
Which is why you do not want to be looking at the uncertainty of the average when talking about a single value. The standard deviation describes the individual uncertainty, the standard error of the mean describes the uncertainty of the average. I would hope as an engineer you would understand the difference.
“The GAT is no different.”
If I’m going to be teleported to a random location on the globe, at a random point in time, and need to be sure I’ve got a 95% chance of being dresses for the temperature, then yes. What I need to know is what the average temperature is, along with the standard deviation.
If I want to know if the world has a significantly different temperature in July than in December, or if it was colder during one time period than another, than the standard deviation of the globe isn’t going to help me. I need to know if the average temperatures are different, and that the difference is large enough that it is unlikely just to be due to chance. For that you need the uncertainty of the average.
“At some point lawsuits will happen.”
I can imagine. Some idiot reads that the average global temperature is 14°C with a small confidence interval, and concludes it will be save to walk around naked during winter at the north pole.
“Call it what you want, but the GUM calls it uncertainty as does Possolo. The GUM calls the equation the “law of propagation of uncertainty”.”
It is the uncertainty for ONE AND ONLY ONE SPECIAL CASE!
Your measurements must meet the following criteria.
Temperature measurements around the globe used to calculate a GAT meet none of these requirements.
Therefore the standard error of the uncertainty is *NOT* the proper measure of the accuracy of that mean. You *must* use either the standard deviation of the data or the propagated uncertainties of the individual data elements.
“You’ve just quoted the part where I explicitly tell you I am not. Each value is an individual temperature reading – not an average. Do you only understand things when if they are written in capitals?”
It doesn’t matter. If you are not measuring the same thing using the same device multiple times under repeatability conditions then you can’t use the standard error of the mean as the accuracy of the mean.
“In your world, maybe. In the real world I’m just following the standard equation.”
It’s how things work in the REAL WORLD!
The standard equation assumes random, Gaussian distributions.
But not everything is random and Gaussian, especially in the real world of temperature measurement on a global basis.
“How is 5 the same magnitude as 0.5?”
Because unless all your measurements were of the same measurand using the same device under repeatability conditions QUARATURE ADDITION OF THE INDIVIDUAL ELEMENT UNCERTAINTIES *IS* THE UNCERTAINTY OF THE AVEAGE.
The propagated uncertainties of the individual elements is 5.
Now, tell me you took 100 individual temperature measurements all at the same time using the same device under the same environmental conditions.
“Still good to see we are back to square one. You are still claiming the uncertainty of the average is the same as the uncertainty of the sum, that the larger your sample the larger the uncertainty.”
No, I am claiming that you can’t just assume that all measurement uncertainty is random, Gaussian, and cancels as you have done.
You are hoping that no one will notice if you don’t list out your assumptions explicitly like Possolo did!
WE NOTICED!
“How does your graph proof that? And make your mind up. Is the uncertainty of the mean the standard deviation of the population, or is it the standard deviation times the root of N?”
Because my graphs don’t assume that the data is random, Gaussian, and all measurement uncertainty cancels. My graph leaves room for the data to have systematic bias — which means that the precision with which you calculate the mean does *not* imply the accuracy of the mean.
You continue with the unstated assumption in every thing you do that all measurement uncertainty is random, Gaussian, and cancels.
That is *NOT* real world.
“I’ve told you repeatedly I am not denying this.”
Every time you claim the standard error of the mean is the accuracy of the mean you are ignoring that the standard error of the mean can be zero while the mean is wildly inaccurate.
It doesn’t matter how many times you deny it. You continue to try and push the standard error of the mean as the accuracy of the mean.
“But that doesn’t mean you abuse the maths in order to get a much larger uncertainty, “just to be on the safe side””
No abuse involved at all – except by you assuming that all measurement uncertainty is random, Gaussian, and cancels.
The larger uncertainty *IS* the real world.
Which would *YOU* use in designing a bridge? A highly precisely calculated mean for the shear strength of the beams you ordered from different manufacturers or the standard deviation of the measurements for the shear strength from each manufacturer?
Your answer will tell us much about where you are coming from. Statistical world or the real world.
“Claiming the uncertainty of the sum is the uncertainty of the average is in no way accounting for the possibility of inaccurate measurements.”
Of course it is – at least if you are making reasonable judgements of the accuracy of each measurement!
Exactly! That’s why you use the quadrature addition of the inaccuracies and not the standard deviation of the stated values!
“It’s been pointed out before that all the guides to uncertainty emphasis not overestimating the uncertainty. Saying the average “could” be anywhere within the population standard deviation ignores that fact that it is extremely unlikely that it will be anywhere out side a much smaller range.”
And, once again, we see you assuming all uncertainty is random, Gaussian, and cancels.
You are mixing probability with uncertainty. In order to make this statement you have assumed you know the probability of each point in the distribution happening. In other words, your foggy crystal ball has suddenly cleared up!
Repeat 1000 times: Uncertainty is not error.
Error may have a probability, uncertainty does not. You don’t know what the GREAT UNKNOWN actually is. That’s why it is known as the GREAT UNKNOWN!
The stated values of a distribution may have a distribution. Uncertainty doesn’t, or if it does there is no way for anyone to know exactly what it is.
You can ASSUME a distribution for uncertainty but its nothing more than a wild a$$ guess! The real world isn’t a place for wild a$$ guesses.
It’s not healthy for either of us continuing these increasing aggressive threads for now. But this one seemed worth mentioning.
“You are mixing probability with uncertainty. In order to make this statement you have assumed you know the probability of each point in the distribution happening. In other words, your foggy crystal ball has suddenly cleared up!”
I keep being told that uncertainty has now nothing to do with probability theory, as the word error has been canceled. This is strange given that all the equations given in the GUM are based on probability.
And the GUM says this:
…
“You can ASSUME a distribution for uncertainty but its nothing more than a wild a$$ guess! The real world isn’t a place for wild a$$ guesses.”
Yet that’s exactly what the GUM says to do. And it’s difficult to see how you can possibly propagate uncertainties if you don’t make some assumptions about the distribution. I’m with the wild ass here. Better a complete guess than pretending the distribution doesn’t exist.
The answer is that you can’t know anything about the great unknown. Much of the GUM depends on assuming a random distribution of values for measurements – it’s the only *easy* way to do things with a symmetric uncertainty interval.
from JCGM 104:2009
“4.7 In Type A evaluations of measurement uncertainty [JCGM 200:2008 (VIM) 2.28], the assumption is often made that the distribution best describing an input quantity X given repeated indication values of it (obtained independently) is a Gaussian distribution [ISO 3534-1:2006 2.50]. X then has expectation equal to the average indication value and standard deviation equal to the standard deviation of the average.”
While this assumption is “often made”, it *still* needs to be justified in any specific situation.
“7.2.4 There are situations where the GUM uncertainty framework might not be satisfactory, including those where
a) the measurement function is non-linear,
b) the probability distributions for the input quantities are asymmetric,
c) the uncertainty contributions jc1ju(x1); : : : ; jcNju(xN) (see 4.14) are not of approximately the same magnitude [JCGM 100:2008 (GUM) G.2.2], and
d) the probability distribution for the output quantity is either asymmetric, or not a Gaussian or a t-distribution.
Sometimes it is hard to establish in advance that the circumstances hold for the GUM uncertainty framework to apply.”
For temperature all of these apply. Temperature is not linear, probability distributions are asymmetric (winter vs summer, etc), uncertainty contributions are not of approximately of the same magnitude (1900 mercury thermometers vs Stevenson screens with PTR sensors, etc), and the probability distribution for the output quantity is certainly not Gaussian or a t-distribtuion.
It’s why climate science always assumes random uncertainty that is Gaussian and always cancels. It’s the only way they can justify the methodology they use to come up with the GAT and any anomalies calculated from the GAT. If they were living in the real world and using real world metrology they simply wouldn’t be able to justify anomalies out to the hundredths digit.
You can try to justify the idiotic statistical analyses climate science does but it will remain garbage. It starts as garbage with a daily “average” that is neither an average or representative of the daily temperature profile and it never gets any better as you go up the line.
You have tied yourself in knots and presented all kinds of inane assertions trying to justify climate science statistics as applied to metrology and measurements. I have no doubt you will continue to do the same thing over and over.
Look at these PDF’s to see the difference in calculating variance. Skewed distributions aren’t even discussed.
That is one reason for expansion, to insure the interval contains the most likely values.
Read this site.
https://www.scribbr.com/statistics/confidence-interval/
“”””The confidence interval only tells you what range of values you can expect to find if you re-do your sampling or run your experiment again in the exact same way.””””
“”””The more accurate your sampling plan, or the more realistic your experiment, the greater the chance that your confidence interval includes the true value of your estimate. But this accuracy is determined by your research methods, not by the statistics you do after you have collected the data!””””
Notice it says:
“””””But this accuracy is determined by your research methods, not by the statistics you do after you have collected the data””””
It also says: “Even though both groups have the same point estimate (average number of hours watched), the British estimate will have a wider confidence interval than the American estimate because there is more variation in the data.”
Variance *is* measure of the uncertainty in the data. That’s why ignoring the variance of temperature data is just one more statistical fraud in climate science.
“Skewed distributions aren’t even discussed.”
Four of those distributions can be, and usually are, skewed.
“That is one reason for expansion, to insure the interval contains the most likely values.”
But if the distribution is skewed, a symmetrical expansion won’t tell you that.
”The confidence interval only tells you what range of values you can expect to find if you re-do your sampling or run your experiment again in the exact same way.”
That’s not a very accurate description. The confidence interval is the range of likely estimates from the population mean. If your estimate is at the edge of that interval, the interval around your estimate, is going to miss up to half your resamples.
jim: ““That is one reason for expansion, to insure the interval contains the most likely values.””
bellman: “But if the distribution is skewed, a symmetrical expansion won’t tell you that.”
Won’t tell you what? That the distribution is skewed? That’s what we’ve been trying to tell you.
Expanding the interval in a symmetrical manner *can* include the most likely values, even in a skewed distribution. An asymmetric interval could be better at describing the possible values. Again, that’s what we’ve been trying to tell you. But you and climate science seem to always want to ignore that.
“That’s not a very accurate description. The confidence interval is the range of likely estimates from the population mean. If your estimate is at the edge of that interval, the interval around your estimate, is going to miss up to half your resamples.”
The confidence interval is very much based on expanding the number of standard deviations used as the interval, i.e. one SD, two SD’s, or three SD’s. If the standard deviation is not a good statistical descriptor of a skewed distribution the use of a confidence interval is also not a good descriptor either.
Not sure what you mean be “your estimate”. The estimate of a “true value”? Give that whole concept up – it is being deprecated more and more every day. Thus the move to just specifying the uncertainty interval without giving a “stated value”. In essence that is a subtle way of saying exactly what I’ve been saying all along, there is not a knowable distribution of uncertainty in the interval. It may be symmetric or it may be asymmetric. Just assuming it is a normal distribution without justifying the assumption is a scientific fraud. The words “many times” is just an excuse for doing things the easy way instead of the right way.
“Won’t tell you what?”
It won;t tell you that an expanded uncertainty contains the most likely values. All the GUM says is to multiply the standard uncertainty by a coverage factor, but if you are worried about the distribution being skewed, that is going to be misleading. Which is why I was puzzled as to why Jim suggested the main reason for using expanded uncertainty was to cover skewed distributions.
“The confidence interval is very much based on expanding the number of standard deviations used as the interval”
Which has nothing to do with my point. I was just pointing out that saying “The confidence interval only tells you what range of values you can expect to find if you re-do your sampling or run your experiment again in the exact same way.” is misleading. It’s an interval about the sample mean, it indicates the likely range of the population mean, not of the next sample.
If the population mean is 100, and the SEM for a specific sample size is 1, with a 95% confidence interval of ±2. Then your sample mean may be 102 ± 2. But it’s quite possible that if repeated the experiment your next sample mean could be 98, well outside the first sample’s interval.
“If the standard deviation is not a good statistical descriptor of a skewed distribution the use of a confidence interval is also not a good descriptor either.”
As I’m saying – basing a confidence interval just by multiplying the SD is not going to be a good way of getting a specific % confidence interval. This is true if the distribution is not normal, even if it isn’t skewed. On the other hand the SD is correct regardless of the distribution. Possibly, that’s why the GUM recommends only using standard, and only using expanded uncertainty if people require it.
They also make it clear that it’s difficult to relate the expanded uncertainty with a specific % of confidence.
“Not sure what you mean be “your estimate”. ”
The estimate you got from your sample.
” Thus the move to just specifying the uncertainty interval without giving a “stated value”.”
If you do that, how are you going to know if the distribution is skewed?
“The average “could” (ignoring probabilities) be anywhere outside the population standard deviation as well as inside it.”
go here: https://physics.nist.gov/cuu/Uncertainty/coverage.html
“Although the combined standard uncertainty uc is used to express the uncertainty of many measurement results, for some commercial, industrial, and regulatory applications (e.g., when health and safety are concerned), what is often required is a measure of uncertainty that defines an interval about the measurement result y within which the value of the measurand Y can be confidently asserted to lie.”
This is the REAL WORLD.
If measurement uncertainty isn’t applicable, like in a cut-to-fit installation of crown molding in an already existing room, then who cares? But if you are making luxury, high quality cabinets to fit in a multi-dollar mansion for a billionaire then you darn well better care about the possible span wherein the actual measurement may be.
You simply can’t do as you do and assume all measurement uncertainty is random, Gaussian, and cancels.
“Then don’t use it. Just don’t assume that everywhere else in the real world is doing the same jobs as you”
ROFL!
Most people in the real world *can’t” just assume all error is random, Gaussian, and cancels. Carpenters can’t. Welders can’t. Engine builders can’t. Machinists can’t. Engineers can’t. Scientists (*real* scientists, not climate scientists) can’t. Jewelers can’t. Medical doctors can’t.
Statisticians who have no liabilities for their mistakes can.
“The standard deviation describes the individual uncertainty, the standard error of the mean describes the uncertainty of the average. I would hope as an engineer you would understand the difference.”
The standard deviation describes the possible values the average can take on. As engineer THAT is of the utmost importance, not how precisely I can calculate the mean from inaccurate measurements.
“Although the combined standard uncertainty uc is used to express the uncertainty of many measurement results, for some commercial, industrial, and regulatory applications (e.g., when health and safety are concerned), what is often required is a measure of uncertainty that defines an interval about the measurement result y within which the value of the measurand Y can be confidently asserted to lie.”
Something you just seem to be incapable of understanding!
“If I want to know if the world has a significantly different temperature in July than in December, or if it was colder during one time period than another, than the standard deviation of the globe isn’t going to help me.”
If you don’t know the standard deviation then you *DON’T* know if it was actually warmer or colder, *YOU* just think you do.
You are no better than the carnival fortune teller with a cloudy ball predicting the future.
Remember, we are dealing with monthly averages so we can verify what we get versus NIST. 100 Temps is over 3 months worth. I don’t recall seeing anomalies based on 3 month averages. Show us how your calculations differ from NIST.
Take the 22 temps from TN 1900 and put them in the equation from Possolo/Meja cylinder equation and what uncertainty do you get.
When you get an answer tell us what your calculations showed.
I’ve already done that. It takes about 15 minutes in a spreadsheet. I’ll verify if you have done it correctly.
The hundred temps was just referencing Tim’s original claim that the uncertainty of the average of 100 temps, each with a random independent uncertainty of 0.5°C, would be 5°C.
Really it could be anything, that’s why it’s the general equation for propagating uncertainty.
“Take the 22 temps from TN 1900 and put them in the equation from Possolo/Meja cylinder equation and what uncertainty do you get.”
As I say, you could just use 4.2.3 or the usual standard error of the mean equation, but if you want – using their definition that the measurand is the average maximum temperature, and each daily value is a single measurement with uncertainty equal to the standard deviation of all the values, and assuming independence et. al. We have the function of the average for the 22 values x1, x2, …, x22. The function is (x1 + x2 + … + x22) / 22. The partial derivative for each term is 1/22.
The mean of the temperatures is 25.59°C, and the standard deviation is 4.09°C. Taking this as the standard uncertainty we have from equation 10 –
u(Avg)² = Σ(∂f/∂xi)²u(xi)²
And as the uncertainty and the partial derivative for each input is identical, we have
u(Avg)² = 22 (1/22)² 4.09² = 4.09² / 22
and taking the square root on both sides
u(Avg) = 4.09 / √22 = 0.872°C.
The same to 3 decimal places as TN 1900.
Applying a 2.08 coverage factor to get the 95% interval, we get an expanded uncertainty U(Avg) = 1.81°C, for an interval of 25.6 ± 1.8°C, or if you prefer not to know where the best estimate is, a range of [23.8, 27.4]°C.
Look at what you just did.
u(xi) = 4.09 –> Experimental Standard Uncertainty.
You have taken up 100’s of messages telling us that somehow using that was incorrect.
Then you use the derivation of calculating the Experimental Standard Deviation of the Mean, i.e., σ/√n. You even show calculating the Expanded Experimental Standard Deviation of the Mean.
You should be embarrassed.
Now explain how monthly average temperatures can show values in the one hundredth or one thousandth as statistically significant. As you show, the intervals are at best, to the tenths place and should really be rounded to ±2.
Showing temps of 25.03 ± 2 looks stupid.
Are you going to verify I did it correct or not?
“You have taken up 100’s of messages telling us that somehow using that was incorrect.”
Complete lie. You really are so obsessed you never attempt to understand what I’m saying. I’ve always said that the “experimental standard deviation” or “standard deviation of a population” is the uncertainty of the individual values. What I’ve been trying to tell you is it isn’t the uncertainty of the average of that population.
“Then you use the derivation of calculating the Experimental Standard Deviation of the Mean, i.e., σ/√n.”
No. You asked me to use the general equation (10 in the GUM) to determine the uncertainty. I did that. Of course it leads to the standard equation for the SEM / Experimental Standard Deviation of the Mean, because it’s all the same principle.
“You even show calculating the Expanded Experimental Standard Deviation of the Mean.”
Yes, it show you get the same result as TN1900.
“You should be embarrassed.”
Why? The only embarrassment I feel is for you. I’ve still no idea what point you think you are making. I’ve been saying all along that the uncertainty of the mean (with all. the usual caveats about randomness etc.) involves dividing the standard deviation by root N. You for some reason disagree, yet champion an example that does just that – and now you seem to be complaining that I get the same result when I use eq 10. Really, what is your point?
“What I’ve been trying to tell you is it isn’t the uncertainty of the average of that population.”
The standard error of the mean is the measurement uncertainty of the average if AND ONLY IF:
None of these are met when collecting temperature data taken at different times in a multiplicity of environments from different devices and different measurands are involved.
You keep wanting to use implicit assumptions that all of these criteria are met without actually stating them explicity. Possolo EXPLICITY assumed all of these criteria were met in his Example 2.
You are trying to prove that the GAT is a useful metric clear out to the hundredths digit. A BIG FAIL!
“Showing temps of 25.03 ± 2 looks stupid.”
This is the proof that climate science is using idiotic methodology for finding the GAT.
You simply cannot get the GAT in the hundredths place. It’s nonsense.
25 +/- 2 would be the proper way to stated the GAT.
We’re are not talking about the GAT. Nobody even uses a GAT. We are talking about the uncertainty of a single monthly average at one station, with a third of the data missing.
“25 +/- 2 would be the proper way to stated the GAT.”
That would be an extremely worrying GAT.
And even for the single station, are you saying Possolo is wrong to write the uncertainty interval to 1 decimal place? Just as I did, [23.8, 27.4]°C.
“We’re are not talking about the GAT. Nobody even uses a GAT. “
get out of the basement once in a while. The GAT is why the idiots in the Western countries are killing coal and nat gas power plants!
“And even for the single station, are you saying Possolo is wrong to write the uncertainty interval to 1 decimal place? Just as I did, [23.8, 27.4]°C.”
Why do you keep ignoring all the assumptions that Possolo made? HE WAS WRITING AN EDUCATIONAL EXAMPLE.
And basically made every assumption he need to in order to meet the requirement of:
In other words he used the very same assumption that you want to apply to everything: all measurement uncertainty is random, Gaussian, and cancels.
You have a reading problem again.
It’s not “standard uncertainty of the average”. It’s “standard error of the average”.
It’s how close you got to the apopulation average, not the uncertainty of the average.
If you already know the SD of the population (i.e. the uncertainty of the average) then then calculating a “standard error of the mean” is useless. If it isn’t zero then you did something wrong!
If you know the SD of the population then how can the standard error of the mean be anything but zero?
“It’s not “standard uncertainty of the average”. It’s “standard error of the average”.”
I’m literally quoting from TN1900:
But if you want to call it standard error of the mean, I’m not going to object.
Uhhhhhh…..
Why didn’t you post the whole thing? Like:
“In this conformity, the shortest 95% coverageinterval is t̄± ks∕√n = (23.8 ◦C, 27.4 ◦C).”
An interval of 3.8C. Just about the same as the standard deviation of the data!
NOT the SEM of 0.872!
Who do you think you are fooling?
I quoted the standard uncertainty, not the expanded.
And due to cloud cover. And due to terrain (east side or west side of a mountain). And due to geography (coastal vs inland).
And on and on and on and on …. ad infinitum.
The proof is in the pudding. It’s why none of the predictions of climate science have come true. It’s why climate science can’t explain ever increasing grain harvests, or the greening of the earth, or why extreme weather is getting less and not worse, or why Miami isn’t underwater yet., or …..
“And yet atmospheric scientists use averages including averages of temperatures ubiquitously. The atmosphere is a chaotic nonlinear system.”
This is an argumentative fallacy known as the Bandwagon Appeal. The Catholic Church (a *LOT* of people) thought the Earth was the center of he solar system at one time. Didn’t make it right.
“No one is saying it does.”
An average by itself is *NOT* a valid statistical descriptor. It REQUIRES variance to be specified as well.
” No single metric fully captures weather”
Really? What does an integrative degree-day do? What would an integrative enthalpy-day do?
Freeman Dyson’s main criticism of climate models were that they weren’t holistic. Neither is the median value of a daily temperature curve.
“That does not mean variances and averages are useless.”
That’s not an answer to what Walter said. He said the average by itself doesn’t capture the variance. He’s correct. And the variance *is* required to specify a distribution alongside the average.
“That’s not true at all. Uncertainty is composed of both random and systematic components. If the random component is nonzero then an average will necessarily have a lower uncertainty than the individual elements that went into it. That is a indisputable and unequivocal mathematical fact.” (bolding mine, tpg)
Then why do you throw the measurement uncertainty away and use the standard deviation of the sample means as uncertainty? That implies you are assuming that ALL the uncertainty, both random and systematic cancel out and only the stated values of the measurements need to be used to determine uncertainty.
You are trying to have your cake and eat it to!
Oddly enough, in recent years there has been a resurgence of belief that the Earth is flat; most of these people are adamant in making sure everyone else is converted to this religion, and resist all attempts to show them the real world with derision and scorn.
It is very much akin to trendology.
Out of the mouths of babies.
Do you really think an average temperature tells you how much latent heat is in the atmosphere? How about air going over mountains or through forests.
Averages are what statisticians and programmers can deal with. That sure doesn’t make the results correct!
Do you really think you have considered all the details? Here is a document about resolution uncertainty.
How to Calculate Resolution Uncertainty – isobudgets
Look up what NOAA says the resolution of ASOS stations is. Resolution is 0.1. Divide that by √3 and you get a standard uncertainty value of 0.06 that needs to be added into the complex. What do you think an anomaly of 0.05±0.06 looks like. Decimals beyond 1/100th are meaningless just because of resolution uncertainty.
Any book that purports to average temperature has an author that doesn’t understand intensive vs extensive properties of matter.
Temperature is an intensive property. Averaging the intensive property of two different objects, i.e. the temperature of two different pieces of atmosphere, is meaningless. The average of temperature in Los Angeles and the temperature in Miami is averaging the intensive properties of two different objects. Physically what does that average represent?
“In the real world variance is defined as σ^2 = Σ[(xi – xavg)^2, 1, N] / N”
So what? That is *NOT* an average value for the data!
The average of the data would be xavg = Σ(x_i)/N.
You simply can’t relate to the real world at all, can you? The variance (σ^2) goes up as the range of the data increases, the average may not change at all as the range of the data goes up! As the range goes up the uncertainty of the average goes up as well!
“As you can see the variance of an average is less than the variance of any one individual element that went into the average.”
That is EXACTLY what Walter is trying to tell you and you are too stubborn to recognize it!
It is the variance of the individual elements that determines climate, not the variance of the average!
You can’t even understand the ramifications of what you derive!
“Y = (A+B) / 2 = 1/2A + 1/2B”
That is a median value, not an average!
You had to assume “Var(X) = Var(A) = Var(B)” in order to make things work.
In nature the range of A and B are seldom the same, if ever. Walter’s example is where they are not equal. If A is daytime temps and B is nighttime temps then Var(A) is most definitely not equal to Var(B).
If A is rainfall in Oct, 2022 and B is rainfall in Oct, 2023 then it is most assuredly true that Var(A) is not equal to Var(B).
You are still stuck in the meme that you the average of a multi-modal distribution has meaning in physical reality. It doesn’t. And you can’t reduce distribution variance by averaging. That doesn’t even make any common sense.
If you combine distribution A –> (1,2,3) with B –> (4,5,6) and find the average you have *NOT* reduced the variance of the combined data sets by half. Var(A) = .7, Var(B) = .7. Combine them and the variance of A combined with B is 2.9. The average of A is 2 and the average of B is 5. The average of the combined distribution is 3.5.
It is the variance of the DATA that determines the uncertainty of the average, not how precisely you have calculated the average. According to the GUM the uncertainty is the estimated range the measurand can take on and that is based on the standard deviation, variance, and range of the data itself.
The average is a number and not a distribution. A number has no variance, it is equal to zero.
What the average has is an estimate of how close sample means approximate the population average. That is the standard deviation of the sample means, it is *NOT* the variance of the average. If is the variance of the sample means!
Assume A and B are samples of the temperature. The standard deviation of the sample means, the SDOM, (mis-named the standard error) for each set alone is 0.6. Combine them and the standard deviation of the sample means increases to 0.8 even though the number of samples went UP.
If these are samples then remember, if SDOM = σ^2/sqrt(n) then σ^2 becomes SDOM * sqrt(n). The standard deviation of the population goes UP as the number of samples increases. It’s a fact that you, bellman, and AlanJ just simply refuse to believe.
In general you cannot reduce uncertainty by averaging. It’s impossible except in one specific case, a case that simply does not apply for a global temperature average calculated from multiple measuring devices measuring multiple things in multiple environments.
It simply doesn’t matter how precisely you calculate the average, the uncertainty of that average increases with the number of samples.
σ^2 = SDOM * sqrt(n)
And it is σ^2 that is the true measure of uncertainty, even according to the GUM.
“ My point to you was that averaging increases NOT reduces variance.”
Hurrah! You got it!
But bdgwx is never going to. Traditional methods are fine for him. His nickname is “Tevye”.
“Again…if you want to know the details of how the temperature evolved throughout the day then you need to use a different metric. Your use of that metric (whatever it may be) does not invalidate someone else’s use of the (Tmin+Tmax)/2 metric.”
That metric is known as DEGREE-DAYS. Something that climate science simply refuses to use – even though disciplines like ag science mad the change in the 20th century!
And it *DOES* invalidate the use of the Tmax and Tmin metric. There have even been studies to show that the (Tmax+Tmin)/2 are inaccurate. It’s because they don’t represent the daily temperature profile correctly!
Again, climate science (and you) are living in the 19th century when it comes to evaluating the climate.
And you don’t see that as a problem! We have the opportunity to move on and start real physical science based on real physical determination of enthalpy even to the subminute times.
He can’t even get past the point that (Tmax+Tmin)/2 is *NOT* an average. It is the median of a multi-modal distribution. The median of a multi-modal distribution basically tells you nothing. You need several other statistical descriptors for it to make sense, things like the range and quartile points!
The use of (Tmax+Tmin)/2 started back when that was the best that could be done, e.g. 17th century analysis methods. Yet bdgwx, bellman, AlanJ, and the rest of climate science continue to spout Tevye’s cry of “TRADITION” as the best way to analyze temperature data!
bdgwx is *NEVER* going to understand this. He has apparently never physically experienced such a thing.
Once you figure this out, there is no going back. It’s unseeable.
As always, just run back to the magic of averaging!
Any sufficiently advanced statistics is indistinguishable from magic.
And that is why it is time to move on. Tmax and Tmin are truly from two entirely different distributions. Neither is Gaussian and much of statistical analysis is bogus because of that.
We’ve been through this at least a dozen times.
Calendar months are an artificial segregation when it comes to seasons and temperature. If you want to *really* know if summer has been hotter then you need to look to the average of the high points during summer. And, depending on weather, that interval can range from early June to late August or even into September in the northern hemisphere.
Looking at arbitrary monthly averages tell you little about what is actually happening. If the warmest period in summer is from late July to early August then looking at July average and August averages will totally miss what is actually going on!
I believe it was Walter that pointed out that it becomes increasingly obvious that none of you (bdgwx, bellmen, AlanJ, et all) have ever lived outdoors for extended periods. Getting 3 inches of rain in 24 hours is vastly different than getting 3 inches of rain over 7 days. But each will result in the exactly the same monthly average for rainfall!
There is so much missed in the monthly temperature averages when it comes to reality that it is impossible to list everything. An average simply doesn’t represent the population variance at all. Yet to you statisticians and computer programmers the average is what you live and die by. The rest of us actually look at the *real* world, not some contrived meaningless “average”.
Plus the size of a month varies by 10% over the course of a year!
If we don’t have the 3 Ms, variance (or sd, but they’re basically the same) and sample size it’s not worth looking at.
If you’re starting to get serious, we need the data set and sampling methodology.
Yes. HVAC people are beginning to do it.
https://www.degreedays.net/calculation
Integrating the entire temperature profile provides a very accurate value of a degree-day. It is easily comparable with other degree-day. Better yet the stations that provide this also provide humidity measurements right along with the temps. Why is climate science not getting out of the rut of tradition and begging to do this? Are HVAC engineers better scientists?
Does it eliminate measurement uncertainty, of course not.
What do you use? You use what Freeman Dyson recommended! A holistic approach. Create a metric that includes grain harvests, deaths from cold, deaths from heat, rainfall, growing season length, and on and on and on and on and on ….. ad infinitum!
“I’ve never suggested that a linear trend is the only way of determining change”
That is *all* you have ever suggested!
Who knows if the globe is warmer than it was 100 years ago? The uncertainties associated with the measurement simply outweigh the differences that are supposedly being found. The differences are truly part of the GREAT UNKNOWN because of measurement uncertainty and improper use of statistical analysis!
I know grain harvests have gone up significantly and that temperature affects harvest. So does rainfall. So does growing season length and heat accumulation and growing degree-days.
Where are those in the so-called “climate” models?
“Create a metric that includes grain harvests, deaths from cold, deaths from heat, rainfall, growing season length, and on and on and on and on and on ….. ad infinitum!”
Great. So whilst you insist that thermometers aren’t accurate enough to determine global temperature, you want to deduce it from a bunch of proxies. Do you not think there may be all sorts of systematic errors in measuring temperature from grain harvests?
By all means measure these things for what they are, or create some sort of index based upon them, but the question was how you confirmed that temperatures in the 1930s were as warm as they are today.
“That is *all* you have ever suggested!”
That’s becasue you only see straw men.
“I know grain harvests have gone up significantly and that temperature affects harvest.”
How do you know. What uncertainties are there in your analysis? Have you calibrated every instrument that counts grain, and ensured there are no systematic errors?
More seriously, do you not think that there have changes in grain harvesting that will have a somewhat bigger effect than rising temperatures. It’s not like people just go out in to the fields to find out how much grain has naturally grown.
“Great. So whilst you insist that thermometers aren’t accurate enough to determine global temperature,”
That’s not what I said at all! I said that the uncertainty is too wide to determine global temperature down to the hundredths digit. In fact, it is probably too wide to determine it to the nearest unit digit! The uncertainty is quite likely to lie in the tens digit!
Based on that it is impossible to know if the globe is “warming” or not! It’s part of the Great Unknown!
“Do you not think there may be all sorts of systematic errors in measuring temperature from grain harvests?”
Of course there will be! And it should be identified. And I didn’t suggest measuring temperature from grain harvests. I suggested creating a metric that INCLUDES grain harvests! Kind of like how Wall Street determines metrics for market sectors from a lot of different inputs!
“By all means measure these things for what they are, or create some sort of index based upon them, but the question was how you confirmed that temperatures in the 1930s were as warm as they are today.”
Crop failures during the dust bowl is a primary indicator that temperatures were as high or higher than today – even when there *was* sufficient rain. Corn crops fail when temperatures exceed a certain point. So do potatoes and soybeans and just about everything!
Your inability to relate to the real world is just never ending.
“How do you know. What uncertainties are there in your analysis? Have you calibrated every instrument that counts grain, and ensured there are no systematic errors?”
Global grain harvests are certainly uncertain, probably in the millions bushels per country. So what? When the grain harvests are setting records HIGHER than the uncertainty interval it’s an indication that temperatures are not burning up the earth.
If your tomato plan keeps on producing record harvests each year in the same soil using the same fertilizer and insect preventer is that an indication that temperature is reaching levels high enough to be a worry on a holistic basis?
“More seriously, do you not think that there have changes in grain harvesting that will have a somewhat bigger effect than rising temperatures. It’s not like people just go out in to the fields to find out how much grain has naturally grown.”
Of course there have been improvements in farming! So what? Those can be just as much a part of the metric as the amount of grain itself. I would point out, however, that weather and temperature impact grain harvests far more than something like minimal tillage. Each factor of the holistic metric needs to be identified and weighted – something climate science just adamantly refuses to even consider. Why is that?
And none of this stuff he spewed about farming has anything to do with NASA stuffing ±1K into a ±0.2K “envelope”.
“And I didn’t suggest measuring temperature from grain harvests.”
My question was if you didn’t accept any temperature data set, what do you use instead in order to justify claims that there had been no warming over a given period. If grain harvests are not measuring temperature, then how do they answer that question?
“I suggested creating a metric that INCLUDES grain harvests!”
But you still need to establish that this hypothetical metric does accurately represent global temperatures.
“Crop failures during the dust bowl is a primary indicator that temperatures were as high or higher than today”
Weird, because most of the time I’m being told that the huge increase in yield is caused by all that increased beneficial warming.
As far as the dust bowl, – I think that was caused by a number of factors, only indirectly related to some warm temperatures. Drought and bad farming practices, for example. I’m not even sure that the dust bowl conditions didn’t to some extent cause the higher temperatures. ”
“Corn crops fail when temperatures exceed a certain point. So do potatoes and soybeans and just about everything!”
Yet listening to some here, heat is nothing but a good thing.
“Your inability to relate to the real world is just never ending.”
As is your inability to get through a constructive comment without throwing in some pointless ad hominem.
“Of course there have been improvements in farming! So what?”
That’s part of it, but I was also thinking just of the economics of supply and demand. The more people there are the higher the demand, and so the more production is profitable.
“My question was if you didn’t accept any temperature data set, what do you use instead in order to justify claims that there had been no warming over a given period. “
It’s not that I don’t accept any temperature data set. it’s that I don’t accept the way they are presented! None of them adequately assess or state the accuracy of the means they calculate.
None of them have accuracy out to the hundredths digit which is what is required to come up with anomaly differences in the hundredths digit. And it simply doesn’t matter how many measurements they have or what their sample size is. All that provides is a more and more precise calculation of an inaccurate mean. That inaccurate mean should have no more decimal digits than the accuracy of the mean propagated from the uncertainties associated with the measurements.
It’s like you claiming that the difference between data points and a derived linear regression line is the accuracy of the trend line. It isn’t. It’s the precision with which you have fit the line to inaccurate data. That does *NOT* determine the accuracy of the trend line. The actual accuracy of that tend line has to be derived from the accuracy of the data points and not the precision with which you fit the line to supposedly 100% accurate data points.
ANY metric, including ones I have mentioned, MUST HAVE AN ESTIMATE OF THEIR UNCERTAINTY INCLUDED! And that uncertainty simply cannot be the precision with which they calculated the average!
It’s why medical science is starting to wake up to the fact that decreasing the standard deviation of the sample means by using larger and larger sample sizes is *NOT* a good metric if the sample data points are inaccurate. The SDOM, as typically used -even by you – assumes the stated values are all 100% accurate and, therefore, the sample means are all 100% accurate and their standard deviation is a measure of the accuracy of the average.
It’s metrology garbage!
“But you still need to establish that this hypothetical metric does accurately represent global temperatures.”
You *still* don’t get what “stated value +/- uncertainty” actually is, do you?
“Weird, because most of the time I’m being told that the huge increase in yield is caused by all that increased beneficial warming.”
The point just went flying right over your head, didn’t it?
If crops failed from high max temps in the 30’s but not from max temps today then what does that tell you about the difference in the two situations?
Most people would say that max temps today must not be as high as they were in the 30’s!
Using a meaningless metric like the daily median temperature tells you nothing about what is actually going on. That median is from a multi-modal distribution. The median can go up from either of the modes going up. In the case of crops, the Tmin distribution is the main determinant of growing season length – which directly affects harvest size. The Tmax distribution is the main determinant of heat accumulation – which also affects harvest size, it has to be above a certain point but also below a certain point. Both of these directly impact CLIMATE, and the median value tells you nothing about that climate
What *would* tell you something about the climate is cooling/heating degree-days. Which climate science adamantly refuses to use. There *is* a reason for that. And, as usual, it is related to rent-seeking by academia for grant money!
Ag science, on the other hand, gets lots of money from the private sector for good science leading to better crop yields obtained more efficiently. Ag science has moved on from using median daily temps to a more 21st century methodology of using integrative degree-day metrics.
” I think that was caused by a number of factors”
Of course it had other factors! Including removal of wind breaks which allowed wind to scour the surface soil from the fields! So what? That just amplifies the need for a a holistic metric that considers ALL factors — which is what Freeman Dyson suggested!
“Yet listening to some here, heat is nothing but a good thing.”
You aren’t listening! Heat is good when it happens at the right time. Moving the first frost free day back and the last frost free day out is GOOD. Burning up crops is bad. One is happening and the other isn’t. But somehow climate science just keeps on missing that simple fact because they won’t change from their 17th century traditional way of doing things!
“As is your inability to get through a constructive comment without throwing in some pointless ad hominem.”
Sometimes the truth hurts. That criticism stems from YOUR inabilities to learn. If you refuse to learn then that is *YOUR* problem, not mine.
“That’s part of it, but I was also thinking just of the economics of supply and demand. The more people there are the higher the demand, and so the more production is profitable.”
So what? None of that has to do with developing a holistic metric having to do with measuring the climate!
Absolutely, this is why I refuse to spend any time engaging with this disingenous person.
I am in complete agreement with this post.
Walter, we are well aware of the problem variability causes. This is why we use established statistical procedures for determining the significance. My workflow utilizes an AR(1) auto-regression model for determining significance. I believe Nick Stokes uses an ARMA model. I don’t remember what Bellman said he uses. It’s probably a built-in R function that does something similar to AR(1) and ARMA. Anyway, the point is that we aren’t blind to the problems and nuances of trends.
If you’re curious here is the AR(1) computed confidence interval of the UAH-TLT trend through 2022. Notice that as the UAH dataset gets larger then confidence interval in the computed trend gets smaller. Even with 43 years of data the uncertainty is still on the order of ±0.05 C/decade.
Am I supposed to be impressed by how you draw your straight lines?
You are, once again, trying to equate the standard deviation of the sample means to the uncertainty of the average. Your confidence interval simply doesn’t take into consideration the variance of the population data.
AR(1) is not the standard deviation of the sample means or the uncertainty of the average.
Nor does AR(1) evaluate the accuracy of a population mean. If you feed inaccurate data into an AR(1) algorithm then you will get out inaccurate results. Feeding in random noise simply won’t help in the presence of systematic bias in the input data!
“I don’t remember what Bellman said he uses”
I don’t. Auto-correlation is not something I feel confident about getting right, so I just use the values given by the Skeptical Science Trend Calculator.
Are you joking? Look at the attached. USCRN starts around 2005 and shows no growth even in the face of increasing CO2.
Your growth is using USCRN patches onto old ClimDiv data. That is almost as bad as what Mann did for his hickey stick. NOAA should not be giving the impression that the two temperature datasets are equivalent and can be joined.
Show the trend line, or tell me what trend you get. Don’t just claim there is no warming trend based on your feelings.
“Your growth is using USCRN patches onto old ClimDiv data.”
Oh, no it isn’t.
It’s based entirely on the USCRN data, downloaded from the very site you are referencing. But you don;t have to take my word for it – you could just download the data and see for yourself.
Data for 2023 from NOAA Global Anomaly Measurements addressed here https://www.netzerowatch.com/2023-global-temperature-statistics-and-hot-air/ and shown below for year to date global anomaly results through November and the connection to the 2023 El Niño event.
Because I see the conversation is about to devolve into a discussion on uncertainty with potentially hundreds of posts I thought it might be good to discuss it in a separate thread. I’ll start off with literature relevant to the topic.
Bevington – Data Reduction and Error Analysis
Taylor – An Introduction to Error Analysis
JCGM 100:2008 – Guide to the Expression of Uncertainty in Measurement
For the lurkers…the uncertainty quantifications you see in regards to the global average temperature follow well established procedures documented above.
Literature specifically relevant to the global average temperature is as follows. This is not an exhaustive list.
[Lenssen et al. 2019]
[Rhode et al. 2013]
[Morice et al. 2020]
[Folland 2001]
[Hubbard 2002]
[Christy et al. 2003]
[Mears et al. 2011]
[Haung et al. 2020]
You don’t have even Clue One about real measurement uncertainty.
Averaging does NOT remove uncertainty, but pseudoscience “climate” clowns such as yourself have deluded themselves into believing it does.
Data fraud is all the climate hucksters have.
In addition, not one of these climate trolls-fraudsters understand the difference between error and measurement uncertainty.
This is in reference NIST TN 1900. I provided it to the commenter because 1) it is a scenario where the uncertainty of the average scales as 1/sqrt(N) and 2) it is a scenario involving temperature. Note that the commenter repeatedly claims that u(avg) actually scales as sqrt(N) (or some other factor depending his particular mode for the day) contrary to the publications above and the NIST uncertainty machine.
The request for me to show why NIST TN E2 it is incorrect when I have been defending it all this time may be the commenter’s strategy for deflecting and diverting away from his own egregious algebra mistakes that prevents him from coming to the same conclusion as Bevington, Taylor, JCGM, NIST, and the entirety of science. He didn’t even know about NIST TN 1900 until I posted it, but has challenged it ever since.
LIAR.
You claim that stuffing the average formula into the GUM allows you to ignore temperature sensor measurement uncertainty—IT DOESN’T. You don’t know WTF you rant and rave about.
Averaging CANNOT remove-reduce-whatever systematic measurement uncertainty.
You’ve been told this again and again but the lesson never penetrates the skull.
I claim no such thing. What I claim is that when you plug y = Σ[x_i, 1, N] / N into JCGM 100:2008 equation 10 the result is u(y) = u(x) / sqrt(N) when r(x_i, x_j) = 0 for all x_i and x_j and u(x) = u(x_i) for all x_i. It is indisputable and unequivocal…measurement uncertainty is considered here whether you understand the algebra or not.
If you want to challenge this go ahead. Just make sure you 1) challenge what is being discussed and not some stupid strawman argument you made up 2) use correct algebra that you have already double checked using a computer algebra system and 3) double check your that your solution passes the sniff test using the NIST uncertainty machine for good measure (no pun intended).
More lies, clown. You ran away from the main point:
“Averaging CANNOT remove-reduce-whatever systematic measurement uncertainty.” — Moi
For the same reason they always forget that both Bevington and Taylor say you can’t identify systematic uncertainty using statistical analysis. It’s an inconvenient truth for them so the easy way out is to just ignore it and pretend systematic uncertainty never exists in temperature measurements.
“ It is indisputable and unequivocal”
As usual, you are calculating the average uncertainty and are tying to claim that is the uncertainty of the average.
The average uncertainty is useless.
Suppose you have three boards whose uncertainties are u1, u2, and u3 and each are different.
The average uncertainty is (u1+u2+u3)/3. So what?
If you combine two of the boards to form the sides of a concrete form then the average uncertainty is useless.
you might have u1+u2 as the total uncertainty.
Or, u2+u3. Or u1+u3. None
And u1+u2 ≠ u1+u3 ≠ u2+u3.
If you combine all three then the uncertainty is u1+u2+u3. That just happens to be the same as 3(u_avg). Again, so what?
Why do all the statisticians on here defending the GAT have so much trouble relating to the real world and measurements in the real world.
BTW, if u(y) = u(x) / sqrt(N) ever zero?
If not then why does climate science never give the value of u(y) = u(x) / sqrt(N) ?
I calculated u(Σ[xi, i = 1 to N] / N). Do you call that the “average uncertainty” or the “uncertainty of the average”?
I agree. That’s why I never calculate it. And so there is no confusion I define “average uncertainty” as Σ[u(xi), i = 1 to N] / N and “uncertainty of the average” as u(Σ[xi, i = 1 to N] / N).
So we agree that “average uncertainty” is Σ[u(xi), i = 1 to N] / N?
So then why are calling u(Σ[xi, i = 1 to N] / N) the “average uncertainty”?
You calculated the standard deviation of the sample means. That is only and nothing more than an indicator of how precisely you have located the population mean.
It does *NOT* tell you one single, solitary thing about the accuracy of the mean. If it is a totally random variable then the accuracy of the mean is determined by the variance of the population. If it includes systematic bias then it is the uncertainty of each individual element that must be propagated onto the mean, typically through adding the uncertainty in quadrature.
I’ll keep repeating it till maybe it sinks into your head – the average uncertainty is not the uncertainty of the average!
Stop deflecting and diverting. Define “average uncertainty” and “uncertainty of the average” mathematically.
average uncertainty is (Σu_i)/n which is, in essence what you are calculating.
Uncertainty of the average is the standard deviation (perhaps expanded) of the data set itself, if and only if the data is considered to be all random and taken under the same environmental conditions.
If the random and environmental conditions are not met then the uncertainty of the average is the quadrature addition of the uncertainties of the individual data points.
The temperature measurement data is “stated values +/- uncertainty”.
Your average is only Σ(stated values)/n. It totally ignores the other half of the measurement.
Your (Σu_i)/sqrt(n) is nothing more than an estimate of the precision with which you have located the population average. That is *NOT* the accuracy of the mean you have calculated.
You need to write down “standard error of the mean” 1000 times on a blackboard and then ERASE each statement individually and deliberately.
The “standard error of the mean” is an appellation developed by statisticians as a description of a data set consisting only of stated values with no associated uncertainty.
The term “standard deviation of the sample means” is a much more meaningful and accurate description. It leads one to the understanding that inaccurate data creates inaccurate sample means which, in turn, leads to inaccurate estimates of the population uncertainty.
You can calculate the standard deviation of the sample means out to the 10 millionth digit by taking more and more samples thus creating an ever increasing precision in the population mean estimate BUT IT WON’T MAKE THAT ESTIMATE ANY MORE ACCURATE!
Entropy is a harsh mistress.
Climate science meme:
all uncertainty cancels.
all data sets have the same variance.
precision is accuracy.
I had these memes kicked out of me in my first physics and electronics labs.
Shouldn’t that be “the moon”
Borrowed-stolen line, I have to admit it.
At least you know your classics 🙂
You don’t even know what you are doing.
You have in the past defined the functional relationship as an average. The only data you have are temp measurements. That means x₁ = the average of the one and only series of data you have. Where does the data come from to calculate x₂?
In case you still don’t understand here is an illustration. Experimental uncertainty is done with multiple measurements OF THE MEASURAND.
Let’s use A = l • w
Experiment 1 Experiment 2
x₁ = l₁,₁ • w₁,₁ x₁ = l₁,₂ • w₁,₂
x₂ = l₂,₁ • w₂,₁ x₂ = l₂,₂ • w₂,₂
xₙ = lₙ,₁ • wₙ,₁ xₙ = lₙ,₂ • wₙ,₂
y₁ = f(x₁, x₂, xₙ) y₂ = f(x₁, x₂, xₙ)
You have defined your functional relationship as
y₁ = (T1 + T2 + Tn)/n
Where do you get the multiple measurements in a month to calculate y₂, up to yₙ?
Without multiplse determinations of the measurand you have defined, Section 4 & 5 and Eq. 10, 13 and 17 don’t even apply.
Why do you think NIST did what they did? They had “y1” and that is all. They calculated the variance of the distribution as shown in Eq. 4 and then calculated s²(q̅) per Eq. 5 and followed up with expanding the interval.
Read Section 4.2.3 closely. Look carefully at the following.
Thus, for an input quantity Xᵢ determined from n independent repeated observations Xᵢ,ₖ, the standard uncertainty u(xᵢ) of its estimate xᵢ = X̅ᵢ is u(xᵢ) = s(X̅ᵢ), with s²(X̅ᵢ) calculated according to Equation (5). For convenience, u²(xᵢ) = s²(X̅ᵢ) and u(xᵢ) = s(X̅ᵢ) are sometimes called a Type A variance and a Type A standard uncertainty, respectively.
No where in your post do you define “average uncertainty” and “uncertainty of the average” mathematically. It’s just more deflection and diversion. At this point I don’t really have choice but to continue to accept that you don’t even know what you mean when you use those words nor do you even understand what an average is at its most basic level.
Hat size getting bigger there?
You simply refuse the obvious.
If you have a data set of:
1 +/- .1, 2 +/- .5, 3 +/- 3, 4 +/- 2
then what is the average? (1+2+3+4)/4 = 10/4 = 2.5
What is the average uncertainty? .1+.5+3+2 = 5.6/4 = 1.4
What is the uncertainty of the data set?
The standard deviation of the stated values is (assuming totally random data with no systematic uncertainty)
If the data is the entire population it is 1.1
If the data is a sample then the it is 1.3
If the data has unknown systematic uncertainty then the uncertainty of the average is sqrt(.1^2 + .5^2 + 3^2 + 2^2) = 5.02
In no case is the uncertainty of the average equal to the average uncertainty. In the case of unknown systematic uncertainty (as with temperature data bases) the uncertainty of the average is 3.5 times as much as the average uncertainty.
If each data point is the mean of a sample then the standard error of the mean is about .65. Far less than any of the valid measures of the actual uncertainty of the mean, whichever method you use.
There is a *reason* why competent engineers don’t use the standard error of the mean or the average uncertainty when designing something like a bridge. Underestimating uncertainty carries legal and professional ramifications. For some reason, statisticians like you just can’t seem to grasp that simple fact!
“uncertainty of the average scales as 1/sqrt(N) “
This is a measure of how precisely you have calculated the average from the samples. IF THOSE SAMPLES ARE INACCURATE THEN THE AVERAGE YOU CALCULATE WILL BE INACCURATE! It is the standard deviation of the sample means, nothing more. It tells you *nothing* about how accurate those sample means are!
This is *exactly* what medical science is moving away from. They are being driven to abandon the standard deviation of the mean as a measure of the accuracy of the mean because of lawsuits, civil and criminal penalties, and the inability to reproduce results.
If every measurement you make is 1 unit high then no matter how many measurements you make and no matter what the standard deviation of the sample means says THE MEAN WILL BE HIGH by some amount.
Why you, bellman, AlanJ, and climate science can’t accept that simple metrology fact is nothing more than a religious belief in dogma you will not abandon.
Why did you not reference NIST TN 1900 or TN 1297. 1900 deals specifically with the uncertainty in a monthly average of Tmax. It is exactly on point with what we are discussing.
Do you not agree with NIST’s findings? A monthly measurement uncertainty of ±1.8°C puts the kibosh on your uncertainty values in the one-hundredths digits. What you are computing is a negligible value that can be ignored. It would only change the uncertainty to 1.8±0.05.
I’ll ask again, tell us what and why you disagree with NIST. They ARE the experts in measurements you know.
Look at the GUM Eq. 10 and 13 that you are fond of. Do you see any minus signs? Do the equations show dividing the total combined uncertainty by the √n?
You’ll see uncertainties always grow, they never get smaller.
“Look at the GUM Eq. 10 and 13 that you are fond of. Do you see any minus signs? Do the equations show dividing the total combined uncertainty by the √n?”
We’ve been doing this for years, and you still haven’t taken the time to understand how partial derivatives work. If your function is an average the individual elements are all multiplied by 1/N – hence their partial derivative is 1/N. Add all these together squared in Equation 10, and you will have a coefficient of N / N^2 = 1 / N. Take the square root to get the standard uncertainty and you are multiplying by 1 / √N.
And of course, it’s no coincidence that calculating the standard error of the mean also involves dividing by √N. Or that the GUM tells you to do this to get the “experimental standard deviation of the mean”.
As I’ve said repeatedly I wholeheartedly agree with NIST.
No it does not. Is consistent with the fact that the uncertainty of the average scales as 1/sqrt(N)…a fact you continue to vehemently reject. And you’ve been told repeatedly that NIST’s figure of ±1.8 C in TN 1900 E2 includes sources of uncertainty arising from natural variability caused by weather in addition to sources of uncertainty arising from the measurement itself. NIST is NOT saying that the temperature measurements themselves have an uncertainty of ±1.8 C.
Absolutely. When y = f(x_1, x_2, …, x_N) = Σ[x_i, 1, N] / N then the partial derivative ∂f/∂x_i = 1/N for all x_i. Take the sqrt of that and you get 1/sqrt(N). That’s where the 1/sqrt(N) makes an appearance. You’d be able to convince yourself of this if 1) you stopped conflating sums with averages and 2) used a computer algebra system to solve equation for you instead making trivial algebra mistakes.
You lying yet again—averaging CANNOT remove systematic instrumental measurement uncertainty.
You are STILL trying to say that the average uncertainty is the uncertainty of the average!
The uncertainty of the average is the range of values in the population data the average could take on. See the GUM for the definition.
This is *NOT* the average uncertainty! What you are calculating is how precisely you have calculated the population mean based on the population data while ignoring the uncertainty in the population data.
That mean you have so precisely calculated from an infinite number of samples can be wildly inaccurate if the data is wildly inaccurate. Your equation simply ignores that very simple fact!
It is the *ACCURACY* of the mean that needs to be known, not how precisely you have calculated it from inaccurate population data!
This seems to be source of your consternation. Define “average uncertainty” and “uncertainty of the average” mathematically. Don’t use words. Use the language of mathematics that way there is no ambiguity in what you are saying. Let’s settle this once and for all.
Average uncertainty is is σ²/n or σ/n. Uncertainty of the average (mean of a distribution) is σ, the standard deviation when dealing with experimental standard uncertainty. σ, when multiple determinations of a measurand’s value have occured describes the dispersion of measurements that can be attributed to the mean.
Dividing σ by “n” to obtain an average uncertainty has no definition and is meaningless.
This is new. So now u(avg) = sqrt[Σ[(xi – xavg)^2, 1, N] / N]?
What happened your previous definition of u(avg) = sqrt[Σ[xi^2, 1, N]]?
At any rate you are using a different definition of the terms than everyone else.
Better add this to your lits of errors.
Get busy.
u(c)^2 = Σu(x_i)^2
That *is* the uncertainty of the average. There is no n or sqrt(n) in that simple little formula (simplified from the GUM).
It’s the uncertainty of the individual components added in quadrature!
You keep wanting to use the standard deviation of the sample means as the uncertainty of the average. It is not. It is the uncertainty of your calculation of the population average using the stated values in the data set. It assumes that each and everyone of those stated values is 100% accurate.
If your sample is a set of measurements, say xs_i +/- uncertainty then the mean you calculate from that sample is stated value +/- u(c) where u(c) is as stated above.
YOU want to take that stated value and assume it is 100% accurate, i.e. just throw away the u(c) part of it.
The average of a set of measurements is the best estimate of the stated value. But it *must* be conditioned with an estimate of the uncertainty associated with that value. And that uncertainty simply can’t be the precision with which you have calculated the stated value.
As Taylor says, the last significant digit in any sated value should usually be of the same order of magnitude as the uncertainty. That means that calculating the mean to a precision more than the uncertainty is a waste of time.
You have added the term “sources of uncertainty arising from the measurement itself”. That was not said by NIST. It says uncertainty from calibration which it qualifies as neglible and reading the scale which is covered by the “no other significant sources of uncertainty.
From TN 1900
Look at the first bold phrase, the natural variability of temperature. Then where it says the common end point is a scaled and shifted Student’s t distribution that fully characterized the uncertainty. That is followed by calculating the standard uncertainty of the data, calculating the standard uncertainty of the mean, followed by expanding the uncertainty of the mean which ends up ±1.8. What’s even funnier is that they recognize that using another method of ranking can result in an even larger uncertainty.
Try to remember, the MEASURAND is the MONTHLY AVERAGE. It is not each measurement used to calculate the measurand. There are not multiple measurements of the measurand, only one “Y” is calculated. That is the reason for finding the variance of the distribution of the single observation of the measurand.
Read GUM 4.1.4 very carefully. For a monthly average of temperature, there is one Yₖ = Y₁.
The GUM shows both experimental standard deviation and experimental standard deviation of the mean. It doesn’t provide a recommendation of one over the other. As an engineer, my training is to use the experimental standard deviation. It is a safer uncertainty and covers more of what users may encounter in the use of the value. The experimental standard deviation of the mean is really only useful in one situation, multiple measurements of the exact same thing, under repeatability conditions, GUM B.2.15. That is exactly what NIST tried to set up in their assumptions.
They have a reading problem, must have been that day over Macho Grande.
willful ignorance, willful blindness, willful inability to read, willful refusal to read.
It’s cherry picking at its finest
I see that Block Head J has come to the aid of Block Head G, again claiming their magic formula removes instrumental measurement uncertainty with bullshit.
Clowns both, unskilled and unaware.
A reminder that is was young Carlo who kept insisting that all uncertainty calculations had to based on Equation 10. Now he realizes it gives the same result as all the other propagation equations he starts calling it a magic formula.
Next he’ll whine about me keeping “enemy lists” because I can remember what he was saying a couple of years ago.
The average uncertainty is *NOT* the uncertainty of the average!
Does that simple truth continue to evade your understanding?
The accuracy of the average is determined by the accuracy of the population data. For a random variable that is related to the variance of the data. The average uncertainty simply tells you nothing about the variance of the data. You can’t reduce the variance of the population data by calculating a population average – no matter how precisely you calculate that population average the uncertainty (i.e. the accuracy) of that average will remain determined by the accuracy (i.e. the variance) of the population data!
“The average uncertainty is *NOT* the uncertainty of the average!”
Not this again! It’s like you have some mental block that means you can never see past your own meaningless slogans.
“Does that simple truth continue to evade your understanding?”
No. Because as I’ve told you over and over I agree with you – the average uncertainty is not the uncertainty of the average. You never seem to understand that basic point, and will just keep repeating this mantra ad nauseam. You never grasp that the only way the two will be the same is if you assume 100% correlation in all the uncertainties.
For some inexplicable reason, you then praise people like Pat Frank who do just that and claim the uncertainty of the average is the average uncertainty.
“no matter how precisely you calculate that population average the uncertainty (i.e. the accuracy) of that average will remain determined by the accuracy (i.e. the variance) of the population data!”
And you’re too deluded to even notice that what you have just described is the average uncertainty.
Look at these equations.
y) = Σ (∂f/∂xᵢ)² u(xᵢ)²
u𝒸²(y) = ΣᵢΣⱼ (∂f/∂xᵢ) (∂f/∂xⱼ) u(xᵢ,xⱼ)
There is no such thing as average uncertainty. That is a figment of your imagination. These equations have no subtractions and they do not show dividing by n or the √n. Uncertainties add, always and everywhere to describe the uncertainty of the distribution of the measurements being analyzed.
Why do you think NIST didn’t divide their ±1.8 uncertainty by 22 to obtain an average uncertainty?
You need to get into your head what “μ”, the mean of a distribution is and what “σ”, the variance of avdistribution is. Show a reference where a single distribution’s variance or standard deviation is divided by “n” to obtain an average and what an average variance means.
“Look at these equations.”
And?
“There is no such thing as average uncertainty. That is a figment of your imagination.”
In that case, what’s Tim rabbiting on about?
Of course there’s such a thing as an average uncertainty. If I have three things with uncertainties 1, 2, 3 the average uncertainty is (1 + 2 +3) / 3 = 2. It’s just not the same thing as the uncertainty of the average.
“These equations have no subtractions and they do not show dividing by n or the √n.”
They do if you understand what (∂f/∂xᵢ) means.
“Uncertainties add, always and everywhere to describe the uncertainty of the distribution of the measurements being analyzed.”
What do you think those equations mean in that case. If all you have to do is add all those uncertainties, why go to the trouble of multiplying them by all those partial derivatives? And why do you keep ignoring the parts of the GUM (4.2.3) and that NIST example which show that the uncertainty of an average is the standard deviation of the values divided by √n?
“Why do you think NIST didn’t divide their ±1.8 uncertainty by 22 to obtain an average uncertainty?”
Because they took the standard deviation 4.1°C (which taken to be the standard uncertainty in each measurement), and divided by √22, where 22 is the number of observations, to get the standard uncertainty of the mean.
“You need to get into your head what “μ”, the mean of a distribution is and what “σ”, the variance of a distribution is.”
I know what they are. And σ is not the variance it’s the standard deviation.
“Show a reference where a single distribution’s variance or standard deviation is divided by “n” to obtain an average and what an average variance means.”
Once again, until you finally get it. You do not divide the standard deviation by n, you divide it by √n. That’s because you divide the variance by n, and then take the root to get the standard deviation. This has nothing to do with finding an average of the variances.
The rule for combining variances in an average is to add the variances and divide by n². If all the variances are the same this simplifies to dividing one variance by n. Then take the square root and you get the standard deviation divided by root √n.
This is exactly what TN1900 is doing. The sample standard deviation is taken, and used as an estimate of the standard deviation of the population (which in this example is the distribution of all possible temperatures around the monthly average.) Then you divide by √n, in this case 22, as there are 22 daily observations to get the standard error of the mean. An indication of the standard uncertainty of the mean.
“They do if you understand what (∂f/∂xᵢ) means.”
You lack of competence in calculus is showing again. (∂f/∂xᵢ) is a WEIGHTING FACTOR not an average.
If your equation has squared term in it then the uncertainty for that term gets added in twice to the total. I..e (∂f/∂xᵢ) = 2. It is a WEIGHTING FACTOR.
“You lack of competence in calculus is showing again. (∂f/∂xᵢ) is a WEIGHTING FACTOR not an average.”
I think there must a strong correlation between not knowing what you are talking about and the number of capital letters you use.
No one has claimed it is an average.
“If your equation has squared term in it then the uncertainty for that term gets added in twice to the total”
My equation doesn’t have squares in it – so what on earth are you talking about? We were talking about the equation a – b, and how it ends up with a reduction in the uncertainty if the uncertainties are correlated.
“I..e (∂f/∂xᵢ) = 2. It is a WEIGHTING FACTOR.”
Again, nothing to do with the question, nor with squaring. If (∂f/∂xᵢ) = 2 it means that xᵢ is multiplied by 2 in the function f.
OMG! Now you’ve been reduced to just pure rambling!
me: ““These equations have no subtractions and they do not show dividing by n or the √n.”
you : They do if you understand what (∂f/∂xᵢ) means.
Dividing by n *IS* taking an average!
“My equation doesn’t have squares in it “
Your understanding of calculus continues. (∂f/∂x) is 1 (one) if you don’t have a exponent! The uncertainty then gets multiplied by 1 (one). Does that mean *anything* to you?
“We were talking about the equation a – b, and how it ends up with a reduction in the uncertainty if the uncertainties are correlated.”
The uncertainty is u(a) + u(b).
(∂(a-b)/∂a) = 1. (∂(a-b)/∂b) = -1
But the actual uncertainty equation is u(c)^2 = u(a)^2 + u(b)^2, so the -1 becomes 1.
u(c) = sqrt(u(a)^2 + u(b)^2)
The uncertainties add in quadrature!
Your reference to (∂f/∂x) is noting more than fog.
If the piece parts are correlated then the factor from that correlation ADDS to the uncertainty, it doesn’t subtract from it or divide it!
“If (∂f/∂xᵢ) = 2 it means that xᵢ is multiplied by 2 in the function f.”
No, it means it is SQUARED in the function f! Your lack of knowledge of calculus is *STILL* showing!
“No, it means it is SQUARED in the function f! Your lack of knowledge of calculus is *STILL* showing!”
This would be sad if it wasn’t so funny. Tim has to continually claim that anyone who doesn’t agree with him “doesn’t understand calculus”. Yet continuously demonstrates that he doesn’t now even the basics.
The derivative of 2x is 2.
The derivative of x² is 2x.
This is piratically the first thing you learn in calculus. The derivative of x^a is ax^(a – 1). It’s fundamental.
But you don’t have to take my word for it. There are many programs available that will do the work for you.
The integral (also known as the anti-derivative) of 2x is x^2 not 2x!
PUT DOWN THE BOTTLE!
You missed the constant, but yes. That’s my point. The derivative of x^2 is 2x, so the anti derivative of 2x is x^2 + C.
What exactly is your point? You are just repeating my correction of your mistake, and then shouting another juvenile insult.
the point is that the partial derivative of f/x is a WEIGHTING factor for uncertainty.
If the volume of a barrel is related to R^2 and H then the uncertainty of R gets added in twice to the total uncertainty while the uncertainty of H only gets added in once!
The assertion that a partial derivative when calculating uncertainty is just a partial derivative and not a weighting factor is incorrect.
Again, see Possolo’s explanation of how to figure out the uncertainty of the volume of a barrel!
The point is you never know how to follow an equation, get the calculus wrong, then insult anyone who corrects your errors.
Your claim, back in the mists of time was that the equations never lead to dividing by root n, or produced a negative correction for correlation. Both of those claims come from your simple inability to understand what happens when you use the correct partial derivatives. And you’ve done this before, and refused to accept any explanation as to why you were wrong. You just don’t seem to follow the calculus, and instead guess what the answer should be based on copying a completely different equation.
“If the volume of a barrel is related to R^2 and H then the uncertainty of R gets added in twice to the total uncertainty while the uncertainty of H only gets added in once!”
Yes. But not for the reasons you think. It isn’t because the partial derivative of πHR^2 is 2, it’s actually 2πHR. What you never understand is that what happens then is you divide through by the volume to create a sum based ion relative uncertainties. 2πHR × u(R), becomes 2 u(R) / R.
“The assertion that a partial derivative when calculating uncertainty is just a partial derivative and not a weighting factor is incorrect.”
Whatever you call them – I think the correct term according to GUM is sensitivity coefficients, the point is you are just wrong to claim they cannot be 1/n in the uncertainty of an average, or -1 in the correlation equation. As always you are quibbling to distract from your misunderstanding.
“The point is you never know how to follow an equation, get the calculus wrong, then insult anyone who corrects your errors.”
My understanding of calculus is just fine. I, at least, understand that the partial derivative used in the uncertainty equation is a weighting factor for the uncertainty. Something you were (and probably still are knowing how little you can learn) totally in the dark about!
“Your claim, back in the mists of time was that the equations never lead to dividing by root n, or produced a negative correction for correlation.”
Total and utter malarky. The uncertainty propagation equations do *NOT* lead to dividing by the sqrt(n). You don’t even understand what Possolo did in his example of finding the volume of a barrel.
“Yes. But not for the reasons you think.”
Not me, Possolo!
“It isn’t because the partial derivative of πHR^2 is 2, it’s actually 2πHR.”
You have multiple terms. What happens with the same values appearing in each term. Again – GO READ POSSOLO’S EXAMPLE!
“2πHR × u(R), becomes 2 u(R) / R.”
That is known as a RELATIVE UNCERTAINTY. Another piece of uncertainty that you have never understood! You *STILL* get the uncertainty of R with a weight of 2 as opposed to the weight of the height which is 1!
” think the correct term according to GUM is sensitivity coefficients”
And exactly what do you think a sensitivity coefficient *is*?
Thanks for demonstrating every charge I make at you. All you need to do is understand how to calculate a partial derivative, and enter it into he correct equation. But rather than do that you go through all sorts of hoops, starting with what you expect the result to be, and mangle the calculus in order to get the result you want. All wrapped up in your inability to consider you might be wrong about something. To use one of your favorite cliches – there’s none so blind who will not see.
“My understanding of calculus is just fine. I, at least, understand that the partial derivative used in the uncertainty equation is a weighting factor for the uncertainty.”
See. You assume your understanding is fine, but ignore the actual calculus and jump straight into what you think it is going to be used for. It’s a weighting factor, you say, which you seem to think means it cannot be less than 1. I couldn’t give you an expert distinction between weighting factor and sensitivity coefficient, but usually weightings are relative to each other. Some factors are more important than others. But in this case, that of an average, every uncertainty is reduced by the same factor. Something you would be able to see if you actually did the calculus.
“The uncertainty propagation equations do *NOT* lead to dividing by the sqrt(n).”
An argument by assertion. I’ve demonstrated why they do, so has bdgwx, so could anyone with an elementary understanding of calculus. It all stems from understanding that in the function (x1 + x2 … xn) / n, the partial derivative of each term is 1/n. Anyone who understands basic calculus should come to the same conclusion, but you, believing your understanding is perfect, will insist the true answer is 1. You don’t have to take my word for it – as I said there are numerous sources that will compute it for you.
“You don’t even understand what Possolo did in his example of finding the volume of a barrel.”
And there’s the argument by analogy. It’s irrelevant what Possolo did with the equation for a volume, becasue that’s different to the equation for an average.
“You have multiple terms.”
And each term has it’s own partial derivative, leading to it’s own sensitivity coefficient in the general equation.
“What happens with the same values appearing in each term.”
I’ve told you what happens. I’ve read Possolo. I don’t have to keep reading it because I can work it out from the equation and get the same result. Again, all you have to do is put the right partial derivative in the right slot in the equation – with a final trick of dividing through by V^2, to simplify the result, which neatly turns everything into a relative uncertainty. Just as the specific rules say. Add or subtract and you add the absolute uncertainties. Multiply or divide, and you add the relative uncertainties. It all follows from this general equation.
“That is known as a RELATIVE UNCERTAINTY.”
I know it is, and there’s no need to shout.
“Another piece of uncertainty that you have never understood!”
Did that taunt make you feel better?
“You *STILL* get the uncertainty of R with a weight of 2 as opposed to the weight of the height which is 1!”
Yes, becasue the radius is squared. The problem is, you keep thinking that because that’s what happens in this case, when multiplying values, that it must happen in all cases, and have come to the very wrong conclusion that the derivative of x^2 is 2.
“You assume your understanding is fine, but ignore the actual calculus “
You don’t understand calculus at all so how can you tell what someone is ignoring and what they aren’t?
Take the equation z = x^3 + y^2
The partial derivative ∂z/∂x = 3x^2
So the slope of the line along the z-axis is 3 units of change for a one unit change in x.
the partial derivative of ∂z/∂y is 2y
So the slope of the line along the y-axis is 2 units of change for a one unit change in y.
Thus the contribution to the change one sees in “z” is 3 for x and 2 for y. That’s called a WEIGHTING FACTOR.
Can you even picture this in your mind? I doubt it.
Can you picture what the landscape looks like for the function
H(x,y) = (x-1)/y-5)
“ It’s a weighting factor, you say, which you seem to think means it cannot be less than 1″
Stop putting words in my mouth. I said nothing of the sort! PUT DOWN THE BOTTLE! You are hallucinating!
“ Some factors are more important than others. “
x^3 *is* a more important factor than y^2!!!
“x^3 *is* a more important factor than y^2!!!”
Depends on the size of x and y, and on their uncertainties.
If x is 0.5 and y is 2, and both have an uncertainty of 0.1, then the uncertainty of z = x^3 + y^2 is
= sqrt[9x^6 * u(x)^2 + 4y^4 * u(y)^2]
~= sqrt[0.14 * (0.01) + 64 * 0.01]
~=sqrt(0.014 + 6.4)
~= 2.5
The uncertainty of x is almost negligible, you would get the same result to 3 significant figures of you ignored the uncertainty of x.
(∂f/∂x) = (d(x^3)/dx) = 3x^2
(∂f/∂x)^2 = 9x^4
how did you get 9x^6?
You’re correct there. Sorry my mistake. It should be
= sqrt[9x^4 * u(x)^2 + 4y^2 * u(y)^2]
~= sqrt[0.56 * (0.01) + 16 * 0.01]
~=sqrt(0.0056 + 0.16)
~= 0.41
You’ve led us down the primrose path again. Covariance requires a pair of variables.
For temperature, there is NO pair of variables to use in finding a covariance.
You have one distribution, x_i. There is no y_i. So you can calculate Σ(xi-x_bar) but there is no Σ(yi – y_bar)!
And x1 is not a separate variable from x2, etc……
x and y would apply to finding the area of a table where you are combining the two measurements of length and width to find the area.
But not for temperature. Like I said earlier, if you aren’t going to address temperature measurements I don’t have the time to fool with you any longer.
“For temperature, there is NO pair of variables to use in finding a covariance.”
In the function a – b, how many variables do you see?
a & b are not variables, they are single valued when it comes to temp.
You are not addressing temperature measurement. Argue it with yourself.
He will.
“But in this case, that of an average, every uncertainty is reduced by the same factor.”
Uncertainty is squared when adding in quadrature. What does that mean?
The volume of a barrel is dependent on R^2 and H.
Thus the uncertainty of the volume gets two contributions from R and only one from H.
So how is the uncertainty in V reduced by the same factor for each contributing element?
You ae living n a fog. It’s not even apparent that you know what you are saying.
“It all stems from understanding that in the function (x1 + x2 … xn) / n, the partial derivative of each term is 1/n.”
What you are attempting to do is find the STANDARD ERROR OF THE AVEAGE when you divide by n.
The average is *NOT* a measurement. It is not a group of measurements. The GUM is oriented toward working with a group of measurements, i.e. a distribution. Thus the sum from 1 to n for uncertainty. When you plug the average into Equation 10 what is x_2? x_3? In essence you have a sum from 1 to 1. In other words n = 1. A single value!
What do you have when n = 1?
You have 1/n = 1 as well. What is 1 multiplied against anything?
ITS 1!
Think about it! if the average is (x_1 + … + x_n)/n is that a distribution or a single value? What is the uncertainty of that single value?
Jim G has gone over this with you and bdgwx at least twice in the past that I know of. It just seems to go in one ear and out the other.
You *can* find the dispersion (variance, standard deviation, or whatever) of the distribution of (x_1, …, x_n) because it is a distribution.
How is the average a distribution? How can it have a standard deviation?
“What you are attempting to do is find the STANDARD ERROR OF THE AVEAGE”
Yes.
“The average is *NOT* a measurement. It is not a group of measurements.”
You really need to make your mind up on this. If it’s not a measurement how can you claim to know what it’s measurement uncertainty is?
“The GUM is oriented toward working with a group of measurements, i.e. a distribution.”
The inputs to the function in equation 10, are not treated as a distribution, they are just individual inputs.
“Thus the sum from 1 to n for uncertainty. When you plug the average into Equation 10 what is x_2? x_3?”
x_2 is your second value, x_3 is your third. Where is your problem here. Are you saying there’s a difference between adding a sequence of measurements to get a sum, and adding up the measurements and dividing by n?
“In essence you have a sum from 1 to 1. In other words n = 1. A single value!”
And what if you add more than one value, n of them for instance. Then you don’t have a single value.
If this is what you think the real world is like, constantly adding singles values top nothing, I’m rather glad you don’t think I live in it.
“if the average is (x_1 + … + x_n)/n is that a distribution or a single value?”
What is the “that” to which you refer? The average will be a single value (it will also have an uncertainty), the values x_1 .. x_n are a distribution of values.
“What is the uncertainty of that single value?”
As a starting point it’s the value obtained by plugging the uncertainties of the individual measurements into equation 10, or if there is correlation 13. There may well be other sources of uncertainty. But that’s assuming you want an “exact” average.
If you are want the uncertainty of the sample as it relates to the population mean, then you can use the good old SEM. There you are using the distribution of the values as an estimate of the standard deviation of the population. Again there may well be other sources of uncertainty.
“How is the average a distribution? How can it have a standard deviation?”
Try asking the same question about your cylinder. Is that a distribution, does it have a standard deviation.
The answer is that it’s a single value representing the best estimate of the average, but there is a probability distribution representing the uncertainty. This is what you would get if you repeated the experiment an infinite number of times and recorded all the means. That probability distribution has a standard deviation, and that’s what the general equations are trying to estimate.
“You really need to make your mind up on this. If it’s not a measurement how can you claim to know what it’s measurement uncertainty is?”
That one single value for the average does *NOT* determine the uncertainty of that single value. The uncertainty of that single value is determined by the accuracy of the data points used to calculate that single value. That does *NOT* make the average a measurement, it is a statistical descriptor of the actual measurements!
“The inputs to the function in equation 10, are not treated as a distribution, they are just individual inputs.”
If it is not a distribution made up of different values then the sum operator, Σ, makes absolutely no sense!
What *is* the Σ x_i, from i=1 to i=1?
If the components in the equation do not individually provide a distribution then they are CONSTANTS. Constants have no uncertainty. A functional equation of components with no uncertainty has no uncertainty.
If y = 3/4 then what is the uncertainty of y?
“x_2 is your second value, x_3 is your third.”
If x_1 is an average then x_2 must be an average and x_3 must be an average. Otherwise you are trying to use different “things” for each value.
If you are finding the average of a set of averages then you are finding the average of a set of samples. The standard deviation of those sample averages tells you how precisely you have calculated that average of averages. It does *NOT* tell you the accuracy of the average you calculated from the set of sample averages.
“What is the “that” to which you refer? The average will be a single value (it will also have an uncertainty), the values x_1 .. x_n are a distribution of values.”
What determines the uncertainty of that average? The data elements in the distribution you are finding the average of?
If the average is a single value then how can it have a distribution of its own? Single values don’t have distributions. What is the standard deviation of that single value? Any uncertainty you give it must be derived from the data elements you used to calculate the average, not from the single value itself.
“As a starting point it’s the value obtained by plugging the uncertainties of the individual measurements into equation 10”
That means you are finding the uncertainty from the elements making up the distribution and not from the single value representing the average.
Where do the x_2 and x_3 average values come from? You can’t seem to answer that. Why?
“There you are using the distribution of the values as an estimate of the standard deviation of the population”
But the SD of the population is SEM * sqrt(n).
“Try asking the same question about your cylinder. Is that a distribution, does it have a standard deviation.”
An average is a single value. A population made up of a distribution of measurements doesn’t have different averages. It has one average. Where do you get multiple averages from? Samples? What does the distribution of sample averages represent? What is the uncertainty of each of those sample averages?
“probability distribution representing the uncertainty.”
The best estimate of an average is not the accuracy (uncertainty) of the average. it is a single value, not a distribution. The accuracy of the estimate can only be determined from the uncertainty of the data elements making up the distribution from which the best estimate of the average is derived.
How does the uncertainty of the data elements making up the sample get propagated onto the best estimate of the average? How does the uncertainty of the entire population of data elements get propagated onto the best estimate of the average?
This the most important problem of declaring the MEASURAND as an average of ~30 daily temperatures. You do not have multiple experiments of the measurand, you have only one!
Guess why NIST used the variance of the 22 days and the expanded uncertainty of the mean!
“And there’s the argument by analogy. It’s irrelevant what Possolo did with the equation for a volume, becasue that’s different to the equation for an average.”
Now you are trying to say that how you calculate uncertainty isn’t a standard. It’s whatever you want it to be!
Unfreakingbelievable!
Uncertainty is related to a functional relationship of measureands. How to calculate the uncertainty is an international standard. It’s laid out in the GUM. You calculate the uncertainty of a measurand, perhaps using other measurands or perhaps directly, not of a constant, single value represented by an average.
There is *NOTHING* in the GUM about how to calculate the uncertainty of a single value!
The fact that you have to claim that the average equation is DIFFERENT than the volume equation and needs to be handled differently should be a clue that something is wrong about your definitions. It would certainly be a clue to most people.
He STILL has zero comprehension of uncertainty propagation.
“How to calculate the uncertainty is an international standard.”
Sorry, but that seems nonsense. You don;t create methods as a standard. Yes the equations are generally correct, but just writing them in a pamphlet and saying they are now the standard is not living in the real world.
And as the GUM explains and you two have sometimes mentioned, there are a lot of things you have to do to determine an uncertainty. It’s not just plugging something into a standard equation. Look at all the points raised in Annex F, that Jim was pointing to.
“There is *NOTHING* in the GUM about how to calculate the uncertainty of a single value!”
Are you sure you’ve read it?
“The fact that you have to claim that the average equation is DIFFERENT than the volume equation and needs to be handled differently should be a clue that something is wrong about your definitions.”
Can you not see that πHR^2 is a different equation to (x1 + x2 + … xn) / n?
The great thing is that for the most part you can use the same general equation to calculate the uncertainty of both. But that doesn’t mean you will get the same result, or even the same type of result. Why do you think the specific equations have to be divided between adding and multiplying?
“Sorry, but that seems nonsense. You don;t create methods as a standard. Yes the equations are generally correct, but just writing them in a pamphlet and saying they are now the standard is not living in the real world.”
You STILL HAVEN’T READ THE GUM, have you?
One of the member bodies of the JCGM that is the copyright holder for the GUM is the IUPAC, the International of Union of Pure and Applied Chemistry. Another is the IUPAP, the International Union of Pure and Applied Physics.
The GUM *IS* an international document on the methods and protocols used for measurements and “establishes general rules for evaluating and expressing uncertainty in measurement that are intended to be applicable to a broad spectrum of measurements.” (bolding mine, tpg)
You *REALLY* need to stop cherry picking and actually read the documents you cherry pick from, read them from the first word to the last and work out any examples they provide.
“Are you sure you’ve read it?”
Yep. You can establish the uncertainty of a single measurement by using Type B uncertainty, but that is based on a knowledge of the measurement devices used and the environment the measurement is taken in and *NOT* based on the measurement itself.
“Can you not see that πHR^2 is a different equation to (x1 + x2 + … xn) / n?”
Can YOU not see that uncertainty is handled the same way for both? You’ve said both need to be handled differently as far as uncertainty is concerned, are you now going to backtrack on that?
“But that doesn’t mean you will get the same result, or even the same type of result.”
Unfreakingbelievable Captain Obvious! Yes, an equation for the value of a resistor vs the value for the volume of a barrel will give you different results *and* different types of results.
The uncertainty of the two results are calculated in the same manner!
As I’ve posted before, he can’t even make it past the title of the document (the GUM).
Do you not recognize how stupid it is to try and make a measurand to be determined by the average of all your data?
You end up with ONE instance of a determination of the measurand’s value. Look at GUM 4.1.4.
It goes on to say.
This means multiple instances of “y”. Yet you are saying there is only ONE calculation. You can’t calculate an average.
Look at 4.2.1
That means multiple independent observations of a measurand. You can’t claim the temperature data used to calculate one measurand can be used again as independent multiple measurand’s.
Why do you think NIST used the 22 pieces of temperature data as 22 independent determinations of the measurand average monthly temperature.
Why did they use the equation tᵢ = τ + εᵢ? Because each temp is a displacement from the mean. This allows one to use an experimental standard uncertainty and the expanded experimental standard uncertainty of the mean. Read GUM, F 1.1.2 and it will tell you why all this works.
No partial differentials, just the standard deviation of the data. As I have already pointed out and which you didn’t refute, NIST could have added the Type B uncertainty that NOAA shows in their LIG, AOSS, and CRN. I just assumed a half-interval of 0.5 and obtained the same answer using a pre-GUM method.
“Do you not recognize how stupid it is to try and make a measurand to be determined by the average of all your data?”
What do you think TN1900 Ex 2 is doing?
“You end up with ONE instance of a determination of the measurand’s value”
And… ?
“This means multiple instances of “y”.”
That’s really taking the sentence out of context You are quoting the Note 2 of 4.1.4, which starts (my enbolding)
It’s saying that if you want a Type A you can either measure each input multiple times, and use the average of each in the function – in which case you use the appropriate equation to propagate the uncertainties of the inputs to the combined uncertainty for the estimate y.
Or you can measure each input once, work out a y from the function. Then measure all the inputs again and get a second y, and repeat. In that case you best estimate for Y is the mean of all the ys, and the uncertainty is the experimental standard deviation of the mean.
If the function is linear there should be no difference, but the second method can be more accurate for non-linear functions.
Of course, if you are doing a Type B analysis, you only need to take 1 measurement and use the assumed uncertainty of the measurement. That’s’ what Possolo does in the water tank measurement. There are only two measurements height and radius, and assumed standard uncertainties for each. There is only one volume value, with a standard uncertainty derived from the general equation.
“Look at 4.2.1”
Again, that is in the context of a type A evaluation.
Read these really carefully.
Exactly how does this happen. You have one measurement each day. There is no multiple times or a chance to do additional measurements..
If you continue to define y = f(x1, …, xn)/n as the functional relationship that is used to calculate the value of a single measurand youve used all the data you have and end up with ONE value. See all those equations with the Σ (summation), exactly what occurs when you have one measurement of one measurand?
“You have one measurement each day.”
You keep ignoring the parts about type B evaluation.
If you have 100 individual measurements, what with a “Type B” uncertainty you can use the general equations to propagate the uncertainty to the average of those 100 measurements.
But, if you want a type A evaluation, that’s what TN1900 does. It treats the single daily measurements, as measurements of the measurand defined as the average temperature for that month. When you do that you are not using Eq10, just the standard formula given in 4.2.3 for the uncertainty of the mean.
When you have that monthly value and it’s uncertainty, you can then use it in Equation 10, using the Type A uncertainty estimate. For example, averaging 12 monthly values to get the annual average along with it’s uncertainty.
“If you continue to define y = f(x1, …, xn)/n as the functional relationship that is used to calculate the value of a single measurand youve used all the data you have and end up with ONE value”
I really don’t get the point you and Tim keep making here. There is only one value, along with an estimate of the uncertainty. The one value is your best estimate of the average.
I’ve asked before, and it just leads to a deflection, why do you only have a problem with this when the functional relationship is an average? What if it’s a sum, or the volume of a cylinder. You still only have one value, and an uncertainty.
I posted this explanation of the difference between evaluating the precision of your calculation of the average value vs the uncertainty of the average value.
Not one person commented on it. To explicit I guess in debunking the meme that the precision of calculating the average value is not the same thing as the accuracy of the average value.
What you are describing is finding the accuracy of the average, i.e. it’s uncertainty. The spread of values that the average could possibly take on. That is simply not the same thing as the standard deviation of the sample means.
“Not one person commented on it”
Maybe most people had more important things to do yesterday, the 25th of December.
Having looked at it I’ve still no idea what you think those scribbling mean. How is it demonstrating the difference between uncertainty and precision? All it seems to show is that regardless of how skewed the population is, with a large enough sample, the sampling distribution will tend to a normal distribution – which is what the CLT says.
“The spread of values that the average could possibly take on. That is simply not the same thing as the standard deviation of the sample means.”
But that’s what the SEM is, whatever silly name you make up for it. It’s the distribution of possible values for the mean based on a specific sample size.
I’m not sure if you agree or disagree with using that in TN1900 Ex 2 as an estimate for the uncertainty of the mean.
It means that the standard deviation of the sample means only determines how precisely you have located the average using only the stated values. The standard deviation of the population defines the interval in which the average could lie. THEY ARE NOT THE SAME INTERVAL.
“ with a large enough sample, the sampling distribution will tend to a normal distribution – which is what the CLT says.”
But that is *NOT* the interval in which the average of the population could lie. In the case of a skewed distribution THERE IS NO STANDARD DEVIATION OF THE POPULATION.
You *really* can’t tell the difference between a skewed population distribution and the distribution of the sample means?
The skewed population will have an asymmetric uncertainty. How does a Gaussian distribution of the sample means tell you anything about that asymmetric uncertainty interval?
“It’s the distribution of possible values for the mean based on a specific sample size.”
No! It isn’t. The fact that you can get a Gaussian distribution of sample means from a skewed population SHOULD TELL YOU THAT!
It is telling you how precisely you have located the average, not the possible values that average could take on.
With a large enough sample, E.G. THE ENTIRE POPULATION, the SEM goes to zero. The average of the sample equals the population average. There is no standard deviation of the sample mean. No standard error of the mean.
Does that make the average 100% accurate?
It apparently does to you.
You are being willfully ignorant.
“The standard deviation of the population defines the interval in which the average could lie.”
The word “could” is doing a lot of heavy lifting there. According tot the GUM uncertainty is meant to indicate where something “reasonably” could be attributed. A sample average “could” lies within the standard deviation interval – it could lie outside it, but the probability is it will be much closer to the population mean than your intervals would suggest – and the larger the sample size, the small the probability that they will lie anywhere close tot the boundaries of your interval.
“But that is *NOT* the interval in which the average of the population could lie.”
What do you mean by “could” here. The population mean could lie in any interval. It will lie in any interval which contains it. You just don’t know what it is. The SEM interval is an indication of where a sample mean of a given size could lie. If you use the population standard deviation for an interval, the sample mean will almost certainly lie within that interval, but it will also almost certainly lie within a much narrower interval. The larger that sample size, the narrower the interval.
“In the case of a skewed distribution THERE IS NO STANDARD DEVIATION OF THE POPULATION.”
I’m just starting to assume that anything you write in all caps is wrong, and you know it. Why else would you need to keep shouting it?
There is a standard deviation in just about an distribution, regardless of it’s shape. And if you use that standard deviation to determine a SEM, and if the sample size is large enough, the sampling distribution will be close to normal regardless of the population distribution.
“You *really* can’t tell the difference between a skewed population distribution and the distribution of the sample means?”
You can, and the sampling distribution is the one you want if you want to know the uncertainty of an average.
“How does a Gaussian distribution of the sample means tell you anything about that asymmetric uncertainty interval?”
It doesn’t. It tells you about the sampling distribution of the mean.
“No! It isn’t. ”
I see we are into panto season. “Oh yes it is!”.
“The fact that you can get a Gaussian distribution of sample means from a skewed population SHOULD TELL YOU THAT!”
What it tells me is that you can get a Gaussian distribution of sample means from a skewed population. This is useful.
“With a large enough sample, E.G. THE ENTIRE POPULATION, the SEM goes to zero.”
Only if the population is finite. When considering measurment error as part of the population, that will be infinite. But in principle, as the sampling size tends to infinity the SEM tends to zero – provided all the assumptions are correct – i.e. IID values.
“Does that make the average 100% accurate?”
Depends on whether there are any systematic errors or not. The answer will almost certainty be yes, so it will never be 100% accurate.
Noe the questions I keep asking are, why do you think that justifies using the population distribution as a substitute for the uncertainty of the mean? What do you think would happen is there was a systematic error in measurement that was bigger than the population standard deviation? And why do you not apply this same logic to say the volume of a water tank?
“The word “could” is doing a lot of heavy lifting there.”
The entire process of measuring and estimating uncertainty is to allow reproducibility of results. That’s not heavy lifting. That’s actual, real world stuff!
“What do you mean by “could” here. The population mean could lie in any interval.”
If what you measure lies outside the measurement plus uncertainty interval of what someone else measures then there is likely a problem somewhere. That’s why Taylor, Bevington, etc all say you don’t want to either underestimate your uncertainty or overestimate it. It affects the reproducibility of results in either case.
From “The Active Practice of Statistics” by David Moore, professor of statistics at Purdue Univ:
“How shall we choose between the five-number summary and the y and s to describe the center and spread of a distribution? A skewed distribution with a few observations in the single long tail will have a large standard deviation. The number s does not give much helpful information in such a case. Because the two sides of a strongly skewed distribution have different spreads, no single number describes the spread well. The five-number summary, with its two quartiles and two extremes does a better job.”
You are still trying to live in statistics world where you can assume the average and standard deviation are all you need for anything. In the real world that just doesn’t apply.
” the sampling distribution will be close to normal regardless of the population distribution.”
Again, so what? That is only useful in telling you how precisely you have located the average. It does *NOT* tell you the accuracy of that average. In the REAL WORLD, it is the accuracy of the average that is of primary concern, not how many digits you have calculated it out to be! You are *still* living in statistics world where how precisely you can calculate the average.
I keep quoting you Taylor and you keep ignoring it. The last significant digit in the average should have the same magnitude as the measurement uncertainty. And the measurement uncertainty is *NOT* how precisely you have calculated the average, it is the ACCURACY of the average. And the accuracy of the average *HAS TO BE* determined by the accuracy of the measurements.
“You can, and the sampling distribution is the one you want if you want to know the uncertainty of an average.”
Get out of statistics world and join us in the real world. NO ONE DESIGNING ANYTHING CARES ABOUT HOW PRECISELY YOU CALCULATE THE AVERAGE. What they care about is the measurement uncertainty of the average. That applies even to the GAT. No one SHOULD care about how many digits you calculate the average out to, they SHOULD care about how accurate that average is. If the measurement uncertainty in the average temperature is in the units digit (which it is in the real world) then you DO NOT KNOW the average beyond the units digit. Only those living in statistics world thinks that the precision with which you calculate the average is a meaningful value.
When designing a bean to span a foundation I DON’T CARE IF THE AVEAGE COMPONENT LENGTH IS CALCULATED OUT TO THE THOUSANDTHS DIGIT! I DON’T CARE IF THE SHEAR STRENGTH OF THE COMPONENTS IS CALCULATED OUT TO THE TEN THOUSANDTHS DIGIT.
I care about the measurement uncertainty of the components! THAT is what will determine my design. I need to estimate if the constructed beam with withstand the load and how many I need to span the length. Doing so requires me to have an expectation of what the minimum shear strength will be and what the minimum length will be. NOT HOW MANY DIGITS THE AVERAGE IS CALCULATED OUT TO!
Climate science SHOULD care about the accuracy of their calculated average temperature, not how many digits they have calculated it out to. If their measurement accuracy is less than the precision then they are only fooling themselves that they know what the actual average is.
I’ll keep repeating it till it sinks in. The standard deviation of the sample means is *NOT* the accuracy of the population average. It is the ACCURACY of the mean that is of prime importance in the real world.
Another indication that climate science is really a liberal art, like physical geography.
“The entire process of measuring and estimating uncertainty is to allow reproducibility of results”
Really? You think that’s the only reason to measure things?
“If what you measure lies outside the measurement plus uncertainty interval of what someone else measures then there is likely a problem somewhere.”
And if the what is being measured is an average, how do you think using the population standard deviation as the uncertainty interval helps?
“That’s why Taylor, Bevington, etc all say you don’t want to either underestimate your uncertainty or overestimate it.”
And is exactly why I’m saying you should not use the population standard deviation as the uncertainty of an average. It will be a huge overestimate.
“You are still trying to live in statistics world where you can assume the average and standard deviation are all you need for anything.”
Another straw man argument. All I am saying is that the uncertainty of the average is less than you are claiming.
“Again, so what?”
There are benefits to knowing that a distribution is roughly normal. It means you have a fair idea of the distribution, just from the mean and standard deviation. You can estimate confidence intervals for example.
“In the REAL WORLD, it is the accuracy of the average that is of primary concern, not how many digits you have calculated it out to be!”
And there’s the Gorman deflection again. Nothing to do with how many digits you use. This discussion is entirely about your claim that the standard deviation of the population is the uncertainty of the average.
“Get out of statistics world and join us in the real world.”
Is this so called real world the one where the uncertainty of the average is the same as the population standard deviation?
” If the measurement uncertainty in the average temperature is in the units digit (which it is in the real world) then you DO NOT KNOW the average beyond the units digit. Only those living in statistics world thinks that the precision with which you calculate the average is a meaningful value.”
Wrong, and irrelevant to the point. Again, this is not about significant figures, it’s about your inability to accept that int he real world, the uncertainty of an average normally reduces with increased sample size. And you seem to be confusing precision with number of digits calculated.
“When designing a bean to span a foundation I DON’T CARE IF THE AVEAGE COMPONENT LENGTH IS CALCULATED OUT TO THE THOUSANDTHS DIGIT! I DON’T CARE IF THE SHEAR STRENGTH OF THE COMPONENTS IS CALCULATED OUT TO THE TEN THOUSANDTHS DIGIT.“
“I care about the measurement uncertainty of the components!”
So why are you worried about the average. As so often, you appeal to the “real” world, is just you finding examples where the uncertainty of the average is not relevant.
Now we get down to it.
Exactly how many results of a measurement do you have for a monthly average? You have declared that your measurement equation is:
f(x1, …, xN) = (1/N) Σ(x1 + … + xN)
You have the ability to take one measurement using this measurement equation because you don’t have multiple measurements to allow using experimental standard deviations. You have one measurement. Bingo, you are done.
You can’t just jump from a measurement equation to an observation equation and use the data that way after you have already declared it differently.
Put up some actual calculations using the TN 1900 temperatures so we all have a common base. Show your assumptions, and how you calculate the uncertainty. Put some cards on the table.
I’m sure I’ve explained this to you a few hundred times, yet you keep making the same misunderstandings.
There are at least two ways you could think of this.
1) A type B evaluation of an average of distinct temperature readings, each with an assumed uncertainty. The measurand is the exact average of all the readings, and the uncertainty is just the type B uncertainties processed through equation 10.
This is only useful if you want to know the exact average, but this is the scenario Tim introduced all those years ago.
2) Treat each of the measurements as a sample from a distribution of all possible measurements. That is saying the measurand is some idealized average, and each individual value is an uncertain measurement of that mean. In that case the uncertainty of the individual measurements is the standard deviation, and the uncertainty of the average is the SD divided by root N. This is using GUM 4.2.3 and is the approach TN 1900 takes.
3) Having got, say, a monthly average for a single station using 2). You could then use that as input for another function using equation 10. For example, you could take the average of 12 monthly values, with the uncertainty derived from 2, and use them as Type A evaluations for an annual average. Or take a number of different station monthly averages for May, and combine them into a regional average for May.
Did you not read what I sent bdgwx?
In generic terms, “a” and “b” are the MEANS of random variables.
The variance of those random variables is σ²(a) and σ(b). The standard deviation of those random variables is σ(a) and σ²(a).
Uncertainty is based upon variance. When adding OR subtracting random variables, variances ALWAY ADD. You DO NOT add standard deviations.
“Did you not read what I sent bdgwx?”
It’s hard enough keeping up with all the drivel directed at me. Why do I have to read the stuff you direct at someone else?
“In generic terms, “a” and “b” are the MEANS of random variables.”
They might be. They could be anything with a known or assumed uncertainty and correlation.
“Uncertainty is based upon variance.”
Again, it’s usually based on standard deviation – hence standard uncertainty.
“When adding OR subtracting random variables, variances ALWAY ADD.”
Which is not the point being made. When you have correlation the equation adds a factor for that correlation. If the function is a – b, then the factor added will be negative – that is it will be subtracted from the uncorrelated uncertainty.
Really, I don’t know why it’s so hard for you to just look at the equations, plug in the correct values and see what the equation becomes. Instead, you always use these arguments from analogy which never work.
“When you have correlation the equation adds a factor for that correlation. If the function is a – b, then the factor added will be negative – that is it will be subtracted from the uncorrelated uncertainty.”
Once again, you show absolutely no ability to relate the math to the real world.
If you have two variables with a negative correlation, exactly what do you think you are finding the uncertainty of for the measurements?
If the temperature at location A is negatively correlated to the temperature at location B what does that indicate physically?
(hint: think of what we’ve been criticizing for two years – combining NH temps with SH temps)
Stop obsessing about the real world. Just follow the equations and see what the result is. If it doesn’t work in the real world complain to anyone using these equations and explain what the real world equations should be. But don’t try to twist the equations just so they fit what you believe should happen in the real world.
“If you have two variables with a negative correlation”
I said nothing about a negative correlation. The assumption is the correlation is positive. The point you keep evading is that if f = a – b, then (∂f/∂a) (∂f/∂b) = -1. It’s as simple as that.
Of course, if you were adding two values, and the correlation between them was negative you would get the same result – less uncertainty. See Taylor Chapter 9, Example: Two Angles with a Negative Covariance for an illustration of this.
“Stop obsessing about the real world. “
Do you even have a clue as to how idiotic that statement is?
My guess is that you simply can’t explain why o-rings exist. Why the compression sleeve in the shutoff valve to your toilet has a radius of curvature perpendicular to the circumference. Why the garden hose connector has a rubber gasket in it. Why precision cabinet makers use a metal rule rather than a Stanley circular tape measure. Why fish plates exist.
“If it doesn’t work in the real world complain to anyone using these equations and explain what the real world equations should be.”
The equations associated with uncertainty *ARE* for the real world. And they work in the real world.
The fact is that it is *YOU* that has said that they work for some functional equations but not for others, not me!
“The point you keep evading is that if f = a – b, then (∂f/∂a) (∂f/∂b) = -1. It’s as simple as that.”
As simple as that? Does that mean you think that if a and be have equal uncertainties that (a-b) is 100% accurate?
Does that *really* make sense to you?
“The point you keep evading is that if f = a – b, then (∂f/∂a) (∂f/∂b) = -1. It’s as simple as that.”
I don’t get it — is he trying to claim with this (a-b) stuff that a baseline subtraction reduces uncertainty?
YEP!
And the Block Heads accuse others of “algebra mistakes”.
Must be a strong jolt of projection in the egg nog today.
So stupid. That is what bdgwx claimed. That the partial of a “-x” is a “-1”. So what?
Eq. 10 –> (∂f/∂xᵢ)² — The minus sign disappears
Eq. 13 –> (∂f/∂xᵢ)² — The minus sign disappears
This very aptly illustrates the art of using straw man arguments. It is actually a good representation of why Kelvin should be used so you don’t encounter “minus” temperatures.
The only thing “a – b” is representative of is subtracting the means of two random variables. I have already posted a video that illustrates why the variance adds when this is done. This is taught in basic statistics. I don’t know why it is even a question.
“Eq. 13 –> (∂f/∂xᵢ)² — The minus sign disappears”
That’s not the bit that’s being talked about. It’s coefficient for adding the covariance. For two variables that’s (∂f/∂x₁)(∂f/∂x₂). No squaring.
“It is actually a good representation of why Kelvin should be used so you don’t encounter “minus” temperatures.”
It has zero to do with minus temperatures.
“I have already posted a video that illustrates why the variance adds when this is done. This is taught in basic statistics.”
Uncorrelated values.
You are really going to make me dig. The usefulness of covariance has a significant dependence on both variables having normal distributions. If they are not normal then the concept of variance and covariance don’t mean much.
You have yet to show that temperature measurement stations results follow a normal (Gaussian) profile. Therefore assuming that the temperature profiles at two different measurement stations, let alone at a single one can be adequately described using the statistical descriptors of average and variance. If you can’t do that then determining covariance even possible.
Assuming normal temperature profiles and high correlation among them is a simplifying assumption climate science makes with little to no actual justification. The temperature profile at a station on the east side of a mountain is different than one on the west side because of different sun insolation. Not only that but it is time-lagged due to the blocking effect of the terrain.
The temperature profile for a coastal city like San Diego is vastly different than for Romana, CA just 30 miles inland. Big differences in Tmax *and* Tmin. Yet these temps are assumed to be correlated when doing homogenization. (my sister-in-law lives in SD and works in Romana)
Not only that but daytime temps tend to follow a sinusoidal distribution while at night it is an exponential distribution. The correlation between them is negative and, according to you, should at least partly cancel out any uncertainty in their average because of a covariance term.
And then you get into the question of “does Tmax determine Tmin). If it doesn’t then Tmax and Tmin are independent, not dependent and covariance is not a good descriptor for their relationship.
Before you get into arguing about a covariance term for the uncertainty of temperature measurements you need to develop the groundwork for it. You have yet to do so.
“Do you even have a clue as to how idiotic that statement is?”
Sigh., Maybe I should have [put quotation marks round the word “real”. I always forget how little humor their is in your real world.
“The equations associated with uncertainty *ARE* for the real world. ”
Except when you don;t like the conclusions.
“The fact is that it is *YOU* that has said that they work for some functional equations but not for others, not me!”
Complete lie. I’m guessing you still can’t figure out that t he result of a function involving multiplying values, will not give the same result as one involving adding.
“As simple as that? Does that mean you think that if a and be have equal uncertainties that (a-b) is 100% accurate?”
If the correlation is +1, and u(a) = u(b), yes. Of course, I doubt that ever happens in the real world, unless there is no uncertainty of a = b.
“Complete lie.”
No, it isn’t.
tpg: ““The fact is that it is *YOU* that has said that they work for some functional equations but not for others, not me!”
bellman: “And there’s the argument by analogy. It’s irrelevant what Possolo did with the equation for a volume, becasue that’s different to the equation for an average.”
Gum 10 works to find the uncertainty for *any* equation. But somehow, not for you!
“I’m guessing you still can’t figure out that t he result of a function involving multiplying values, will not give the same result as one involving adding.”
It doesn’t matter what the form of the equation is. The propagation of uncertainty works for all. It isn’t a matter of results, it’s a matter of how the results are arrived at. You seem to think that because the equation for the volume of a barrel is different than for the area of a table that Gum 10 works for one but not the other. Each gives different results but how you go about calculating the uncertainty of the different results is exactly the same.
“If the correlation is +1, and u(a) = u(b), yes. Of course, I doubt that ever happens in the real world, unless there is no uncertainty of a = b.”
As usual, you are lost in the weeds. Correlation requires two or more input variables *and* that they be somehow dependent.
When you have one measurand, like the temperature, where does the two input factors come from? If you have multiple inputs like with the volume of a barrel just how dependent is the height of a barrel to its radius? In the real world, the height of a barrel is not determined by its radius, it’s determined by how much volume you need.
Once again you are lost in statistics world and not in the real world!
“bellman: “And there’s the argument by analogy. It’s irrelevant what Possolo did with the equation for a volume, becasue that’s different to the equation for an average.” ”
You still aren’t getting this. The equation πHR^2 is a different equation to (x1 + x2 + … + xn) / n.
When calculating the combined uncertainty you use the same equation, e.g (10) from the GUM. But because the function is different the results will be different. And it’s not just that they have different values for each component, but the overall form will be different. In particular it leads to the equation for the volume being one involving relative uncertainty, and the equation for the average involving absolute uncertainties.
Your problem is that you are looking at the R^2 value in the volume equation. Seeing it leads to 2u(R) / R, and then claiming that this means the partial derivative of R^2 = 2. And then shouting that anyone who disagrees just doesn’t understand calculus.
“Gum 10 works to find the uncertainty for *any* equation.”
And I’m agreeing, as long as there is no correlation between the components, and the things don’t get too non-linear, it’s a good approximation. But aren’t you saying elsewhere that it can’t be used for an average?
“You seem to think that because the equation for the volume of a barrel is different than for the area of a table that Gum 10 works for one but not the other.”
I absolutely do not think that.
“Correlation requires two or more input variables *and* that they be somehow dependent.”
And here we have a and b as input variables, and by my calculation that makes two or more variables. And of course they are dependent, we are saying their correlation coefficient is +1.
“When you have one measurand, like the temperature, where does the two input factors come from?”
I’m guessing you are talking about an anomaly, in which a is one monthly average, and b is the average monthly value over the base period.
“Once again you are lost in statistics world and not in the real world!”
I specifically said “I doubt that ever happens in the real world”.
“You still aren’t getting this. The equation πHR^2 is a different equation to (x1 + x2 + … + xn) / n.”
And x + y IS A DIFFERENT EQUATION THAN 10x+10y!!!
” But because the function is different the results will be different.”
Of course it will! But what you are calculating the uncertainty of is ALSO DIFFERENT!
“Your problem is that you are looking at the R^2 value in the volume equation. Seeing it leads to 2u(R) / R, and then claiming that this means the partial derivative of R^2 = 2”
Your lack of reading comprehension is showing again. What *I* said was that it means the uncertainty of the radius gets included twice as opposed to once for the height! Exactly what Possolo did! It doesn’t matter if it the uncertainty is expressed as a direct interval or a relative uncertainty.
Tell me again who is showing an inability to understand basic math?
“And I’m agreeing, as long as there is no correlation between the components,”
For temperature any correlation is either non-existent or very, very small. I’ve given you multiple pictures of temperatures in NE Kansas that show this very well. The temperature in Holton, KS is not correlated to the temperature in Berryton, KS. The temps at these locations are correlated to confounding factors like pressure, humidity, cloud cover, terrain, geography, time, and the movement of the earth and sun as well as other factors.
As for the daily average, the maximum daytime temp does *NOT* determine the minimum nighttime temp. Any correlation between them would be negative if it exists at all. If there is no functional relationship between two measurements then any correlation is spurious, it is coincidental – like the price of lithium and the income tax rate both going up!
Thus there should be no correlation factor involved in finding the uncertainty of the so-called “daily average temperature”. The uncertainty of that metric will only be the quadrature addition of the uncertainties of each factor. In fact, they shouldn’t even be added in quadrature but added directly since the uncertainties shouldn’t see much cancellation of random error if any at all! Most of the uncertainty in each would be systematic uncertainty associated with different measurands existing in a different micro-climate!
“And here we have a and b as input variables, and by my calculation that makes two or more variables. And of course they are dependent, we are saying their correlation coefficient is +1.”
You continue to want to direct this discussion into your statistical world using hypotheticals unrelated to the real world. Temperature exists in the real world, not on your statistical blackboard. Nothing you are offering has anything to do with the uncertainty of the so-called Global Average Temperature and how it is calculated.
You are, in essence, depending on the argumentative fallacy of Red Herring to actually have to admit that your reliance on the calculation precision of a population average using sample is *NOT* the accuracy of that population average.
I’m not going to dance at the end of our statistical world puppet strings any longer. If you can’t post on topic I won’t reply.
“What *I* said was that it means the uncertainty of the radius gets included twice as opposed to once for the height!”
No. What you said was
The point, which you will keep defecting from is that the derivative of x^2 is 2x, not as you claimed 2.
And the further point being that when I tried to correct your mistake you doubled down, and attacked my understanding of calculus.
Your inability to read and comprehend is showing again.
“that term gets added in twice”
“ the uncertainty of the radius gets included twice”
The exact same thing and yet you think they are somehow different.
Stop deflecting. The point is you claiming that the derivative of x^2 is 2. You can either keep believing that, or just admit you made a mistake, and apologize for shouting that I was wrong.
You castigate other for no understanding basic algebra.
u(v)/v ==> u(v)/ πHR2
Break this all down
The uncertainty contribution from R includes the partial derivative of R^2
(∂f/∂R) is πH2R.
To make this into a relative uncertainty you divide by πHR^2
πH2R / πHR^2 ==> 2R/R^2 ==> 2/R
Square that and you get 4/R^2
This gets multiplied by u(R)^2 so you get
(4) [u(R)^2/R^2 ]
u(R)^2 / R^2 is the relative uncertainty of R multiplied by itself.
So the uncertainty of R has a factor of 4. Take the square root and it appears twice in the uncertianty equation. 2u(R) / R
Now do (∂f/∂H) for πHR^2
you get πR^2
divide by πHR^2 to make it a relative uncertainty and you get
1/H when squared becoms 1/H^2
Multiply by u(H)^2 and you get u(H)^2 / H^2. the relative uncertainty of H.
Take the square root and you get u(H)/H. You get a contribution of one part H and 2 parts R to the uncertainty.
Just like Possolo did!
I just simply get tired of having to educate you on basics of algebra, calculus, and uncertainty.
“You castigate other for no understanding basic algebra”
Only when they refuse to correct their mistakes, and attack those who are getting it right.
I’m not sure what point you are making here. You are getting it all correct. It’s all just saying what I tried to explain to you. So why the
“I just simply get tired of having to educate you on basics of algebra, calculus, and uncertainty.”
You are still ignoring the simple point – you claimed, that the derivative of x^2 is 2, and said I was wrong when I said it was 2x. You used the example from Possolo to claim that as the equation involving multiplying a square resulted in a sensitivity coefficient of 2 to the relative uncertainty, that this in some ways proved your point. I then explained why you got 2 in this case and not 2R, and you’ve just accepted what I said. But you still won’t admit you got it wrong, the derivative of x^2 is not 2.
You started off trying to justify bdgwx’s statement that the partial derivative isn’t a weighting factor. And castigating me over not understanding calculus.
Now, after being shown that it *IS* a weighting factor, you are attempting to say that you’ve *always* said it is a weighting factor and that I did it correctly.
I claimed that the partial derivative was a weighting factor. And when you work through the math IT IS A WEIGHTING FACTOR OF 2.
In a relative uncertainty, which is what Possolo used, the R goes away! Leaving the 2 as a weighting factor.
You didn’t work the math all the way through, probably being incapable of it since you don’t understand either calculus or uncertainty, including relative uncertainty!
These climate people might (ok, I know, this is a stretch) appreciate uncertainty better if they did everything in Kelvin and relative uncertainty:
±0.01 K / 300 K = ±0.003% !
As long as it’s not Celsius and relative uncertainty.
“You started off trying to justify bdgwx’s statement that the partial derivative isn’t a weighting factor”
I started off pointing out that you describing it as a weighting factor was confusing you. Specifically leading you to believe that the derivative of x^2 was 2.
I think you are too keen to label things rather than just work out what the correct partial derivatives are and see how they work in the equation.
“Now, after being shown that it *IS* a weighting factor, you are attempting to say that you’ve *always* said it is a weighting factor and that I did it correctly.”
The more you type the more evident your delusions become.
“I claimed that the partial derivative was a weighting factor. And when you work through the math IT IS A WEIGHTING FACTOR OF 2.”
And you still can’t understand this simple point. You want to believe that because, in on e application of the general equation, where you are multiplying all the inputs, the coefficient derived from squaring results in a factor of 2, it must apply to all cases. From this you have decided that the derivative of x^2 is 2. This seems to just go back to your inability to accept that the derivative of x/n is 1/n. And all this to justify your believe that the uncertainty of an average has to be the uncertainty of the sum.
As always you are working backwards, abusing the equations until they give you the result you wanted.
“In a relative uncertainty, which is what Possolo used, the R goes away! Leaving the 2 as a weighting factor.”
You keep saying he used a relative uncertainty as if he had a choice. The fact that you end up with a relative uncertainty happens because you are simplifying the results of the equation.
“You didn’t work the math all the way through, probably being incapable of it since you don’t understand either calculus or uncertainty, including relative uncertainty!”
I’ll let the irony here speak for itself.
“I started off pointing out that you describing it as a weighting factor was confusing you. Specifically leading you to believe that the derivative of x^2 was 2.”
I NEVER SAID THE PARTIAL DIFFERENTIAL WAS 2. I said the result of the partial derivative is a weighting factor. TWO DIFFERENT THINGS.
You *really* need to find a reading tutor.
“I think you are too keen to label things rather than just work out what the correct partial derivatives are and see how they work in the equation.”
I worked out the proper partial derivatives. When you use relative uncertainty most everything cancels. Simple algebra – beyond your ability apparently.
“the coefficient derived from squaring results in a factor of 2, it must apply to all cases.”
IT APPLIES IN ALL CASES WITH AN EXPONENT OF 2. If you have x^3 then it becomes a weighting factor of 3!
“From this you have decided that the derivative of x^2 is 2.”
No, said it becomes a weighting factor of 2!
Here’s one of my statements: “This from the guy that doesn’t even understand that the partial derivative in the uncertainty equation IS A WEIGHTING FACTOR for the uncertainty?”
Or this one: “The partial derivative of x with respect to f IS A WEIGHTING FACTOR for finding uncertainty.”
Or this one: “The partial differential is a weighting factor. All it does is act as a multiplier of the uncertainty associated with the value!”
Or this one: “You lack of competence in calculus is showing again. (∂f/∂xᵢ) is a WEIGHTING FACTOR not an average.”
Or here: “My understanding of calculus is just fine. I, at least, understand that the partial derivative used in the uncertainty equation is a weighting factor for the uncertainty.”
Again, πH(2R) / (πHR^2) ==> (2/R) ==> (2/R)^2 in the formula
Multiply that by u(R)^2 and you get (4) [ u(R)/R]^2 where [u(R)/R] is the relative uncertainty. The partial derivative becomes a weighting factor of 2.
EXACTLY WHAT POSSOLO DID. Which you are apparently unable to figure out!
“As always you are working backwards, abusing the equations until they give you the result you wanted.”
I didn’t “abuse” anything. I worked it out in my head! It’s just one more symptom of you not really understanding algebra, calculus, or even statistics, let alone uncertainty!
“You keep saying he used a relative uncertainty as if he had a choice.”
You keep denying that you are nothing more than a cherry picker that doesn’t understand context. You say you *do* understand context.
And then you turn around and ignore Taylor’s Rule 3.18 for PRODUCTS AND QUOTIENTS.
Taylor: “Because uncertainties in products and quotients are best expressed in terms of fractional uncertainties …”
Taylor: “We conclude that when we divide or multiply two measured quantities x and y, the fractional uncertainty in the answer is the sum of the fractional uncertainties in x and y …”
You have NEVER ONCE actually studied Taylor (or Bevington or the GUM) for meaning and context. You just flip pages till you find something you can throw against the wall hoping it will stick and refute the proper use of math, statistics, calculus, etc.
There *is* a reason why products and quotients are best expressed in terms of fractional uncertainties. But you’ll never figure it out because you would rather remain willfully ignorant and cherry pick stuff hoping people will pay attention to your inanities.
“I NEVER SAID THE PARTIAL DIFFERENTIAL WAS 2. I said the result of the partial derivative is a weighting factor. TWO DIFFERENT THINGS.”
”
Stop shouting, and then stop lying.
Here’s the comment:
Me: If (∂f/∂xᵢ) = 2 it means that xᵢ is multiplied by 2 in the function f.
You: No, it means it is SQUARED in the function f! Your lack of knowledge of calculus is *STILL* showing!
And you are still not getting the problem. You are claiming the coefficient resulting from the partial derivatives is 2, what you call the weighting factor. But it is not becasue the for x^2 the weighting factor will be 2x. You keep failing to see that the reason you only get a factor of 2 for R in the water tank exercise, is because you have divided the 2R by R^2 to get a relative uncertainty. This does not work when you are adding things, rather than multiplying.
“Again, πH(2R) / (πHR^2) ==> (2/R) ==> (2/R)^2 in the formula”
Yes, now try it when the function is R^2 + H. Do you still have a “weighting factor” of 2?
I’m not going into the rest of your personal abuse, but I’ve explained to you what Possolo is doing, why the general rule of propagating uncertainties leads to the specific rules for addition, multiplication, scaling, powers, and everything else. I am agreeing with Taylor and with Possolo. You really need to read them for understanding, not just for cheap point scoring.
“. You keep failing to see that the reason you only get a factor of 2 for R in the water tank exercise, is because you have divided the 2R by R^2 to get a relative uncertainty.”
What do you think Possolo was doing if it wasn’t relative uncertainty?
“Note that π does not figure in this formula because it has no uncertainty, and that the “2” and the “1” that appear as multipliers on
the right-hand side are the exponents of R and H in the formula for
the volume. The approximation is likely to be good when the relative
uncertainties, u(R)/R and u(H)/H, are small — say, less than 10%
—, as they are in this case.”
Once again, YOU ARE CHERRY PICKING with no actual understanding of the context associated with what you are cherry picking.
Pollolo EXPLICITLY stated he was doing relative uncertainty. Something which you would have seen if you had read the entire example and understood it instead of cherry picking.
“This does not work when you are adding things, rather than multiplying.”
I gave you the Taylor quote that relative uncertainty is the best method when doing quotients and products. Apparently you can’t read Taylor for understanding either.
“I am agreeing with Taylor and with Possolo. You really need to read them for understanding, not just for cheap point scoring.”
You aren’t agreeing with Possolo or Taylor because you have no idea what they say or what they do! You prove that with every single assertion you make.
It’s not cheap point scoring. It’s showing you how the calculus works and relative uncertainty works. It’s *NOT* my problem that you couldn’t figure out Possolo’s example and couldn’t even bother to read the entire example for meaning and context.
“ Exactly what Possolo did! It doesn’t matter if it the uncertainty is expressed as a direct interval or a relative uncertainty.”
You are still not getting this are you. Using Eq 10 with the volume function gives you.
u(V)^2 = (πR^2)^2 * u(H)^2 + (2πHR)^2 * u(R)^2
Note the relevant part, is that you are not multiplying the uncertainty of R by 2, but by 2R. The reason you only see the 2, and not the 2R, is that you simplify the equation by dividing trough by V^2 to turn it into a sum of relative uncertainties.
(u(V)/V)^2 = [(πR^2) * u(H) / V]^2 + [(2πHR) * u(R) / V]^2
= [u(H) / H]^2 + [2 u(R) / R]^2
This doesn’t work if the function involves adding. If z = x^2 + y is your function, then Eq 10 just gives you
u(z)^2 = [2x u(x)]^2 + u(y)^2.
You now can’t ignore the value of x.
“(2πHR)^2 MULTIPLYING u(R)^2 ==> (4)(πHR)^2 * u(R)^2
This is actually multiplying u(R)^2 BY FOUR, not just 2!
YOU STILL DON’T UNDERSTAND RELATIVE UNCERTAINTY!
You absolutely refuse to read Taylor and Bevington from cover to cover and actually do the examples.
The relative uncertainty associated with “x” is [ 2xu(x)]^2/ x
This leaves you with the relative uncertainty of [2u(x)]^2!
You don’t know math, you don’t know algebra, and you don’t know uncertainty, especially relative uncertainty.
READ TAYLOR AND BEVINGTON FROM COVER TO COVER AND DO THE EXAMPLES!
STOP CHERRY PICKING!
“You absolutely refuse to read Taylor and Bevington from cover to cover and actually do the examples”
These ad hominems are so ironic coming from someone who is constantly misusing relative and absolute uncertainties. Almost as if it’s better to know how they work, then to mindlessly read a couple of books cover to cover.
And, I’m going to have to keep stating, that Tim is still trying to deflect from his claim that the derivative of x^2 is 2.
I think here he’s referring to my comment
In which case he’s really illustrating his problem:
“The relative uncertainty associated with “x” is [ 2xu(x)]^2/ x“
I am not talking about relative uncertainty.
u(z)^2 = [2x u(x)]^2 + u(y)^2.
Is the result of using Eq 10 with the function x^2 + y. If you want to turn this into a relative uncertainty you need to divide by z^2, not a power of x. You cannot simply divide through by x and ignore the effect on the rest of the equation. You could do what Taylor suggests and break it down into parts, but you have to use actual values. E.g.
if x = 10 with an uncertainty of 0.5, and y = 20 with an uncertainty of 2, we have a best estimate for z of 120, and for the uncertainty, the component from x is 2x * u(x) = 20 * 0.5 = 10, whilst for y it’s just 2. Combining these in quadrature gives
u(z) = √(10^2 + 2^2) = √104 = 10.2.
No need for relative uncertainties. If for some reason you do need the relative uncertainty of z, it’s just 10.2 / 120 = 0.085.
Bellman,
you are a clueless gorilla.
Patently false. It is a partial derivative.
LIAR.
unfreakingbelivable.
Why do you think Possolo used the value of 2 to weight the uncertainty of the radius in the equation for the volume of a barrel?
The partial derivative of R^2 is 2R. Thus the uncertainty of R gets a weight of 2 compared to the other variables such as H (whose partial derivative is 1 – a weighting of 1)
The uncertainty of the radius is twice as important as the uncertainty of the height! Weighting at its finest!
You and bellman have the same problem with relating math to the real world. It must be endemic to the statisticians. I, on the other hand, live in the real world. Poles and zero’s in an equation define a landscape of mountains and valleys, uncertainties define tolerance allowances between things like pistons and cylinder walls or the weight bearing capability of a beam across a basement.
My guess is that you’ll never understand anything beyond the rote memorization of things out of a statistics textbook. The fact that most of them live in a phantom statistical world of make believe never enters your mind.
Patently false. It is a partial derivative.
GUM 5.1.3
I assume you understand that the whole purpose is to weight each uncertainty component based upon its relative impact to the whole.
The real question you need to ask yourself is what the u𝒸(y) combined uncertainty is. Is it made up of multiple measurands, i.e., the monthly average? If not, there is only one component of uncertainty because all you have is Y1.
Now take your pick, experimental standard uncertainty or expanded experimental standard uncertainty of the mean.
sensitivity coefficients – a fancy way of saying a “weighting factor”
“standard uncertainty of the mean.”
That is only a measure of how precisely the mean of the population can be defined. It is *NOT* a measure of the accuracy of the mean, i.e. it is not a measure of the uncertainty of the mean!
Inaccurate data gives an inaccurate mean and it simply doesn’t matter how precisely you calculate that inaccurate mean.
“That is only a measure of how precisely the mean of the population can be defined.”
It’s nothing to do with the definition of the mean. It’s describing how close your sample mean is likely to be to the population mean. Of course, if you muck up the sampling or the measurements this won’t be accurate.
“Inaccurate data gives an inaccurate mean”
Inaccurate data will give you inaccurate results whatever you are doing. Try to avoid using inaccurate data, and if not try to identify it and correct for it. But don’t just assume everything’s inaccurate because you don’t like the results.
“Inaccurate data will give you inaccurate results whatever you are doing. Try to avoid using inaccurate data, and if not try to identify it and correct for it.”
Uncertainty is part of the GREAT UNKOWN. How do you correct for the GREAT UNKNOWN?
“But don’t just assume everything’s inaccurate because you don’t like the results.”
Taylor: “Error in a scientific measurement means the inevitable uncertainty that attends all measurements.”
Bevington: “It must be noted, however, that even our best efforts will yield only estimates of the quantities investigated.”
The only question left is how accurate the results are. That is what uncertainty is used for – to indicate the accuracy of the results.
It isn’t a matter of liking or disliking the results – unless you are a statistician or climate scientist.
Unbelievable. Simply unbelievable.
“The sample standard deviation is taken, and used as an estimate of the standard deviation of the population”
Which, according to Taylor, Bevington, and the GUM *is* the uncertainty of the average!
“standard error of the mean.”
The standard error of the mean” is *NOT* a measure of the accuracy of the mean. Of what use is it if you don’t know how accurate the mean *is*?
“Which, according to Taylor, Bevington, and the GUM *is* the uncertainty of the average!”
Are you going to provide a quote, along with context, or do I just assume this is another of your misunderstandings.
“The standard error of the mean” is *NOT* a measure of the accuracy of the mean”
It’s a measure of the uncertainty of the mean, assuming that all errors are random. If there are systematic errors, or bias in the sampling it won’t be accurate. But you can’t measure the accuracy of any measurement – accuracy is a qualitative concept. You can’t put a number on it.
“Are you going to provide a quote, along with context, or do I just assume this is another of your misunderstandings.”
You’ve been given the quotes over and over. Why don’t you print them out and post them over your desk?
Bevington on random errors: “On the average, however, we can expect them to be distributed around the correct value, assuming we can neglect or correct for systematic errors.”
Distributions are statistically described by both average AND standard deviation. The standard deviation is the usual measure of uncertainty, e.g. the values which the average might possibly take.
Taylor: “The standard deviation of the measurements x_1, …, x_n is an estimate of the average uncertainty of the measurements x_1,…,x_n and is determined as follows.”
The accuracy of the average is determined from the actual measurements and not from how precisely you can calculate the average value.
“It’s a measure of the uncertainty of the mean, assuming that all errors are random.”
No, it is *NOT*. The accuracy of the mean is determined from the accuracy of the measurements. In the case of purely random error it is the standard deviation of the measurements and not the standard deviation of the sample means!
SDOM ≠ σ
Let me help, he can start with this one:
Uncertainty is not error!
He should put that one in 22pt font size!
If your sample data gives you a mean of 20 with a standard error of the mean as 1 but the actual value of the mean is 25 because of measurement error then of what use is knowing the standard error of the mean?
Then you’ve clearly screwed up something. Doing things badly will not get you the right results. It doesn’t matter if you are sampling in order to estimate a population mean, or are adding thing up in order to see if you have enough pieces of wood to build a bridge. If your measurements are all wrong, your result will be wrong.
“Then you’ve clearly screwed up something. Doing things badly will not get you the right results. “
You can *NEVER* get 100% accurate results. Uncertainty is an inherent quality of each and every measurement you make in the real world.
That means you can *never* get 100% accuracy no matter how many measurements you make, even in the face of 0 (zero) systematic bias.
“It doesn’t matter if you are sampling in order to estimate a population mean, or are adding thing up in order to see if you have enough pieces of wood to build a bridge”
Some day you should try joining us here in the real world. It’s only in statistics world that you can get 100% accurate measurements and 100% accurate averages.
“f your measurements are all wrong, your result will be wrong.”
Measurements are ALWAYS wrong. It’s just a matter of how wrong they actually are.
“And you’re too deluded to even notice that what you have just described is the average uncertainty.”
No, I didn’t. The standard deviation of a totally random variable is *NOT* the average uncertainty of the individual data elements. Yet it is the standard deviation of a totally random variable that indicates the uncertainty of the average.
The quadrature addition of the individual data element uncertainties is *NOT* the average uncertainty either.
You remain stuck in a statistical world which has no points of congruence with the real world most of us live in.
“The standard deviation of a totally random variable is *NOT* the average uncertainty of the individual data elements.”
It gets so confusing trying to explain anything to you because we keep switching between measurement uncertainty, and the standard deviation of the population.
“Yet it is the standard deviation of a totally random variable that indicates the uncertainty of the average.”
Only if that totally random variable is that of the sample mean.
“The quadrature addition of the individual data element uncertainties is *NOT* the average uncertainty either.”
No it isn’t, correct. The average uncertainty is the sum of the uncertainties divided by the number of elements. The quadrature addition is the uncertainty of the sum.
Now would be a good time to actually explain what you mean by the average uncertainty, and where you think I equate it with the uncertainty of the average. But I expect you’ll just through another tedious insult instead, just to convince yourself you cannot be wrong.
“You remain stuck in a statistical world which has no points of congruence with the real world most of us live in.”
And there we go. Feel better?
“t gets so confusing trying to explain anything to you because we keep switching between measurement uncertainty, and the standard deviation of the population.”
Measurement uncertainty is the *ONLY* metric of use in the real world. It’s only in your statistics world that the standard deviation of the sample means is a primary metric. The average should *never* be more precisely given than what the measurement uncertainty is – unless you are a statistician or climate scientist.
The standard deviation of the population *IS* the measurement uncertainty if you have totally multiple random measurements of the same thing under the same environment.
I’ve explained over and over and given you example after example of how to calculate uncertainty. I’m not your puppet to dance at the end of your string. Go read Taylor, Bevington, Possolo, and the GUM for meaning.
The Gum says:
u(c)^2 = Σ u(x_i)^2 if it is a linear equation. That’s really all you need to know on how to propagate uncertainty.
There is no division by n or by sqrt(n) in that equation!
Yet you, bdgwx, and AlanJ keep wanting to believe that the equation is
u(c)^2 = (Σ u(x_i)^2)/(n) ]
It isn’t. It never has been. It never will be. Learn it, live it, love it!
Eq. 10 is very appropriate for temperatures since they are all similar. The combined uncertainty for temperatures is calculated by adding all the uncertainties from the different influence quanties. Eq. 13 is only useful when you have correlated, i.e., pairs of data where a correlation determination can be developed. Temperatures are single measurements. If you want to calculate all the correlation factors for all the pairs in a monthly average, go ahead. Just be aware that you are going to increase the uncertainty. Partial differentials are only useful when you have measured parts of a measurand determined by exponents or a nonlinear function. That doesn’t apply to a measurand such as a monthly average.
The similarity of temperatures is irrelevant. All it is doing is using the general rule for propagating uncertainties, and applying it to the concept of an average. It doesn’t matter if you are averaging identical measurements or very different things. It doesn’t even require all the uncertainties to be the same.
But, as I keep trying to point out – this is only giving you the measurement uncertain for an exact average. Usually you are averaging a sample as an estimate of the population mean. In that case you are talking about the standard error of the mean, but the principle is the same.
“If you want to calculate all the correlation factors for all the pairs in a monthly average, go ahead.”
Yes, that’s auto correlation, something I think TN1900 should have considered, rather than just assuming they where all independent.
“Just be aware that you are going to increase the uncertainty.”
Yes, that’s the point. But again, this comes down to what uncertainty you are after, the measurement uncertainty or the uncertainty from sampling. Temperatures are likely to be correlated with each other – less likely the measurement uncertainties.
“Partial differentials are only useful when you have measured parts of a measurand determined by exponents or a nonlinear function.”
You could just admit you don’t know what you are talking about. It’s the partial differentials that lead to all the specific rules for propagating uncertainties or errors.
“That doesn’t apply to a measurand such as a monthly average.”
It’s truly amazing how many different methods you have to dismiss or fail to understand in order to avoid admitting that for averaging independent values, the uncertainty of the average involves dividing the standard deviation by √n.
“Temperatures are likely to be correlated with each other – less likely the measurement uncertainties.”
Temperatures are more likely correlated to time than to each other. The temperature in Topeka at 11:00AM is likely to be going up just like in Meriden, KS. That’s because of the travel of the sun across the sky, not because the temperature in Topeka determines the temperature in Meriden.
Correlation is only useful if there is a s defined relationship between the factors. Taxes and temperature both going up may show a correlation but one has nothing to do with the other.
Look up “confounding factors”.
Once again completely missing the point. You need to start reading what’s being said,m rather than just getting triggered by individual words. What I said has nothing to do with causes, it’s simply pointing out that when taking an average the uncertainty grows if there is correlation between the variables.
“ it’s simply pointing out that when taking an average the uncertainty grows if there is correlation between the variables.”
Uncertainty grows! What a concept!
It’s like arguing with a parrot.
Nor can Block Head J explain how averaging removes temperature instrumental measurement uncertainty.
Block Head G claimed somewhere above that subtracting a baseline removes uncertainty, but for this to occur the systematic uncertainty must be a constant, but this is absurd.
And neither Block Head G or J can dispute anything I wrote, so instead they just mash the red button to assuage their bruised fragile egos.
I see the trolls thought up some new nicknames. Sure beats having to make an argument.
For the record, I very rarely down vote you – only occasionally when you’ve made a particularly pointless and offensive comment. Why you care so much about it is a mystery. I’m sure I get more down votes than you – I take it as a complement.
For the record…I have never downvoted any post from your or anyone else.
You lie about other matters, should I believe this line?
“And neither Block Head G or J can dispute anything I wrote,,”
For the few and far between of your posts that are substantive and not inchoate whines, they do plenty of that. Quite effectively.
“…so instead they just mash the red button”
If they deny it, I take them at their word. Otherwise, you don’t know, I don’t know.
WUWT, change this. Show both up thumbs and Debbie Downers. And provide a hold over/drop down list for both. I know it would risk your eyeball count for ads, but it’s the right thing to do.
I refuse to attempt any education of these clowns, it is pointless and a waste of my time.
Yet somehow someone goes through the entire huge thread and carefully downvotes just about everything, without consideration of content.
You lot don’t like me, ask me if I care.
I think we guess how much you care by the number of times you whine about it.
Really, why do you care so much. Do you think anyone bases their opinion of any comment on how many people voted for or against it. Science is not a democracy. Look at my first comment, just comparing two UAH maps. 17 down votes at present. Does that mean UAH is bad, or the comparison doesn’t make sense – or is it just general hatred towards me? Does it make the comparison any less valid?
I’m sure all this block head nonsense amuses you – but I’m not sure if you think I’m J or G. Or are you referring to Jim Gorman?
In any event, I’m pretty sure we’ve been over how averaging reduces measurement uncertainty before. Like several hundred times. It’s all explained in the GUM, or in those books about error analysis.
The problem is that the explanation in those books is *NOT* what you say it is.
Averaging does *NOT* reduce uncertainty except in one specific situation which simply doesn’t apply to temperature measurements across the globe.
For instance, the GUM states that measurements should be given as “stated values +/- uncertainty”. It then goes on to state that the uncertainty of the average is related to the variance of the measurement data. It does *NOT* say that the uncertainty of the average is related to how precisely you calculate the average from only the stated values while ignoring the uncertainty of the stated values.
Yet you say exactly that: the uncertainty of the average is the standard deviation of the sample means calculated from only the stated values while ignoring the uncertainty of the stated values.
And AlanJ (and the NASA goobers) would have us believe that the magic of air temperature anomaly formation reduces instrument measurement uncertainty by at least a factor of 5.
They are both lying.
“For instance, the GUM states that measurements should be given as “stated values +/- uncertainty””
No it doesn’t. It gives a number of different ways of expressing uncertainty, and only recommends you use the ± expression for expanded uncertainty, and then you need to include details such as the coverage factor and the percentage of the confidence interval.
“It then goes on to state that the uncertainty of the average is related to the variance of the measurement data.”
Where does it state this?
“It does *NOT* say that the uncertainty of the average is related to how precisely you calculate the average from only the stated values while ignoring the uncertainty of the stated values.”
I’m not surprised it doesn’t say it, as it’s gibberish.
What it does say is that when measuring an individual input the best result is obtained by taking the average of multiple measurements, and in that case the uncertainty of the mean is the standard error of mean (sorry I mean, the experimental standard deviation of the mean). Want to guess how that is calculated?
What I am saying is that if you want to know what the exact average of multiple inputs, all with random uncertainty, you can determine the uncertainty of that exact average using equation 10. This is not ignoring the measurement uncertainty – it’s explicitly using the uncertainty of the individual measurements however they obtained.
“Yet you say exactly that: the uncertainty of the average is the standard deviation of the sample means calculated from only the stated values while ignoring the uncertainty of the stated values”
Again, you need to be clear what uncertainty you are talking about. All I’ve said is that the general formula for the uncertainty of a sample mean is given by the standard error of the mean. I’ve explained several times that you do not normally care about the measurement uncertainty of individual measurements when you do that, because a) they can be assumed to be negligible compared with the population deviation (That’s what your beloved TN1900 does), and b) measurement uncertainty is already present in the variation of the stated values. This is essentially what the GUM does in 4.2.3 when measuring a single value. Uses the variation in the individual measurements as an estimate of the uncertainty of the measurements, and uses that to determine the standard error of the mean.
But none of this mean that the process is always going to be correct. It’s an idealized theorem making many assumptions. But it’s the starting point. You need to understand how it works, before going on to look at all the times it might not work. You cannot just throw your hands up and invent some meaningless concept of the uncertainty of the mean, such as claiming it should be the same as the uncertainty of the sum, or of the standard deviation.
“No it doesn’t. It gives a number of different ways of expressing uncertainty,”
I didn’t say the GUM only had one way to express uncertainty. I said it specifies that a measurement should be given as “stated value +/- uncertainty”.
The very first paragraph in the GUM is:
“When reporting the result of a measurement of a physical quantity, it is obligatory that some quantitative indication of the quality of the result be given so that those who use it can assess its reliability. Without such
an indication, measurement results cannot be compared, either among themselves or with reference values given in a specification or standard. It is therefore necessary that there be a readily implemented, easily
understood, and generally accepted procedure for characterizing the quality of a result of a measurement, that is, for evaluating and expressing its uncertainty.”
Put down the whiskey bottle, it’s fogging up your ability to read!
Actually NIST is proceeding to using an interval only. This removes the reference to a center value in the interval which is too often taken as the “true value”. In essence, there is no true value only an interval where the measurement may lay. If a distribution is normal, one can use a plus/minus value, otherwise many intervals are asymmetric.
Makes sense.
“Where does it state this?”
How many times does this have to be provided to you? I’m getting tired of dancing at the end of your puppet strings.
How about right at the start of the GUM?
Section 0.7:
“2) The components in category A are characterized by the estimated variances si^2 , (or the estimated “standard deviations” si ) and the number of degrees of freedom vi. Where appropriate, the
covariances should be given.
3) The components in category B should be characterized by quantities u^2, which may be considered as approximations to the corresponding variances, the existence of which is assumed. The quantities u^2 may be treated like variances and the quantities uj like standard deviations. Where appropriate, the covariances should be treated in a similar way.”
It should be obvious by now to everyone that you have NEVER, NOT ONCE, actually studied anything associated with the study of uncertainty. All you EVER do is cherry pick and never bother to actually study anything. You can’t even be bothered to read the first two pages of the GUM! The very first two pages of the Introduction!
“How about right at the start of the GUM?”
Which doesn’t say what you claimed – “It then goes on to state that the uncertainty of the average is related to the variance of the measurement data.”
Neither of those quotes mentions the average You are still confusing the uncertainty of the average with the uncertainty of a single measurement.
You *simply can’t read, can you?
What does “estimated variances si^2 ” mean to you? It’s talking about UNCERTAINTY! What uncertainty do you *think* it is talking about if it isn’t the uncertainty of the average? The very first sentence says “When reporting the result of a measurement of a physical quantity”
I’m tired of dancing at the end of your parrot string. I’ve got jewelry to finish and deliver before Christmas.
I’m tired of being your reading teacher as well. Go READ the GUM from end to end. Stop your cherry picking. It never turns out like you hope!
“What does “estimated variances si^2 ” mean to you?”
It means it’s an estimate of the variance of a component s_i. Do you need any more help? It seems fairly straightforward.
“What uncertainty do you *think* it is talking about if it isn’t the uncertainty of the average?”
Why do you think there’s an average involved? It’s talking about a component in a function. This might be a single measurement, or it might be a better estimate based on an average of many measurements. The variance relates to the component. If it’s a single measurement you use the estimated variance for the measurement, if it’s an average you use the experimental standard deviation of the mean.
“Go READ the GUM from end to end. Stop your cherry picking. It never turns out like you hope!”
Says someone who’s just plucked a single section from the introduction and pretended it’s talking about the variance of the population being the uncertainty of the mean. Go read 4.2.3 if you don’t want to keep wasting your time. Or you could just stop writing hundreds of comments long after most people have gone home.
“Why do you think there’s an average involved?”
Simply unfreakingbelievable!
What statistical descriptor are you finding for a set of temperature data if it isn’t the average?
“This might be a single measurement”
How does a single measurement generate a distribution that can be analyzed statistically?
“average of many measurements”
Here we go again with the cognitive dissonance!
“Why do you think there is an average involved?” vs “average of many measurements”
The very definition of cognitive dissonance.
“The variance relates to the component”
How does a single value create a distribution?
“If it’s a single measurement you use the estimated variance for the measurement”
Again, how does a single measurement create a variance?
“pretended it’s talking about the variance of the population being the uncertainty of the mean”
no pretending, merely reading what the GUM says!
If you have a population then you have more than one element, otherwise you don’t have a population!
What are the common statistical descriptors for a population of elements?
PUT DOWN THE BOTTLE!
“What statistical descriptor are you finding for a set of temperature data if it isn’t the average?”
Who said anything about temperatures. You really need to focus on what’s being said.
You claimed that the GUM insisted that the correct uncertainty of an average was the population standard deviation. Then you claimed the introduction said this when it said the uncertainty in a component is characterized by the estimated variances si^2. Somehow you interpret this as meaning the component is a mean, but the relevant variance is that of the population. None of this is correct or justified by this introductory passage. All it says about uncertainty is
If you are doing a type A estimate, you take several measurements and estimate the standard deviation from that. This gives you the uncertainty of a single measurement. (GUM 4.2.2). If you use the mean as the best estimate of the component, you divide this by root n to get the experimental standard deviation of the mean which is the uncertainty of the mean. (GUM 4.2.3).
The standard error of the mean is only designed to measure sampling error. It doesn’t address the uncertainty in the data of each sample.
In other words, the data has no uncertainty therefore, the sample means have no uncertainty and the only uncertainty is from the variance of sample means distribution. How wrong that is.
An example is marking the edges of a 5’x3′ table into 2″ squares and measuring each square. That is determining the property of a material. If only one square is measured 10 times, that is the property of a given specimen. It is very much like a monthly average temperature. An average of the temps and the standard uncertainty of the data (the property of the measurand, added to the variance of repeated measurements on a single sample, i.e., the half-width error of a single reading.
Notice what the section finishes with, you must add the component ov variance arising from differences among the samples (σ²) to the variance of repeated observations from the single sample.
This is an important point that is never addressed. I don’t bring it up because it only complicates the issue. What does it mean? It means the uncertainty of individual samples, lets say ±0.5° F for each measurement should be added to the variance in all the samples.
TN 1900 gets around this by saying that measurement uncertainty is negligible and only uses the variance in the samples for the uncertainty. If done this way, measurement uncertainty in TN 1900 would be
(4.1 + 0.5)° C = 4.6° C. 4.6/√22 = 0.98 ● 2.08 = 2.04° C.
Golly gee, what did NIST say about another uncertainty method?
That procedure gave 25.6 – 23.6 = 2.0° C.
Amazing, just simply amazing!
Judging by the red minus sign added by whichever trendologist to this post, they/it must believe that u(T) = ±2°C as calculated by NIST is incorrect.
And judging by the lack of any refutation of NIST’s calculations, I can only sit back and laugh in their/its general direction.
I have studied the heck out of this. NIST does use procedures outlined in the GUM but make assumptions that eliminates some confounding variables in order to make the example more clear. Assuming a Student’s T distribution and negligible measurement uncertainty are two.
That doesn’t make the example incorrect, just not complete.
It is funny that none of the naysayers have shown any actual calculation of how they would find uncertainty. Dealing in abstract mathematics frees you from doing the actual work.
NIST has provided 22 days of work of temperatures. They have shown a very basic way of finding the uncertainty interval for the average Tmax. Too bad bellman, allenj, or bdgwx can’t show any of their math using real numbers.
GUM F.1.1.2 makes it very plain that part of the uncertainty is the “component of variance arising from possible differences among samples”.
Let’s make it clear, one can choose to use the actual experimental standard uncertainty or an expanded experimental standard uncertainty of the mean. The most important conclusion is that this interval is so large that decimal places out the millikelvin is NOT SCIENTIFIC by any stretch of the imagination.
What is going to blow peoples minds is a paper on what happens to baseline averages of monthly values each with a ±2.0C uncertainty. Makes Pat Frank look prescient.
The amount of variance that accumulates from averaging step in UAH calculation is enormous, orders of magnitude larger than 10 or 20 mK.
When I tried to point this out, they just pushed the down-vote button and ignored the harsh reality.
As far as I can tell their single purpose in performing this clown-car show month-after-month is to keep the absurd milli-Kelvin uncertainty claims for GAT alive.
“Too bad bellman, allenj, or bdgwx can’t show any of their math using real numbers.”
I’ve told you before I don’t disagree with the way TN1900 does it. It’s just same as my most simplistic method, take the SEM of the data, and use a student-t distribution for the confidence interval. I might however question assumptions of independence, and I also think they should consider the fact that May is a warming month – the data are not going to be iid.
But, what you also need to understand is that the question of uncertainty depends on what you are asking – what do you mean by the average, and the uncertainty of the average?
“The most important conclusion is that this interval is so large that decimal places out the millikelvin is NOT SCIENTIFIC by any stretch of the imagination.”
But you are only talking about one station for one month for one type of measurement, and then only having 2/3 of the data.
“But, what you also need to understand is that the question of uncertainty depends on what you are asking – what do you mean by the average, and the uncertainty of the average?”
No one in the real world worries about how precisely they have calculated the one, single value known as the population average. What they care about is the possible values that population average can take on.
The possible values that the population average can take on is based on the uncertainty of the individual elements in the population and not on how precisely you can calculate the population average using only the stated values of the individual elements while ignoring the uncertainty of the individual elements.
In climate science it all goes back to the meme that measurement uncertainty is always random, Gaussian, and cancels. Thus the uncertainty of the individual measurements never has to be considered. Just throw them away and assume the stated values are 100% accurate. Then calculate how precisely those stated values determine a single value average.
Do you suppose the root cause committee looking at the failure of the or-ring on the Challenger shuttle was looking at how precisely the average size of the o-ring was calculated or at what values that population average could take on? .e. the propagated uncertainties from the individual o-ring measurements taken across the manufacturing run of the o-rings?
You keep on wanting to put forth how precisely you calculate the population average as the most important factor in the real world most of us live in. The truth is that real people designing real things don’t care. The uncertainty interval propagated from the individual elements of the population better have that precisely calculated SEM somewhere in it – otherwise you sampling procedure was worthless.
If I am designing fish plates to connect beams in a bridge I don’t care how precisely the average length of the beams is calculated, I want to know the minimum and maximum lengths I need to consider in the design. That minimum and maximum length is associated with the uncertainty of the population average as propagated from the individual elements and not from the SEM.
“TN 1900 gets around this by saying that measurement uncertainty is negligible and only uses the variance in the samples for the uncertainty. If done this way, measurement uncertainty in TN 1900 would be
(4.1 + 0.5)° C = 4.6° C. 4.6/√22 = 0.98 ● 2.08 = 2.04° C.”
Assuming measurement error is independent of temperature, you should be adding it in quadrature.
sqrt(4.1^2 + 0.5^2)° C = 4.13° C. 4.13/√22 = 0.881 ● 2.08 = 1.80° C
But as I keep saying this is double book keeping – the variance given by measurement uncertainty should already be part of the variance of the data.
This seems to be where a lot of the (progressively more heated) disagreement comes from.
The variance comes from the recorded values, which don’t appear to be recorded as “stated value +/- measurement uncertainty”.
That’s the dispersion of the underlying phenomenon.
Then there is the measurement uncertainty, which is independent of the data variability.
These need to be combined.
In theory, the data variability and sampling uncertainty overwhelm the measurement uncertainty, but given the small “anomaly” values involved, this may not be the case.
A courageous decision, Minister.
Yes this is pretty much what NIST does in TN 1900. They just made the assumption measurement uncertainty was negligible.
Anomalies are a different issue. They are two random variables being subtracted. The monthly random variable has a mean of μ_month / variance u_month. The baseline random variable has a mean of μ_baseline and variance u_baseline.
You must treat these as random variables and not just simple 100% accurate numbers you can subtract.
Finding the variance of numbers that are orders of magnitude smaller than the means/uncertainty of the random variables used to calculate them. That is just saying, “Let’s just throw away the uncertainty of the numbers being subtracted.
That’s certainly the case when comparing the two periods.
I don’t think it’s the case for the site anomaly offset, though. That needs to be treated as a constant to allow repeated conversion between the frames of reference.
For a station with a baseline temperature for March of 293.25K and sd of sK, converting the base period to degrees C, then to degrees anomaly then back to Kelvin, you should get the initial value of 293.25K and an sd of sK. The variance should transfer as is, whatever the zero point.
The point when subtracting the means of two random variables you have for the mean:
μ_anomaly = μ_month – μ_baseline.
For the uncertainty;
(u_anomaly)² = (u_month)² + (u_baseline)²
What happens when the “month” is the baseline period?
Convert from the actual temperature for the baseline to anomaly and back 10 times.
The anomaly value is just an offset, so must be regarded as a constant to allow switching between systems. Celsius and Kelvin allow this.
The transformation between Celsius and Fahrenheit or Kelvin and Rankin may introduce error because they involve multiplication.
This is quite so for the difference between the periods.
(u_difference)² = (u_month)² + (u_baseline)²
which expands to
(u_month – u_baseline)² = (u_month)² + (u_baseline)²
I stuffed that up, sorry. That should be “The
anomalybaseline value is just an offset”Sorry, that isn’t correct. The baseline is a random variable with ~30 values. Each of those 30 values is a monthly average with an uncertainty that can’t be simply ignored. The baseline random variable has both a mean and a variance.
The baseline is not a simple 100% accurate number.
It’s worse than that. The baseline is an average of 30 monthly averages of minimum and maximum readings with measurement uncertainties, and is very unlikely to have used the same instrument year on year. Each of those monthly averages has a variance, and the average of those 30 monthly averages has its own variance.
However, to allow reversible conversion between Celsius and “anomaly”, the offset must be treated as a constant.
I don’t understand—why does it need to be reversible? Checking the work of someone else might be a reason, but unless they write the numbers down the info is lost.
In the case of the UAH, the monthly temperatures for each grid cell are calculated in K and recorded to five digits (0.01K resolution), but they don’t give any justification that the uncertainty is this small. Nor do the report how many satellite samplings were averaged at each, and the variance is ignored.
Final temperatures for each grid are recorded as delta-Ts, not absolute T.
They keep a file that contains the 20-year baseline that is used to calculate the monthly anomaly numbers. What is a bit odd is that this file is not a constant—instead it is recalculated each month, even thought the baseline period doesn’t change.
If you download the baseline file each month and compare them, it will show that the fifth digit can change by 0.01K. As all the numbers are apparently processed using a FORTRAN program, I suspect these changes are likely computer round-off errors.
The bottom line is that the UAH baseline is not a constant.
Switching between K, C and “anomaly” should be able to work in any direction, any number of times with no change in uncertainty..
In fact, converting to “anomaly” and back and comparing the values should be one of the basic checks.
I’m not touching that with a 40′ pole.
For the terrestrial data sets, temperatures are recorded in Celsius (I think even the US does this now) and converted to “anomaly”. Converting back to Celsius should give exactly the same value and uncertainty as recorded.
Anything recorded in Fahrenheit should really have anomalies using Fahrenheit degrees, because the F -> C conversion almost always adds uncertainty. What are the odds that is factored in?
Once you have “anomaly” you have lost the data required to convert it back. No reversing allowed.
The temp anomaly in Point Barrow AK can be the exact same anomaly at the same point in time as in Oklahoma City. How do you convert that anomaly into different things? And it is those “different things” that actually determine climate, not the anomaly.
You can convert the anomaly between scales but you can’t reverse it back to the original values – those are gone forever.
That’s the whole problem with the daily “average” temperature. It’s actually a median value from a non-Gaussian temperature profile. Different non-Gaussian temperature profiles can have the same median value while having different climates (e.g. Las Vegas and Miami). So what does the median value tell you about climate?
One would hope you recorded the offset 🙂
You can if you have the offset.
That’s one of the problems with a daily “average”. There are plenty to go around. Daily maximum and minimum are slightly better..
“You can if you have the offset.”
Only if that offset is infinitely precise. Anything else, including rounding makes it impossible.
which a constant is.
Thank you for making my point for me.
But it is neither a constant nor infinitely precise. It is a random variable made up of one month monthly average in each of 30 years. Each of the data points in the baseline random variable consists of a mean xi and an uncertainty of u_i of another random variable.
You have
X1 = x1 ± u_1
…
X30 = x30 ± u_30
Yes, the average for the base period does have measurement uncertainty derived from the individual measurements used to calculate the average, as well as variance resulting from differences between the daily/monthly averages.
They certainly (pun not intended) need to be taken into account when comparing periods.
The average for the baseline period is still μ_baseline +/- u_baseline
However, there are a couple of lines of reasoning for treating the anomaly offset as a constant which happens to equal μ_baseline.
1/ This is required for reversibility. Otherwise, the uncertainty increases every time the temperature is converted between K, C and “anomaly”.
2/ The uncertainty for the baseline period must still be u_baseline, and the anomaly for the baseline must be 0 +/- u_baseline.
It really boils down to not unnecessarily increasing uncertainty.
There are a number of questions around the calculation and use of baselines, particularly with stations being added or removed over time, which is a separate minefield.
That would explain it.
Even if the conversion factor is exact, it introduces uncertainty of its own because it can’t adjust for the precision limits of the measuring device.
If the conversion factor is 1.0001 but your instruments can only detect changes in the tenths digit then the precision of the conversion factor is useless. I think Pat Frank went into this in his paper on the uncertainty of a thermometer.
You really converting between Celsius and “anomaly”, you are converting between scales. Do the conversion of scales before you do anything else. Then you don’t have to worry about “reversebility”.
If poorly done, it can introduce spurious precision.
Yes, that’s a good example of doing it poorly.
In practice, you probably don’t need to reverse the conversion very often, but the ability needs to exist.
It’s all well and good to know the anomaly for Alice Springs and Las Vegas, but what if we want to know the temperatures?
“It’s all well and good to know the anomaly for Alice Springs and Las Vegas, but what if we want to know the temperatures?”
You can’t get there from the anomaly by itself.
Of course not. You have to have each of their offsets.
Yet the baseline is itself is the result of measurement, and therefore has uncertainty.
I appreciate that, but using the actual baseline value with uncertainty doesn’t allow reversibility.
All I’m trying to say is that the offset value for any given site is necessarily regarded as a constant to allow converting between Kelvin, Celsius and “anomaly” in an arbitrary direction an arbitrary number of times.
The measurement includes uncertainty, and is in (usually) C.
Converting this from C (or K) to “anomaly” involves subtracting a semi-arbitrary offset (which can’t include uncertainty).
Converting from “anomaly” (which includes the same uncertainty) to C or K involves adding back the offset.
For reversibility to hold, the end result of the 2 operations (subtraction followed by addition) must give the original stated value and the original uncertainty.
I think part of the problem is overloaded terms, so I’m trying to work out how to word this better.
Here goes.
The baseline is an average of averages of a measurement, but let’s call it an average.
B = μ_baseline + u_baseline (in degrees C)
M = μ_month + u_month (in degrees C)
Subtracting B from M to give an anomaly gives
u_anomaly = sqrt ((u_month)² + (u_baseline)²),
so
A = M – B = (μ_month – μ_baseline) + sqrt ((u_month)² + (u_baseline)²) (in degrees anomaly)
Adding the baseline to go back to degrees C gives
u_celsius = sqrt (sqrt ((u_anomaly)² + (u_baseline)²)),
so
C = A + B = ((μ_month + μ_baseline) + sqrt ((u_anomaly)² + (u_baseline)²) (in degrees C)
which expands to
C = (μ_month – μ_baseline + μ_baseline) + sqrt (sqrt ((u_month)² + (u_baseline)²)² + (u_baseline)²)
or
C = μ_month + sqrt (sqrt ((u_month)² + (u_baseline)²)² + (u_baseline)²)
This violates the conditions for reversibility.
So, for converting between Celsius and “anomaly” bidirectionally, we actually need a constant offset:
O = μ_baseline.
u_offset = 0 (by definition)
For the above conversions, this gives:
Subtracting O from M to give an anomaly gives
u_anomaly = sqrt ((u_month)² + 0),
so
A = M – O = (μ_month – μ_baseline) + sqrt ((u_month)² + 0) (in degrees anomaly)
Adding the baseline to go back to degrees C gives
u_celsius = sqrt ((u_anomaly)² + 0),
so
C = M + O = ((μ_month – μ_baseline) + μ_baseline) + sqrt ((u_anomaly)² + 0) (in degrees C)
which gives
C = (μ_month – μ_baseline + μ_baseline) + sqrt ((u_month)²)
which simplifies to
C = μ_month + u_month
and finally
C = M
There are sure to be typos, cut and paste errors, etc in the above, but I hope the intent is somewhat clear.
It’s clear enough. I think the issue is that the offset to convert from C to K or K to F (or whatever) is a constant while the uncertainty of the values is an interval and not a constant.
If the anomaly is M – B then the anomaly can range from (M + u(M)) – (B- u(B)) to (M-u(B)) – (B+ u(B)).
The way to fix reversibility is to convert the value for the month FIRST and then calculate the anomaly. Convert the temps that are averaged for the baseline to the units you want FIRST and then find the baseline average.
The only “fog” you add when doing it this way is the precision used in the conversion factors.
That’s the crux of it, although the multiplication step when converting from C to K (or vice versa) can increase the uncertainty or introduce spurious precision. Did you ever wonder why body temperature was given as 98.6 degrees F?
They’re already C or K (same step size, different zero).
Conversion between K and C is reversible because the offset is defined as a constant.
That’s why the “anomaly” offset needs to be treated as a constant as well.
The baseline average will be
μ_baseline + u_baseline
Converting to an anomaly, it becomes
0[.<your preferred number of 0s>] + u_baseline.
Converting back, it becomes
μ_baseline + u_baseline
i.e. it’s reversible.
D’oh! C to F.
And I proofread it twice 🙁
Let’s see if we can clear this up.
Mμ = μ_month Mu = u_month
Bμ = μ_baseline Bμ = u_baseline
Aμ = Mμ – Bμ Au = √(Mu² + Bu²)
Final answer –> Aμ ±Au
To reverse
Mμ = Aμ + Bμ and Mu = √(Au²-Bu²)
Converting these back and forth between temperature scales is not easy. The only correct way is to begin with Kelvin.
Since anomaly uncertainties are intervals, you need to use one of the web sites that feature interval calculation between the different scales.
Or, do as I do and simply do the conversions of temperatures before you even start.
My old eyes let me screw up.
This –> Bμ = μ_baseline Bμ = u_baseline
Should be –> Bμ = μ_baseline Bu = u_baseline
Did you really just do that?
Jeez! That what I get for using my phone.
Yes, it should be
Mu = √(Au² + Bu²)
I think there is a problem here:
A = M – B = (μ_month – μ_baseline) + sqrt ((u_month)² + (u_baseline)²) (in degrees anomaly)
This really should be ±sqrt() as the uncertainty is an interval.
That’s a fair point.
Which is why a trend line of anomalies is uncertain as well. The anomalies are uncertain and should be stated as anomaly +/- uncertainty.
The trends of the +’s and -‘s need to be considered when forming a trend line.
Yep, and there is a fairly simply way of doing so, which the Block Heads haven’t figured out for themselves yet.
But it makes those milli-Kelvin larger, so they would avoid it like a dead cow on the highway.
Yep, and there is a fairly simply way of doing so, which the Block Heads haven’t figured out for themselves yet.
But it makes those milli-Kelvin u(T) larger, so they would avoid it like a dead cow on the highway.
“The variance comes from the recorded values, which don’t appear to be recorded as “stated value +/- measurement uncertainty”.”
My point is that any stated value, is the stated value of a measurement. It can be modeled as SV = TV + E, where SV is the stated value, TV is the true value, and E is the error from the measurement.
If you take a sample of measurements of different things and work out the variance from the stated values, you are not getting the true variance, you are getting the variance of the true values along with the variance of the errors. This means the variance from the stated values will be larger than the true variance, and the extent to which it is larger determined by the variance of the errors – that is the measurement uncertainty.
“My point is that any stated value, is the stated value of a measurement. It can be modeled as SV = TV + E, where SV is the stated value, TV is the true value, and E is the error from the measurement.”
Where does the TV come from? The stated value is not the TV. If you don’t know the TV then you don’t know E either!
“This means the variance from the stated values will be larger than the true variance, and the extent to which it is larger determined by the variance of the errors – that is the measurement uncertainty.”
You don’t *know* the variance of the errors since you don’t know TV!
You are still living in statistical world and not in the real world. *YOU* assume you know the TV when in the real world you don’t. TV ≠ SV.
E is an interval, not a value. It is uncertainty and not error. You keep assuming that uncertainty is error. You’ve been told over and over ad infinitum that uncertainty is not error yet you continue to assume that it is. It’s because you live in statistical world and not the real world.
SV is just SV. It’s what the instrument says. You write the measurement as SV +/- u. “u” is not error, it is uncertainty. It is an interval laying out the possible values that SV is assumed to be able to take on.
As JimG has posted on here at least twice and which you have ignored, some more progressive researchers have even moved away from using SV +/- u to just stating the interval. Instead of writing the measurement as 5 +/- 1 they just use 4 to 6. The use of SV +/- u implies to many people a symmetric uncertainty interval around a middle value when the actual situation may be an asymmetric uncertainty around something other than the middle value.
The upshot is that YOU DON’T KNOW WHAT YOU DON’T KNOW. It’s all part of the GREAT UNKNOWN. *YOU* want the crystal ball to be perfectly clear when in the real world we live in that crystal ball is pretty darn foggy!
He’s just making this stuff up as he goes! And again demonstrating his complete lack of understanding of the subject.
Also, if they were to acknowledge that TV and E are unknowable, they would also have to acknowledge that data “adjustments” are invalid and fraudulent.
Ain’t gonna happen.
You NAILED it!
“If you don’t know the TV then you don’t know E either!”
And yet again. Know you do not know what TV or E is – that’s why they are uncertain. If you knew the value and the error there would be zero uncertainty.
“You don’t *know* the variance of the errors since you don’t know TV!”
The beauty of this is you don’t need to know it.
Consider them as random variables:
var(SV) = var(TV) + var(E)
As long as you know var(SV) you know what the combined values of the population variance and the measurement uncertainty is. If you knew or can estimate what the measurement uncertainty is you could subtract it from var(SV), but without that you still kn ow that var(SV) is an upper limit on var(TV).
My point, which you will continue to ignore is that if instead you start with var(SV) then say you need to add the measurement uncertainty, then you get
var(?) = var(SV) + var(E) = var(TV) + 2var(E).
Whatever var(?) is, it’s a worse estimate for var(TV), than just var(SV). As I said, you are double counting the uncertainty.
“You are still living in statistical world”
Thanks. I’d take that as being better than living in make it up to get the results you want world.
“E is an interval, not a value.”
No. E is an error. The variance of the error can describe an interval, the uncertainty can be described as an interval – but errors are just single values. I don’t kn ow if anyone has explained this to you, but uncertainty is not error.
“The beauty of this is you don’t need to know it.”
Therein lies the bias of a statistician that assumes everything is Gaussian, random, and cancels.
First you can only use this equation of you assume the distribution is Gaussian or Students T.
Second, the SV are the values of the data. This lets you calculate the stand
First you can only use this equation of you assume the distribution is Gaussian or Students T.
Second, the SV are the values of the data. SV is not the some kind of answer for the measurand. This lets you calculate the standard deviation using the SV’s.
For example:
Temp data –> 20, 23, 24, 25, 32
τ = 24.8
SV1 = t1 = 24.8 – 4.8
SV2 = t2 = 24.8- 1.8
SV3 = t3 = 24.8 + 0
SV4 = t4 = 24.8 + 0.2
SV5 = t5 = 24.8 + 7.2
In essence, the E values define the standard deviation surrounding τ.
That is why NIST used the standard deviation by assuming a Gaussian distribution.
I’ve already shown you how TN 1900 shows using the SD as the standard uncertainty. NIST decided to use an expanded standard deviation of the mean in this example. That is certainly their decision to make.
“First you can only use this equation of you assume the distribution is Gaussian or Students T.”
Any evidence for that claim?
I don’t want to just say you are wrong, but everything I’ve read and my own random experiments suggests you are. This answer has a clear explanation of why variances add, which makes no assumption of normality – just independence.
https://math.stackexchange.com/questions/4664736/why-do-variances-add-when-summing-independent-random-variables
“In essence, the E values define the standard deviation surrounding τ.”
You are confusing two things here. My E was the measurement error, not the error of the value from the mean. You could think of each stated value as having two errors. SV = τ + E1 + E2, where E1 is the difference between the mean and the true value, and E2 is the error added to the true value by the instrument error.
“NIST decided to use an expanded standard deviation of the mean in this example. That is certainly their decision to make.”
Why do you keep obsessing over the expanded uncertainty. It’s got nothing to do with the case.
“My E was the measurement error, not the error of the value from the mean.”
What will you do when the rest of the world moves to quoting just the possible measurement interval instead of the “stated value +/- uncertainty”?
You don’t *KNOW* the measurement error. You assume you know the true value and can, therefore, find an error value.
UNCERTAINTY IS NOT ERROR!
Get that tatooed on the back of you writing hand. Learn it, love it, live it.
“What will you do when the rest of the world moves to quoting just the possible measurement interval instead of the “stated value +/- uncertainty”?”
Again, the + E is not an interval. It’s adding an error. Hence it’s +, not ±.
“You don’t *KNOW* the measurement error.”
Again. I know I don’t know it. I just know there is an error.
“You assume you know the true value and can, therefore, find an error value.”
No.
True, despite you writing it in bold and and capitals. Do you really think anyone is impressed by all this angry shouting.
“Get that tatooed on the back of you writing hand. Learn it, love it, live it.”
Will you ever realize that I’m telling you the E in the equation is error not uncertainty?
Your equation is SV = TV + E
That means TV = SV – E
If E is always positive then TV must be at the very bottom of the uncertainty interval and SV must start at the top of the interval.
That makes no sense.
In fact it has to be SV = TV +/- E where E would move the stated value from the bottom of the interval to the top of the interval. It would also mean that the average has to be TV.
THAT IS ONLY HAPPENS IN ONE SPECIFIC CASE. When you have one measurand, multiple measurements with the same device, and all measurements made under the same environment.
That is never the case with temperature where different measurands, different devices, and different environments are involved.
As usual, you are trying to lead everyone down the primrose path in statistical world where all uncertainty is random with no systematic uncertainty, Gaussian, and all the uncertainty cancels.
“If E is always positive then”
It isn’t. Unless you have a bad systematic error. How many more times, E is not an uncertainty interval, it’s an error term. Error is not uncertainty.
E is not AN error trem, it is the only error term. If you would read the background you would see this works when the distribution is Gaussian.
TN 1900, Note 4.3
If the assumption is not Gaussian, see the previous Wikipedia table to see how the variance is calculated. TN 1900 assumes Gaussian. If you think another distribution should be used, show us how you would change the example.
You keep making straw men. Stop it. Pony up and show some calculations with real numbers and your assumptions.
Look at this Wikipedia page. It has a good table that I have put in here as an image. This doesn’t even cover skewed distributions that don’t fit any of these standard distributions.
Can you even add some of these variances directly? I haven’t done the math myself. Maybe some statistics guru can answer the question.
Look at the GUM equations for standard uncertiamty and you’ll see they are all based on normal distributions.
Here is what you said.
This is the observation equation that TN 1900 used. The “ε” represented:
If Ei denotes the combined result of such effects, then ti = r +Ei where Ei denotes a random variable with mean 0, for i =1, …,m, where m = 22 denotes the number of days in which the thermometer was read. This so-called measurement error model (Freedman et al., 2007) may be specialized further by assuming that E1, …, Em are modeled independent random m variables with the same Gaussian distribution with mean 0 and standard deviation σ. In these circumstances, the {ti} will be like a sample from a Gaussian distribution with mean r and standard deviation σ (both unknown).
Please not that E1, …, Em each have different σ values because they are different distances from the mean based upon a Gaussian distribution assumption.
TN 1900 goes on to say that:
I put all this in here to show that your assumptions of the values of E1 and E2 need to be shown in numbers. These are different assumptions than TN 1900 makes. You must show how your equations work to provide a numerical answer to measurement uncertainty in the monthly average using real numbers based on the temperatures in TN 1900 Ex. 2.
“Look at this Wikipedia page.”
I think this is the page.
https://en.wikipedia.org/wiki/Variance
From that page they state the general rule that variances add when adding random variables. Nothing about this only working with normal distributions.
Forgot the screen shot.
You don’t know what you are talking about. Look at the normal distribution, the variance is σ². You can do a straight forward addition. But look at some of the others.
binomial –> (np(1-p)). Do you think you can do a straight addition with term of various sizes?
How about uniform –> [(b – a)² / 12]. Will variances with different “a” and “b” values add directly?
How about skewed distributions or those with asymmetric intervals? How do you address combining skewed distributions?
Read this site at Wikipedia.
Cumulant – Wikipedia
“You don’t know what you are talking about”
Not entirely. That’s why I’m asking if you have any evidence for your claim.
Nothing you go on to say is evidence that variances of non-normal distributions don’t add. You are engaging in the argument from personal incredulity.
I think what may keep confusing this argument is that whilst it is true that var(X + Y) = var(X) + var(Y) is correct for all distributions, not just normal ones, it is the case that the sum of two normal random variables will be normal, which isn’t the case with the sum of two non-normal variables.
This is the reason why so many texts assume the variables are normal. It’s not that the standard deviation of the sum will be wrong. But you can’t use that to easily calculate a confidence interval.
This is why the CLT is important. When adding multiple variables the resulting distribution will tend to a normal one as the number of variables increases, regardless of the individual distributions.
For the umpteenth time. The average and standard deviation of an asymmetric (i.e. non-Gaussian) distribution is, for all practical purposes, meaningless.
The CLT only applies to the standard deviation of the sample means. It is only a metric for how precisely you have located the population mean. IT TELLS YOU NOTHING ABOUT THE ACCURACY OF THAT MEAN unless you have one specific situation – multiple measurements of the same thing using the same device under repeatability conditions.
Field temperature measurements meet NONE of the restrictions, NOT A SINGLE ONE.
Just assuming a normal distribution when it comes to field temperature measurements is committing scientific fraud. Yet climate science gets away with it every single minute of every single day. And you continue to try and justify that fraud.
This clown is so dense about uncertainty that he thinks a given problem is solved with either a Type A or a Type B analysis. He doesn’t realize that it can (and usually is) both.
You are cherry picking again without considering the context.
If you look at their definition of “expected value” throughout the entire page it is based on a GAUSSIAN curve!
If you have skewed distributions, i.e. with kurtosis, then you can’t do a simple addition of the variances. It’s far more complicated than that! You have to combine the kurtosis of each to get a combined total kurtosis. Not a simple formula.
“If you look at their definition of “expected value” throughout the entire page it is based on a GAUSSIAN curve!”
Could you actually quote the part where that is explained? Because to me it looks like you are just willfully misunderstanding things again, rather than accept the possibility that you are wrong.
Here’s the definition of variance:
No mention of only for normal distributions there.
“If you have skewed distributions, i.e. with kurtosis,”
Kurtosis and skew are not the same thing.
“You have to combine the kurtosis of each to get a combined total kurtosis.”
We are not talking about finding the combined kutosis, just the variance.
If your distribution is skewed it probably has kurtosis of some measure. You simply cannot ignore this. It’s why I gave you the quite from an accepted textbook on statistics stating that for skewed distributions the mean is pretty much useless as a statistical descriptor.
Yet climate science, AND YOU, continue to make the unstated assumption that all temperature data is random ad Gaussian so you can assume that all measurement error cancels and you can use the standard error of the mean for the uncertainty of the average.
You live in a statistical world where you can assume anything you want and argue it without actually stating the assumptions you’ve made.
That simply doesn’t cut it in the real world.
And climate science is so far from being real world that you can barely see them way out there on the horizon.
You mean you can’t just grab a formula from the GUM and plus stuff into it?
That they actually have to understand a problem from top to bottom?
This is asking a lot.
I am glad that is the case. It means when anomalies are calculated, the variances add regardless of their distribution. That’s even better than limiting it to normal distributions.
“But as I keep saying this is double book keeping – the variance given by measurement uncertainty should already be part of the variance of the data.”
No! The variance is typically figured using the stated values of the measurements, like you do when fitting a trend line. The uncertainty in the range, i.e. the min and max values, get expanded or contracted depending on the uncertainty in the min/max values. If the range expands, e.g. from min – u(min) to max + u(max) then the variance increases. And on through the other combinations. If you have a skewed distribution because of asymmetric uncertainty the variance doesn’t even really apply as a valid statistical descriptor.
“Who said anything about temperatures. You really need to focus on what’s being said.”
This entire forum is about climate, its factors, and related issues.
“You claimed that the GUM insisted that the correct uncertainty of an average was the population standard deviation. Then you claimed the introduction said this when it said the uncertainty in a component is characterized by the estimated variances si^2.”
Unfreakingbelievable. As if variance and standard deviation aren’t related!
“Somehow you interpret this as meaning the component is a mean, but the relevant variance is that of the population.f”
You can’t describe a distribution using only the average or only the variance. You HAVE to have both. And even then the average and variance is really only a good statistical descriptor of a Gaussian distribution. No one on here has yet to prove that the daily, monthly, or annual average temperature is being taken from a Gaussian distribution or is even a Gaussian distribution on its own!
“If you are doing a type A estimate, you take several measurements and estimate the standard deviation from that. This gives you the uncertainty of a single measurement.”
Your cognitive dissonance is on display again!
“several measurements” and “single measurement” are somehow the same thing in your mind?
That “single measurement” you are speaking of is probably the mean. The mean is not a measurement. It is a statistical descriptor of a distribution, IT IS NOT A MEASUREMENT!
“If you use the mean as the best estimate of the component, you divide this by root n to get the experimental standard deviation of the mean which is the uncertainty of the mean.”
ONE MORE TIME. Your uncertainty of the mean IS NOT A METRIC OF THE ACCURACY OF THE MEAN. It is the accuracy of the mean that is important in the real world, not how many digits your calculator can handle in calculating a mean from inaccurate data.
Your “uncertainty of the mean” should have no more significant digits than the metric for the accuracy of the mean – i.e. the measurement uncertainty of the mean as propagated from the elements forming the mean.
Adding more and more measurements in order to calculate a more precise mean IS ONLY FOOLING YOURSELF. It is a phantom of the statistical world you live in. Once you have calculated the mean to a precision equal to the measurement uncertainty of the mean there is absolutely no purpose in the real world for going any further. All you do is GROW the measurement uncertainty of the mean unless you meet the requirements of “same device, multiple measurements, same measurand, and same environment”. Requirements that the GAT can never meet and will never meet, it’s a physical impossibility.
The easiest person in the world to fool is yourself. And you are doing a bang-up job of it!
Yes its true, bellcurvewhinerman cannot read.
“Unfreakingbelievable. As if variance and standard deviation aren’t related!”
Calm down. Of course variance and standard deviation are related. What I said was
You know that’s what I said as you copied it verbatim. The distinction is still that you are claiming that the uncertainty of the average is the population standard deviation, and not by the experimental standard deviation of the mean / standard error of the mean. My point is that what you quoted does not support your claim. The quote just says the uncertainty in a component is characterized by it’s estimated variance or standard deviation.
“That “single measurement” you are speaking of is probably the mean. The mean is not a measurement. It is a statistical descriptor of a distribution, IT IS NOT A MEASUREMENT!”
Stop shouting, and read the GUM. 4.2.3 points out that the best estimate of an input is the mean of several measurements, and it’s uncertainty is the uncertainty of the mean, not the distribution of the measurements..
“The distinction is still that you are claiming that the uncertainty of the average is the population standard deviation, and not by the experimental standard deviation of the mean / standard error of the mean.”
Have you EVER taken a university level physical science lab course?
My first EE lab had seven students building an amplifier and measuring its characteristics. Seven different experiments with the same measurements. Each student took multiple measurements such as amplifier output vs input current and then averaged those measurements including their uncertainty based on the instrument uncertainties.
We then averaged the seven averages and found the standard deviation to get a common answer for everyone.
We all failed. What we found was the average and standard deviation of fthe sample means. We did *NOT* propagate the instrument and reading uncertainties to find out how uncertain our average was.
Rather than take the sample means as 100% accurate and using their standard deviation as the accuracy of the mean we calculated we should have propagated each set of results as “average +/- uncertainty”. Then added the uncertainty of the sample means to find the uncertainty of the average we found. We didn’t get into it at the time but we should have expanded that uncertainty in case we didn’t have a Gaussian distribution but a skewed one because of varying calibration drift among all the instruments.
I know you won’t accept this, you are too tied into your statistical world religious dogma that the SEM is how accurate the population mean is.
Those of us in the real world, where real world consequences await what we do, know better. Just ask a research medical doctor whose results can’t be replicated because he used the SEM to measure the accuracy of his results instead of the measurement uncertainty of his data.
“standard error of mean”
Which is *NOT* the variance of the measurement data!
“What I am saying is that if you want to know what the exact average of multiple inputs, all with random uncertainty, you can determine the uncertainty of that exact average using equation 10. “
No where in Eq. 10 is the total standard deviation of the sample means used. There is *NO* division by n or sqrt(n).
Say you have a population of 10,000. You pull 10 samples of 100 each.
You then calculate the mean of each sample. The standard deviation of each sample gives you an indication of how closely you have evaluated the population mean.
BUT, each of those samples also have uncertainty associated with the mean you calculated from them. If the data in the sample is random with no systematic uncertainty then the uncertainty of that sample mean is the standard deviation of the measurements in the sample.
WHAT IN PETE’S NAME DO YOU DO WITH THOSE UNCERTAINTIES OF THE SAMPLE MEANS?
YOU, BDGWX, AND ALANJ WANT TO JUST THROW THEM AWAY!
Just ignore them, right? Just assume that all measurement uncertainty is random, Gaussian, and cancels, right? So the mean of each sample is 100% accurate, right?
bigoilyblob thinks that if you jam enough data points with systematic “error” they magically transmogrify into “random errors” which of course then can be ignored via canceling and the holy averages.
It is just as you always say.
I can’t believe that he didn’t read my post about asymmetric uncertainty due to calibration drift. If he did it apparently went right over his head! Asymmetric uncertainty *can’t* cancel, the number of minus and pluses don’t add up to zero!
Nor do they know even the signs of calibration drift over time.
“Which is *NOT* the variance of the measurement data!”
Correct. See you can understand this if you try.
“No where in Eq. 10 is the total standard deviation of the sample means used. There is *NO* division by n or sqrt(n).”
And you were doing so well.
“Say you have a population of 10,000. You pull 10 samples of 100 each. ”
And we are back into the cesspit again. This has nothing to do with sampling – it’s about how you propagate the measurement uncertainties. And it doesn’t matter how many times I explain this, you still cannot comprehend that you do not normally take multiple samples.
OMG!
What the F do you think two temp measurements per day are if they aren’t multiple samples?
What are 30 monthly values of daily average if they are not multiple samples?
PUT DOWN THE BOTTLE!
“All I’ve said is that the general formula for the uncertainty of a sample mean is given by the standard error of the mean.”
Meaningless word salad. Put down the bottle!
The uncertainty of a sample mean is the standard deviation of the values in the sample or is the propagated uncertainties of the values in the sample.
You are STILL exhibiting the understanding of a statistician (or climate scientist) that assumes that all stated values are 100% accurate and the measurement uncertainty of the values can be ignored since they are random, Gaussian, and cancel!
The very formula: SEM = SD / sqrt(n)
ASSUMES EVERY SINGLE VALUE IN THE SAMPLE HAS NO UNCERTAINTY! (or that all the uncertainty cancels!)
It’s what you find in every single statistics textbook I have, all five of them!
In terms of metrology the SEM equation should be written as
SEM +/- uncertainty = (SD +/- uncertainty) / sqrt(n)
I’ll say it again, over and over. You are stuck in a statistics world. A world where measurement uncertainty doesn’t exist.
It doesn’t matter how many times you say you aren’t, your words and assertions show otherwise. You are only fooling yourself.
“Meaningless word salad.”
Which words did you have a problem with?
“The very formula: SEM = SD / sqrt(n)
ASSUMES EVERY SINGLE VALUE IN THE SAMPLE HAS NO UNCERTAINTY! (or that all the uncertainty cancels!)”
It does not. But don’t let me stop you spouting these mindless slogans.
“I’ll say it again, over and over.”
Please do. It just demonstrates you have no arguments, and have to resort to ad hominems.
“I’ve explained several times that you do not normally care about the measurement uncertainty of individual measurements when you do that, because a) they can be assumed to be negligible compared with the population deviation”
That is pure, unadulterated malarky.
It is a whiny excuse for assuming all measurement uncertainty is random, Gaussian, and cancels.
You *MAY* be able to get away with this in a calibration lab. It is malpractice to assume this in an unattended field measurement device subject to all kinds of varying conditions in the microclimate.
If you can’t identify calibration drift in a field instrument then you can’t assume that the uncertainty of individual measurements are negligible.
Again, that is just one more excuse for ignoring measurement uncertainty. It simply cannot be justified except for someone living in statistics world instead of the real world!
Yep, it is truly all they have.
And even then it must be justified with a formal uncertainty analysis, and not a lame hand-waving about “cancelation”.
That’s the most decisive rejection of the law of propagation of uncertainty from you to date. And to think that you were once so invested in it…
Nope—it is YOUR mindless stuffing the average formula into the GUM that is magic thinking. You think it gives the answer you want, so you run with it.
And Block Head G still can’t explain how averaging removes temperature instrumental measurement uncertainty.
They don’t even understand that even random measurement uncertainty doesn’t just “cancel”, it doesn’t go away, it still has to be accounted for. It has to be Gaussian or at least perfectly symmetric in order to sum to zero. Any skew in the “random” uncertainty prevents it from summing to zero. Any asymmetric calibration drift in a large number of measurement devices will introduce a skew that prevents summing to zero.
If it doesn’t sum to zero then the precision with which the average can be stated is limited as well.
Bevington even states in his tome that an infinite number of measurements won’t get you to an SEM of zero, there will always be some kind of offset, from cosmic influences if nothing else!
Bevington: “The accuracy of an experiment, as we have defined it, is generally dependent on how well we can control or compensate for systematic errors, errors that will make our results different from the “true” values with reproducible discrepancies. Errors of this type are not easy to detect and not easily studied by statistical analysis”
Taylor: “For this reason, uncertainties are classified into two groups: the random uncertainties, which can be treated statistically, and the systematic uncertainties, which cannot”
Climate science ALWAYS assumes that systematic uncertainties either don’t exist or are random, Gaussian, and cacel.
It is truly just that simple.
The JCGM speaks to *random* uncertainties. Just as Bevington does and Taylor does beginning in Chapter 4.
You have never accepted these simple truths. It’s likely you never will. The rest of the world using physical measurements are leaving you behind.
They sit around talking about how “systematic” “errors” somehow become “random”, then slap each other on the backs for revealing this “truth”.
That sounds a lot like how religion works – revealed truths.