Guest essay by Larry Hamlin
The L A Times ran an article addressing the year 2023 Northern Hemisphere summer temperatures which falsely claimed that:
“But in Britain and the United States, global records go back to the mid-1800s, and the two countries’ weather and science agencies are expected to concur that this summer has been a record breaker.”

Despite all the climate alarmist politically driven ignorance-based hype about “record” year summer 2023 temperatures the reality of the year 2023 summer temperatures in the U.S. and other global locations are, in fact, disputed by NOAA’s measured data.
NOAA’s year 2023 U.S. temperature data records covering the NOAA defined 3-month summer June through August period actually shows that U.S. 2023 summer temperatures were far below “record” summer maximum temperature levels regardless of whether one is looking at NOAA’s national, regional, state, county or city summer temperature data.
Looking first at NOAA’s National Contiguous U.S. Maximum Temperature for year 2023 (shown below) we see a maximum temperature of 85.72 F which represents the 109th highest maximum summer temperature of the 129 maximum summer temperatures identified. There are 20 years in which the Contiguous U.S. Maximum Temperature was higher than in 2023 with the highest ever being in 1936 at 87.92 F.

The year 2023 is not even close to being a “record” maximum highest summer temperature for the Contiguous U.S.
Looking next at NOAA’s West Regional Time Series for year 2023 (shown below for the West Region) we see a maximum temperature of 86.6 F which represents the 73rd highest maximum temperature of the 129 maximum summer temperatures identified. There are 56 years in which the West Regional Maximum Temperature was higher than 2023 with the highest ever being in 2021 at 91.2 F.

There are 7 other NOAA Regional Areas which are the Ohio Valley, Upper Midwest, Northeast, Northwest, South, Southeast, Southwest and Northern Rockies Plains of the U.S. with each of these showing that the year 2023 maximum summer temperature is not the “record” highest with these “record” highest maximum years being 1936, 1988, 1949, 2021, 2011, 2020 and 1936 respectively.
The year 2023 is not even close to a “record” maximum highest summer temperature for any of NOAA’s U.S. Regions.
Looking next at the NOAA’s Statewide Time Series Maximum Temperature for year 2023 (shown below California) we see a maximum temperature of 87.9 F which represents the 77th highest maximum temperature out of the 129 maximum summer temperatures identified. There are 52 years in which California’s Statewide Maximum Temperature was higher than in year 2023 with the highest ever being in 2021 at 91.9 F.

Of the 48 States in the Contiguous U.S. 47 did not see a “record” maximum highest summer temperature in 2023. Only Louisiana has a “record” maximum highest summer temperature in year 2023.
California’s year 2023 summer temperature was not even close to a “record” maximum summer temperature.
47 of the 48 Contiguous U.S. States did not have a “record” maximum summer temperature.
Looking next at NOAA’s County Time Series Maximum Temperature for year 2023 (shown below for Los Angeles County) we see a maximum temperature of 85.0 F which represents the 49th highest out of 129 maximum summer temperatures identified. There are 80 years in which the Los Angeles County Maximum Temperature was higher than in year 2023 with the highest ever being in 2006 at 89.7 F.

There are 58 California counties listed in NOAA’s County Time Series and none these counties had a “record” maximum highest summer temperature in 2023.
Looking next at NOAA’s City Time Series Maximum Temperature for year 2023 (shown below for Los Angeles) we see a maximum temperature of 72.8 F which represents the 47th highest summer temperature out of the 79 identified. There are 32 years in which the Los Angeles City Maximum Temperature was higher than in year 2023 with the highest being in 2006 at 76.8 F.

There are 9 California cities (including Death Valley) listed in NOAA’s City Time Series and none of these cities had a “record” maximum highest summer temperatures in 2023.
NOAA’s temperature data as identified and addressed in the above discussion for year 2023 clearly indicates that the U.S did not have “record” breaking summer temperatures in year 2023 – not at the national level, not at the nations regional level, not at the nations state level, not at the level of California’s 58 counties, and not at the level of 9 major California cities.
Despite these outcomes in California and the U.S. climate incompetent alarmist politicians and news media will continue to falsely hype “record breaking heat” as being present across the nation and its states, regions, counties, and cities based on the grossly and completely invalid misapplication of a global wide temperature averaging outcome that cannot define temperature outcomes at specific global regional, national, country, state, county, or city locals.
Additionally, given the 2023 summer temperature outcomes of the U.S. addressed above it seems unlikely that the Global Region of North American had “record” summer temperature outcomes as hyped by the propaganda driven alarmist media. This outcome is further addressed below.
Alaska highest Maximum Summer Temperatures Peak was 65.3 F in 2004 with the year 2023 maximum summer temperature being only 60.6 F in 2023 making it the 85th out of 99 total yearly maximums as shown below.

The highest reported temperature measured in Canada this year was 41.4 C in British Columbia’s South Coast on August 14, 2023.
Canada’s highest ever reported temperatures are shown below.

This data clearly supports that Canada did not have “record” high maximum summer temperatures in year 2023 which is consistent with the same outcome for Alaska whose territories occupy the same Northern Hemisphere global latitudes as Canada.
Given that neither the U.S., Alaska nor Canada had “record” high maximum summer temperatures in 2023 it seems extremely probable that neither did the entire North America Global Region.
But despite this reality in the inane ignorant based climate alarmist political propaganda world the alarmism hype will continue unabated.
“The year 2023 is not even close to being a “record” maximum highest summer temperature for the Contiguous U.S.”
The endless misrepresentation that goes on here. The LA Times did not say anywhere that it was a record for the US. The UK and US indices agreed that it was a record for the Northern Hemisphere summer average, and that is what the LA Times reported, correctly.
The endless misrepresentation always starts with Nick’s comments.
There are a multitude of unadjusted measurements that show the 1930s,40s was warmer in the NH.
You KNOW that HadCrud, GISS, GHCN etc are FAKE and do not remotely represent actual NH or Global temperatures…
… but fakery is all you have.
Please stick to topic. The headline here
“L A Times Article Falsely Asserts U.S. Had “Record” High Summer Temperatures in 2023”is itself false. The L.A.Times did not assert that.
They say
“Scientists have used tree rings, ice cores and other proxies to estimate that temperatures are now warmer than they have been in about 120,000 years. “
Which is of course total BS.
It has been warmer than now for most of the last 10,000 years
Why aren’t you correcting that LIE, Nick ?
Nice to see that you agree that it wasn’t the warmest in the USA.
Now if only you would you use non-urban, non-faked NH data, you would see that there statement about the NH is also a fallacy.
But you use fallacy all the time. Its your “thing”
UAH shows 2023 in 4th place on a year-to-date basis. (45 years)
UAH shows world oceans in 6th place on a year-to-date basis
UAH NH also shows 2023 in 6th place on a year-to-date basis.
Two warmer than normal months carry this whole story….. Whoopie doo !
Yes, I’m sure you can come up with an endless list of things that the L.A.Times did not say.
They did say..
“Scientists have used tree rings, ice cores and other proxies to estimate that temperatures are now warmer than they have been in about 120,000 years. “
Which is of course total BS.”
Where is you comment denouncing that piece of nonsense.
Do you agree that this “warmest summer” fakery relies on just 2 warm months?
So is totally meaningless.
Note, Nick has NOT denounced this LIE. !!
First off, only the totally clueless, or those dedicated to pushing a lie, would use tree rings as a proxy of temperature.
Secondly, the world was warmer than it is today for about 90% of the last 12000 years. The Holocene Optimum which lasted from around 12K years ago to about 5K years ago, was as much as 3 to 5C warmer than today.
After that, we fall back into the most recent glacial phase of the Quaternary Ice Age.
I for one am glad we do not have ice sheets down into the mid-west anymore.
use tree rings as a proxy of temperature
I’ve never understood that. There are a other factors that affect tree growth.
The Grand Solar Minimum has started the Beaufort Gyre is about to dump its fresh water into the North Atlantic possibly shutting down heat transport from the tropics to the north. The interglacial periods usually last about 10,000 years, it has been 11,700 years, so a new glacial period might be on the way.
“First off, only the totally clueless, or those dedicated to pushing a lie, would use tree rings as a proxy of temperature.
Secondly, the world was warmer than it is today for about 90% of the last 12000 years. The Holocene Optimum which lasted from around 12K years ago to about 5K years ago, was as much as 3 to 5C warmer than today.”
So we can’t use thermometers. Tree rings are out. So how do you know all those things about the last 12000 years?
There are other proxies that aren’t proxies for CO2 !
“Secondly, the world was warmer than it is today for about 90% of the last 12000 years.”
Bollocks, complete and utter. MIUMark at it again. How many is that this week? There was the poverty line one… oh and only one oil disaster……
Simon is wrong, as usual:
https://wattsupwiththat.com/2016/07/31/a-warm-period-by-any-other-name-the-climatic-optimum/
What a clown. You post a graph that has no years listed and … wait for it … was by the fraudster Tim Ball. Here is a real graph that shows MarkW is a misinformed at best, a liar at worst. I’m picking it is option 2.

Its the Slimon hockey stick!
We are domed!
Hurrah!!!!…. The proud boys poster is here. Nice to have our resident racist pop by.
Racist. n. A person who has just won a political argument with a Leftist.
Poor Simon..you would be proud if you were a boy..
But you have never reached that level of maturity and can’t decide what you are…. cockroach or amoeba.
What exactly is your evidence that the proud boys are “white supremicists”, Slimon?
A lot of them were feddies, BTW.
The DNC says they are racists, and Simon always believes what he is told to believe.
Oh, and I forgot to ask: where are the uncertainty limits on your hockey stick?
I don’t see any.
One thing that is a constant with those on the left. The minute they feel they are losing, they start accusing everyone who disagrees with them of being a racist.
Yep, a graph based on Michael Mann’s fraudulent tree-ring data.
Tree rings , which are a great indicator of CO2 and water levels, but not of temperature.
Hilarious, isn’t it ! 🙂
Sorry, I couldn’t resist reposting the photo you hate so much:
https://www.cambridge.org/core/journals/quaternary-research/article/abs/latequaternary-vegetation-and-climate-near-the-arctic-tree-line-of-northwestern-north-america/3CD9A82242E6D90FF3AF8F8D935EA44B
So Graeme…. do you have any evidence that globally the last 10000 years were warmer than today? I know you have this picture you trot out, and good on you…. but I’m looking for global. I have one.
I do indeed have one: It took me 5 seconds to find it.
https://wattsupwiththat.com/2018/11/03/yet-another-study-illustrates-that-the-medieval-warming-period-was-not-regional-but-global/
There’s a search function on WUWT. You should learn to use it.
Why do you even bother? Even a a troll you’re hopeless.
G: you are a heretic preaching to a religious believer. He’s not a troll, he’s a cultist.
Oh dearie me,, Some moron has spliced FAKE temperature measurements on their agenda driven FAKE Holocene chart.
So funny !!
Simon displaying his ignorance as usual
Yes, most of the last 10,000 years WERE warmer than current temperatures.
“Yes, most of the last 10,000 years WERE warmer than current temperatures.”
BS from the BS master.
More evidence of your dishonesty:
https://wattsupwiththat.com/2016/07/29/a-review-of-temperature-reconstructions/
Oh, and by the way, you whined that the first graph I posted had no years. Yet another lie. The reason is simply that the x-axis had been truncated to fit the frame.
Still no answer to how trees grow under glaciers??
I’m sure you can come up with a simpleton answer.
Well come on bnasty…. where is your evidence the BS you spout is true? And while I’m talking about your BS, isn’t it an olympic level irony that your get out of jail card is to say scientific data is fraudulent, yet the only data you cite is nonsense?
Large amounts of evidence posted just below.
You have just proven yourself to be a totally mindless zealot incapable of learning even the most simple FACTS.
You are an insignificant and petulant child, with zero to add to any rational discussion.
“You have just proven yourself to be a totally mindless zealot incapable of learning even the most simple FACTS.”
Translation…. I have nothing I can produce that can back up what I say…. so I’ll just resort to personal abuse.
The fact is that the dozens of posts that have presented data refuting Simon, are still unread. Simon refuses to look at anything that is not from a party approved site.
The fact is none of them were global which is the most significant point…… Now do you have one?
See my post above. the MWP was certainly global.
Don’t try repeating the lie that the warming was only regional.
Everyone know that Mickey Mann’s fabrication was fraudulent..
That you don’t seem to be aware of that shows just how incredibly IGNORANT you choose to be.
You don’t understand, Mickey Mann says that his work has never been refuted, and that’s good enough for Simon.
As usual, Simon defines nonsense as any data that disproves the nonsense he is pushing.
It is almost as though Nick KNOWS that the “warmest summer” comment is based on FAKE and MANIPULATED cooling of past data. !
Isn’t that right, Nick !
Noise
So you agree.. Maybe you aren’t as much of a mindless zealot as I thought. !
I agree with your characterization of your posts.
“Scientists have used tree rings, ice cores and other proxies to estimate that temperatures are now warmer than they have been in about 120,000 years. “
It was warmer than now just 8,000 years ago it is called the Climate Optimism, ever read about it?
It’s good to know that Nick agrees that the Danish have re-settled Greenland and started farming grains to feed their domestic animals again as they had done for hundreds of years before abandoning it due to cold.
Yes. Climate optimism has returned. Here’s Igaliku
Nice photo to show they remembered to install plenty of white Stevenson screens.
Geoff S
I’m going out on a limb and guess that Nick actually believes that this picture is relevant.
________________________________________________________
What they said is:
But in Britain and the United States, global records go back to the mid-1800s,
and the two countries’ weather and science agencies are expected to concur
that this summer has been a record breaker.
Did you not notice the word “global” in that paragraph?
Are you suggesting that the UK and USA have “global records” i,e. temperature measurements worldwide that no one else has had access to? Go on do tell us what
“But in Britain and the United States, global records go back to the mid-1800s”
means.
Are these records global or not? If they are why mention UK and USA?
No, just that in the context of the article they are clearly talking about the specific global data sets, such as HadCRUT, GISS and NOAA.
The USA has NOAAGlobalTemp.
The UK has HadCRUT.
Everyone has access to these datasets.
Yes. They are global. They mention the UK and USA because those are the countries providing those datasets.
And they are both manically adjusted , as well as being based on data from surface sites that are TOTALLY UNFIT for measuring changes in “climate” over time.
Not useful for use as anything but climate propaganda.
Again, this is just an opinion from a ‘shouty’ person on the internet. Quite funny.
Again, the Flaming Nitwit thinks urban warming and airports are “the way” to measure climate.
No accounting for its incredible ignorance and lack of any rational thought process. !
Scientific rule #1: Always trust government agencies to provide the truth for the public to see.
Scientific rule #2: Once established by the government, scientific data never changes.
No, I didn’t so you get to score a run.
Nick is implying that the United States climate is significantly different from the rest of the world, an outlier of sorts. Long time ago here on WattsUpWithThat, Richard Verney’s post – you can read it here – said pretty much the following:
The United States isn’t the world, but it spans North America with a good variety of geography and topography which makes it a good sub-set of a land mass. World-wide, the US has the best sampling of weather data of any significant land surface. If the US does not show warming, a strong explanation is needed as to why it is an outlier compared to the rest of the world as a whole.
Taken from (Richard Verney, WUWT, July 2017)
“Nick is implying that the United States climate is significantly different from the rest of the world”
I’m not responsible for that. I just point to the respective measurements. That is just how it is.
Respective measurement (real ones) show that a very large proportion of the NH had very similar temperature patterns to the USA.
Seems you are not taking responsibility for your own ignorance.
The US is only 2% of the global surface area. It would hardly be surprising if its temperature timeseries did not match that of the globe.
Except most untainted, unadjusted data from the NH DOES match US temperatures
Only it doesn’t. It matches GISS, NOAA and HadCruT.
Remember Berkeley Earth?
That was funny.
The Berkeley Earth database shows thermometer readings in the 1700’s with uncertainty values in the hundredths digit!
And we are supposed to believe anything taken from that data?
“The Berkeley Earth database shows thermometer readings in the 1700’s with uncertainty values in the hundredths digit!”
They do not. Monthly uncertainties for the 1750s are generally multiple degrees – for annual averages closer to 1°C.
“And we are supposed to believe anything taken from that data?”
Tell that to those who keep spamming the “US was hotter in the 30s” graphs using Berkeley data. They seem to believe the data when it suits them.
Malarky. Two years ago I directly asked BE about the uncertainties they showed for two stations in the 1700’s. The answer? “Well, that will be taken care of when the data is actually analyzed.”
Really? The way it is handled? IT’S IGNORED! Just like you do! “All uncertainty is random, Gaussian, and cancels”. Therefore it can be ignored!
And it *was* hotter in the 30’s than today, at least according to the recorded temperatures.
Like usual, you want your cake and to eat it too. “BE is accurate when bellman wants to use it but it isn’t accurate when someone else uses it”!
“Malarky.”
There’s that tell again. Every time Tim is caught out in a fabrication, he just shouts “malarky” or some such, and then tries to change the subject.
“Like usual, you want your cake and to eat it too. “BE is accurate when bellman wants to use it but it isn’t accurate when someone else uses it”!”
A bit of projection from the man who keeps claiming BEST is fraudulent, but is happy to use it to claim that “it *was* hotter in the 30’s than today”.
I think BEST is as accurate both when I use it and when others use it. The problem with all the “it was hotter in the 30’s” graphs are not the accuracy of the data – it’s the way it has been selected to make a point that does not stand up to scrutiny. It was hotter in the 30’s if you limit yourself to just the US data, only look at maximum temperatures, and only look at summer temperatures.
No fabrication. But I’m not going back to search emails from two years ago to try and convince you. The answer *was* that the uncertainty figure in those old records were not meant to be used – of course what uncertainties the actual analyses use was never given. I can only assume that the measurement uncertainties, as usual in climate studies, were assumed to be random, Gaussian, and would cancel. Therefore they could be ignored.
It *was* hotter in the 30’s than today. The fact that you can’t accept that fact is quite telling.
The 20’s and 30’s were hot all over the globe. If I can find them I’ll post graphs from China that shows it was hotter there as well as in the US. Between the two the land area involved is a significant percentage of the global land area.
In the meantime:
from oxfordre.com: “For example, historians Meng Wentong and Hu Houxuan interpreted the archaeological evidence and oracle bone scripts and suggested that the climate of northern China in ancient times (ca. 2,000 to 3,000 years ago) was warmer than that of the 20th century (Meng, 1930, 1934; Hu, 1944).”
from “Temperature variation through 2000 years in China: An uncertainty analysis of reconstruction and regional difference”
“ Considering the past 2000 years, the winter half-year temperature series [Ge et al., 2003] indicate that the three warm peaks (690s–710s, 1080s–1100s and 1230s–1250s), have comparable high temperatures to the last decades of the 20th century.”
for SE China: “The 500–years regional coherent temperature series shows maximum temperature during the decades 1490s, 1620s, 1670s and 1930s, whereas minimum values were found in the 1650s and 1830s.”
“the warming during the last decades of the 20th century is only apparent in the TB region, where no other comparable warming peak occurred. For the regions of NE and CE, the warming peaks during 900s–1300s are higher than that of the late 20th century, though connected with relatively large uncertainties.”
Now, come back and tell us that China and the US aren’t significant land areas.
“No fabrication.”
The fabrication was your claim that BEST showed uncertainty values of hundredths of a degree. By well evaded.
“It *was* hotter in the 30’s than today. The fact that you can’t accept that fact is quite telling.”
More telling is the way you claim this as a fact with no uncertainty, whilst claiming that global temperatures have an uncertainty in the tens of degrees.
“The 20’s and 30’s were hot all over the globe.”
and there go those goalposts. First it’s in the 30s, then it’s in the 30s and 40s, and now it’s in the 20s as well.
I’m sure you can find that everywhere in the world had at least one summer between 1920 and 1950 that was hotter than some summers in recent years. It does not mean that the globe was warmer during those 30 years than it is now.
“Between the two the land area involved is a significant percentage of the global land area.”
Which still means nothing if they happened to be the hottest parts of the globe in that particular decade. And even less if China was warm in the 20s, but the US in the 30s.
“For example, historians Meng Wentong and Hu Houxuan interpreted the archaeological evidence and oracle bone scripts and suggested that the climate of northern China in ancient times (ca. 2,000 to 3,000 years ago) was warmer than that of the 20th century”
So your evidence that it was hotter in China in the 20s – 30s, are three papers written in the 30s and 40s saying it was colder than it was 2000 years ago?
“ Considering the past 2000 years, the winter half-year temperature series [Ge et al., 2003] indicate that the three warm peaks (690s–710s, 1080s–1100s and 1230s–1250s), have comparable high temperatures to the last decades of the 20th century.”
So now you are interested in Winter temperatures.
Again, though it was warmer in the 13th century than at the end of the 20th century is not saying it was warmer in the 1930s.
“for SE China”
You missed Central East China
“The 500-year regional coherent temperature series shows temperature amplitude between the coldest and warmest decade of 1.8°C. Three extended warm periods were prevalent in 1470s–1610s, 1700s–1780s, and after 1900s. It is evident that the late 20th century warming stands out during the past 500 years.”
and Tibet
“After 1850, the temperature increased rapidly, with the last 20 years of the 20th century experiencing the warmest conditions of the past 1000 years in the TB region.”
“Now, come back and tell us that China and the US aren’t significant land areas.”
You’re citing a paper that looked at different regions of China, only one of which shows anything like temperatures being as warm in the 1930s as they were at the end of the 20th century.
It concludes:
“The fabrication was your claim that BEST showed uncertainty values of hundredths of a degree. “
Again, no FABRICATION! You are welcome to not believe it, there’s a lot of fact that you don’t believe. But It happened. When I questioned it the answer was “it doesn’t matter, we fix it later”. In other words they *IGNORE* measurement uncertainty – just like you do!
“Which still means nothing if they happened to be the hottest parts of the globe in that particular decade. “
It’s called GLOBAL warming for a reason! If CO2 is well distributed then so are its impacts. Now, come back and tell us that CO2 is *NOT* well distributed so “GLOBAL” warming only occurs in part of the globe.
“You’re citing a paper that looked at different regions of China, only one of which shows anything like temperatures being as warm in the 1930s as they were at the end of the 20th century.”
Not every place in the US saw record heat in the 30’s either. So what’s your point? The 20’s and 30’s WERE hotter in the US than today.
“In particular during the warming period of 900s–1300s, the maximum temperatures in some regions exceeded the highest level of the 20th century.”
Guess that doesn’t mean anything to you. Your lac of reading comprehension is showing again!
“Again, no FABRICATION!”
Don’t call it a fabrication, just say it was a lie then. But you said BEST claimed the uncertainty of global anomalies from the 18th century was stated to be hundredths of a degree, when they actually claim they are several degrees.
“It’s called GLOBAL warming for a reason!”
That reason being that on average the globe is getting warmer.
“Not every place in the US saw record heat in the 30’s either”
Yet you still keep insisting that the entire world was warmer in the 30s.
“Guess that doesn’t mean anything to you.”
It means what it says, and doesn’t mean what it doesn’t say. What it doesn’t say is it was warmer in the 1930s
“Don’t call it a fabrication, just say it was a lie then. But you said BEST claimed the uncertainty of global anomalies from the 18th century was stated to be hundredths of a degree, when they actually claim they are several degrees.”
You lack of reading skills is showing again. And it also shows you know nothing about the BEST.
I didn’t say BEST showed anomalies with measurement uncertainty in the hundredths digit – I *SAID* they showed temperatures taken in the 1700’s with uncertainties in the hundredths digit.
Since the uncertainty of the measurements propagate into anomalies calculated from the measurements the anomalies inherit the uncertainties of the measurements.
And BE said they use other values for the uncertainties of the actual measurements, that what the data base shows is not used!
And the truth is that they *aren’t* used – but they should be! And the measurements should be shown with the appropriate level of uncertainty! The truth is that they use the same meme you always do: “all measurement uncertainty is random, Gaussian, and cancels.” Thus you don’t have to worry about the measurement uncertainty and how to propagate it. You just ignore it.
Before you say people are liars you need to make sure of your facts. And that includes having someone else read what you are responding to you and then having them explain it to you! You simply aren’t capable of comprehending what you read.
“That reason being that on average the globe is getting warmer.”
EXACTLY what does that statement mean as far as climate is concerned? Is it from warmer minimums? Is it from warmer maximums? Is it from a combination of the two? If it’s from minimums (which is backed up by ag studies showing longer growing seasons) then what’s the impact on the global climate? It certainly isn’t causing a lack of food as the global warming advocates claim will happen. If it’s from maximums then where is the impacts? The New York and Miami aren’t underwater yet. The Arctic isn’t ice free yet. It certainly hasn’t caused food shortages or expansion of desertification. Nor has it resulted in more extreme weather.
If a proper propagation of measurement uncertainty is included with the global average temperature then it is UNKNOWN if the GAT is warming. It’s a subjective guess drawn from a cloudy crystal ball. And the future being prognosticated by the global warming advocates seems to be having about the same accuracy as a circus fortune teller looking into a cloudy crystal ball!
For a reply bellman will pull a few quotes out-of-context and make up some noise about them a la Nitpick Nick Stokes.
My mistake. You did say “thermometer readings” rather than global anomalies. I apologise for suggesting you were claiming otherwise.
But that does illustrate my point. Even if they are claiming the uncertainty of individual readings has an uncertainty in the hundreds of degrees, when used to create a monthly global average, the uncertainty is in multiple degrees. It’s the lack of coverage that is the main cause of uncertainty.
If global warming was being caused by a well-mixed, globally homogenous gas like CO2 then coverage really wouldn’t be a problem. The warming should show up *EVERYWHERE* all the time.
The growth of CO2 in the atmosphere has been consistent for a hundred years and yet we’ve been through at least two global warming cycles and one global cooling cycle. And the current warming cycle has yet to reach the magnitude that was seen 100 years ago.
“Even if they are claiming the uncertainty of individual readings has an uncertainty in the hundreds of degrees, when used to create a monthly global average, the uncertainty is in multiple degrees.”
This is so garbled I can’t make any sense of it. I suspect you are saying they are claiming uncertainty in the HUNDRETHS (i.e. .0x decimal point). And if you are saying that the measurement uncertainty grows as you combine more and more single measurements of different things then you are correct. The SEM is *NOT* the measurement uncertainty of the average. The propagated uncertainty of the elements is the uncertainty of the average.
No, other countries in the NH experienced heat waves as well.
Lots of placers have heat waves – it doesn’t mean that it’s hotter globally.
Where in the mid-Northern Hemisphere and above does it actually get “hot” in the Winter?
“hotter”, not “hot”.
Equivocate you much?
The Berks use data that is even more tainted than the GISS data.
They can and do manufacture any result they want to get.
Just because an area is ‘anomalously’ warm, it doesn’t mean that it was necessarily hot. Take a look at Antarctica:
https://scitechdaily.com/nasa-summer-2023-was-earths-hottest-since-global-records-began-in-1880/
When all a painter has in his palette is a tube of red paint, the whole picture is painted in red tones.
That’s what media graphics does with temps representations these days.
Did someone say it did?
““But in Britain and the United States, global records go back to the mid-1800s, and the two countries’ weather and science agencies are expected to concur that this summer has been a record breaker.””
“While the world’s air and oceans are setting records for heat”
Heat is usually measured by *temperature*.
It appears that the LA Times did. And you are on here trying to defend their article!
I was just pointing out that “anomalously warm” needn’t mean “hot”. Thought most people would understand that. Not here, maybe.
“Earth is sweltering through its hottest Northern Hemisphere summer ever measured, with a record August capping a season of brutal and deadly temperatures,
Brutal and deadly temperatures indicate HIGH temperatures, not anomalously warm temperatures.
Stop blowing smoke!
“The world’s oceans — more than 70% of the Earth’s surface — were the hottest ever recorded, nearly 70 degrees,”
I suppose this isn’t implying *hot*? Even though that is the actual adjective they used?
“So far, 2023 is the second-hottest year on record”
Here’s that ajective “hottest” once again! Not “anomalously warm”, just “hottest”!
I’m guessing you haven’t even bothered to read the article. If you had you wouldn’t be trying to blow smoke up everyone’s behind!
From the linked article that you apparently didn’t read: “The summer of 2023 was Earth’s hottest since global records began in 1880, according to scientists at NASA’s Goddard Institute of Space Studies (GISS) in New York.”
Here is what the LA Times was actually talking about
Yes, I think these area averaged, convenience sampled surface temperatures are statistical junk but the LA Times is correctly reporting the junk.
Six years ago I summarized the junk as a needed research program:
https://www.cfact.org/2017/05/27/a-needed-noaa-temperature-research-program/
There’s NIck again, using data that he MUST KNOW BY NOW IS TOTALLY FAKE. !!
Fake indeed: https://www.cfact.org/2017/05/18/fake-temperatures/
For Nick, the criteria is not accuracy, but rather does it support the narrative.
Reality looks more like this.
With a cooling trend since 2018
Conveniently missing 2023 from your graph.
Note that your very short cooling trend since 2018 has become an equally meaningless warming trend, of around +0.2°C / decade.
Since we are using this El Nino.. Better take it from the last El Nino.
Even a blind monkey can see the cooling trend since the 2016 El Nino spike.
And that the current spike is far lower than 2016
How am I “using” an El Niño? I was using your start date – chosen to start just before an El Niño. The current one is only just starting, and is unlikely to have had much of an impact yet.
So now you have to move back, and really use a massive El Niño to claim another pathetic cherry-picked cooling trend. And miss of the most recent month.
OK let’s drop the El Nino spike off each end
Think about you are saying , moron !!
“And that the current spike is far lower than 2016”
It’s 0.1°C lower. But remember these are anomalies, and the 2016 peak happened in February, whereas in 2023 it’s happening in August. Comparing like with like, this is the warmest August in the NH by 0.45°C.
Here’s the entire UAH NH data. Warming trend of 0.16°C / decade.
Always using those EL Nino steps…,
The only warming there has been.
So sad you are incapable.
Note, basically no warming from 1980-1997
Basically no warming from 2001-2015
Just those small non-CO2 El Nino bumps
UAH is not anyone’s reality. But, FWIW, it was a record in UAH too:
Relying on two months.. meaningless, and certainly nothing to do with CO2.
The claim that you are disputing is that the NH summer was the warmest on record – your own UAH dataset confirms that it was. That is why Nick is using JJA (summer) temperature.
Are you having difficulty keeping your own position straight?
Two months is NOT CLIMATE, muppet.
Now explain how humans caused this two-month spike.
And of course both those two months had anomalies LOWER than the 2016 peak anomaly, and only one of them was above the 1998 peak anomaly.
JJA means June, July and August. That’s 3 (three) months.
And it’s the same three (3) months referred to in the article – northern hemisphere summer.
And yes, 2023 was the warmest NH summer in the UAH record, as Nick pointed out.
Even Spencer and Christie’s report makes that clear.
Current spike is MUCH lower than 2016.
Two months IS NOT CLIMATE.
No-one in the NH experience any significant extra warmth, nearly all the anomaly was north of Siberia.
Stop your childish PANIC !!
But NH summer 2023 was the warmest in the UAH record, as it was in all the other ones. Are you simply incapable of acknowledging this. Is it psychologically too hard for you to accept?
Your heroes Roy and John have let you down, is that it|?
NO, the highest anomaly was in 2016.
The warming in August was in places basically no-one lives.
No-one in the NH experienced any significant warming except for a 2-3 day weather event.
“UAH is not anyone’s reality”
It is certainly FAR more real than the junk maladjusted urban surface data that you “believe” in !
I guess that means the weather balloon data is not anyone’s reality, either.
The UAH and weather balloon data correlate with each other, confirming each others’s readings. If Nick wants to throw away UAH, then he must want to throw away the weather balloon data, too.
And the only pristine-ish surface data, USCRN. (Since it is a close trend match to UAH USA48)
And ClimDiv since 2005. (Since it is manipulated to match USCRN)
But USCRN has been warming faster than ClimDiv since 2005!
Yes, the so-called ‘pristine’ sites have a faster warming trend than those affected by urban heat island effect since 2005, their joint period of record.
Are you saying that the scientists are deliberately lowering the warming trend in the US sites affected by UHI?
That adds a whole other dimension to the silliness on display daily here at WUWT. This is beyond parody!
Yes we know ClimDiv is being adjusted to match USCRN.
You still haven’t the remotest comprehension of “significant difference” have you.
So sad that you are so incredibly INEPT !!
So are the weather balloons saying summer 2023 wasn’t the warmest NH summer in the instrument record? Do you have a data link, for instance? In contradiction to all the surface and lower stratosphere data?
Otherwise, what does this post mean?
The weather balloons say the same thing the UAH satellite says: Which was my point.Nick wants to trash UAH, so he must want to trash Weather Balloon data, too. Get it now?
Do they?
Weather balloons are a very close match to UAH.
You do know that 2 months is NOT CLIMATE, but a weather event.
don’t you.
Come on muppet.
Explain, using real science, how July and August temperature spike was caused by humans.
This will be HILARIOUS watching you squirm around in your own putrid, oozing imagination.
“Reality looks more like this.”
Oh dear, now you will have all the usual suspects yelling at you for not including error bars, or suggesting that it’s possible to tell what UAH is doing when the monthly uncertainties are several degrees.
But if you do want to use UAH, here is what their Northern Hemisphere data look the summer months.
Pretty decisive.
I suspect WUWT will find an excuse to drop UAH from their sidebar in the coming months – given what’s likely coming.
It is climate alarmists who are prone to dismiss data that doesn’t agree with their preconceptions.
Like the fact that it was just as warm in the recent past as it is today.
Like the fact that the United States has been in a temperature downtrend since the 1930’s.
Like the fact that the global temperature record has been so bastardized that it is completely divorced from reality.
And so many more.
I noticed that Monckton has already paused his monthly pause articles. It’s not going to surprise me at all if UAH gets yanked from this site.
Why would it happen?
The climate crew assumes that everyone else is as venal as their heros.
That sounds like wishful thinking to me.
“The UK and US indices agreed that it was a record for the Northern Hemisphere summer average, and that is what the LA Times reported, correctly.”
Anomalies don’t make “hottest eveh!”. Anomalies don’t determine the summer average temperature. Anomalies are excursions from a baseline. What baseline was used in your graph? Did it include 1920-1940?
If they meant anomaly then they should have said ANOMALY, not average temperature. Those are two totally different things and you are trying to equate the two!
It’s lying by omission or by ignorance. Take your pick.
NOAA baseline is 1901-2000
NOAA is massively adjusted from the measured temperatures to get rid of the 1930s/40s peak, and also contains mostly urban and airport data.
It is totally unrepresentative of global anything !
And it is *not* representative of the northern hemisphere either.
NOAA, NASA/GISS, Japanese Met Agency (JMA), UAH_TLT and RSS_TLT all reported NH summer 2023 as the warmest on their respective records. HadCRUT still to report August but June and July both set new monthly records in that set, so very likely them too. Some conspiracy.
Rusty Nail gets it wrong again. No warming in June in Tokyo:
https://wattsupwiththat.com/2022/07/03/june-in-tokyo-hachijojima-island-hasnt-warmed-in-decades/
Didn’t say Tokyo, did I? I said JMA “Northern hemisphere”.
It was the warmest summer IN THE NORTHERN HEMISPHERE (sorry, but you literally have to shout it out at some folks) in the JMA record.
Do you understand now the difference between JMA’s Tokyo record and its Northern Hemisphere record?
You don’t, do you?
Funny that temperatures from single locations show no warming whatever. It’s almost as though “average” temperatures are an artificial unphysical construct.
Gees this “warmest summer” (since the 1940s) has you in a complete chicken-little tizzy, doesn’t it
Despite you knowing that nearly ALL the last 10,000 years were warmer than now, and civilisation developed during that period, and struggled during the couple of colder period.
But understanding basic climate and human history is going to be hard for someone with a mental age of 5, you poor thing.
NOAA GISS et al use the same corrupted data with all the 1930/40s adjusted way down to get rid of the blip.
They are also using surface sites that are heavily tainted by massive amounts of urban warming .
Also a large increase in the % of unreliable airport sites.. (or do you still think jet engine exhaust has a cooling effect ???)
Oh and just in case you are still a confused little muppet..
… Two warm months IS NOT CLIMATE
Awaiting your scientific proof that they were caused by human anything….
Yeah, it’s all a big conspiracy that’s lasted decades without anyone from any of the many groups reporting coming forward to expose it, despite the enormous wealth that would gain them from the fossil fuel companies, etc. Very believable, cough!
If it’s not a conspiracy, why does Gavin Schmidt go to such lengths to prevent publication of a paper by Willie Soon which disproves the GW narrative?
https://wattsupwiththat.com/2023/09/15/are-you-or-have-you-ever-published-the-work-of-a-climate-skeptic/
Yeah?!
So, we all notice that you are still helping fund those fossil fuel companies.
Electricity, computers, communications, travel, food, transport etc etc etc.
Helping them to support the rest of society by continuing the provision of the things EVERYONE relies on.
Very charitable of you to be so incredibly hypocritical.
How quickly you forget the exchanges during ‘Climategate.’
I think he is in denial.
Yeah, and before that it was a Human-caused Global Cooling conspiracy.
That went away when the temperatures starting climbing and the Human-caused Global Cooling advocates could no longer maintain this fiction.
My guess is that at some time the Human-caused Global Warming advocates will reach a point where this fiction can no longer be maintained, either, after the temperatures start to cool.
You are going on and on about a “blip” up in temperatures, but you never mention the underwater eruption of Hunga Tonga. No connection, you think?
Anomaly is *NOT* temperature. How many times does that need to be pointed out before it is understood?
Anomalies *have* to be weighted against what the absolute temperature is. None of the organization you list do that. They weight a +1C change from -30C to -29C the same as a +1C change from 20C to 21C.
The impacts on the actual climate of either change is NIL – i.e. ZERO! If the temperatures are “averages” rather than actual absolute measurements then the average even hides what the variance of the temperature inside the average is – so how can you tell if it is *hotter*? The average can go up because minimum temps go up while it doesn’t get hotter at all!
If things don’t thaw out at -30C then they won’t thaw out at -29C. Evaporation at 20C is the same as at 21C, at least as far as it can be measured using today’s infrastructure.
So how do you relate an ANOMALY to climate?
You didn’t address the main point. Anomalies are *NOT* temperature. If the LAT meant anomalies then why didn’t they say anomalies?
They are temperature anomalies. Differences from long term average temperatures. They’re not just random numbers.
For example, from the UAH August 2023 report, Spencer and Christie explain the relationship between anomalies and the temperatures they are derived from:
40 milli-Kelvin, BFD. You ascribe meaning to this difference?
Rusty is clueless about metrology, amongst other things.
Bingo.
FN will not understand what that means.
Doesn’t realise just how insignificant it is.
Doesn’t realise how insignificant he is.
Don’t know what you mean, sorry.
“Don’t know what you mean”
Yes, we are well aware of that fact. !
Anomalies are *NOT* temperatures. They are temperature differences! How do you relate an ANOMALY to climate? The anomaly calculated from averages tells you ZERO about what actually changed! Minimum temps could be the main contributing factor to an average going up – yet it seems like you and your buddies assume that the anomaly going up means it got HOTTER! I.e. the Earth is going to burn up from higher temps.
Except the ANOMALY can’t tell you that! It’s a SUBJECTIVE OPINION from those with an agenda to push!
What do you not get about this ‘anomaly’ thing, Tom?
Why do you think it is that all the climate science global temperature databases use anomalies? Including the (here) much-lauded UAH?
It’s very simple to use and understand. It’s just a difference from a long-term average temperature.
What is the problem?
“It’s just a difference from a long-term average temperature.”
That long-term average temperature tells you NOTHING about climate. It’s a mess of a distribution – summer temps combined with winter temps, both with different variances, no weighting given to actual local changes in climate (i.e. a change in the average from -30C to -29C is hardly a *change* in climate), no propagation of uncertainty meaning no one knows if the differences in averages are meaningful or not.
The SEM of the global average is *NOT* the uncertainty of that average. The uncertainty, according to the GUM, is the dispersion of values around the mean, not how accurately you calculate the average (which is what the SEM tells you).
What is the problem? The entire mess is based on tradition – using Tmax and Tmin to drive a value that is truly meaningless on a global basis. When is climate science going to join the rest of science in using degree-days and/or enthalpy? Ag science has changed, HVAC engineering has changed – yet climate science remains stuck using the same methodology and protocols used in the 1700’s! If climate science was medicine we’d still be “bleeding” sick people!
The anomaly in 2016 was larger than now….
… what don’t you “get” about this anomaly thing ?
And no, it is a very short-term average, based on a rather cool period after the much warmer 1930s and 40s.
The period around the time of the “global cooling” propaganda scare.
If it is so simple, why don’t you understand it !
Why don’t you understand that the “base period” is the period around the global cooling scare.. a COLD period
Why don’t you understand that 1.5C warming out of the COLDEST PERIOD IN 10,000 YEARS….
… is nothing to go into a total lather of MANIC PANIC about …
… and is in fact a very beneficial thing to happen ?
“How do you relate an ANOMALY to climate?”
OK, so when UAH says their July temperature is 266.06K, what does that tell you about climate?
“OK, so when UAH says their July temperature is 266.06K, what does that tell you about climate?”
It tells me NOTHING! It’s an AVERAGE! What’s the variance of the data that created that average? What’s the shape of the distribution of the temperatures that is associated with that average?
When the uncertainty interval for UAH is at least +/-1C then what do differences in the tenths or hundredths digits tell you? The values that go into those decimal places is UNKNOWN!
Why don’t you ANSWER the questions posed to you? Answering a question with a question is a logical fallacy. It’s not an answer to the question. In essence it’s a form of the argumentative fallacy known as Red Herring.
*ALL* of the analyses of the temperature data bases are built upon a statistical edifice that has no foundation at all. Each temperature is a sample with a sample size of 1. Meaning the SEM is undefined since one data element, the recorded temperature, has no standard deviation. When you combine samples of size 1 together there is no guarantee of what the distribution will be, it could be multi-modal, gaussian, skewed left, skewed right, or of any form. All those samples are nothing but “stated values +/- uncertainty”. Since you can *NOT* just assume all those uncertainty intervals for a random, Gaussian distribution you can’t assume that they all cancel. Therefore the uncertainty of the average value becomes the uncertainty intervals added in quadrature. This gets so large on a global basis that even the value of the units digit is UNKNOWN.
Climate science just ignores all this and makes the unwarranted assumptions that the variances of the temperatures in a month across different locations can be ignored and that everything forms a random, Gaussian distribution.
I have yet to find *any* study or analysis of the “global average temperature” that properly handles the uncertainty of the individual temperatures. They all assume the SEM of the calculated average is the uncertainty of the average. According to the GUM the SEM is *NOT* the uncertainty of the average. The uncertainty of the average is the dispersion of values around the average and can be one of three things: 1. the standard deviation of the distribution values, 2. The propagated uncertainties of the distribution values, or 3. a combination of 1 and 2.
The issue with 1. is that it assumes the same thing is being measured multiple times. That is *NOT* an appropriate assumption for a global temperature database. It’s not even a valid assumption for the mid-range daily value of temperature for a single station on a single day!
bellcurveman likes to claim that “sampling” is the “largest source of uncertainty” in these global air temperature measurements. He never explains exactly what he means and it is never quantitative, always just qualitative hand-waving.
My best guess its a take-off on Stokes’ absurd claim that with enough stations, bias error magically transmogrify into random errors to justify climastrologers ignoring them.
Sampling error is a red herring. Each temperature measurement is a sample with a size of 1! The SEM then equals the standard deviation of the population divided by 1. Except with ONE data point in the population there is *NO* population standard deviation! Which means there is no SEM – voila! = no sampling error.
Jamming all those samples of size 1 together doesn’t make a distribution that is even capable of being analyzed statistically, especially when systematic uncertainty exists in each and every individual sample. Systematic bias in each and every single data point simply doesn’t turn into random errors that cancel. They might PARTIALLY cancel but that just means you add them in quadrature. You can’t just assume they totally cancel, even though that is what climate science does!
With every averaging step the crystal ball gets cloudier and cloudier. Climate science assumes just the opposite, the crystal ball gets clearer and clearer. They are so similar to the fortune tellers at the circus that it is amazing! “I see warming in your future!”
“Except with ONE data point in the population there is *NO* population standard deviation! Which means there is no SEM – voila! = no sampling error.”
Still clueless.
The max temp here today was 83F. What’s the standard deviation for that? What is the SEM? What is the average?
If karlomonte had ever tried to read any of my posts, instead of just responding with cheap insults and pathetic nicknames, he might have figured out by now what I mean by sampling uncertainty. He might also realize I am not talking about global temperatures, but about sampling in general.
It isn’t that difficult. Take the mean of a random sample from a population, and the uncertainty is how close that sample mean is likely to be to the sample mean. At the simplest this will be indicted by taking the standard deviation and dividing by the square root of the sample size. That’s what I mean by sampling uncertainty, as opposed to the uncertainty caused by measurement errors.
In general you would expect sampling uncertainty to dominate in the uncertainty of a mean, as both decrease with the root of N, but the deviation from sampling should be bigger than the standard measurement uncertainties.
If, for example, you had Tim’s 100 thermometers each with a random and independent uncertainty of 0.5°C, the uncertainty of the mean would be 0.05°C. But if the temperatures had a standard deviation of 10°C, than the SEM would be 1°C, and the combined uncertainty would be √(1² + 0.05²) ≈ 1.0°C
In general it makes sense that the measurement uncertainty is less than the deviation in the sample, becasue why would you be using a measuring device that was less accurate than the difference in the things you are measuring?
Of course this assumes that there is no major systematic error in the measurements, and that you understand how to propagate random measurement uncertainties properly.
As to how to estimate the uncertainty in an actual monthly global anomaly record, I couldn’t say. It’s different becasue they are not random samples and require many different processes in determining the average.
“He might also realize I am not talking about global temperatures, but about sampling in general.”
bellman Evasion Rule No. 1: redirect the discussion to a different topic.
The issue being discussed here *is* TEMPERATURE, specifically the global average temperature!
“In general it makes sense that the measurement uncertainty is less than the deviation in the sample, becasue why would you be using a measuring device that was less accurate than the difference in the things you are measuring?”
bellman Evasion Rule No. 3: Assume the reader is stupid. Temperature measurement around the globe is done by using THOUSANDS of measuring stations of unknown accuracy with unknown systematic biases. It is *not* an issue of “a measuring device”.
“Of course this assumes that there is no major systematic error in the measurements”
Which *is* the standard assumption in climate science – and your typical assumption as well! And it not justified at all when combining thousands of measurements made by thousands of field temperature measuring devices of unknown calibration, unknown microclimates, and unknown systematic biases.
“As to how to estimate the uncertainty in an actual monthly global anomaly record, I couldn’t say. “
Then you are just wasting everyone’s bandwidth – a typical troll. Nothing to offer that is on point.
“It’s different becasue they are not random samples and require many different processes in determining the average.”
Every time you do an average and supply only that average there is data loss that is absolutely required in order to judge if the average is meaningful or not.
The variance of the “global average temperature” and its associated anomaly is so wide that the average *is* basically meaningless. The uncertainty cloud is at least in the units digit and most likely in the tens digit. Trying to identify differences in the hundredths digit is no different than a fortune teller at the circus “seeing” something in a cloudy crystal ball.
“As to how to estimate the uncertainty in an actual monthly global anomaly record, I couldn’t say. “
This would require him to do some actual meaningful work — much easier to just hand-wave another load of nonsense and hope no one notices.
“This would require him to do some actual meaningful work”
What work do you think I need to do? I’m not the one claiming all the published uncertainty estimates are completely wrong.
You’re the troll who claims all other sources of uncertainty can be ignored except for your “sampling” nonsense, you do the work.
The Empirical Rule in statistics tells us that a good estimate of the standard deviation is 1/4 the range (1/6 for a more conservative estimate). For a global temperature of over 200 deg F, the SD should be about 50 deg based on annual temperatures. Not a single troll here has even addressed this issue, let alone provided a satisfactory explanation of how one can claim a precision of +/-0.01 deg F when the Empirical Rule suggests a value at least 4 orders of magnitude larger.
The above should be “200 deg F range.” A longer period of time gives a range of about 300 deg F, and dividing by 6 still gives about 50 deg.
This is why it’s useful to look at anomalies rather than temperatures. Global temperatures might vary by tens of degrees, but anomalies don’t.
Why?
The magic of the almighty anomaly cannot cancel non-random error.
It can in bellman’s statistical world.
Anomalies inherit the variances of the components used to calculate the anomaly. If the variances, i.e. the uncertainty, of the components is wide then the uncertainty is high for the anomaly – meaning it is very uncertain as well.
This has been explained to you multiple times but you insist on ignoring it. It’s the only way you can justify claiming the anomalies are accurate to the hundredths of a degree.
Read my comment and the one I was replying to. This has nothing to do with how uncertain you think an individual anomaly is. It’s pointing out that Clyde Spencer’s uncertainty caused by the huge variation in global and seasonal temperatures is greatly reduced by taking anomalies. Simply because there is far less variance in anomalies than in absolute temperatures.
Only because you throw all of them in the rubbish.
Only in bellman-land does the variance decrease when you subtract two random variables.
He will be sure to lie and deny when confronted with how he forces everything into his nice, neat little Gaussian box.
“ It’s pointing out that Clyde Spencer’s uncertainty caused by the huge variation in global and seasonal temperatures is greatly reduced by taking anomalies.”
It is *NOT* reduced by taking anomalies!
Baseline = A +/- u(a)
Annual temp avg = B +/- u(b)
A – B ==> u(a) + u(b)
A + B ==> u(a) + u(b)
Uncertainty grows whether you add or subtract. The anomaly uncertainty is the sum of the uncertainties of each component.
“Simply because there is far less variance in anomalies than in absolute temperatures.”
This is basic statistics! Variances add when you combine random variables, whether you add the variables or subtract the variables.
Variance *is* a measure of the uncertainty of a distribution because it describes the range of possible values. The wider the range of possible values the higher the uncertainty is.
You simply can’t get *anything* right, can you?
His religion would collapse if he acknowledged that variances increase, so they must be swept under the rug.
This is called “honest” science for climastrologers.
“It is *NOT* reduced by taking anomalies!”
Of course it is. Are seriously claiming there is as much variance in anomalies as there is in absolute temperatures. You only have to look at any of the UAH maps to see anomalies are varying across the globe by a few degrees rather than the 10s of degrees for global temperatures.
All you are doing is obessing over the uncertainties of individual values and the very small increase in uncertainty when subtracting a 30 year mean. But, that is not not what Clyde Spencer is talking about. He’s specifically talking about the uncertainty caused by having a wide range of temperatures.
“It is *NOT* reduced by taking anomalies!”
Only if you IGNORE all the variances from ALL the intermediate averaging steps!
You will never learn this lesson.
Oh dear, he still doesn’t understand this, and I’m not sure if it’s worth explaining it again.
PeeWee goes back into projection mode.
Variance and uncertainty are related issues. They both add whether you are adding or subtracting the associated stated values.
The variances/uncertainty of the baseline and the measurement ADD, whether you do an addition or subtraction of the baseline and the measurement.
“Are seriously claiming there is as much variance in anomalies as there is in absolute temperatures.”
YES! That is the plain truth!
What *IS* the variance? The variance is a measure of the variability in your data. The more spread the data the larger your variance is!
The spread in the absolute temps is reflected into the spread of the anomalies.
It’s truly no different than any measurement uncertainty propagation.
I already showed you how this works.
Baseline = A +/- u(A)
Monthly = B +/- u(B)
A – B = anomaly
u(anomaly) = u(A) + u(B)
So the anomaly should be given as “stated value +/- uncertainty” which is Anomaly +/- [u(A) + u(B)]
The *global* anomaly is the average of the individual anomalies. The uncertainty in the individual anomalies are propagated onto the average anomaly. The SEM of the anomaly mean is *NOT* the measurement uncertainty of the anomaly!
“ But, that is not not what Clyde Spencer is talking about. He’s specifically talking about the uncertainty caused by having a wide range of temperatures.”
You *still* haven’t figured it out! A wide range of values, i.e. the temperature values, indicates a high variance which, in turn, indicates a high level of uncertainty in the mean!
And you still don’t get it.
You are talking about the uncertainty in any specific anomaly measurement. I, and Spencer, are talking about the variation of all the values, whether absolute temperature or anomaly.
He is saying that as the standard deviation of temperatures across the globe, and across a year, is large, than the mean of a sample will have a large uncertainty.
I am saying that is true for absolute temperatures, but less true for anomalies. Anomalies flatten out the absolute range of values, and instead show the relative change in temperature compared to a base period. The standard deviation of anomalies across the globe, and across the year, is smaller than that for absolute temperatures.”
“The SEM of the anomaly mean is *NOT* the measurement uncertainty of the anomaly!”
As I explained before and you keep ignoring, the SEM will usually be a lot larger than that for the measurement uncertainties.
“You are talking about the uncertainty in any specific anomaly measurement. I, and Spencer, are talking about the variation of all the values, whether absolute temperature or anomaly.”
In other words both of you are applying the meme: “all measurement uncertainty is random, Gaussian, and cancels. So we can use the SEM as the uncertainty of the average”
“Anomalies flatten out the absolute range of values”
Anomalies are nothing but a way to scale values. The flatter a distribution is the higher its uncertainty is. A distribution that is very spiked, i.e. a small SD, has far less uncertainty than one with a very small rise at the mean, i.e. a “flat” distribution.
As I already showed you for the last three days here in Kansas the anomalies have a much wider spread than the absolute values do. If you are going to compare the two distributions you have to normalize the them to the same scale. Otherwise you could just divide everything by 10^6 and say the variance is small! Which *is* what you are trying to do!
“In other words both of you are applying the meme”
The only person who says that everything is Gaussian is the voice in your head – which I’m beginning to worry might be some sort of parasite.
“Anomalies are nothing but a way to scale values.”
Wrong – but I guess “scale” is another one of those words you don’t understand the meaning of, but like to throw around.
“The flatter a distribution is the higher its uncertainty is.”
Wrong. But make your mind up. Are anomalies just scaling values or are they changing the distribution?
“A distribution that is very spiked, i.e. a small SD, has far less uncertainty than one with a very small rise at the mean, i.e. a “flat” distribution.”
Nonsense on stilts.
“As I already showed you for the last three days here in Kansas the anomalies have a much wider spread than the absolute values do.”
And you were wrong.
But as I’ve told you, you are missing the point of anomalies if you are only looking at one point in time in one place.
“Otherwise you could just divide everything by 10^6 and say the variance is small! Which *is* what you are trying to do!”
Try to think about what you are saying and why it might be wrong.
Every single thing you said here is wrong. Take the “flat” curve. It will have a larger SD than a peaked curve. That means that the mean has a lower probability for one curve – i.e. more uncertainty.
You can’t seem to get *anything* right! It stems from your insistence on arguing that black is white and white is black.
“Take the “flat” curve. It will have a larger SD than a peaked curve. That means that the mean has a lower probability for one curve – i.e. more uncertainty.”
Just not true. Take the probability distribution of a single 6-sided die, and compare it with the sum of 100 6-sided dice. Which has the flatter curve? Which has the larger uncertainty? You keep ignore the absolute value of the standard deviation of the curves.
But you’re wrong in any case. For the uncertainty of a mean the shape of the curve can be expected to be close to a normal distribution regardless of whether it’s based on anomalies or absolute temperatures – thanks to the CLT. The larger the standard deviation of the population the wider the standard deviation of the means. As anomalies have smaller standard deviation the standard deviation of the means will be smaller, the curve is more peaked, hence less uncertainty.
“You can’t seem to get *anything* right!”
From now on I’m just going to assume whenever you use that phrase, it means you have lost the argument.
YMHW
We went through this once before. As usual, your memory is so bad you can’t retain anything.
Temperature is not a six-sided die. Temperature does not have discrete values, it is a continuous distribution.
“But you’re wrong in any case. For the uncertainty of a mean the shape of the curve can be expected to be close to a normal distribution regardless of whether it’s based on anomalies or absolute temperatures – thanks to the CLT.”
Wow! Just WOW! You can’t get anything right. The CLT tells you about the distribution of the SAMPLE MEANS, not the distribution of values around the population mean!
I’ve given you a graph of the difference before, in fact just a few messages ago! I’ll attach it again. See if you can finally figure out what it is showing!
“As anomalies have smaller standard deviation the standard deviation of the means will be smaller, the curve is more peaked, hence less uncertainty.”
I’ve shown you from my own temperature data why this is untrue. You can’t even understand normalization and scaling. If what you are claiming here is true then just divide everything by infinity and the standard deviation will approach zero in the limit.
Where did you learn your math?
“Temperature is not a six-sided die.”
Gorman evasion rule number 1 – distract about some irrelevant difference rather than actually answer the question.
OK.
Take the rectangular probability distribution with range -1 to 1, and compare it with a Gaussian probability distribution with mean 0, and a standard deviation of 200 . Which has the flatter curve? Which has the larger uncertainty?
“Wow! Just WOW! You can’t get anything right.”
If only you would spend more time considering what I’m sayinbg, and what you are saying, rather than this endless pearl clutching.
“The CLT tells you about the distribution of the SAMPLE MEANS, not the distribution of values around the population mean!”
Yes, because you were talking about the probability distribution of the mean, not of the sample. But regardless the answer is the same. There is less deviation in a distribution of anomalies than there is in a distribution of absolute values.
“I’ve given you a graph of the difference before”
Your graph is just showing the difference between a standard deviation of a population and the SEM of a sample of 10. It has nothing to distinction between absolute values and anomalies. But thanks for illustrating my point, that uncertainty decreases with increased sample size.
“I’ve shown you from my own temperature data why this is untrue”
”
And I’ve explained above several times why that is irrelevant and wrong. Show the data over a year not 3 days, and look at the actual standard deviation, not as a meaningless percentage.
As I have it loaded at the moment let me look at CET daily values for 2022. Across the year the standard deviation is 5.4°C, with a mean of 11.1°C.
Converting the daily means to anomalies based on the average from 1981 – 2010 gives a standard deviation of 2.7°C, with a mean of +1.2°C.
The standard deviation of the anomalies was half that of the absolute values – entirely down to removing the seasonal variation. The bigger the seasonal variation, the bigger the result.
Even re-scaling as you for some reason want, results in a sd for the scaled absolute values of 0.17, verses an sd of 0.13 for the scaled anomalies.
“If what you are claiming here is true then just divide everything by infinity and the standard deviation will approach zero in the limit. ”
Well yes – the smaller the values the smaller the standard deviation. But that’s not what is being done with anomalies. They are not the result of re-scaling the absolute values. If the data was stationary the standard deviation would be identical for both absolute temperatures and anomalies. You are just subtracting the mean from all values. The reason the standard deviation of anomalies is smaller is not because you have divided the values by anything, it’s becasue you are subtracting the non-stationary means – that is seasonally adjusting the values.
“bellman Evasion Rule No. 1: redirect the discussion to a different topic”
In Gormanland, clarifying what you said is “evasion”.
“The issue being discussed here *is* TEMPERATURE, specifically the global average temperature!”
The issue was about sampling. I’ve s[pent well over two years trying to explain to your group how sampling works, and why it does not mean that uncertainty increases with sampling size. I’ve also made it clear that actual global anomaly uncertainties are not simply obtained by dividing the standard deviation of all the readings by the square root of the sample size.
“bellman Evasion Rule No. 3: Assume the reader is stupid. ”
When people keep asking what the uncertainty of a sample is, I have to make some assumptions.
“Temperature measurement around the globe is done by using THOUSANDS of measuring stations of unknown accuracy with unknown systematic biases. It is *not* an issue of “a measuring device”. ”
And it’s reasonable to assume these devices are capable of detecting changes of a few degrees.
“The variance of the “global average temperature” and its associated anomaly is so wide that the average *is* basically meaningless.”
And Gorman evasion rule number 1, change the subject.
We are talking about the uncertainty of the mean, not how meaningful it it is.
But obviously it is meaningful or people here wouldn’t be so desperate to claim it’s so uncertain.
“The uncertainty cloud is at least in the units digit and most likely in the tens digit.”
And yet Tim will still be certain that global temperatures were warmer in the 30s than today, despite there being an uncertainty of tens of degrees.
“In Gormanland, clarifying what you said is “evasion”.”
Malarky. You are trying to change the subject from the uncertainty of the “global average” to hypothetical sampling error – AN EVASION.
“The issue was about sampling.”
No, the *issue* was the uncertainty of the global average temperature.
“The issue was about sampling. I’ve s[pent well over two years trying to explain to your group how sampling works,”
But you *NEVER* relate it to the uncertainty of the mean, not the SEM, the MEASUREMENT uncertainty of the mean.
“When people keep asking what the uncertainty of a sample is, I have to make some assumptions.”
NO ONE is asking what the SEM is. They are asking what the MEASURMENT uncertainty of the mean is!
“And it’s reasonable to assume these devices are capable of detecting changes of a few degrees.”
It is?
You’ve been given graphs of temperatures from NE Kansas any number of times and asked why there is such variance in the temperatures. You *NEVER* address that issue. You just continue to make claims that all measurement uncertainty is random, Gaussian, and cancels.
See the attached image. Why the spread of temperature over such a small distance? 7F between Manhattan and Hiawatha, 6F between Topeka and Hiawatha. 5F between Manhattan and Clay Center.
Assuming that the temperature measurement devices are at least minimally accurate then why the variance in the temperatures? What *is* the variance of the data? It’s almost 4F. The average is about 84 with a standard deviation of about 2. That means there is a significant uncertainty in that mean!
Expand that to the GLOBE! That standard deviation won’t go down, it will only get larger as the variance of the data set grows.
“And Gorman evasion rule number 1, change the subject.”
Nope. The ISSIE is the measurement uncertainty of the global average temperature. You have admitted you have nothing to offer on that issue. So why do you keep posting crap hoping to distract people from the issue!
“And yet Tim will still be certain that global temperatures were warmer in the 30s than today, despite there being an uncertainty of tens of degrees.”
My parents and grandparents LIVED through that time. I have direct historical context on it. Have *YOU* ever cracked a history book on that time? Have *you* read the Grapes of Wrath?
Another load of bellcurvewhinerman hand-waved nonsense.
You still don’t have Clue One about uncertainty. To toss all other sources in the trash you first have to analyze them all, then justify which ones can be neglected.
But this would require actual work, using tools that are not in the trendologists’ toolbox.
“Another load of bellcurvewhinerman hand-waved nonsense.”
And on and on it goes. karlo complains I won’t explain what I mean by sampling uncertainty. I explain. He pretends to not understand the explanation and then falls back on yet more pathetic name calling.
And in a few days time he will be telling anyone who will listen that I never explain what sampling uncertainty means.
Poor whinerman, doesn’t get the respect he thinks he deserves.
That is only true for data that have the property of stationarity. That is, the mean and standard deviation don’t vary with time.
Because for a very long time instruments could not be manufactured that had the desired accuracy and precision. As long as we have to depend on measurements made along time ago in order to establish changes, we will have to live with that problem.
“That is only true for data that have the property of stationarity.”
Not true. I’m talking about a random sample. That’s random with regard tot he population. If you are looking at the average over a fixed period of time, and take genuinely random values over that time period, you still have identical distribution – the distribution being the temperature over that entire time period.
Of course, as I also said, for an actual global average over a time period, you are not actually taking random values. You are usually taking one reading a day. It’s not a random sample but a systematic sample. That should eliminate the uncertainty caused by a random sample.
“Because for a very long time instruments could not be manufactured that had the desired accuracy and precision.”
They were accurate enough to give useful results, or there would have been no point using them.
My point is the issues with uncertainty for 19th let alone 18th century global temperatures is far less how accurate the measurements were, and much more to do with the coverage.
How do you make a “random sample” from a bucket load of air temperature measurements?
You get ONE try at measuring an air temperature and it is gone forever.
All your averaging gods cannot overcome this inconvenient fact.
This right here is hand waving: “should”. You just hope it does.
Bullshit, Pat Frank has demonstrated the historic liquid-in-glass instruments were not up to the tast.
Reality and Bellman will never meet, let along mix.
“How do you make a “random sample” from a bucket load of air temperature measurements?”
I wouldn’t. I’d use the existing data, which as I keep pointing out is not a random sample.
“You get ONE try at measuring an air temperature and it is gone forever.”
Hopefully though you write it down, so it isn’t really gone.
Typical bellcurveman smoke and noise.
You need to stop digging, the hole you are in is deep enough.
If you don’t take a random sample then the mean you calculate is meaningless. There’s no guaranteed way to assume that a non-random sample represents the population at all.
In essence, you are saying that the temp data being used today can’t possibly give an accurate global average temperature since it isn’t a random sample of global temperatures!
His answer about writing down a measurement shows just how disingenuous he truly is. A total avoidance of the real issue.
Then you need to spell out exactly what you think the “real” issue is. All you utter are this gnomic phrases such as “when one measures a temperature it’s gone forever.”
It has no relavance either to a random sample, or to the real uncertainty of a global average anomaly. If you have something relevant to say, say it.
Been said a thousand times, it doesn’t sink into your skull.
You’ve been told another thousand times—I’m not going to waste any time trying to educate you.
Translation: “karlo doesn’t have a clue what he’s talking about, but hopes that if he just throws out clever sounding phrases whilst refusing to answer when called out, people will be fooled into thinking he’s a genius.”
I’m not going to wade through more of your hand-waved trendologist word salads.
“If you don’t take a random sample then the mean you calculate is meaningless.”
You think all means are meaningless, so why do you care?
But again you are just wrong. A monthly average based on taking one daily value every day is going to be more accurate than one based on taking 30 random daily values. The uncertainty on a sample comes from the randomness. That’s because there is always a chance that the random sample doesn’t reflect the population. Taking a more systematic sample reduces that chance. It’s common sense really, so I doubt you will ever get it.
Your definition of “accurate” reveals (again) your “everything is gaussian” bias.
By your logic a single measurement of anything is 100% error-free!
If you actually had any confidence in your claims, you’d just make the case rather than just inventing all these strawmen.
WTF is a “random daily value”, clownpants?
A daily value taken at random. The clue is in the words I use.
Say you want to know the average temperature for a month at one station. You record the temperature for each day, and average them. That gives you a sample covering the entire month, but it isn’t random
If you insist on a truly random sample, you could get that by selecting 30 days at random (with replacement). You might get one day come up several times, and other days not appear at all. The average you get will have come from a random sample, and you can divide the SD by the root of 30 to estimate the SEM. But it won’t be as accurate a mean as just taking each of the 30 days for your sample.
Why in the world would you ever want to apply random sampling to a time series?
Nutty.
You wouldn’t. If you actually tried following the threads rather than butting in with childish jokes, you might have understood that’s what I’ve been saying.
No, that is *NOT* what you have been saying. If you had bee saying that then you would realize that the daily mid-range value does *NOT* capture the time varying signal throughout the day.
It must be so easy to think you are winning these arguments when you just ignore everything I actually say.
What you say nothing but hand waving, without anything quantitative.
What do you want me to say quantitatively about someone just lying about what I’m saying?
More of your non-physical bullshit.
“You record the temperature for each day, and average them. That gives you a sample covering the entire month, but it isn’t random”
That simply doesn’t work for a time varying signal.
“If you insist on a truly random sample, you could get that by selecting 30 days at random (with replacement).”
You are measuring daily temperatures in a month. How do you select 30 days at random? You only have 30 days total!
“The average you get will have come from a random sample, and you can divide the SD by the root of 30 to estimate the SEM. But it won’t be as accurate a mean as just taking each of the 30 days for your sample.”
Thank you Captain Obvious. Calculating the population average using the population values is more precise than using a sample to estimate it! (btw, it doesn’t make the mean more accurate, just more precisely located).
That really isn’t addressing what you originally said about single measurements being more accurate than multiple measurements.
He’s already backpedaled out of this quicksand.
“You think all means are meaningless, so why do you care?”
The mean of a multi-modal distribution such as one you get from combining winter and summer temperatures into a data set and then using them to calculate anomalies *IS* meaningless. The variances of winter and summer temps are different, combining them is like combining the heights of Shetlands with the heights of quarter horses.
The mean of a skewed distribution is meaningless. For a skewed distribution you need the mode and the median along with the mean to make even a little sense out of the mean. Combining Tmax from a sinusoidal time series with Tmin from an exponential decaying time series can’t do anything but give you a skewed distribution. There are published, peer reviewed studies out on the internet that document the biases caused in the temperature record from doing this.
The mean of a random, Gaussian distribution has meaning but that requires multiple measurements of the same thing using the same instrument (with no systematic bias) under the same environmental conditions. That restriction is *NOT* met by the global temperature databases.
“A monthly average based on taking one daily value every day is going to be more accurate than one based on taking 30 random daily values.”
You simply do not understand how to measure a non-stationary, cyclical process at all. A single daily value tells you what about the daily temperature profile? Answer? Literally nothing. From one value you simply cannot identify that the daytime temp is sinusoidal and the nighttime temp is an exponential decay. Without that information that one single, daily value is meaningless. So is the average you calculate from that one, single, daily measurement. At least with 30 random daily values you have the possibility of identifying the actual temperature profile.
“The uncertainty on a sample comes from the randomness. That’s because there is always a chance that the random sample doesn’t reflect the population.”
Then why are you so insistent on using the SEM as the uncertainty of the average?
“Taking a more systematic sample reduces that chance. It’s common sense really, so I doubt you will ever get it.”
That’s simply not true for a non-stationary time series. If I take a systematic sample of a time varying voltage, V, then it will look like a DC voltage whose value is dependent on where the systematic sample falls on the time varying signal. The mention of Nyquist just went right over your head or it went in one ear and out the other while encountering nothing to slow it down.
Yep! He has statistics sampling on the brain and cannot see anything but.
“A single daily value tells you what about the daily temperature profile? Answer? Literally nothing.”
Why do you keep trying to answer your own questions, and then getting the answer completely wrong?
“From one value you simply cannot identify that the daytime temp is sinusoidal and the nighttime temp is an exponential decay.”
Yet somehow you know it is, almost as if you have more information than just a single value.
“At least with 30 random daily values you have the possibility of identifying the actual temperature profile. ”
You really can never see the wood for the trees, can you? The point of taking daily temperatures is not to determine the daily temperature profile, it’s to determine how temperatures change day to day, and to estimate a monthly average.
If you can only take one temperature a day, it’s best to ensure you take it at the same time. That way you are getting a like for like comparison – but as always it won;t tell you everything, it’s just the best you can do with limited resources.
Better is to have an estimate of the average temperature for each day, either obtained from taking several readings at fixed times of the day, or using a max/min thermometer.
Throwing away information and data—the essence of trendology.
“Yet somehow you know it is, almost as if you have more information than just a single value.”
I’ve given you graphs of the temperature profile MULTIPLE times, all based on 5min data I have collected locally since 2012. As usual, your memory is so poor you can’t remember any of them.
“The point of taking daily temperatures is not to determine the daily temperature profile, it’s to determine how temperatures change day to day, and to estimate a monthly average.”
If you don’t know how the temperature changes during the day then you have NO chance of accurately determining how it changes from day to day or over a month. Multiple climates can result in the very same mid-range values – meaning that you really don’t know what is happening to the climate anywhere!
This is why I say that climate science should move to using degree-days instead of the mid-range value.
“If you can only take one temperature a day, it’s best to ensure you take it at the same time.”
Like I’ve said, doing it this way can turn a sinusoid into a DC value. You simply don’t get a good indication of what is going on with the temperature. In addition, you totally miss daily weather impacts which can drastically change the temperature that you get. If on Day 1 there is full sunshine at the time of reading and on Day 2 there is temporary cloud cover at the same time of day you get a biased set of data that does not represent the actual temperature profile.
Again, this is why the degree-day measure if far more appropriate for temperature. The Argument to Tradition means *never* changing how the climate is analyzed – even though other disciplines have made the change. Climate science will remain stuck in the 1700’s way of analyzing temperatures!
“Better is to have an estimate of the average temperature for each day,”
You can’t get a daily average from one reading which is what you propose.
Nor can you get a good “average” from Tmax/Tmin. Different Tmax/Tmin readings can give the same mid-range value from different climates. That’s *not* a good way to try and analyze climate.
This is exactly their goal, a straight line with no wiggles!
“I’ve given you graphs of the temperature profile MULTIPLE times, all based on 5min data I have collected locally since 2012. As usual, your memory is so poor you can’t remember any of them.”
You were saying you can’t tell the daily profile from one value. Taking 5 minute data is not one value.
“If you don’t know how the temperature changes during the day then you have NO chance of accurately determining how it changes from day to day or over a month.”
You are such a defeatist. Every time you encounter data that is not 100% complete you throw your hands up in the air and insist it’s hopeless and should all be thrown out.
“Like I’ve said, doing it this way can turn a sinusoid into a DC value.”
You still can’t figure out that the point of taking a monthly average is not to tell you the shape of the daily profile.
“The Argument to Tradition means *never* changing how the climate is analyzed”
I see it’s time for the traditional “Argument to Tradition” false fallacy.
Nobody has ever said there is only one way to collect or analyze data. If they had we wouldn’t have satellite data, they would never have built the CRN, and there would not be so many new and improved versions of old data sets.
But if say, you want to compare global temperatures today with the 1930s, you cannot go back in time and install CRN weather stations back in the 1930s.
“You can’t get a daily average from one reading which is what you propose.”
I did not propose it. You were the one saying it was better to take 30 random temperatures a month. I just suggested if you were limited to 30 values it would be better to take 1 value a day at a set time, than 30 average ones. The point, I should have made clear, is not to tell you the actual monthly temperature, but the average temperature at that time of day. This makes it easier to compare one month with another.
“Nor can you get a good “average” from Tmax/Tmin.”
Define “good”. Quantify the difference between the “true” average and TMean, both for individual stations and for a global average. And then explain why one is better than the other when looking at changing temperatures.
“That should eliminate the uncertainty caused by a random sample.”
Exactly how does this happen?
“If you are looking at the average over a fixed period of time, and take genuinely random values over that time period, you still have identical distribution – the distribution being the temperature over that entire time period.”
Does Nyquist ring any bells with you at all?
How many samples of a frequency distribution do you need to define the frequency distribution?
Via sleight of hand-waving.
“How many samples of a frequency distribution do you need to define the frequency distribution?”
An interesting question if we were talking about finding a frequency distribution, rather than a mean.
The temperature profile *IS* a frequency distribution. That’s what both Clyde and KM were trying to point out to you!
From ENSO to solar activity, they are all cyclical processes which have a frequency of oscillation! They are *not* stationary.
What do you think random samples from a non-stationary data set tell you?
If that’s what they want to say they could say it for themselves. In the mean time I’ll just point out that being a frequency distribution is irrelevant to the question of taking a mean.
And it’s just bizarre that you are worried about ENSO and solar cycles when we are talking about monthly averages.
Translation: “I’ll stay safely inside my little SEM box that gives me the numbers I want to see.”
Transalation: “karlo, either hasn’t read, or understood, or chooses not to understand what I’m saying.”
What you write cannot be understood by rational, educated beings.
How would you know?
Because I’ve seen far too many of the hand-waved screeds you generate.
Now we can add to your meme of “measurement uncertainty is random, Gaussian, and cancels” the fact that you assume that all temperature measurements are stationary and not time-varying.
You are stuck in a little bellman-world and trying to lecture the rest of us on reality while you have not one clue about reality.
“Take the mean of a random sample from a population, and the uncertainty is how close that sample mean is likely to be to the sample mean.”
This is actually the SEM, it is *NOT* the uncertainty of the average. In order to use the SEM as the uncertainty of the average you have to make assumptions that simply aren’t justified for the global temperature database.
“Because for a very long time instruments could not be manufactured that had the desired accuracy and precision.”
We still don’t have accuracy out to the hundrendths digit. The field uncertainty for even the Argo floats have been found to be +/- 0.5C at best. A high precision sensor doesn’t help when the entire measurement device has this kind of uncertainty.
“what does that tell you about climate?”
It is as meaningless as an “anomaly” from a faked average using a cherry-picked time period.
In this case the reference period is one that was colder than the 1930s,40s and just happens to spread through the “global cooling” scare period.
OF COURSE IT HAS WARMED A BIT !
and THANK GOODNESS. !
Oh look, Stokes runs away from an honest answer.
“warmest global “absolute” monthly temperature (since July is already on average the hottest month each year) with a temperature 266.06 K”
It’s an AVERAGE!
What’s the variance that goes with that AVERAGE? We don’t know *ANYTHING* about the temperatures that went into that AVERAGE!
The highest global AVERAGE absolute temperature is MEANINGLESS!
Again, we don’t know if that global AVERAGE absolute temp went up because of global MINIMUM temps going up, from global MAXIMUM temps went up, or a combination of the two!
We don’t even know the SHAPE of the global temperature distribution that is used to find an average! Is it a multi-modal distribution? If so what does the average *MEAN*? Is it a skewed distribution? If so, what does the AVERAGE mean? What is the mode? What is the median? What is the interquartile figures? What is the skew and kurtosis of the distribution?
Is that published ANYWHERE? If not, why not? An average is *NOT* a valid statistical descriptor by itself. It has to be accompanied by all the other appropriate statistical descriptors in order to actually tell you anything.
Nick, you can’t possibly believe that graph is accurate. I have yet to find an individual station that has reported unadjusted data that looks anything like that graph. The CRN data has no station that matches the above graph from 2005 forward. Can you point to any individual station that matches the graph you posted?
I’m sure there will be one on a concrete roof with new air-conditioner outlets, in the middle of an ever-expanding urban jungle…
or one right next to a massively expanded runway and terminal building
or with a brand new steel shed complex built right next to it.
Good hunting Nick !
And remember.. “unadjusted” data. !
If it was accurate, just for the sake of argument, what it shows is that the Northern Hemisphere Land and Ocean have been warming, off and on, since 1880 (i.e. since records began). Is Nick going to try to blame all of that on human CO2 emissions?? I know the IPCC does…
This is a common myth. In reality the IPCC does not think all of the warming is caused by CO2 emissions. In fact, they say CO2 is responsible for only 2.16 W/m2 / 5.24 W/m2 = 41% of the total anthropogenic radiative forcing agents. I recommend reading what the IPCC actually says. You may want to start with AR6 Annex III Table AIII.3 which has a summary of the 50+ anthropogenic and natural agents that contribute to the effective radiative forcing.
Sure, they make up lots of words like “radiative forcing” that have nothing to do with normal physics. That’s not the point. It’s also not the point that the IPCC WG reports do not support the alarmism presented in the politically-generated SPM. There are two actual points here, both of which you ignored: 1) where is the human influence in Nick’s graph, taking it as accurate purely for the sake of argument as I said, because it’s obviously got nothing to do with CO2; and 2) what is the justification for the global
warmingboiling alarmism?You not thinking it has anything to do with CO2 does not justify misrepresenting the IPCC.
BTW…radiative forcing is the terminology given to the application of the 1st law of thermodynamics at the top of the atmosphere. The 1LOT is as grounded in physics as anything can be.
Radiative forcing ignores all the other factors in TEMPERATURE. Things like latent heat, sensible heat, and enthalpy.
It’s also based on an assumed average value of radiation. I have yet to read anything on radiative forcing that recognizes that radiation at night is an expnential/polynomial decay. That means that the higher the starting temp the greater the radiation at the start is. If you just use the average value of an exponential decay then you don’t get the correct total! You need to integrate the entire exponential curve to get the total radiation, not just the average multiplied by the number of nighttime hours.
Except that CO2 at TOA s mostly outwards cooling radiation.
IPCC use a bastardised understanding of 1LOT, and ignore basically everything that is real in the atmosphere.
Are you sure I misrepresented them? Substantially so? Their entire raison d’etre is to claim that recent warming is catastrophic (requiring intervention) and mainly caused by humans (which I took some poetic license to exaggerate as “all” caused by human CO2 emissions). You can complain about my poetic license, but the end result is the same, is it not?
Yes, the 1LOT is real physics; but “radiative forcing” isn’t. No radiant power (which is a real physics concept, and is the only one measured in Watts) from the atmosphere downward has ever been measured. It doesn’t exist. “Force” is a real concept too, but it isn’t measured in Watts. Radiant energy is also a real concept, and it also isn’t measured in Watts. If you try to learn your physics from the IPCC, you’re going to get very confused…
Top of the atmosphere? No one’s worried about that. That’s not where we live, and it’s just as well. No, the IPCC is trying to claim that human activities (primarily CO2 emissions) are having a major effect on surface temperatures, via this fake “radiative forcing” concept. If they weren’t claiming that, we could just stop funding them, couldn’t we?
The question remains, which you have still ignored: where is the human effect visible in Nick’s graph? How were we affecting global surface temperatures in the late 19th century?
Force and radiant energy aren’t expressions of power. That’s why they aren’t measured in units of power, such as watts.
If you are saying the IPCC says all of the warming is caused by CO2 then you are misrepresenting the IPCC.
I think there is confusion on what “radiative forcing” means. In the context of atmospheric science it is the perturbation in the energy balance at the top of the atmosphere. It is literally an application of the 1st law of thermodynamics. For example, a value of 2 W/m2 means that the internal energy of the climate system increases by 2 W/m2 * 510e12 m2 * 365.24 days * 24 hr/day * 3600 s/hr = 32e21 joules each year in accordance with the 1LOT equation ΔE = Ein – Eout.
Radiative forcing is real because the 1LOT real. Any challenge to this statement is either a challenge to the 1LOT itself or a redefinition of the term “radiative force” to mean something other than is widely accepted and established. Just know that when you see “radiative force” in scientific literature it is in reference to the 1LOT.
Yes. This marks the boundary between the climate system and space. If there is a positive/negative energy imbalance at this interface then the climate system gains/loss energy in accordance with the 1LOT.
Pretty all atmospheric scientists are understand how important
That question was not posed to me. No worries I’ll answer it now. We put CO2 into the atmosphere. CO2 impedes the transmission of energy to space causing it to accumulate in the climate system. This energy is then redistributed throughout the various heat reservoirs within the climate system including, but not limited to, the lower troposphere.
“Yes. This marks the boundary between the climate system and space. If there is a positive/negative energy imbalance at this interface then the climate system gains/loss energy in accordance with the 1LOT.”
It doesn’t mean the TEMPERATURE anywhere in the system will change. The temperature is dependent on volume and pressure. If the top of the atmosphere sees expansion/contraction the temperature can remain the same even if the radiation out or in changes.
Now, tell us all how the TOA never moves, that it is a fixed altitude.
For the atmosphere. For water and surficial materials there is also the issue of the specific heat, which impedes the increase in temperature for water.
Well, thank you for producing a definition of “radiative forcing” that doesn’t violate any known laws of physics, which I hadn’t seen before. I’ll file that away, paraphrased as “difference between energy gained and lost in a system, via radiation specifically, per unit time”. That’s certainly valid physics. But that’s not how I’ve seen climate scientists using this term heretofore. I’ll be watching closely for contradictions.
In particular, when you say “total anthropogenic radiative forcing agents”, are you referring to “sources of longwave radiant energy, particularly gases, and only the ones emitted by humans, measurable at TOA as outgoing power transferred to space, on the order of 5 W/m^2”? Where is that experimental result?
As to what the IPCC says, I certainly know they don’t blame 100% of everything on CO2. I exaggerated for effect. That should have been obvious, but I’ll be more careful in my phrasing next time. And their WGs and SPM say different things too, so you have to specify which of those two halves of the organization you are referring to. In any case, if your position is that they are not blaming the majority of recent warming on CO2, and that said warming is not and will not be catastrophic, then I agree that that statement is supported by science, and furthermore we don’t need the expensive IPCC any more, clearly.
I will quibble with this claim of yours though: ” CO2 impedes the transmission of energy to space causing it to accumulate in the climate system.” How do you know that? CO2 is an infrared-interactive gas, but it does not “trap” heat. It absorbs and emits energy in infrared wavelengths (and by other means such as transfer of kinetic and potential energy, of course). As do many other gases, such as water vapour, of which there is a lot more. That’s all we know. Everything else is conjecture so far…
You still didn’t answer the question which I indirectly asked Nick: which part of his graph is caused by humans, and why – given that human CO2 emissions did not have any measurable effect globally, per accepted conventions, before about 1950? Before then we just weren’t emitting enough of it to matter. (We still aren’t, as far as I can tell.) And if you claim that the post-1950 part is anthropogenic, and the pre-1950 part isn’t, what basis do you have for that claim?
A CO2 moleclule that is excited doesn’t “trap” heat at all. In one way or another it will lose that “exicitation”, either by radiating it or transferring it in some manner. In general the transfer of heat will tend to go UP, not down. There’s just a lot more UP space for the heat to transfer to than there is DOWN space for a molecule at altitude. The higher the altitude the more UP space there is.
iirc, the very useful charts you’ve posted a few times show methane tracking Scenario C, and CFCs tracking Scenario D.
Nicks graph is showing NOAA’s Northern Hemisphere data. CRN is US data only.
And Nick knows that it is TOTALLY FAKE. from agenda adjustments and urban/airport warming.
Pity you haven’t got two neurones to rub together to figure that out !
CRN trend matches UAH USA48.. validating UAH…. YET AGAIN.
(also balloon data is a direct match for UAH)
NOAA data is not a match to anything REAL, anywhere. !!
That is because that graph is not of an individual station. It is the NH average.
You do understand that some stations that make up the NH average have to show temperature changes greater than is shown in the graph. I challenge anyone to find an individual station that shows a trend greater than or equal to the trend in the graph Nick showed when using unadjusted data. Your comment makes no sense.
The trend in the graph from 1979-2023 is +0.26 C/decade. On the first attempt I randomly selected station CA002400600 (Cambridge Bay) and got +0.45 C/decade.
“Based on NOAA records, 1931 was the warmest year in Cambridge Bay, Nunavut history. The mean temperature for the year was -9.5 °C.”
Average Temperature in Cambridge Bay by Year (extremeweatherwatch.com)
You got three down votes for merely citing official numbers. Trolls are so funny! They made me laugh here.
I’m going to give you an up vote. 🙂
They can’t argue for their nonsense, so they just go through and push the downvote button on people they don’t like.
“The hottest temperature in Cambridge Bay, Nunavut history is 28.9 °C which happened on Tuesday, July 1, 1930.”
Be very sure you are using raw data bxxx, not some GHCN corruption. !
If there are no individual stations reporting like that, how does the average end up like that?
The same way an average of any dataset ends up not being exactly the same any one element that went into the average.
“I challenge anyone to find an individual station that shows a trend greater than or equal to the trend in the graph Nick showed”
If that statement holds true, then how can you get an average that is higher than any element in the averaged values?
That statement is not true. See my post here.
That statement is not true.
Ok. I won’t argue on that point as I haven’t looked at the data.
Would you agree simply with “an average never ends up outside the bounds of the original measurements”?
But an “average ” never ends up outside the bounds of the original measurements
Even a mathematical nonce like you must know that !
Basically EVERY station in the NH, that hasn’t been manically adjusted, has a large peak around the 1930/40s similar to the around 2000..
It is mathematically impossible for Nick’s fake graph to exist without manic data manipulation.
Yes, and the Temperature Data Mannipulators only had th written historical temperature data to work with to make up their global average temperature, and that data all showed it was just as warm in the Early Twentieth Century as it is today.
So how did the temperature profile change from what the regional charts showed, which was it was just as warm in the recent past as it is today, to the Hockey Stick “hotter and hotter” temperature profile which shows we are living in the hottest times in human history?
The Temperature Data Mannipulators included made-up, bogus sea surface temperatures into the mix and that’s how they managed to change a benign temperature profile into a scary “hotter and hotter and hotter” temperaure profile.
Below is a chart on the left showing the U.S. surface temperature chart beside a bogus, bastardized Hockey Stick “hotter and hotter” chart.
All the Temperature Data Mannipulators had to work with were surface charts that looked like the U.S. chart, where it was just as warm in the recent past as it is today.
The Temperature Data Mannipulators put this data, along with bogus date, into their computers and created the scary-looking instrument-era Hockey Stick chart.
The World has been lied to by the Temperature Data Mannipultors and it is tearing the Western World apart.
There is no climate crisis going by history.
That average tells you ZERO about what the actual temperatures were. It’s an Average subtracted from an Average. No indication of the variance that goes with the averages at all. You can’t tell if the anomaly went up from higher minimum temps, from higher high temps, or a combination.
Circulation in the lower stratosphere will bring precipitation to California.
https://earth.nullschool.net/#2023/09/27/0300Z/wind/isobaric/70hPa/orthographic=-110.00,49.94,485
I got this in my email from Merrill Lynch this morning:
Climate risk and the markets
NO MATTER WHERE YOU WERE IN JULY 2023, chances
are you felt it: It was the hottest month on record to date,
prompting a warning from the United Nations that the new
reality amounts to “global boiling.”
They have a Head of ESG Thought Leadership. Yes, Thought Leadership you read that right. It’s a good guess that other well known investment companies have similar positions in their corporate offices.
We live in interesting and depressing times.
There are too many young turds in many of these positions that think history began when they were born! They probably don’t even know anyone that lived through the 20’s and 30’s let alone some of the 60’s when it was also hot with lots of 100F days in the hay fields of Kansas.
So what they *felt* has no actual relationship to reality at all!
You can tell the “Young Turds” to look up the “Dust Bowl” some time. However if they choose Wikipedia they will find no mention of the 100°F temperatures that were common during the ’30s. Isn’t that just amazing! Maybe tomorrow Wikipedia will say something about temperature back then. (-:
For my little spot on the globe, there was a week in early July where 6 out of the 7 days set the record high for that day. One was the all time record high, 106*F.
But that was in 1936. I didn’t “feel” it.
The one daily record high that was not set in that week was set in 1881.
PS There were zero record highs set in July of 2023. There were 3 record highs set in 2023. But they were in February and March. Not considered to be “Summer” around here.
A hypochondriac will convince themselves that a headache means they have a brain tumor because they read it somewhere.
A climochondriac will convince themselves that every weather event means ” CO2 caused Climate Change is going to kill us all!” because the heard it somewhere.
Story Tip
I sure hope this isn’t correct
““The first modern GSM1 [Grand Solar Minimum] occurs in 2020 – 2053 with the cycle amplitudes reduction to 80% in cycle 25, to 30% in cycle 26 and to 70% in cycle 27 from the maximum amplitude of cycle 24.”
New Study: Earth Will Cool By 1°C Over The Next Decades Due To The Upcoming Grand Solar Minimum (notrickszone.com)
The very last thing that countries that have destroyed the reliability of the electricity networks needs, is global cooling.
Countries like Germany and the UK will be in serious trouble.
Global food production will also take a hit.
What fools the world has been with this anti-human global-warming Net-zero agenda. !!
Apparently, California had its COLDEST summer in more than a decade !
In the era of “Global Boiling”! How can this be?
Yes, everything growing in California this year was about three weeks late. My corn failed to germinate when planted in mid April, something I have done routinely for years. I had to replant in May. My solar panel output for the same period confirms the lack of sunshine.
I would also like to point out that NOAA shows a flat/slightly down trend since the beginning of 2015 for their all-months record of global temperature anomaly through August 2023.
Context matters. The media focus on NH summer is a distortion.
https://www.ncei.noaa.gov/access/monitoring/climate-at-a-glance/global/time-series/globe/land_ocean/all/8/2015-2023?trend=true&trend_base=100&begtrendyear=2015&endtrendyear=2023
Don’t get me wrong – I don’t really trust these figures to begin with, but they are NOAA’s own values showing no “warming” since 2015.
This article displays graph after graph of steadily rising temperatures. Not sure that this was intended as a WUWT self-own, but bravo.
The U.S. national graph shows what it always has – without question the era of the 1930s dust bowl period always dominates both temperatures and more importantly heat waves duration and intensity by a huge margins.
That pattern is also present in numerous other graphs including California.
None of the temperature patterns come close to matching the graph of CO2 atmospheric levels.
The phony climate alarmist hype pushing “record” high temperatures is nothing but propaganda driven climate alarmism.
Cyclical time series involving climate go clear back to when the Earth was just a pile of rocks circling the sun. There is *nothing* happening today that hasn’t happened before and the Earth is still here and supportive of life.
This is not original to me but someone else pointed out that if CO2 is pretty much evenly spread around the globe then why does Las Vegas get colder at night than Miami? If CO2 is what is blocking the Earth from radiating away heat at night and it is evenly spread then what is the difference?
Hint: what are the components needed to calculate enthalpy?
Poor AnalJ.
Still hasn’t figured out the effects of URBAN warming
SO, SO DUMB !!
USA actually had its 10th warmest summer. (in UAH)
And you can see that the “hot” areas (ie, highest anomalies) are where people aren’t !
Anomalies are not temperatures. Does it truly make much difference if the temperature changes from -30c to -29C somewhere on the globe? Or from 20C to 21C?
One of the most misleading thing about anomalies is that for global anomalies to *AVERAGE” +1C there has to be even hotter locations to balance out the locations that didn’t see any warming or incurred *cooling*. How much of the globe must average +2C or more to balance out those areas that saw no warming? That saw cooling? Where *are* these hot locations/regions? The Arctic? Siberia? The oceans? Did the Arctic warming from a -14C in winter to -13C actually change the climate there?
The sidebar helps put things into perspective.
https://wattsupwiththat.com/global-surface-temperature-comparison/
This from TFN quoting UAH, “Because August is on average a little cooler than July, the absolute temperature this month was a little cooler too at 265.92 K even though the anomaly was larger (+0.69 K vs. +0.64 K).”. I may be wrong here but that says to me that using anomalies rather than absolute temperature skews the record and shows warming where there is none.
The anomaly trick also allows them to paste the outputs of the giant models on top of each other—if they didn’t use them, the large differences in absolute temperature between the models would glaring.
That is what the chart shows, That the NH “anomaly” is caused mostly anomalous warmer than usual temperature in cold areas like north of Siberia, where no-one lives.
Maybe a bit of warm anomaly in north-east Scandinavian countries, not “hot”
So in reality, non-one in the NH experienced a summer that was anything but a little bit warmer than usual
Other than the stock market pages and the comics, there isn’t anything accurate in the LA Times anymore.
All highs are just a few degrees apart from an average high.
For a more impressive visual for laypersons…some other graph options used frequently on WUWT:
Show on a graph from lowest low to highest high…the high line would appear flat or slightly rising or within a narrow margin.
Show on a scale from average lows to average highs…the lines would again appear almost flat or within an even smaller margin.
Another way–make a statement about 1000’s of $billions spent on stopping climate change vs amount of world average temperature reduced, so far.
Another way–show a graph of CO2 rise and world average temperature (even though not real to life).
Showing the max-min ranges would reveal how utterly silly these claims about the “hottest evah” are.
They don’t even reveal the standard deviations of all the averaging needed to come up with the bogus “global anomalies”.
Here is the real temperature profile of the U.S.
No hockey stick, what a surprise.
Of max, not average, temps and that ends more than a decade ago. Good grief Tom, update your charts!
Been no warming in the USA since USCRN came on line in 2005
In fact, there has been no temperature since that 2012 spike anywhere near as warm.
2023 will end up being 2-4 degrees COOLER than that 2012 spike
Below is USA year to date.
You really do have such bad luck with your comments, don’t you..
Invariably WRONG
Well, if we are talking about how hot it is, then the Tmax charts tell the story.
An updated chart would look just the same.
Why don’t you generate an updated chart? Bob Tisdale got all his data for this chart from Berkeley Earth.
Here’s an article that tells all about it:
https://wattsupwiththat.com/2018/12/13/examples-of-how-the-use-of-temperature-anomaly-data-instead-of-temperature-data-can-result-in-wrong-answers/
And remember, Bob Tisdale says anomalies can be misleading, so use the real temperature data for your updated chart. like Bob did.
Why don’t you prove to yourself that it was just as warm in the recent past as it is today, globally, by generating a Tmax chart for every nation available. They will all show the same thing: It was just as warm in the recent past as it is today.
And, if it is just as warm in the past as it is today, with more CO2 in the air today than in the past, that must mean that CO2 has had little effect on the global temperauture. There is no climate crisis.
All the data is right there at Berkley Earth.
So we’re told that northern hemisphere had a warm summer – or – the atmosphere where thermometers and Sputniks measured it was warmer that previously recorded.
OK. Fine. That’s it. That’s weather. C’est la vie.
What is significantly missing is the reason why, or at least a coherent reason why.
What is a significant concern is that that warmer atmosphere is losing, must be losing, more heat energy to Space. There is no other reality.
Is that OK? Is that good or bad?
Did the sun shine for longer and or brighter than usual?
What caused that to happen?
Did the sun shine down on a different landscape than it has shone down on previously?
Was that landscape darker in colour – that would explain the higher temp.
Was the landscape drier than usual – that would explain the higher temp
We’re told that the ocean was also warmer than before
Again, did a stronger sun do that – why was the sun stronger
Was the ocean a different colour than before?
e.g.1 Loaded with silt and mud that had been washed and or blown off the land masses
e.g.2 ‘blooming’ with more algae and ‘stuff that grows in the water’
How did that ‘blooming stuff’ get there- compared to previously – was it fertilised in some or any way?
What about the activities of farmers and growers? Did they by any chance produce more ‘food’ than they did before.
How did they do that without using apparatus that lowers albedo, dries out the ground and raises dust?
What about foresters – did they add or remove a ‘net amount‘ of trees? if they planted trees (or windmills) did they drain any swamps or wetlands so as to gain access?
Land drainage engineers, irrigators and water-supply companies – did they add or remove water from the landscape of the northern hemisphere?
Did cities and urban areas increase or decease in either size or number
Need I continue – you see my point?
That all my ‘significant missings‘ listed above point to comprehensive, clear and coherent reasons why (observed) temperatures may have risen.
Ah, jeez. Folks putting any kind of credibility to anything the MSM(LA Times) proclaims is just ridiculous. The climate cult is getting desperate as more folks see their BS for what it is…BS.
What happened to the good ol’ predicted ice age I was warned about as a youngster? Oh, yeah, that didn’t work out too well. lol.
Without fail, whenever an air temperature versus time graph is displayed on the WUWT top level, the trendologists pop up out of the woodwork, tripping over each other trying to defend the BS of hot, Hot, Hot!, HOT!.
You are right, almost all the trendologists are here :
– AlanJ
– TheFinalNail
– Nick Stokes
– bdgwx
Give them some more time, the list will probably grow.
Nick sits in front of the computer hitting “refresh” on WUWT over and over so he can be first in line.
Nope. I just follow WUWT on Twitter.
The LA Times used to be good for dog training—you know, “go fetch”—but starting about a decade ago, my young dog refused to go get the morning delivery from the driveway due to the taste of all the sh*t it contained.
I swear, if they didn’t have the MSM and its lackeys blaring propaganda like this day in and day out, I bet the average person would have no idea that there has been a very small amount of warming since the 1880’s.
Not long ago I was talking to a retired high school science teacher. He said that one day he taught his students about US FDA allowed limits of contaminants in certain foods.
The FDA allows a very small percentage of insect parts and rat hairs to be present in certain processed foods like peanut butter. This is true.
But, many of the students went home and told their parents (and maybe swore off of PB&J sandwiches!). And this teacher got a lot of grief from some of these parents.
OK, so he did tell the truth. But the take-away here is, is this anything that the average person would need to know about, much less worry about? I’ve known about it for ages, but I still eat peanut butter.
Yes, food contamination is a real thing, but it is almost always traced back to fresh foods, like packaged lettuce, unpasteurized juices and other packaged fresh foods. But even so, in the US and other developed countries, the food supply is very, very safe and not something the average person needs to lose sleep over.
Same thing with a very mild temperature increase over many, many decades.
Me personally, I would have noticed nothing in my lifetime (I’m in my 50’s) other than the fact that the 1970’s was a very snowy decade here in central Maryland. This past summer in the same region was a typical muggy, warm Maryland summer. The past three winters have been more or less snowless, but that’s to be expected in La Nina years. It was plenty cold enough to snow last winter, just too little precipitation to make it work.
There were hundreds, thousands of record temperatures this year. The highest since 2022.
Okay, it’s been a warm summer. I’ll stipulate to that for discussion’s sake. But then why oh why has 2023 been a record LOW fire season?
Huh? I thought you boo bird Chicken Littles said warmth causes wildfires. Well, it’s been warm, so where are the fires?
Year-to-date 2,342,143 acres have burned in large fires as reported by the National Interagency Fire Center [link]. The 2023 fire season isn’t over, but it’s winding down. Compared to the recent past, this year has (or will have) the fewest acres burned since at least 2014 (3.6 mil acs) [link].
The five year average is 8.1 million acres burned. The ten-year average is 7.4 million acres burned. This year will end up with less than half those.
Wha? It can’t be! The hottest summer evah, and the fewest acres burned! Chicken Little’s head just exploded. Somebody get a mop.
“Well, it’s been warm, so where are the fires?”
Global warming. They have moved on to Canada.
Biggest wildfires in Canada were in the 1930s.
Please cite data for Canada’s greatest wildfires being in the 1930s. Meanwhile, rightwing-cited data saying US wildfires had a huge peak in the 1920s & 1930s is flawed by counting prescribed burns as wildfires until sometime in the 1940s: https://ti.org/antiplanner/?p=15127
What is your evidence for “rightwing-cited data saying…”?
If they disagree with the climate crew, then they must be right wing.
In the 30’s Canada didn’t have a large enough population to even know how many wildfires it had! You only know today from satellite imaging!
Please tell us what the difference is to the climate between a controlled burn and an uncontrolled burn.
So Canada warmed while the US didn’t?
Ummmm…..
So 40 milli-Kelvin air temperature difference averaged over the entire planet caused large forest fires in Canada?
Is this what you are claiming, Stokes?
“They have moved on to Canada.”
You mean WHERE IT IS COLDER !!!
You really must luv chewing on your feet.
Constantly with both feet in your mouth !!
When given a choice between being accurate and pushing the DNC agenda, the LA Times will always pick loyalty to the party.
The Earth is still coming out of the Little Ice Age which lasted into 1850. The Earth is still in a 2.56 million-year ice age named the Quaternary Glaciation with 20% of the land still covered in glaciers and permafrost.
Reality sucks for alarmists.
The contiguous US is not the world. A good example of the CONUS not being the world is the UAH map of TLT anomaly for June 2023: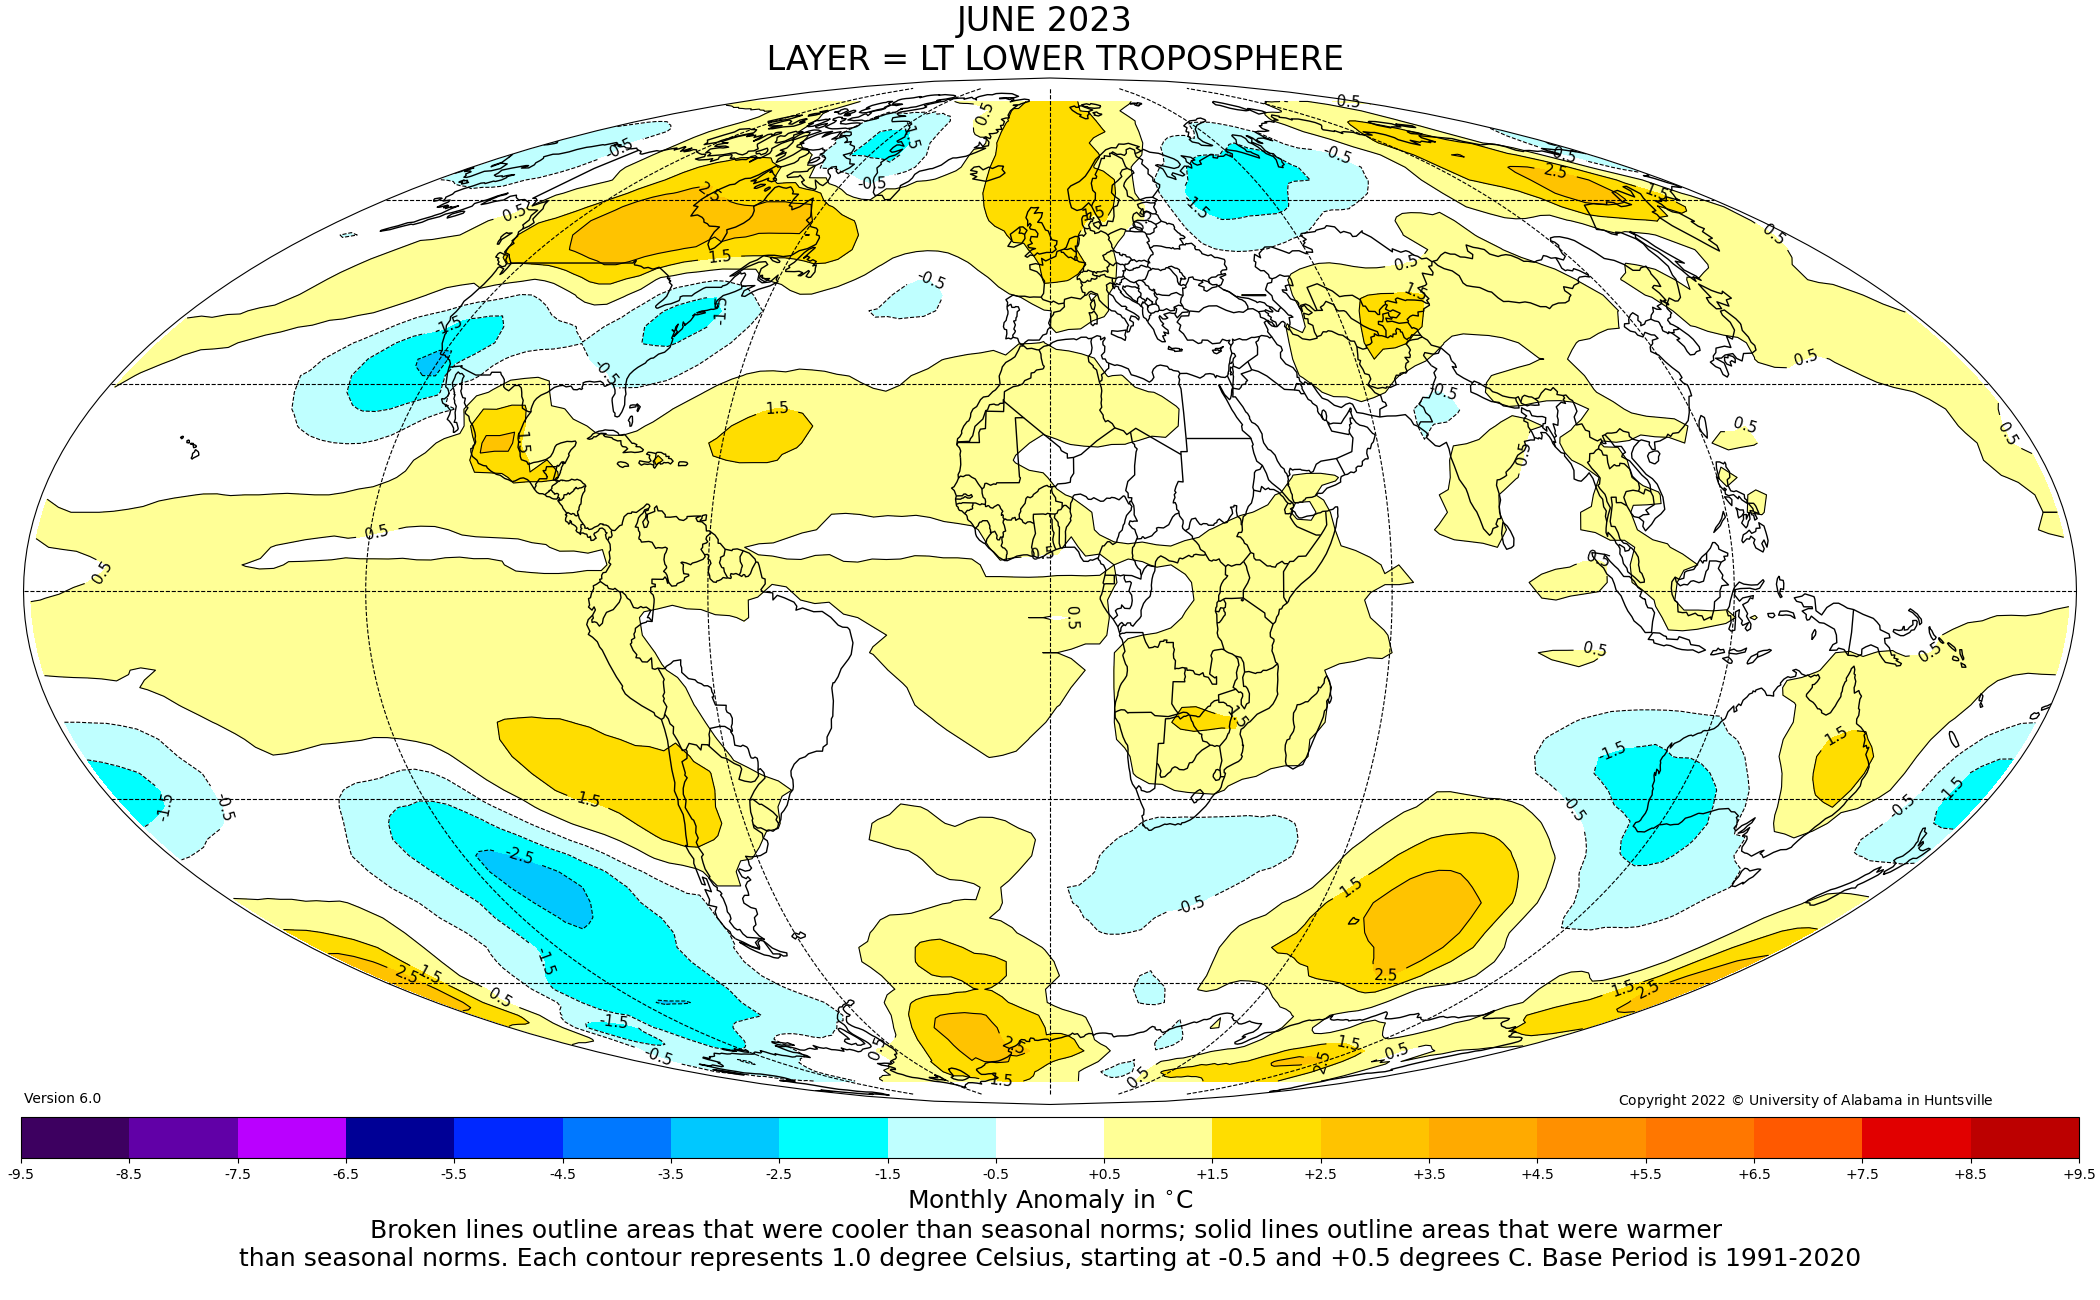
The US is a LARGE land mass spanning a huge longitudinal interval with a large variance of terrain, geography, and latitude. If the warming is truly GLOBAL, and is caused by a gas that is supposedly well distributed in the atmosphere then CONUS *should* be a large enough sample (especially with the measuring network it has) to see the global warming.
Much of the warming that you show is in the oceans or the high latitudes. It doesn’t take much warming in the Arctic to create an anomaly that is really meaningless when it comes to CLIMATE. -30C is hardly distinguishable from -29C as far as climate goes but it is a whole 1C anomaly!
There is a huge area of warming off the west coast of South America – yet most of South America shows no warming at all! So how does that warming ocean affect the climate? It’s not apparent that it does much at all!
The map shows Canada with a warming anomaly but there is no way to tell what that has done to the climate in Canada since there is no base on which to judge. A change from 19C to 20C is an anomaly of 1C but would actually have little impact on the climate in Canada.
Anomalies are misleading as all get out! You can’t judge anything from an anomaly. You don’t even know the variance that goes along with that anomaly since you don’t know the variances of the elements involved in creating he anomaly.
Now, come back and tell me that *you* can tell the difference in climate between a summer average of 90F and 91F!
For the climate alarmists (that would be all of them, they are all alarmists) this just falls into the “fake but accurate” category, because they know in their hearts this is what is happening, it’s getting hotter and we’re all going to be broiled alive by CO2…
You can’t use reason and logic and facts to argue someone out of a position, that they didn’t use reason and logic and facts to get into.
To put things in perspective, where I live In Oklahoma, it gets very hot every summer. It is to be expected.
The record for 100F days or over in my area is about 65 days, with high temperatures reaching up to 120F.
This year we had 20 days of 100F or over, and the highest air temperature was about 105F.
So as you can see, it was not even close to be an excetionally hot summer around here, and I think in this year’s case, that would apply to just about every State, outside of the desert southwest U.S.
Same for Kansas. It’s called WEATHER. Some summers are hot, some are cold. Some winters are cold, some are not. It’s weather. The hot/cold are driven by weather systems, where do stagnant high pressures set up, where do low pressures travel. I have yet to see a good theory tying CO2 to how the weather sets up each year, it’s all “averages” of a cyclical time series which utterly hide the maximum and minimum temps. They don’t even include the variances of the average values so one can judge how uncertain their average *is*.
“I have yet to see a good theory tying CO2 to how the weather sets up each year”
There is no such theory, as far as I know. The alarmist claim is the CO2 warming will cause changes in the way the Earth’s weather unfolds, but they don’t provide a mechanism for how this would be accomplished. The alarmists are simplistic: More warmth equals extreme weather to them.
The alarmists talk like we are experiencing unprecendented warming today so they attribute every unusual weather event as being caused by this unprecedented warming, but the problem with that is we are not experiencing unprecedented warming. We have been here many times before. And in fact, the United States, to name one, has been in a temperature downtrend since the 1930’s, so the unprecedented warming and any consequences there from do not apply to the United States.
Without the bastardized global temperature record, the climate change alarmists would have nothing to say, and nothing to show as “evidence”. Everything they do is based on the bogus, bastardized “hotter and hotter” global tmeperature record. It’s all they have, and it’s all a fraud.
At the core, climate science is anti-intellectual.
Statistically the global average temperature is a farce. No variances, no standard deviations, no skewness, no kurtosis, no mode, no median, and no interquartile figures at all, from the very bottom of the mid-range calculation to the very last average calculation. The SEM is substituted for the actual propagation of uncertainty. The entire database is treated as multiple measurements of the same thing using the same instrument under the same environmental conditions so the meme “all uncertainty is random, Gaussian, and cancels” can be used to ignore any uncertaintty.
Add the diddling with the temperature figures and none of it is worth the paper it’s written on.
Here in Colo. there was just one day over 100F this summer.
But the Thames is boiling!
And the oceans!
Nothing like a good dose of climate reality to bring the trolls out.
Like this:
It has warmed up since the Little Ice Age. That should come as no surprise and is a good thing. It is still pretty cold. The Earth is still in an ice age named the Quaternary Glaciation until all natural ice melts, 20% of the land’s surface is still either covered by glaciers or is permafrost.
Not according to Slimon above with his cute little flat-T graph.
The claim and the headline by LA Times is that this summer was hottest on records in the northern hemisphere. This WUWT article has its headline falsely claiming that LA Times made this claim for the US. This WUWT article then goes on with data for the US as if to knock down the strawman of its false headline. And then this article goes on with data for subsets of the US, and alltime peak temperatures (as opposed to entire summer temperatures) in specific locations in Canada (with the top 5 being set in 2021), while these don’t refute the LA Times claim of summer 2023 being warmest on record in the northern hemisphere.
As for ““But in Britain and the United States, global records go back to the mid-1800s, and the two countries’ weather and science agencies are expected to concur that this summer has been a record breaker.”: The US and Britain have the meteorological agencies that have these global records going far back (NASA GISS, NOAA, CRU of UEA, Hadley Centre). Meanwhile, the JRA-55 global dataset by Japan agrees with these throughout as far back as JRA-55 goes which is 1958, well before the big modern warming.
So where was all the heat that overcame the U.S.?
“Fevered” dreams, maybe?
They are all based on the corrupted data of GHCN and use the same corrupt agenda-devised methods of fabricating their imaginary temperature series.
When claims were made for the Medieval and Roman warm periods, the complaint was made that they were local to Europe and didn’t represent a global condition. That has pretty much been disproved. Now the question is, was the Northern Hemisphere warming exclusive of the US, and only regional, or did the US share in the claimed record warming? That is, how do you make a claim for ‘unprecedented’ NH warming if it doesn’t include the US?