By Christopher Monckton of Brenchley
In November 2015, just before the faithful gathered around their capering, gibbering witch-doctors and shamans in Paris for the New Superstition’s annual festival of thanks and praise, hugs and back-slapping, the Inconvenient Pause lengthened to 18 years 9 months. One-third of Man’s entire influence on climate since the Industrial Revolution had occurred since February 1997, yet on the then RSS dataset the 225 months since that month had shown no global warming at all (Fig. 1).

Figure 1. The least-squares linear-regression trend on the RSS version 3.3 satellite monthly global mean surface temperature anomaly dataset showed no global warming for 18 years 9 months since February 1997, though one-third of all anthropogenic forcings had occurred during the period of the Pause.
The accidental delegate from Burma had provoked shrieks of impotent fury from the congregation during the final benediction in Qatar in 2012, when he had said the Inconvenient Pause had endured for 16 years. Almost three years later, the Pause was almost three years longer. Senator Ted Cruz, chairing a Senate committee on global warming, waved Fig. 1 at the “Democrats” in the Chamber, to their discomfiture.
Then came the naturally-occurring el Niño of 2015/2016, ending the Pause. But there stood the Pause, still on the record-books, a standing indictment of the profiteers of doom and their inept climate models’ half-baked but overcooked predictions of rampant warming followed by a lurid catalogue of plagues of which the Psalmist at his most excitable would have been proud – except that they did not occur.
At the time I made a prediction of my own. I said that Dr Karl sMears of RSS, whose dataset had shown the Inconvenient Pause but who publicly derides those of us who ask questions about the Party Line as “denialists”, would soon allow the Party to prevail upon him to announce that the Inconvenient Pause was a mistake and that he would thereafter airbrush it away by some a of statistical prestidigitation.
Sure enough, the very next month he announced that the RSS dataset was going to be revised. Version 3 was no longer Politically Correct. All hail Version 4, which has recently become available. To see the extent of the tampering – er, make that “revision to allow for the previously-unheard-of phenomenon of orbital decay in the satellites”, Comrade – I plotted the 18 years and 9 months of temperature data from February 1997 to October 2015 using the new RSS data. Fig. 2 is the result.

Figure 2. Same period as Fig. 1, but this time using RSS v. 4.0 rather than v. 3.3.
Hey presto! No more Inconvenient Pause! All gone! Vanished into thick air! Just like that! Amazing! Zowee! Look! A quarter of a degree of global warming where there was none before! It’s worse than we thought!
Except that it isn’t. In 1990 the IPCC had predicted global warming from 1990 to 2025 at a rate equivalent to 2.8 K/century. But the RSS warming rate over the 18 years 9 months of the Airbrushed-Out Pause, according to the new and exciting data approved by the Politburo, is equivalent to less than half of IPCC’s originally predicted central rate.
We Want More Orbital Decay, And We Want It NOW! A rate of warming equivalent to little more than 1 degree per century is not enough. The Party has published many books saying there will be 6 degrees of warming, and some papers predicting up to 13 degrees. The RSS dataset still does not conform to the Party Line.
Now, one might think that RSS, an outfit whose sole task is to gather data from satellites, would know something about – er – as it were – satellites. These days, it’s not particularly difficult to adjust for orbital decay in real time using the GPS satellites, which by their nature must constantly correct themselves for it.
But the RSS team would now like us to believe they made no adjustments for orbital decay until recently, so that the Pause was really – really and truly – cross my heart and hope to die – trust me, I’m a climate scientist with a Party badge an’ all – an artefact of the slow decline in the altitude of satellites in orbit. As we say down the pub, “Pull the other one, squire – it’s got bells on.”
One might also think that the journal that published the sMears paper radically revising one of the two satellite global-temperature datasets would have taken the trouble to get the controllers of the other satellite dataset – John Christy and Roy Spencer of UAH – to peer-review it.
Roy Spencer had predicted the apparat would not do that. He was right. The apparat didn’t. John and Roy have dared to question the Party Line – politely, scientifically, and continuously. Therefore, they are Unpersons who do not – or, even if they do, should not – exist. Only one viewpoint is permissible – the Party Line. So they must not be consulted but insulted (and even shot at).
The orbital-decay ploy is not even new. Some years ago, while a leading climate scientist was putting the finishing touches to a paper showing a low climate sensitivity, he sent me a copy of the draft and I noticed that, since he had begun work on it, a new series of the satellite data on which he had hoped to rely had been published, making large ex-post-facto adjustments for “orbital decay” – which, however, proved insufficient to undermine the draft.
Frankly, it’s time for this unprincipled Humptidumptification of climate science to stop. The data are rewritten again and again until they mean whatever the Politburo want them to mean. Numerous climate datasets, now including the RSS dataset, have been tortured and contorted so often to force them into ever-less-plausible conformity with the Party Line that neither they nor the Party Line any longer possess any objective credibility whatsoever.
Let us end by looking at what really happened to global temperature during the Inconvenient Pause. Fig. 3 shows the UAH curve for the same period as Figs 1, 2.

Figure 3. The UAH record over the 18 years 9 months of the Inconvenient Pause
Looks pretty close to a Pause to me. Down the memory-hole with it, Comrades!
It is also worth looking at the entire run of satellite data for the 38 years 1979-2016. Fig. 4 shows RSS, using the latest version of the dataset; fig. 5 shows UAH.

Figure 4. The recently-revised RSS dataset from 1979-2016

Figure 5. The UAH dataset from 1979-2016
RSS now shows a warming almost 50% greater than the UAH warming.
Where stands the truth? You pays your money and you makes your choice: but, after the numerous alterations to the tamperature datasets, three points are clear.
First, on most of the global-temperature datasets, much of the warming of recent decades was not evident in the raw data and has been created by ex-post-facto manipulation of the data – whether for good reasons or bad. That raises the legitimate question whether our observational capacity is sufficiently reliable and sufficiently well resolved to provide useful illumination of the question whether our very small perturbation of a very large atmosphere will have a very small or a very large influence on future global temperature.
Secondly, no Inconvenient Pause will ever again be allowed to show in most datasets, even if there is one. Some parameter or another will be Karlamelized after the event, and numbly acquiescent pal-reviewers will check it not for scientific merit but simply for conformity to the Party Line, whereupon they will wave the paper through.
Thirdly, the rate of global warming, even after the ever-upward temperature tampering of almost all datasets (only UAH has gone the other way), is a lot less than predicted. RSS, having previously showed just 0.36 K global warming since 1990, now shows 0.52 K, near-coincident with IPCC’s least prediction made in 1990, but still well below its central prediction and a very long below its high-end prediction. In reality, even after the tampering, it’s a whole lot less bad than we thought.
Table 4 Observed and predicted global warming (K), 1990-2016
| Source | Observations over 27 years 1990-2016 | AR1 predictions | ||||||
| Dataset | RSS | NCEI | Mean | HadC | UAH | Min. | Mid | Max. |
| Linear trend, 1990-2016 | 0.52 | 0.53 | 1.13 | |||||
| Centennial equivalent trend | 1.91 | 1.94 | 4.17 |
As Fig. 6 shows, even after all the tampering, the mean warming rate among two terrestrial and two satellite datasets continues to be somewhat below IPCC’s least medium-term prediction made in 1990. Yet IPCC, though in its Fifth Assessment Report it has near-halved those medium-term predictions, has unaccountably left its longer-term predictions unaltered: for otherwise it would be apparent to all that the real-world temperature data are turning the climate scare into a non-event.

Figure 6. Mean of the NCEI, HadCRUT4, RSS and UAH datasets, 1990-2016,
vs. IPCC medium-term warming predictions in 1990.
Regular readers will notice that I have been largely absent from these pages in recent months. This is partly owing to illness, and partly because I have had my head down working on a paper that identifies the chief reason why the rate of warming shown by the untampered data is so much less than what IPCC had predicted with “substantial confidence” in 1990.
The draft paper is now out for review. If the reviewers find sound reasons for rejecting it, I shall not trouble you with it further. But my team has gone to uncommon lengths to verify our conclusions, including consulting the world’s foremost expert on the application of the relevant physical formulism to the climate and getting our understanding of the theory confirmed empirically by experiments conducted at a government laboratory.
If our paper is published, and if the wider scientific community finds little of substance to cavil at, it will mark the end of the global-warming scare.
Well if you anticipated that data would be fiddled why did you not use UAH which was maintained by serious, reliable scientists?
Well because you preferred RRS because it showed a marginally longer pause. You now get the karma of picking RSS , not for it’s metit or rigour but because you liked the result better.
Typical disingenuous political choice.
So the statement made in 2015 precludes the previous several years’ use of RSS? Typical Progressive Projection Syndrome. Oh, and disingenuous chronology.
The reason for prior use was presumably the same as it continued use in 2015.
BTW what makes you think I am “progressive” ? Is that your stock response to everything which does not follow your own “party line” ?
Roy Spencer:
https://wattsupwiththat.com/2017/07/07/comments-on-the-new-rss-lower-tropospheric-temperature-dataset/
Actually Greg, Chris chose RSS because it was “acceptable” to the establishment. UAH is not nor will be until those 2 denihilists retire and are replaced by “proper” scientists.
I always found it reassuring that the warmist’s extraction was cooler than the skeptics’ extraction. That was somehow reassuring that both were being fairly honest scientifically, though using different techniques to get their results. That was one of the few good points in the whole dataset landscape.
Ironically is was Monkton’s focus on RSS that resulted in Mears being bombarded by calls demanding to know if it was true that his data showed this and pressure to “correct” it. He caved in.
Had he use UAH, there would have been less pressure and it would have been resolutely ignored.
Anyone who did not like the result could then be referred to the warmist’s data which showed an even longer pause : do you prefer that??
Sadly it will now be difficult for him to switch to using UAH without it being derided as a convenience move to the new least warming dataset. IMHO, he should have going with UAH initially even though it was marginally warmer.
Who is “Chris ” , a mate of yours?
“until those 2 denihilists retire and are replaced by “proper” scientists.” That means someone who agrees with your world view, I take it. It surely has nothing whatsoever to do with science.
Talk about fixation.
Can you back your claims up with proof? Say emails listing Lord Monckton as the cause?
Or do you obsess about Monckton endlessly too?
” it will now be difficult for him to switch to using UAH without it being derided as a convenience move”
Not really. All he has to do is to point out the corruption of the data by Mears. Decision fully justified.
8/9 of the first posts on this thread by one person.
Creepy.
Shades of Oliver Manuel and the iron sun – remember him?
The obvious reason Christopher Monckton didn’t use UAH for his pause grahs is that when he started UAH was showing more warming than RSS.
His claim in March 2014 would have had to be that there was no warming for 5 years 7 months. Rather less dramatic than no warming for 17 years 6 months.
I imagine Monckton had an idea about Mears character from statements he had made about AGW and that it was only a matter of time.
Greg,
It is possible he used that data set because it was run by known warmist Frank Mears?
He did say that originally they were nearly the same before the bogus adjustments were made,chose RSS as the point for his position.
Greg, the hallmark of CM’s analyses has been and is the brilliant strategy of using the climateers’ own data, fudged as it is, to show they are still hugely over hyping a non problem. This clever gentleman is the one who publicized worldwide, using the absent member from Burma’s microphone at the Doha meeting of the IPCC to tell 25000 delegates in 2012 that a pause of over 16yrs was in progress. It was already beginning to niggle the faithful but they chose to ignore it until then.
The dreaded PAUSE became palpable and its implications led to a new mental illness that became known as the Climate Blues. This was serious enough that a number of prominent plus lesser warm proponent scientists actually dropped out of their careers, never to be heard from again! One a a debunked butterfly expert and a colleague a frog/Toad expert who reported the extinction of the Golden Toad from climate warning. Both the butterfly and the Toad are respectively flitting and hopping I, but, alas their experts are no where to be found.
Greg, a great psychological experiment is being performed by nature. The interesting clinical trial being performed is to see who are the most disillusioned hangers on at the end of this CAGW construct. Greg, this is a heads up for you!
“Greg, this is a heads up for you!”
Like ohters it seems that for you it is sufficient to criticise CoB to become automatically a warmist, “progressive” or something else on your black/white world of climate science.
I’m highly sceptical that AGW is anywhere near being problem and am unconvinced that it is even detectable or distinguishable from natural variability in any reliable way. That does not make me an automatic fan of CoB. I did like the Burmah rep trick, I have to admit. Very quick thinking.
Please; To all the commenters remember if the graphs were rounded to 1 degree they would be a straight line.
That where all this talk goes out the window for the average person.
Of course it adds credibility to use an alarmist’s data set that shows a Pause. Unfortunately, Mears couldn’t handle the trolling. Hard to get invited to alarmist dinner parties when Monckton is using your dataset.
Interesting. Is that another possible reason for hiding data? You’ll become an outcast if some nasty skeptic is using the dataset? I can believe it.
So you now let Monkton write an article. This man is a liar. He claimed for a number of years he was a Lord, complete and utter lie, where are his ethics? He lied about that what else is he lying about?
steve:
The Third Viscount Monckton of Brenchley is a Lord; i.e. he is a peer of the British Realm.
It is NOT a lie for him to mention his status even when anonymous trolls lie about it as you have.
Richard
richardscourtney, here in America we laugh at all “titles” of nobility. Furthermore we also laugh at “Lords” that claim to have cured AIDS:
steve just announced to the world, that “steve” is without honor, tells lies at every chance and has dreams about his Lordship Monckton.
Where are your ethics steve? Have you ever demonstrated ethics?
Luis Anastasia:
Steve lied and smeared: it is a fact that Christopher Monckton is a Noble Lord.
And here in the UK we regard with contempt those who “laugh” at cultures other than their own.
Richard
steve, Lord Monckton is definitly a Lord. What he isn’t is a member of the House of Lords which he has claimed to be in the past.
Bellman:
Lord Monckton does not have a Seat and does not have a right to vote in the House of Lords. But Lord Monckton most certainly IS a Member of the House of Lords which is he is entitled to stand in the elections of the Heriditry Peers which are held to decide which of their Members can fill vacancies for the limited number of them with Seats and voting rights in the House.
It would require HRH to repeal the Letters Patent of Lord Monckton for his Membership of the House Of Lords To be revoked.
I am not alone in my disdain for anonymous trolls who try to deflect attention from information they cannot refute by using lies in attempt to smear the provider of the information.
Richard
Richard
“But Lord Monckton most certainly IS a Member of the House of Lords which is he is entitled to stand in the elections of the Heriditry Peers which are held to decide which of their Members can fill vacancies for the limited number of them with Seats and voting rights in the House. ”
Sorry. I wasn’t trying to troll. I thought it was common knowledge that he was not a member of the House of Lords. This letter seems to suggest that parliament thinks he isn’t
http://www.parliament.uk/business/news/2011/july/letter-to-viscount-monckton/
“I must repeat my predecessor’s statement that you are not and have never been a Member of the House of Lords. Your assertion that you are a Member, but without the right to sit or vote, is a contradiction in terms. No-one denies that you are, by virtue of your letters Patent, a Peer. That is an entirely separate issue to membership of the House.”
If you have evidence that this position has changed I’ll withdraw my claim.
“And here in the UK we regard with contempt those who “laugh” at cultures other than their own.”
Good reply, Richard.
Richardscourtney, here in America, we trashed your nobility over 200 years ago. Your class structure still is hilarious.
Bellman:
The opinion of some flunky does not and cannot alter the fact that HRH has NOT revoked the Letters Patent of Lord Monckton which decree he IS a Member of the House of Lords and, therefore, he is entitled to vote for and to stand for Seats in the House of Lords.
Richard
It’s not some flunky who makes the law, it’s the House Of Lords Act of 1999:
“No-one shall be a member of the House of Lords by virtue of a hereditary peerage.”
Has Lord Monckton ever claimed he has the right to vote in the HoL? I thought his claim was that he had some sort of right to claim to be a non-voting member of the HoL.
“Therefore, Lord Monckton remains a Member not only of the Peerage but also of the House of Lords, save only that he cannot for now sit or vote there, and he was and is fully entitled to say so. ”
http://www.lordmoncktonfoundation.com/blog/view/319/ye_olde_chestnut_returns___is_lord_monckton_a_member_of_the_house_of_lords_
(This “Lord” argument is old and off topic) MOD
“And here in the UK we regard with contempt those who “laugh” at cultures other than their own.”
I agree; I do openly sneer at cricket, however.
MIchael Mann- nobel prize?
That’s sMears.
“Well because you preferred RRS because it showed a marginally longer pause. ”
Or he wanted to point out that one estimate of average global temperature anomalies (which is never measured but reconstructed from data with choices made as to the best way to do it) by a group that were not “deniers”, showed a very long pause.
The facts are that the results of their calculations were what was published. They are not necessarily what you would obtain yourself it you were to do a proper job.
(Greg July 7, 2017 at 8:15 am)
Maybe Lord Monckton uses it like I use RSS, because they are a site with known CAGW leaning tendencies, but until just recently they reported relatively unmolested data. Therefore, it might be of more use to convince go along with the 97% consensus people. If you doubt me read their Climate page to see them squirm and refer to Ben Santer’s many publications, but still have to report data which disagrees with what they believed. At least they had a little bit of “integrity”, until now.
They no longer squirm, they just changed their climate page completely to agree with CAGW, or least get their plots in the ballpark. Maybe, there is no hope for science or civilization. The Progessives will just make you swear black is white, or they will kill you.
Greg if you ever made the naive decision to believe there’s unFAKED data filling EVERY dataset – you need to read the file calLed ”HarryReadMe.txt”
that makes it perfectly plain: ALL these datasets that the CRU or NASA or NOAA ever get their hands on,
are ”product.”
Not data.
There IS no global data.
HarryReadMe.txt astonishedly revealed: it’s ALL been trashed and more than HALF made up at ALL times.
Peace on yas.
I would very much like to see the data that shows the effect of orbital decay, I am completely skeptical as to its effects on magnitude in measurements. Orbital decay is real, however unless your satellite was initially placed in a poor orbit it is not that much of an issue unless you are concerned about your satellite’s discontinued function in about 50-100 years.
Also, orbital decay obviously means the altitude gets lower, which I would think would induce an artificial WARMING in the measurements. So, I’d expect the adjustment for orbital decay to be in the opposite direction from what they did.
Obviously I’m missing something. Anyone want to explain this?
Hi Mike, Check out Roy Spencer’s website. He emphasizes that the satellite will measure the temperature of a given location at a different time of day as the orbit decays. That seems to be what the adjustments are intended to correct for. I am not pretending to understand all of this however.
Hope you are doing well, Karl
Just off the top of my head, it seems that unadjusted orbital decay would produce a slightly warmer reading, and that adjusting for it would cool the data, the opposite of what RSS has done.
As the satellite drifts lower, it moves closer to the source of the microwave radiation it measures, and gets a stronger, warmer reading. Intensity decreases by the square of the distance, but I think the distance here runs from the center of the earth since the radiation is moving radially outward from a layer of atmosphere, not a point source. The change in satellite altitude from decay would be measured in hundreds of feet, so the adjustment should be small.
Just a guess.
All this will be clearly explained in Christy’s papers since UAH also take account of orbital decay. This was one of the earlier correction after the technique was developed by Christy/Spencer.
I can’t comment on the mechanism but you can be sure that they did not get it back to front.
I think this paper is one that explains how they attempt to correct for orbital decay:
http://www.remss.com/papers/MSU_Nature_Article.pdf
It is reference [6] in the Wikipedia article about the UAH satellite temperature dataset. I’m not going to try to explain this in any detail since I’m not sure I fully understand it. What I did manage to grok is that they cannot directly measure lower-tropospheric temperature using sensors on-board the satellite. One might be justified in calling the result an estimate rather than a measurement.
A fair bit of mathematical torturing of the raw data is required to arrive at the lower troposphere temperature estimate. Part of this involves subtracting one temperature that warms as the satellite altitude decreases. It is this subtraction of a warmer temperature that causes the lower troposphere temperature estimate to cool as the oribt decays.
I don’t have an opinion one way or the other as to whether these adjustments are valid — I’m just attempting to explain why their fix for orbital decay causes a warmer estimate for lower troposhperic temperatures.
wxobserver,
That paper may describe previous adjustments. RSS released the FAQ below describing the changes to RSS V4.0.
FAQ
http://www.remss.com/blog/faq-about-v40-tlt-update
Paper Abstract ( link found in FAQ – Paper is paywalled.)
http://journals.ametsoc.org/doi/10.1175/JCLI-D-16-0768.1
A previous paper from 2016 describing the methods used (link found in FAQ – not paywalled)
http://journals.ametsoc.org/doi/10.1175/JCLI-D-15-0744.1
Satellite Crossing Times
http://www.remss.com/support/crossing-times
From the FAQ:
– “The biggest effect of the adjusted diurnal cycles is to reduce the amount of adjustment made to NOAA-15 as its equatorial crossing time drifted from about 7:30 in 1998 to about 4:00 in 2010….Of course, changing the diurnal correction also changes the results for all the other satellites, but the largest effect was for the time period when NOAA-15 was drifting rapidly (1999-2007), both because of the time of day that is was operating, and because of the lack of other co-observing AMSU satellites (prior to the launch of AQUA).”
Why would you make adjustments to all of the satellites based on the one with the most rapidly changing diurnal times?
– “We also found anomalous behavior for NOAA-18 at the beginning of its mission. The periods excluded in V4.0 are: ….NOAA-18: Excluded before Jan 2009“
So, data from NOAH-18 was bad for the first four years of operation until, suddenly in 2009, it was good.
– THE FAQ contains charts showing raw data, two levels of intermediate adjusted data, and final, “optimized” data. I don’t know how to insert the graph here but it is definitely worth a look on the FAQ. The charts show how the data was
tortured into submission“optimized”.From the 2016 Paper:
– “The derivation of long-term trends in tropospheric temperature from satellite observations requires that the diurnally varying component for the observation be removed….Ideally, we would like to use a highly accurate, independent source of atmospheric and surface temperature specify the diurnal cycle. Unfortunately, no such data are available.”
Huh? I thought the surface temperature record was ‘settled science’.
Any adjustments (satellite) that may be necessary should match the balloon data set for final calibration.
RSS now rejects radio sond data sets as the only independent long term non-satellite Lower Troposphere data.
I know I would like to see the data and the algorithm they used to ‘correct’ the RSS data. I’m still waiting for the same from NOAA in regards to their last ‘adjustment’ of temperature data showing the past was a lot colder than had been reported and therefore making the present appear to be much warmer, increasing the slope of the temperature change.
Orbital decay affects the orbital period. You had better know that extremely well or you will not be able to talk to your bird since your along-track position estimate error will grow with time. If the data collected was not tagged with the current ephemeris, the entire group needs to be fired. At 7 km/sec, could you even place the data without an extremely accurate set of positions and quaternions? Utter BS or massive negligence.
“you can be sure that they did not get it back to front.”
http://woodfortrees.org/graph/hadsst3nh/from:1885/to:1940/plot/hadsst3sh/from:1885/to:1940/plot/hadsst2nh/from:1885/to:1940/plot/hadsst2sh/from:1885/to:1940
Could rant on but let’s face it, it’s all crap.
Figure 2 appears to extend beyond the El Niño event of 2015-16, while Figure 1 ends just at the start of that event. What would the warming rate be in Figure 2 if it ended at the same place as Figure 1?
I noticed the caption says they are for the same period, but fig 1 and fig 2 do not cover the same period one ends 2015 and one ends 2016, this needs to be corrected as they are a central tenant to the article.
Tenet, not tenant.
Climatus scientists and their toadies are peeved by the Inconvenient Pause (aka climatus interruptus) because while CO2 levels have become elevated and remain firm, the earth isn’t being screwed.
IMO these people are seriously disturbed. Here’s a case in point. This guy is so strung out on climate p.orn (orgas.mic delight caused by weather disasters/extreme weather events) that he is actually sad that a tropical depression is not going to become a tropical storm. You can’t make this stuff up.
“Update: Tropical Depression Four is now even less likely to become Tropical Storm Don. Sad!”
https://twitter.com/EricHolthaus/status/883080175587557377
He should probably go see a counselor for that affliction!
Oh, wait a minute!
https://wattsupwiththat.com/2017/01/09/eric-holthaus/
Thanks, I did not realise that it was tropical depression he had after listening to Trump. Makes sense. 😉
I thought Margaritas cured tropical depression
Not only can margaritas cure tropical depression, they are highly effective against mid and high latitude depressions.
Margaritas don’t cure depression. They might temporarily suppress it, but it can return with a vengeance, along with a severe headache the next morning.
A real Margarita is highly alcoholic, plus partakes of whatever active psychedelic ingredient comes from blue agave. It’s made from three parts 100% pure blue agave silver tequila (not reposado or anejo), two parts Cointreau (or other orange liqueur; Triple Sec is not only cheaper but IMO better) and one part Key Lime juice. IOW 5/6 high proof alcohol.
In bars, they mix 50% blue agave “tequila” (the rest ethanol from sugar) with a nonalcoholic concoction.
So much attention to the temperature record and so little to the real substancee of AGW which poposes a causal chain reaction of emissions to changes in atmos co2 and from there to warming all at an annual time scale
https://papers.ssrn.com/sol3/papers.cfm?abstract_id=2997420
Jamal,
While you never discuss any objection against your theorical approach, again here my comment for other readers…
The IPCC carbon budget concludes that changes in atmospheric CO2 are driven by fossil fuel emissions on a year by year basis.
The IPCC never said or implied that. Their carbon cycles are rough estimates of averaged seasonal to year by year carbon fluxes within wide margins of error and year by year variability.
Changes in the atmosphere are driven by human emissions at one side and variable sinks at the other side, which in average are driven by the total CO2 level above steady state for the current ocean surface temperature (not the human emissions of one year) and which variability in sink capacity is largely dependent on the influence of temperature variability on (tropical) vegetation and to a lesser extent ocean surface temperatures.
A testable implication of the validity of this carbon budget is that changes in atmospheric CO2 should be correlated with fossil fuel emissions at an annual time scale net of long term trends.
The variable changes in atmospheric CO2 don’t correlate with emissions, they correlate with temperature changes with a lag, because all what you test in the derivatives is the “noise” around the trend, not the cause of the trend itself.
The noise in the year by year changes is not more than +/- 1.5 ppmv around the trend of 90 ppmv.
Thus while temperature is responsible for almost all variability around the trend, you have not the slightest indication what caused the trend itself. That is anyway not by the same process (vegetation) which dominates the variability, as vegetation is a net, growing sink for CO2…
Nonsense.
http://www.addletters.com/pictures/bart-simpson-generator/bart-simpson-generator.php?line=Nonsense
Ferdinand,
A blogger Willb01 at Climate Etc noted a few days ago, re the annual oscillation in CO2 Mauna Loa “How do you know the decline is not a result of the SH winter cooling the oceans, perhaps increasing their ability to sink CO2?”
I thought this a good alternative hypothesis to the uptake/release of CO2 by plants. What do you think? Is it excluded or possibly ok?
Geoff
The sad truth is we datasets adjusted multiple times. Are they that incompetent they can’t get it right over and over again?
It was always numbers calculated from the data. The satellites don’t measure temperature, they measure radiance in wave bands. Temperature is now and always has been a number calculated from the data since band intensity would be a fairly pointless thing to report.
In other words, “synthetic data” … still not over it.
rbabcock,
The type of adjustment that really annoys me is when the adjusted results are compared with official historical data that are not adjusted.
Produced in the 1950s or so, Australia’s official Year Books and CSIRO reports have given 3 sources of temperature information that were either not adjusted, or adjusted for quality control like outlier rejection only.
When you compare the official Australia BOM data set of ACORN-SAT today with those 1950s records, there are substantial differences. Compare them to BOM unadjusted data, you get smaller differences.
A reasonable person would question whether the Acorn adjustments are correct. I do, but I make no headway.
When we do this type of comparison to 1950s Year Books, we can see perhaps 0.4 deg C warming in the last 120 years. We cannot see the 0.9 deg C claimed officially by the BOM.
So I get annoyed.
Read the detail from Chris Gilham here. http://joannenova.com.au/2015/03/historic-documents-show-half-of-australias-warming-trend-is-due-to-adjustments/
Geoff
This does get reminiscent of Stalinist or PRC revisions to history. They would have had such a great time with Photoshop.
The real problem the green blob will have is eliminating all the earlier versions of the temperature records. As one prominent American politician discovered, she couldn’t just burn the tapes and have the history go away.
Heller at his blog has been doing a good job recently of comparing past and present, from which the shenanigans are readily apparent. He is doing a series of short youtube videos on it. Orwells 1984 Ministry of Truth as a general theme.
“Heller at his blog has been doing a good job recently of comparing past and present,”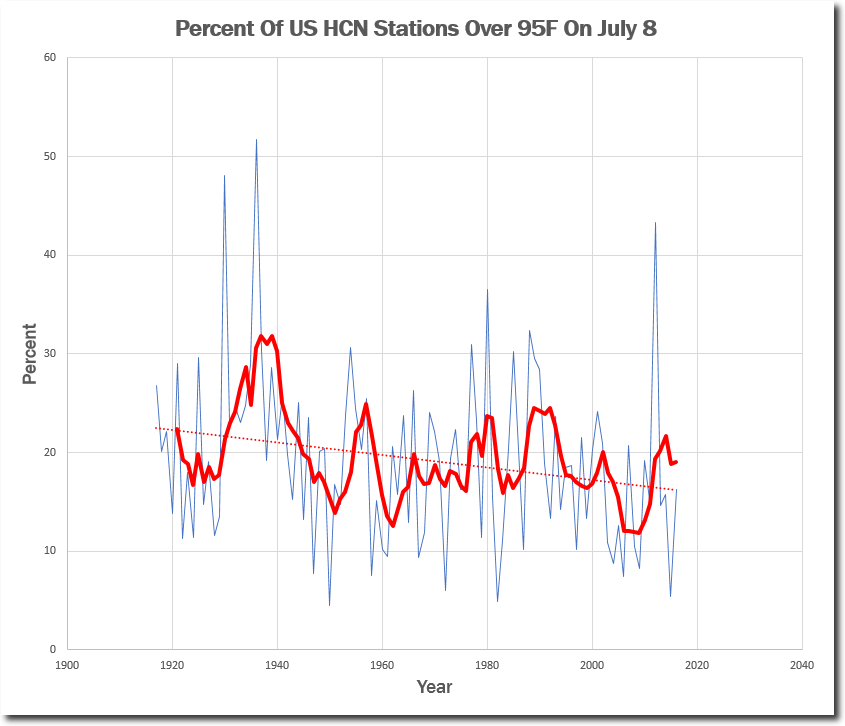
I like how Heller is taking each day of this year’s summer and comparing it to past summers. Each day shows it was hotter in the past than it is now.
Here’s July 8:
As you can see, it was much hotter in the 1930’s than it is today.
Steven Mosher was trashing Heller the other day. Well, Heller has put out a challenge to Mosher to prove him wrong. It’s over on his website, Steven. Go prove Heller wrong if you can.
“If our paper is published, and if the wider scientific community finds little of substance to cavil at, it will mark the end of the global-warming scare.”
A couple of very big “ifs,” especially the second one. In any case, one paper no matter how central will never mark the end of this farcical dog and pony show..
As most of us have figured out by now, this is not about science.
This Christopher Monckton of Brenchley really is a delightful writer. I aspire to such.
Please no, no . . . .Please don’t be impressed by all that egotistic, ostentatious froth laced with supposedly humorous ad hominems that he should have, like Boris Johnson, grown out of decades ago . . . If he would simply state his case with evidence and sound argument that would be much more effective. I’m a hard core sceptic but all of that guff is really pretty hard to swallow. Yes, there’s been a pause, but that doesn’t disprove anything fundamental to the AGW case. Climate is incredibly complex and though extreme scepticism is certainly justified in my view on account of our very limited knowledge of all the processes involved, we have to be consistent in our scepticism. We don’t know for sure that the AGW crowd are wrong. It’s too early to be sure either way. We don’t what would have happened if Co2 levels hadn’t increased over the last 50 years because there is no pattern of natural variability well enough understood to fall back on for comparison. But that cuts both ways. The essence of scepticism, funnily enough, is open mindedness. They don’t know, and we don’t know!! .(PS . .why would any man want to style himself as a lord btw . . . folks from the land of the free – weren’t all men created equal – in particular, should be appalled)
Sorry . . mised out a “know” . .apologies.
Agree about Mr. Moncktens writing style, but remember one of the central global warming claims is was man’s fingerprint is overwhelming all natural variation a significant pause is proof this is not true.
He doesn’t “style” himself to be a lord. He IS one. You know, from England. Another hallmark of skepticism is being able to research something and not just make assumptions. Way to shoot your argument right in the foot.
jim,
“Please don’t be impressed by all that egotistic, ostentatious froth laced with supposedly humorous ad hominems that he should have, like Boris Johnson, grown out of decades ago . . . ”
It sure looks like obvious sarcasm to me, and as long as it is obvious, I see no reason to treat your non-sarcastic, and to my mind somewhat egocentric criticisms as entirely consistent . .
“If he would simply state his case with evidence and sound argument that would be much more effective.”
In your opinion, right? I mean, you do realize that humor is subjective, and can be effective in ways that might not seem important to you (or I), yet be the intended effect the humorist seeks, right?
In this case, I suspect Mr. Monckton intends to bolster the spirits of those who might feel weary of a long battle, in which dead serious ad hominems and accusations of reckless/ignorant interference in the affairs of our self presumed betters, as well as clear demands for wealth and power, are pretty much relentless. I personally find it “effective” in that sense, and welcome the comic relief that I believe the author intended his essay to “tangentially” provide.
Jim Hogg,
It depends on the audience. For a long time some of us in Australia (and I met Lord Monckton years ago) have been publicising severe questions about fiddles with temperature records. Those who have a duty to investigate and correct often prefer to do neither. Our BOM in Climategate labelled us as “fortunately, not very bright” or similar, which was their way to address technical matters at the time.
Lord Monckton has chosen his way to address others. It is thought by him to be a good way to penetrate the murk and have his words seen. It is his choice.
Perhaps he got through to you enough for it to stick. I think it works well.
Geoff.
Monckton should do a video called The Monckton Method, discussing creative writing that is both informative and highly entertaining at the same time. His writing style is right at the edge of being over the top, yet not, and, thus, successful.
Agree Robert. Thank you. And, I have never seen anyone show him to be wrong. Many mumble around, attack him personally, but none scientifically refute Lord Monckton.
When completing my thesis, if I were to go back and “revision” my field data while back in the lab, I don’t think my advisor would have been comfortable signing off on my work, but it sure would have been easier. I could have determined the results and then fit the data to prove myself right. Only in climate science do they not let the scientific method stand in their way of desirable results.
Thank you for this comment.
A sad state of affairs when the progressives have any power. Think how bad it would be if Hillary got elected.
Unimaginably bad Catcracking. Give thanks for the blessings that we elected President Trump and not Hillary Rodham Clinton.
The word is “revise” your field data.
Hey Christopher, do you remember this?
..
https://twitter.com/i/web/status/874629747137015808
David,
~30 years ago, is the best you have? If anything, this speaks to Monckton’s credibility, he drank the Kool-Aid once, it just didn’t taste very good. From personal experience, I was once a believer too, the science just does not hold up. Sadly I never received my Oil Royalty money.
This picture is what made me start looking for the truth (National Geographic “Global Warming” 2004). The caption in the article (paraphrasing) stated from tree core samples they can reconstruct past climate, like this log from a “millennia” ago. I was like, how in hell did a tree get on top of a mountain 1000 years ago, with not another tree in sight. The rest is history as they say.
https://drive.google.com/file/d/0B2SUakWV8_Y7Y1Q5REF6NGVIX0U/view?usp=sharing
Egads!. Does this mean that humans have the ability to learn from their mistakes and change their minds?
Yes, they have that ability. Many never use it though.
It appears you enjoy making visually impaired to suffer from small text in small window not scaleable up. Couldn’t see author – or read the text either. Crap it was, some Jones joking about tide power.
Idiot! We all know. In fact, I trusted my climatologist colleagues too, until empirical data forced me to find out what was really happening. Like so many, including CMoB. Some people prefer to remain stupid though….
That’s absolutely fascinating. So, 30 years ago, Christopher Monckton was a true believer.
This explains something that long puzzled me. He was actually Margaret Thatcher’s science advisor at a time when she was using climate change and nuclear power as weapons against the miners. She was instrumental in the creation of the IPCC. At the time Thatcher was a true believer, so Monckton’s advice would no doubt be exactly what she wanted to hear.
But of course, people have the right to change their minds, particularly when new evidence emerges. In her later years Thatcher became a climate sceptic – she described global warming as “hot air”. And so too has Christopher Monckton changed his mind, thank goodness.
Christopher, it would be fascinating if you could tell us why and how you changed your mind over the years.
And thank you very much for all the good work you have done, and good luck with the new paper!
From another Chris.
“But of course, people have the right to change their minds, particularly when new evidence emerges.”
That’s true, but in the case of climate science there never was any “old” evidence to begin with. Just speculation. At some point Lord Monckton realized it was all speculation.
Don’t trust satalite sea levels either…..when envisat showed no sea level rise…they adjusted it out so it did
https://www.aviso.altimetry.fr/fileadmin/documents/calval/validation_report/EN/annual_report_en_2009.pdf
First Karlization, and now Mearsation. Either way, the CMIP5 models have been busted by Dr. Christy’s 29 March 2017 congressional testimony.
“Frankly, it’s time for this unprincipled Humptidumptification of climate science to stop. ”
Love it
“When I use a̶ ̶w̶o̶r̶d̶ data,” Humpty Dumpty said, in rather a scornful tone, “it means just what I choose it to mean—neither more nor less.” “The question is,” said Alice, “whether you can make words mean so many different things.” “The question is,” said Humpty Dumpty, “which is to be master—that’s all.”
Welcome back Lord M.
Glad you picked up on the fact that even their revised figures show a 1.29C per century rate of warming that effectively ends claims of a catastrophic scare right there. 1.29C is NOT a ‘catastrophe’, so I’d say that whichever way they call this they’re now hoisted by their own petard.
I think much more should be made of this point.
“Glad you picked up on the fact that even their revised figures show a 1.29C per century rate of warming that effectively ends claims of a catastrophic scare right there.”
I’ve heard rumors that Lord M is going to whittle that figure down some more in the near future.
Christopher……a couple of points that I think need to be addressed in the story, just for the sake of clarity. Thanks…….and a nice article!
“One-third of Man’s entire influence on climate since the Industrial Revolution had occurred since February 1997, yet on the then RSS dataset the 225 months since that month had shown no global warming at all (Fig. 1)”
Shouldn’t this actually say “posited influence on climate as a result of CO2 concentration” rather than just “climate”. Temperatures remain relatively unchanged despite those increasing CO2 concentrations which, I believe, is the whole point of your essay.
And at the end of Para 5, you’re missing the word “sort”, I believe!
“the Inconvenient Pause was a mistake and that he would thereafter airbrush it away by some a of statistical prestidigitation”
Really need to correct Fig 2 so that it agrees with text and ends in Oct 15. This will be latched onto as being deceptive and used to dismiss the entire article. Also at least in Chrome on a Macbook the highlighting of some of the numbers in Table 4 makes them almost illegible.
Brave words sir! You don’t kill a religion with a few inconvenient facts. 😉
BTW … I have stumbled across Suicide of the West. It was written in 1964 but, if I was aware of it before, I ignored it. Things have only gotten worse over the intervening half century. Any thoughts?
Christopher, I think you messed up the graph in figure 2.
You claim it is the same period as graph 1, it is not.
You compare 2 different time periods with each other where one ends with a El Nino.
Graph 2 must be remade to cover same time period as graph one to show how much the trend really changed in the same time period as graph 1.
Immediately above figure 4, the text ‘and a very long below’, should be ‘and a very long ‘way’ below’
Correction: Table 4, not figure 4.
I look forward to your paper Christopher. We will have the popcorn ready when the current compliant concensus reaches critical mass Sir!
Get ready for some seriously stale popcorn before that happens.
Oh, ye of little faith! 🙂
Brenchley tells us:
How ’bout 96 years? NOAA’s Climate at a Glance tells us that Maximum Temperatures May – October haven’t increased since 1921.
http://oi68.tinypic.com/2yu11eg.jpg
The so-called mainstream press likes to tell us about heat waves and shows us images of dead cattle and cracked earth baking under a blazing sun. That’s maximum temperature they’re whining about not averages.
Steve,
Bravo. You are correct, average temperatures tell us nothing. If you do a plot of minimum temps you will find all the increases there. Increasing (nightly) minimums aren’t scary at all, so that’s why the alarmists always use the average.
Witness the breathless headlines from last month’s “historic” heatwave in Kalifornia, for example “99 Year Old Heat Record Shattered!” in Livermore, CA – by only a single degree. The hottest temperature ever recorded in my home town in N. Idaho was 117 f – set way back in 1962. Flat maximum daily temperatures for 100 years – inconvenient truth!
Given:
1. CO2 is said to be a well mixed gas and therefore operates in like manner on a global scale (subject to differences in humidity/water vapour feedback); and
2 The US is a large tract of Northern Hemisphere land; and
3. The US is a good representative sample of geography and topography, and is therefore a valid sub set of the behavoir of land masses in the Northern Hemisphere;
4. The US has the best sampling of data of any significant land surface.
If the US is not showing warming (the US was warmest in the 1930s/1940s), one would needs a strong explanation as to why the US is an outlier and not behaving in the same manner as the Northern Hemisphere as a whole.
The fact is that when you have good quality data, there is no warming, just multidecadal variations, seriously begs the question as to the quality and validity of the data for other areas, and whether the so called AGW thing is just a data issue brought about the manner in which poor quality data with insufficient spatial coverage is presented.
BINGO!
“If the US is not showing warming (the US was warmest in the 1930s/1940s), one would needs a strong explanation as to why the US is an outlier and not behaving in the same manner as the Northern Hemisphere as a whole.”

Yes, that goes for today and for the hot 1930’s.
We have charts from the 1930’s which show the same temperature profile as the U.S. chart, i.e. the 1930’s shows to be as hot or hotter than subsequent years.
Here is an example from Finland, which is quite a distance from the good ole USA:
As you can see, the temperature profile looks just like the U.S. chart reproduced below (the 1999 Hansen U.S. chart):
And look at how the CAGW promoters have bastardized the U.S. surface temperature chart since 1999. Here is a comparion of the 1999 chart to the 2017 chart. See any difference? The climate charlatans are SO dishonest.
The accidental delegate from Burma was a very memorable moment.
Thank you, Lord Monckton for being so brave. Kudos.
https://youtu.be/mwjC-MMKwRY
The closing conclusions by the president of Conference Of the Parties COP 18 was also memorable:
https://youtu.be/e282CVUYCz8
Trained seals?