From the Cliff Mass Weather Blog
Cliff Mass
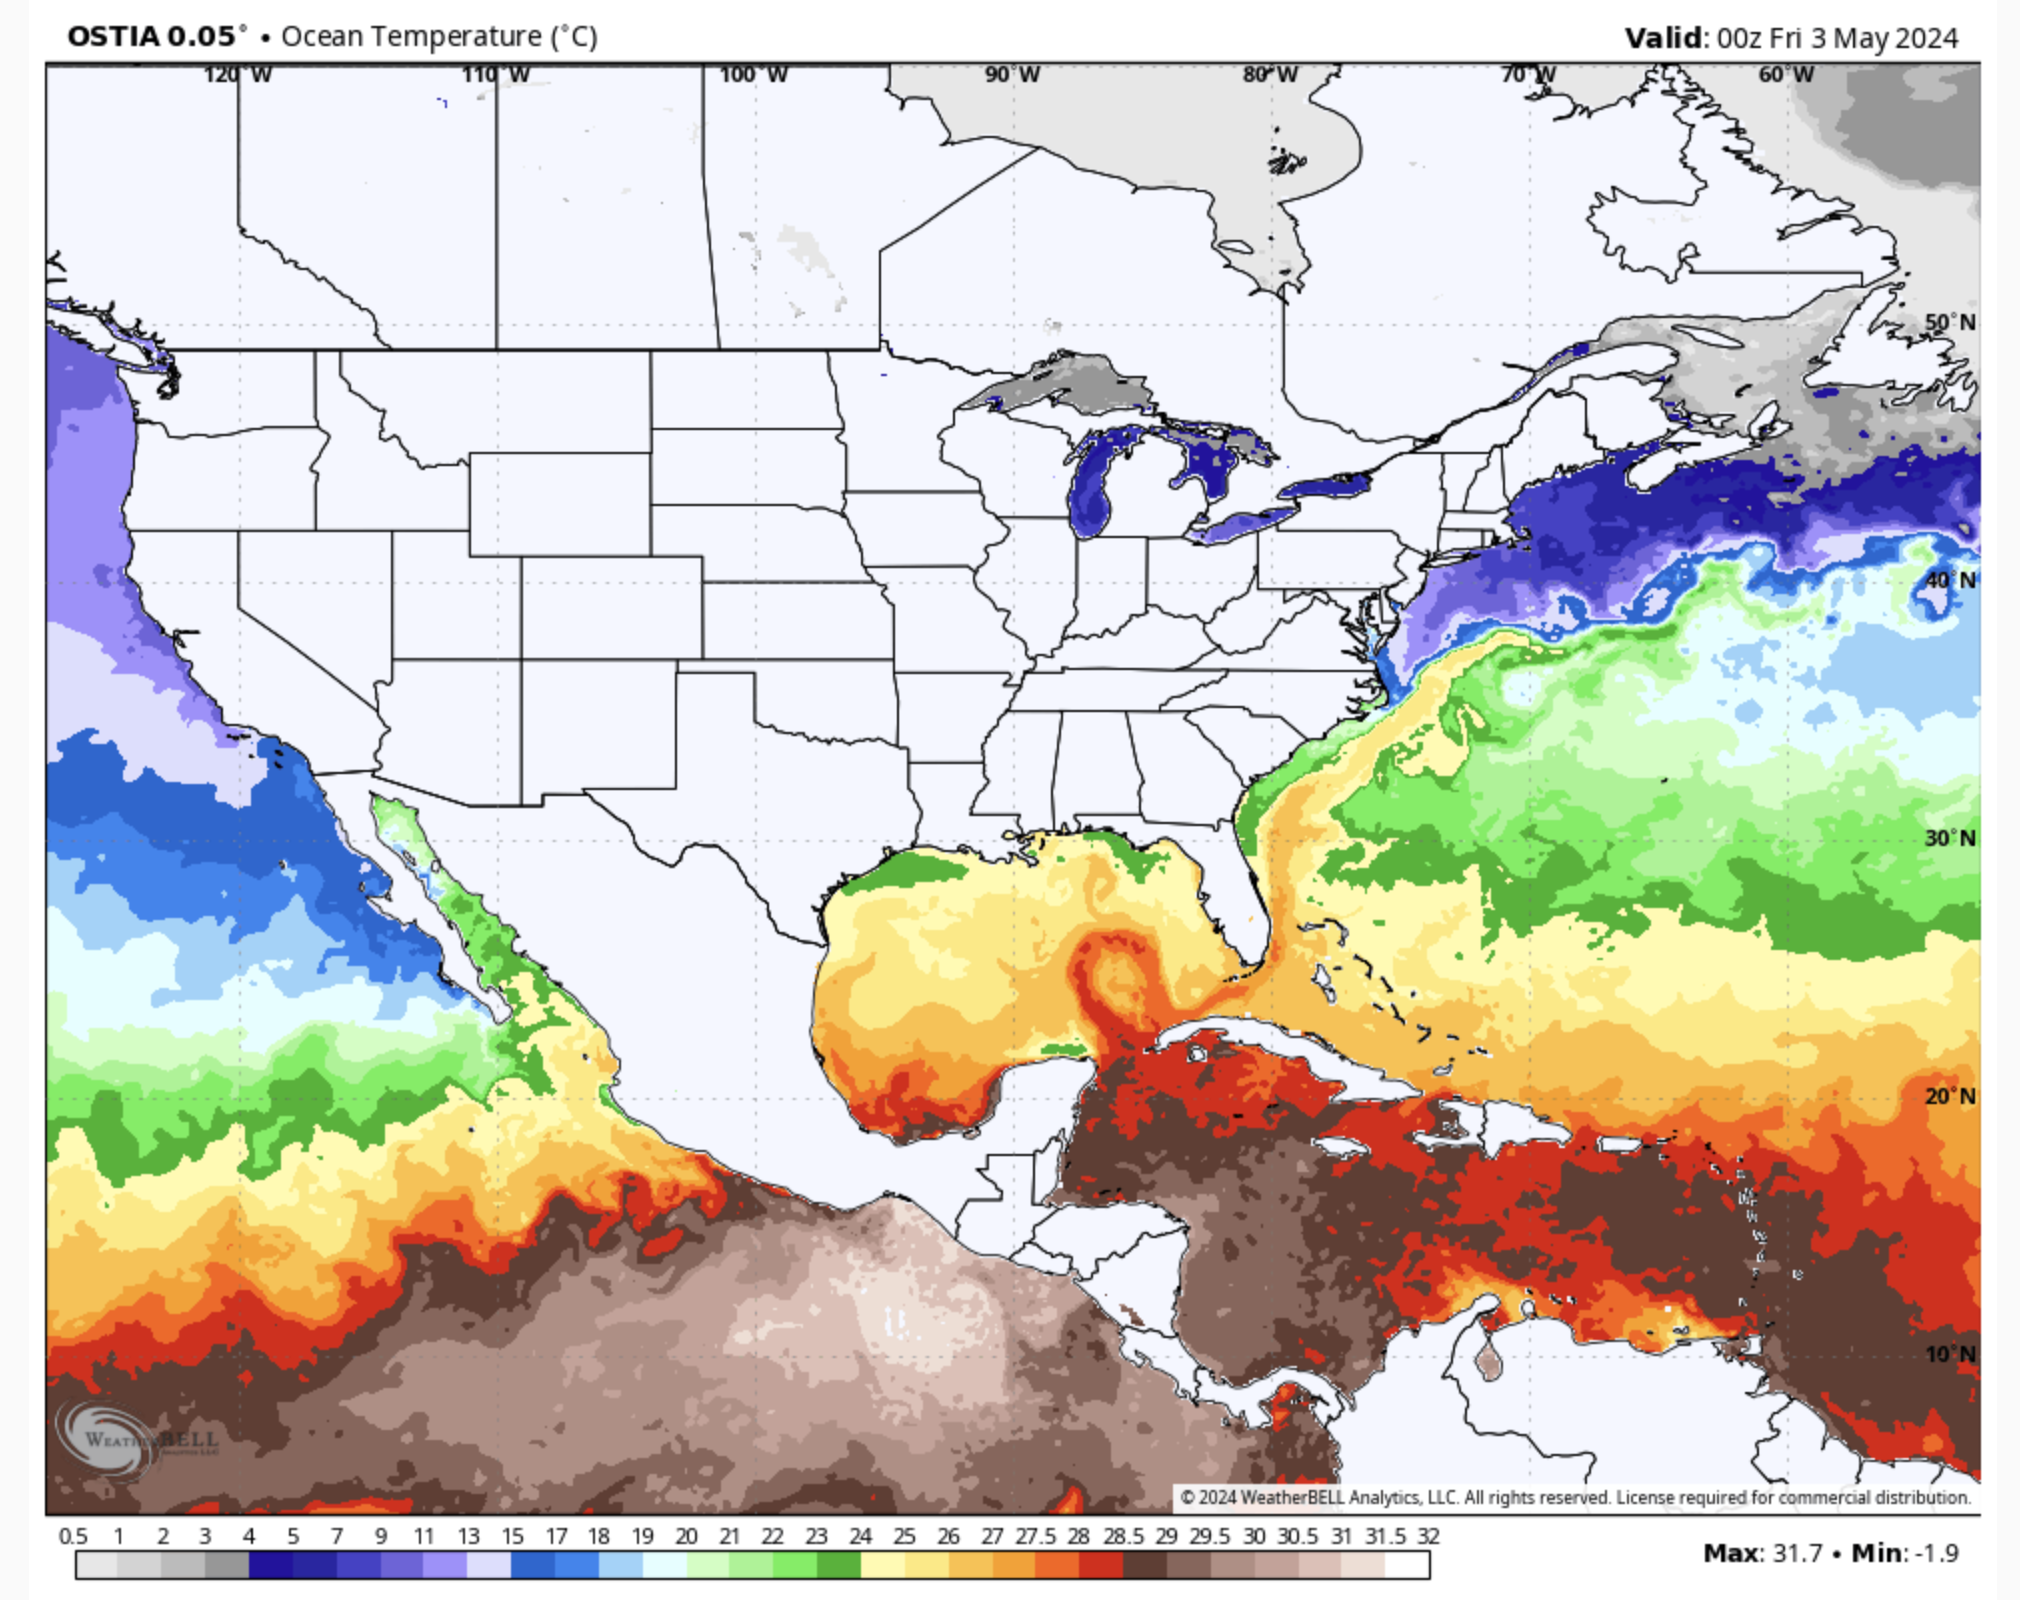
Perhaps, this blog spends too much time talking about the atmosphere, so to make amends today, let’s see what is happening to the temperature of the ocean surface. And see whether anything unusual is going on. Let’s start with yesterday’s sea surface temperatures around North America (below). Sorry, it is all in °C. Keep in mind that 10°C is roughly 50F, 20°C is around 68F, and 30°C is approximately 86F.
The eastern Pacific near the West Coast is cold (about 50F), with central California’s waters a bit cooler than ours. You must head to the southern tip of the Baja Peninsula to find the water warm enough for comfortable swimming.
The East Coast is a study in contrasts. The water off of New England is crazy cold (dropping below 7C), while the uber-warm Gulf Stream is found along the west coast of Florida, moves past the Carolinas, and then heads northeastward into the Atlantic.
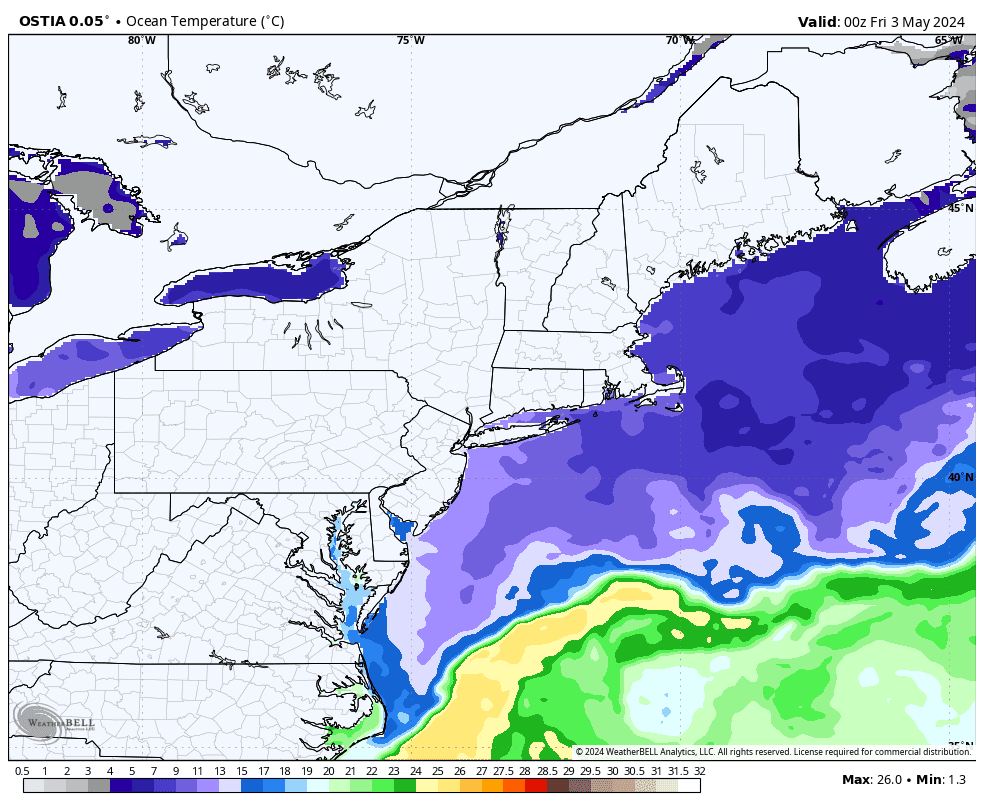
There is a HUGE temperate contrast between the Gulf Stream current and the cold water of the Northeast. A blow-up of the sea surface temperatures off the Northwest really shows the amazing horizontal temperature changes north of the Gulf Stream
Look closely and you will waves in the interface between warm and cold water in the Atlantic and a fascinating loop in the warm water over the Gulf of Mexico (first image above). Very warm water over the Caribbean and west of Central America
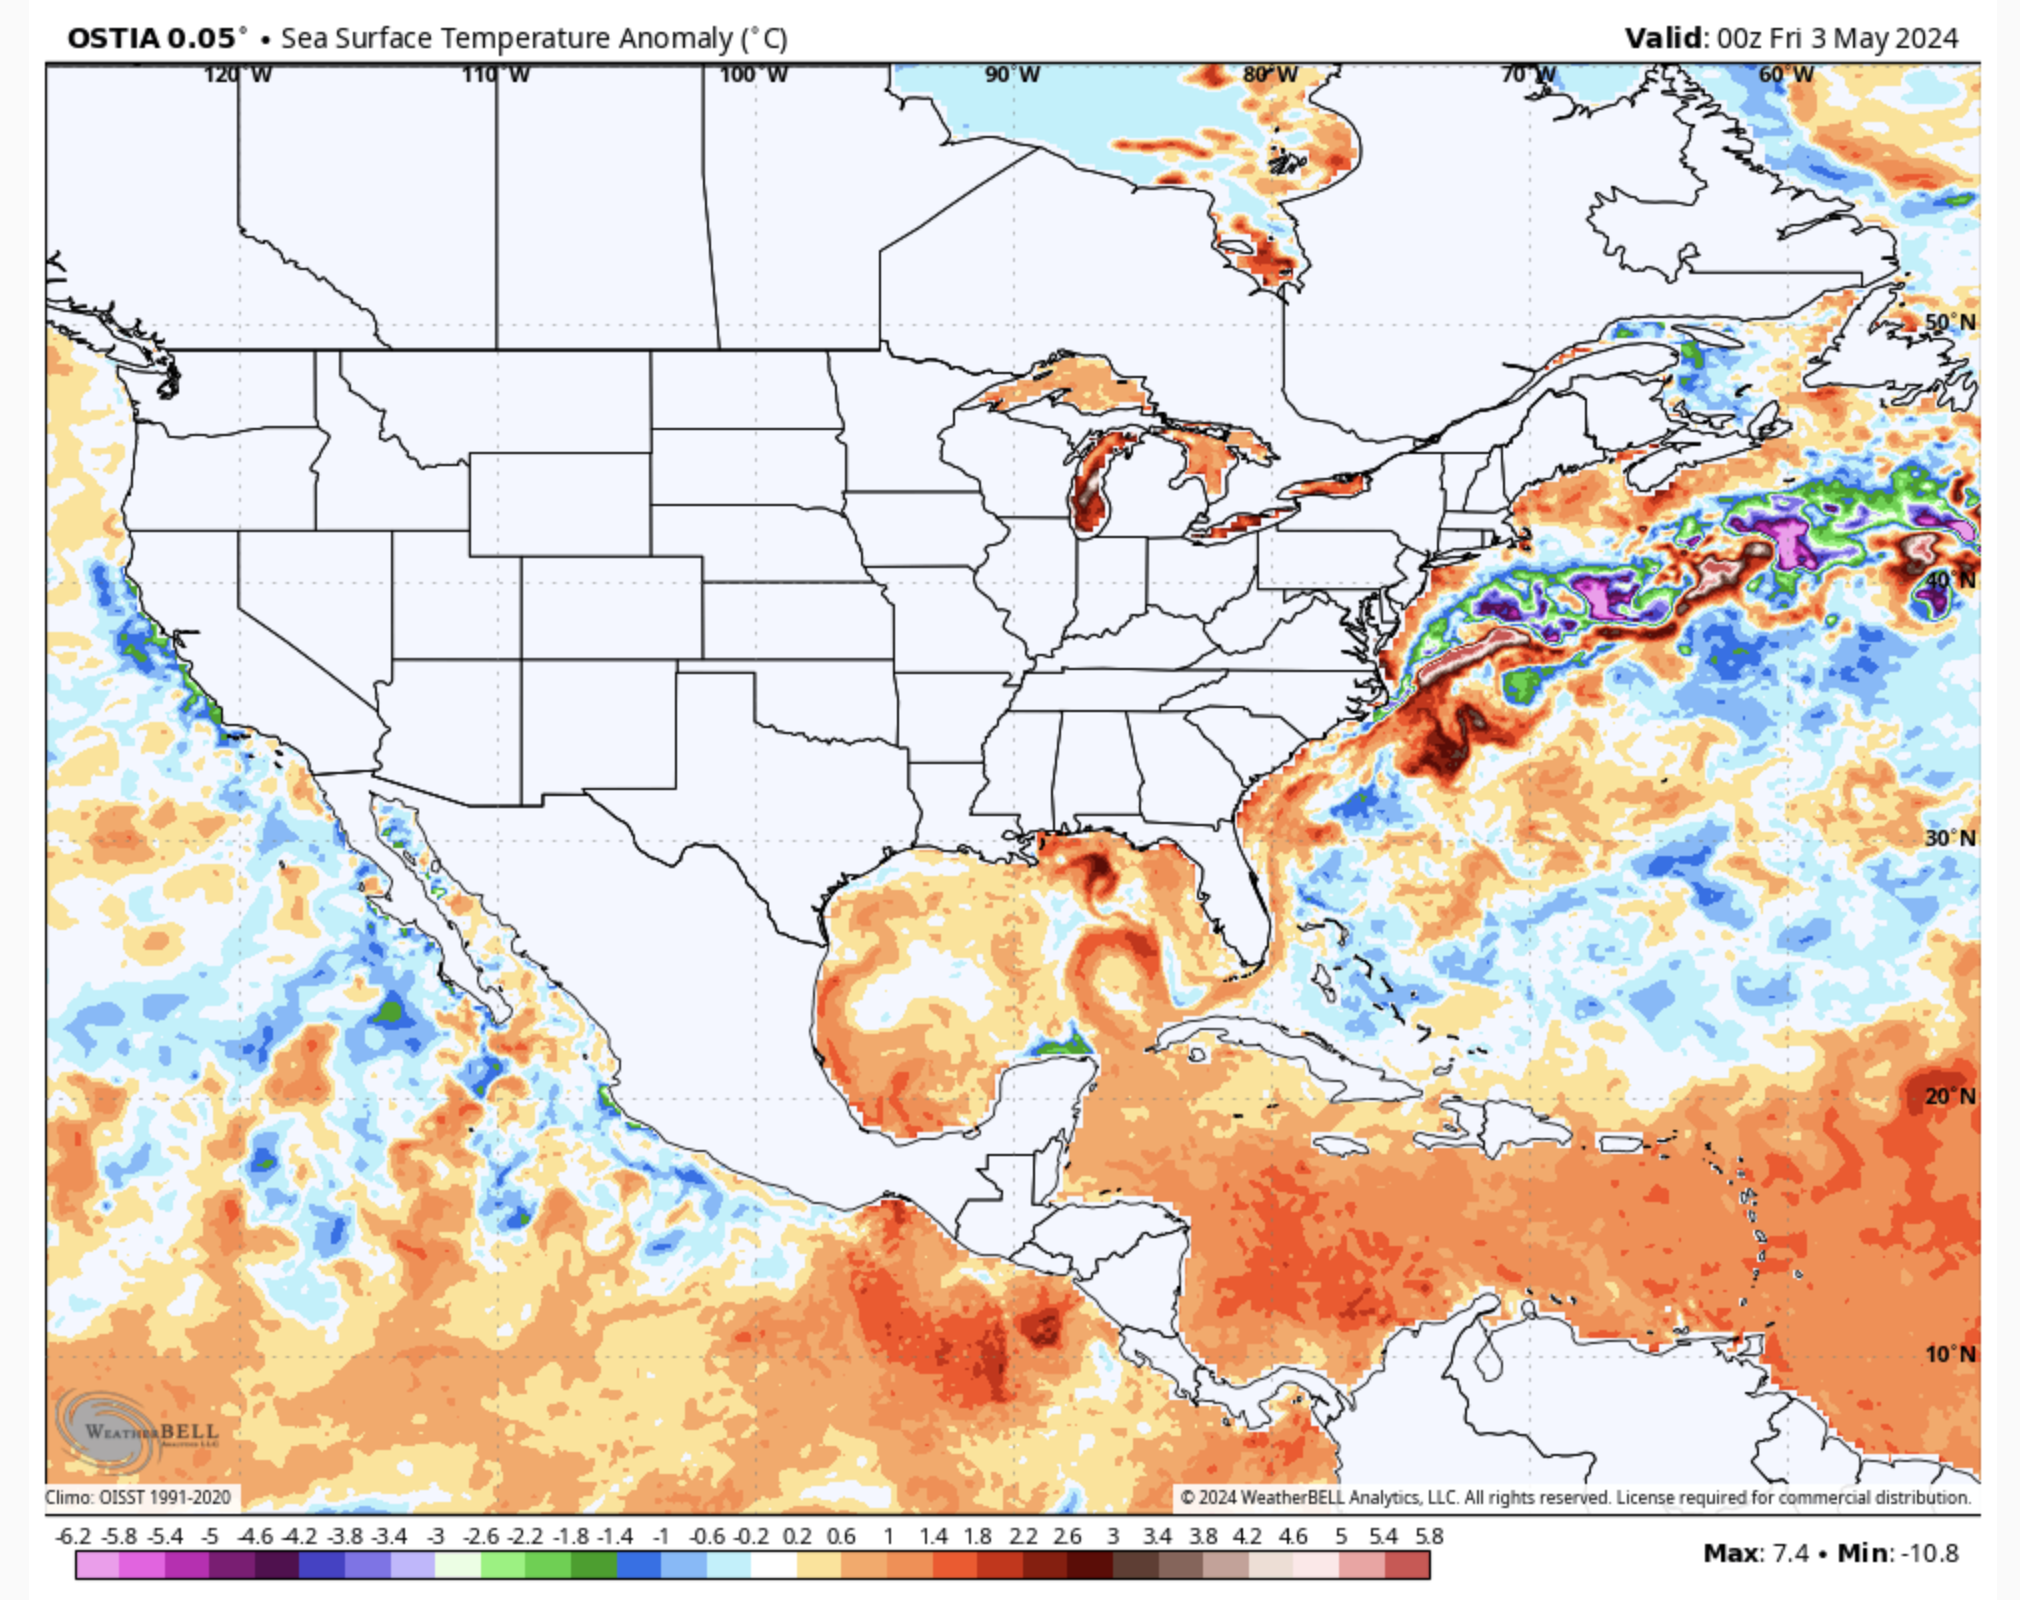
Your next question is probably: is the current pattern of sea surface temperature unusual?
To evaluate this, the next map shows the difference between yesterday’s sea surface temperature and normal conditions (also called the SST anomaly).
Pretty close to normal off the Northwest coast. A few degrees colder than normal for California’s coastal waters. And near normal on Mexico’s west coast. Most of the Gulf and Atlantic coast is slightly above normal. Temperature is cooler than normal north of the Gulf Stream, which suggests that the Gulf Stream is south of its normal position by a hundred miles or so.
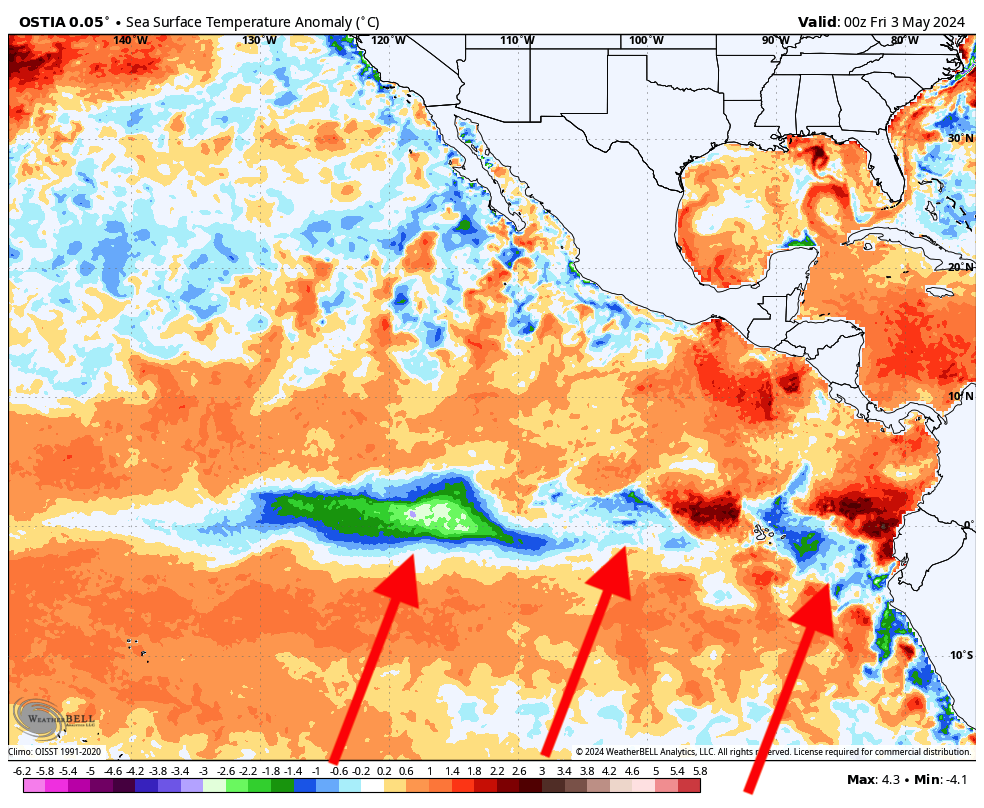
The biggest sea surface temperature story is what is happening in the tropical Pacific. Last year, a strong El Nino brought MUCH warmer than normal sea surface temperatures from South America, westward into the central Pacific.
But something major has happened. The tropical Pacific surface waters are rapidly cooling, resulting in cooler than normal waters in many locations (see map, with arrows showing you some of the coolest spots).
El Nino is dead. Long live La Nina, its frigid cousin!
No, those are exact conversions.
Whole units, not 2 decimal places?
How unscientific.
I thought there had to be some fudge factor too, but no, F scale is defined by freezing at 32 and boiling at 212, exactly, so the ratio of the individual degrees are exactly 5/9 of a Celsius degree. So every 10°C change in temp is exactly 18°F of change.
Side note – I found it amazing – and hopeful – that the normally woke Wikipedia mentioned that media will sometimes post heatwave temperatures in F to sensationalize the figures, even though they would normally post the figues in Celsius, like in Canada and the UK that still have a vague memory of the F scale.
Bigger numbers are more impressive. Presentations 101.
Why claim 1 Mbyte when 1000 Kbyte works.
You mean “Presentations 38.3333”
Now, is that the decimal MByte or the binary version?
Depends on the audience. I’ve seen and presented both ways.
No, we Brits, still like to use the ‘F’ word 😁especially, when we get hot under the collar due to our gormless politicians.
Even 2 decimal places would hardly be science. Real science is, for example, the mass of a proton: 1.67262192 × 10⁻²⁷ kilograms.
sorry 1.67262192 is much too imprecise for something that is 10-27. It needs to go out at least 20 digits to the right of the decimal point.
Um… no. That’s already taken care of by 10-27.
Or on the other end Avogadro Number.
“The Avogadro constant, commonly denoted NA or L, is an SI defining constant with an exact value of 6.02214076×10²³ mol−1 (reciprocal moles).”
That quote should say molecules per mole.
For some weird reason – that number is stuck in my brain from my last chem course in ’66! I often impress hot babes at wild parties by saying that number. Maybe it stuck because I was impressed that anyone could figure that out- real scientists- not hockey stick science pretenders.
They took the mass of carbon 12 (atom or molecule, I forget) and divided it into 12 grams to get Avogadro’s number.
I recall the maths teacher at school, telling us to remember the numbers 1.414 (√2) and 1.732 (√3).
Yeah, I thought, who needs them?
Little did I know 😁
Better than the climate scientists that show temperatures to two decimal places when they don’t have the accuracy or precision to use more than a whole number.
Someone should let the BBC know!
This is their current scare story……
BBC News – Climate change: World’s oceans suffer from record-breaking year of heat
https://www.bbc.co.uk/news/science-environment-68921215
Hell will freeze over before the BBC admits that “the Settled Science” is nonsense.
Then the BBC will claim that hell freezing over is due to climate change.
They know nothing about climate science.
The picture of those penguins are used for psychological manipulation.
The BBC has no integrity left. It now abuses itself every moment of every day and those who pay for it have no say in the lies it broadcasts or writes or the complaints it fails to deal with properly..
Time it was forced to go private and reduced to its true size.
The BBC is just reporting the Copernicus ERA5 data. Maybe you would prefer them not to report it, but the fact is that the last 12-months was the warmest running 12-month period in any global sea surface temperature data set.
Or maybe someone can point to a global sea surface temperature data set that says otherwise?
Here is HadSST4, for example:
RUBBISH….
Show us where SSTs were measured before even 2005 with ARGO…
… let alone going back to 1850 !
Can someone point to where some sea surface temperatures that were actually measured for MOST of the ocean before 2005 ??
Even Phil Jones admitted that most of the SH SSTs were ” just made up”.
Yeah, Phil Jones just made up sea surface temperatures and as a result, the Twentieth Century Warming that showed in regional land surface temperature data was erased from official history.
Jones couldn’t use the land temperature data to erase the Early Twentieth Century warming because the land data showed the Twentieth Century Warming, so Jones added in bogus cold sea surface temperatures and used them to basardize the global temperature record and create the instrument-era Hockey Stick chart that claims humans are experiencing the hottest temperatures in history.. This is the BIG LIE of alarmist climate science. Every other alarmist climate change lie flows from this initial deception that we are living in the hottest times in human history and it is all caused by CO2.
The facts are, we are not living in the hottest times in human history. It was just as warm in the recent past as it is today, and was warmer than that during periods over the last ten thousand years.
Phil Jones and the small cabal of temperature data mannipulators have caused all our current problems to do with trying to reduce CO2 emissions. They have created a false reality in their computers and have foisted this false reality on the world, and now the Western world is acting like the bogus Hockey Stick is reality and are in the process of destroying themselves, and us, over it.
Remember that traditionally, all ocean sea surface temperatures were collected on ships in canvas buckets attached to a long rope. Of course, the water cooled extensively from evaporation before the thermometers could be inserted on deck to measure, so the entire data record of all ship water temperature measurements were adjusted to compensate for the error.
BNice, here is the closest I could get.
Challenger Expedition – of 1872–76
On her 68,890-nautical-mile (127,580 km) journey circumnavigating the globe,[1] 492 deep sea soundings, 133 bottom dredges, 151 open water trawls and 263 serial water temperature observations were taken. Also about 4,700 new species of marine life were discovered.
Wiki
Here is the route

Note, no reading in the Artic Ocean, north Atlantic or Pacific, Northern Indian Ocean and only one at the tip of South America.
Note also, the Niño 3.4 Region got one pass, N-S. Not mentioned was if it as El Nino or La Nina year, since it hadn’t been identified yet.
But according to CGW’ers good enough starting points to record the whole ocean temperature to hundredths of a degree. And Backdated 26 years for a 1850 starting point.
Bob Tisdale looks at the effect of El Nino events on SST in the South Atlantic, Indian and West Pacific
All El Ninos.
Do you have any evidence of human causation for these El Ninos ??
That’s not global. And as usual, Bob forgot to consider the counter-balancing effect of cooling La Nina events. Like you.
NO, you missed the point that the El-Nino events generates a STEP UP warming trend the chart makes that obvious point.
The subsequent La-Nina’s doesn’t erase all of the warming effects which is why there is a current overall warming trend since the late 1970’s.
The chart ignores the counter-balancing influence of La Nina. He could easily have highlighted these, but chose not to.
ENSO is not a provider of warming; it’s just a sloshing of existing warmth between ocean and atmosphere.
It does not explain the warming trend in that data.
Yes it does . You are just too dumb and brain-washed to see it.
Do you have any evidence of human causation for these El Ninos.
You got sudden blindness apparently as I already allowed for La-Nina effects on the trend.
Obviously, the La Nina DOESN’T counterbalance over that period.
You remain totally clueless about El Ninos, and La Nina.
You’re mistaking the warming trend with ENSO variation, as you so often do, wee bnasty.
bnice2000:
Bob Tisdale’s chart is highly misleading.
See: “The Definitive cause of La Nina and El Nino events”:
https://doi.org/10.30574/wjarr.2023.17.1.0124
All El Ninos are caused by decreases in the amount of SO2 aerosols in our atmosphere, including those caused by decreases in industrial activity during American business recessions (i.e.human caused).
For more on this see: “A graphical explanation of Climate Change”.
Unfortunately, the publisher has disabled the DOI. However, it can be viewed on Google Scholar by typing in my name, and scrolling down to the title.
Your mono-thought continues.
The graph is not the slightest bit misleading… unless you refuse to see it.
bnice2000:
The graph shows a step-up in temperatures. That is totally incorrect. All El Ninos are temporary events, and do NOT contribute to increased warming.
Read the references that I provided.
Wrong ! They spread warmer water out from the tropics, thus raising the overall global temperature.
And yes, they DO contribute to the warming…. that is patently obvious from Bob’s graph and from UAH data.
They are , in fact the only warming events in the whole of the UAH satellite data.
I thought at one point that you were just being performatively stupid.
But no; you appear to be the real thing.
bnice2000:
They are only TEMPORARY events, as soon as they end, temperatures drop to pre-existing levels, or lower, usually because of a volcanic eruption. There is NO accumulation of their warmth, as Bob’s graph erroneously implies.
LOL! Like asking a monkey to play a violin!
TheFinalNail;
My Bad!
I somehow thought that you could read beyond kindergarten level.
Not even close or for the right reasons.
Source Point
All El Ninos and La Ninas originate in the exact same deep ocean seafloor area which is located east of Papua New Guinea and west of the Solomon Islands (Figure 2). The Source Point covers 150,000 square miles, which is a mere 0.23 percent of the Pacific Ocean’s 64,092,958 square miles.
The Source Point’s area is one of the most geologically active regions on Earth because it is home to the junction of five extremely active major fault systems, the second largest ocean floor lava plateau on Earth, hundreds of ocean floor volcanoes, and a tremendous number of ocean floor hydrothermal vents.
Generation Of El Ninos And La Ninas
Helium Gas Emitted From The El Nino And La Nina Source Point
Figure 3 is a map showing the concentration of helium gas in seawater across a large portion of the Pacific Ocean. The presence of helium gas plumes is a very strong indicator that the gas was emitted from an erupting volcano.
Other Evidence
Additional information @ur momisugly
Written by James E. Kamis on September 15, 2023
https://www.plateclimatology.com/geologist-how-geologic-factors-generate-el-nino-and-la-nina-events
DD More:
ABSOLUTE NONSENSE!
ALL El Ninos result from a reduction in the amount of SO2 aerosols in our atmosphere.
For example, there have been 34 American Business recessions/depressions since 1853. During those events, there are many idled factories, foundries, etc., with the result that their emissions of SO2 aerosols decrease.
Of the 34 events, at least 32 of them caused an increase in average anomalous global temperatures, with at least 7 of them rising enough to form an El Nino.
No volcanic activity involved with those El Ninos, just a reduction in SO2 aerosol levels!..
A sea surface Hockey Stick.
Relies totally on FAKED data for 97% of the period of the chart.
Designed specifically to match the pattern of GISS et al.
Note how much higher the 2016 El Nino is than 1998 in the HADSST fabrication, compared to more “honest” data in Bob Tisdale’s chart
Here’s the peer reviewed paper explaining how the data were compiled, including sources.
You go tell them where they went wrong. No one else has been able to since it was published in 2019, but you’re special.
The term “peer” is a joke. My definition is someone who has adopted the groupthink of what is being reviewed, regardless of the true facts. And data – right now the temperature being reported at the RDU airport is 76F. Ten miles away at an official USCRN weather site the temperature is 70.7F. Care to guess what temperature goes into the historical database?
Well, that’s your opinion, out here in blogsville.
I’m sure the scientific community is trembling.
TFN The people you are referring to are not scientists. They are activists.👎😞
Right, must be easy to refute them then.
How come no one has made a valid refutation of their methods in the normal scientific way?
The paper is over 5-years old. Not a single refutation.
Just sniping on silly blogs by idiots.
Their methods are laughable no need to refute. The only reason it ever got published is Pal review.
You will never be part of the scientific community.
You are nothing but a gullible brain-washed twit..
Now show us where the measurements of SST were done for the period 1850-1950..
Until then.. you have absolutely NOTHING.
I literally just provided you with a link to the peer-reviewed paper, which is Open Access, and which contains links to all the raw sources and explains the processing they used for the period 1850-1950 and beyond.
It’s really not my fault that you are too stupid to understand this stuff.
You appear to be too stupid to know how stupid you actually are – which makes you funny.
By now you should understand the over 75% of the published peer reviewed studies are false, what bubble do you live in?
Aye, right.
I didn’t see any mention of Phil Jones at that link.
Right, so what does that tell you about Phil Jones’s involvement in HadSST4?
(Disregarding the ignorant comments above.)
Again.. waiting for you to show us all WHERE these measurements come from for the period 1850-1950.
You are FAILING COMPLETELY …. as usual.
Not my fault you can’t read or follow links, mate.
100% of all priests surveyed confirmed that supernatural forces control human destiny.
Based on this peer reviewed evidence, you should start praying immediately.
Well, religious ideas aren’t peer reviewed, so….?
Again.. funny that there is no map showing where the data came from for any period from any period earlier than about 1995. Why not ??
Do you have one.??
There were no reliable sea surface measurements covering the whole oceans before 2005… PERIOD. !
I will add the are still none, since all measurements are based on measurements from floating buoys that sink and come up we don’t have clue what really going on. Maybe after a few 100 years and a lot more data we might have a clue.
Also the buoys will tend to avoid warm areas where the water column is rising as the current will be in the opposite direction. So even they can’t get total coverage.
I provided you with a link to the peer-reviewed paper.
Just go there and rebut it.
Simples.
Stop bleating on a silly blog.
It is still much too cold to live outside the Tropics without shelter from the cold.
Here in the US heating in houses and apartmentsis required by building codes.
Even the 58.34F/ 14.63C real-time Global temperature is too cold for humans to live it.
It’s an average.
The average height in a class of 30 kids might be 5 ft 4 inches but not a single one of the kids might be exactly 5 ft 4. Doesn’t invalidate the average.
Temperature is an intensive property and cannot be added.
So we can’t measure temperature?
So why don’t you move to Northern Minnesota for a winter and try to survive with heat or shelter my guess you won’t see the new year let alone the first of December in a cold year. It would even be iffy with shelter and no heat.
What are you talking about?
That is not what an intensive property means.
So I guess this data “proves” that the ocean temperature rise, which began about 1904 by this graph, is not at all related to atmospheric CO2, which did not rise significantly until after 1950. Instead you wanted to establish that ocean warming caused the increase in atmospheric CO2 with a roughly 50-year lead-time?
I was just pointing out that the BBC was correct to state that sea surface temperatures over the past 12-months are the warmest ever recorded.
No one has been able to demonstrate otherwise, but we live in hope….
“Ever recorded” but not ever.
They didn’t say ‘ever’; they said ‘ever recorded’.
Do you understand the difference?
Use that El Nino.. it is all you have
Plenty of evidence that current sea temperatures are well below what they have been for most of the last 10,000 years.
Yes, warmer than during the LIA… but that is an absolutely blessing.
And of course, you are still missing any evidence of human causation.
We have moved no further on.
The BBC just stated facts that certain strange people around this neck of the blogosphere object to – for reasons they can’t lucidly explain.
There’s an awful lot of orange on the last two expanded thermographs above which show more of the World’s oceans.
“BBC News – Climate change: World’s oceans suffer from record-breaking year of heat”
The BBC is distorting reality. Sea surface temperatures vary by location. The oceans are not a uniform temperature. The BBC wants us to think that all sea surface temperatures are higher because CO2.
What is the theory that CO2 dissolved in oceans causes them to heat? Does it act like a wet blanket?
Oceans suffer? A little anthropomorphizing? Then the article says “But over the past year, the oceans have displayed the most concerning evidence yet that they are struggling to cope”. Liberal arts grads should not be writing science articles.
Dohhhh, wish I’d seen yours first, I’ve just posted the same link.
Colourfully covered on the ENSO NOAA website: huge El Niño crash. I wonder why the BBC and others haven’t made much of the record UAH temperature for April. Because it’s against the Narrative? Shows global warming at a terrifying 1.4degsC a century?
And that is with a current very strong El Nino releasing one heck of a lot of energy over a wide area.
“The water off of New England is crazy cold (dropping below 7C)…”.
Anyone who doesn’t believe that- go to the coast of Maine on a very hot day- and look forward to a swim- step in until your feet are wet and you’ll most likely run back to shore because your feet will feel frozen. If the water got a few degrees warmer it would still be too cold. Supposedly the lobsters aren’t happy and are moving northerly. But, like what happened when the hunting of polar bears was reduced, if all the harvesting of lobsters was reduced or stopped, I bet the lobsters would be abundant again. In early colonial times, lobsters were fed to people in prisons since they were so abundant. And those lobsters were huge- much larger than now. But they’ve been heavily harvested for centuries.
I remember Crane’s beach in Ipswich, north shore to Boston, during the 60’s with sand too hot to stand on, but going in the water would turn you blue.
The south side of Cape Cod- the water is quite a bit warmer but I don’t know how much.
HT just heated the equatorial waters along the Pacific as well as the Atlantic and the Indian Ocean, it never was a real El-Nino. Things will cool back down and when the deep atmosphere reaches equilibrium with the surface. Then we will get a real El-Nino, not the entire world heating up along with the El-Nino boxes.
SOI is growing slowly. La Niña will not appear earlier than autumn. That’s enough for temperatures to drop in the northern hemisphere during the winter.
https://www.longpaddock.qld.gov.au/soi/
Thank you Cliff, I always enjoy your blog posts. We woke up
to 6″ of fresh snow this morning here in the Northern Rockies.
The Little Belt and Highwood Mountains were forecast to get
3 ft this morning. Can’t complain about moisture in this
area but it’s been a cold spring. I heat with a wood boiler and
I’ve been going through a wheelbarrow load per day. With a
La Nina I better start processing as soon as the snow melts,
It feels like the ’70s weather.
Those of you who grew up with the Beach Boys singing of Surf City USA, as I did, might think that California beaches have that lovely warm Pacific water. That was never true, the water in Southern California is always cold. Top map in degrees.
I was a skinny kid and suffered hypothermia if I stayed in the water too long.
“Surf City” is a 1963 song recorded by American music duo Jan and Dean about a fictitious surf spot where there are “two girls for every boy”. Brian Wilson did co-write it though.
“Surfin USA” was written by Brian Wilson and recorded by the Beach Boys.
Jack O’Neill invented the wetsuit to prevent hypothermia. It’s strange that surfers and divers everywhere still wear them now that the oceans are boiling.
Story Tip: Climate change: World’s oceans suffer from record-breaking year of heat
The BBC has published this article
https://www.bbc.co.uk/news/science-environment-68921215
This little snippet caught my eye, “Planet-warming gases are mostly to blame”.
Correct me if I’m wrong, but I thought it was the other way round.
> Keep in mind that 10°C is roughly 50F, 20°C is around 68F, and 30°C is approximately 86F.
In other terms; Cape Breton, Cape Cod, Cape Coral.
I should expand; “Cape Hatteras or Cape Cod” as most don’t know how warm Cape Cod waters get as it sticks out into the Gulf Stream.