By P Gosselin on 3. July 2022
Charts by Kirye
The mean temperature data for June are available from the Japan Meteorological Agency (JMA) and today we plot the June mean temperature data for Tokyo and its Hachijojima island, located in the middle of the ocean 287 kilometers south of Tokyo.
June in urban Tokyo hasn’t warmed since 1996:

Data source: JMA
For rural Hachijojima Island, June hasn’t warmed there since 1936:

Data source: JMA
Next we compare the mean daily maximum temperatures of urban Tokyo and rural Hachijojima and see strong evidence of the urban heat island effect:

While the mean daily maximum temperature for Hachijojima has risen modestly over the past 115 years, Tokyo has seen an almost 2°C linear trend increase.
Data source: JMA here and here.
The same is true of relatively unchanged rural areas in the US. Phoenix and Vegas, not so much. The rural US was hotter in the 1930s than at any time since.
It cooled under rising CO2 from 1945 to 1977, when the PDO flipped modes.
At 37 to 38 million, Tokyo is the largest megacity in the world, as the UN counts urbanization, pipping out Delhi, Shanghai. Sao Paulo and Mexico City.
It’s a beast
I walked for 3 full days and barely saw a sliver.
But I liked the cab driver in the tux and white gloves
AW originally posted this exact comparison (proving UHI despite BEST’s assertion to the contrary) here over a decade ago. I used it with attribution in essay ‘When Data Isn’t’ in ebook Blowing Smoke, after explaining UHI theory from NOAA and giving a ‘concrete’ Phoenix night time transit example using just a car dash exterior temperature sensor. Good that Kirye Heller has updated it, and it still holds true. Fun thing about true facts, they are stubborn.
In the essay, I followed this time series example with an analysis of California counties, a cross section at a slice in time showing that more populated counties (x) had higher average temperatures (y) with a very high regression r^2. Yet more proof of UHI.
From which we can safely conclude that the historical surface temperatures used to tune climate models are not generally fit for purpose. Some of the supposed GHE is just UHI. Maybe half.
And homogenization cannot fully solve this inherent problem; subject of a past guest post here using the WUWT 2008 Surface Stations Project Class 1 (best, most properly sited and maintained) stations partitioned into three groups: urban, suburban, rural. Homogenization removed (some) urban UHI but added it to almost all suburban and rural stations. The analysis simply compared raw to homogenized per NOAA HCN and NASA GISS. Only analytic issue in the post was small sample size (n=14) since there aren’t very many ‘best’ surface stations in the US. On the other hand, no statistics. Just indisputable side by side historical comparison graphs for each station, raw/adjusted delta T.
The goal isn’t to discern what is “true”, Rud. The objective is to generate sciency “evidence” that Western Civilization needs to be shut down. But you know that.
You describe the climate goal of folks like Oreskes and Figueroa.
The climate goal of ‘climate science’ folks like Hansen and Mann is academic fame and fortune.
My climate goal remains simply providing cost effectively as much truth as possible. My ‘fame and fortune’ was already earned in a different venue. Hence my inexpensive ebook Blowing Smoke: Essays on energy and climate. And hence this comment for those wanting further information on the confounding reality of UHI.
In 2000, Scripps determined that global cloud cover changes since 1952 had cooled the Earth. I expect that this negative feedback effect is still at work, hence ECS could be less than the no feedback range of 1.1 to 1.2 degrees C per doubling of CO2.
Most studies have found that, despite the warming effect of low-level clouds at night, the net effect of clouds high and low is cooling. More moisture in the air of a warming world should mean more clouds, hence more cooling.
Positive feedback effects are rare in nature. The models also can’t handle evaporative or plant transpiration cooling. They’re all about exaggerated IR radiation GH effects.
I highly recommend Rud’s e-book “Blowing Smoke.” The events it describes and its accompanying analyses are timeless.
[Why nobody has acted on Marcott’s scientific fraud I’ll never know.]
You’re far too generous with your assessment of Hansen and Mann. At the bare minimum they are willing accomplices to societal destruction, just like GE and many other big business crony capitalists. There are many motives, but they are all guilty of the same objective crime. In no way was I impugning your motives, though.
Las Vegas’ newspaper, Review Journal, has a front page story (continuing on the inside) showing an increase in heat-related deaths which, according to the story, is associated with increasing temperatures locally. I’ll try to get in a Letter to the Editor pointing out: 1) Their Union of Concerned Scientists “expert” saying it is because of increasing high temperatures is belied by the accompanying graph showing no significant increase in maximum high temperatures since the 1990s; 2) the accompanying graph showing an increase in overnight low temperatures only shows the effect of UHI; and 3) the accompanying graph of heat-related death by year does not correlate to the graph of maximum temperature changes by year.
It has nothing to do with air conditioners blasting hot air from hotels and casinos into Vegas streets, of course.
When my wife and I were there in July 2014, it was 113 F outside and about 70 inside. Hoover Dam has long since been unable to meet Vegas’ power needs.
So much water is being used in many desert communities that there have been measurable changes to vegetation down wind from them.
This increased water vapor in the air also traps a lot of heat.
Measuring/showing UHI.
Forrest Mimms III, in a booklet published by Radio Shack in the 1970’s, is the earliest description/measurement that I’m aware of.
Decades ago I was in charge of some apartments here in Finland as a Housing Manager. And since that our family house in countryside. The cold winters (-25°C) and warm summers (+30°C) has tought to understand what heating and cooling degree-days (HDD and CDD, respectively) means.
UHI is well known in the 2004 Encyclopedia of Energy. This study claims ”The impacts of UHI on energy can be seen on regional, urban, and building scales.” Source:
https://www.sciencedirect.com/topics/social-sciences/urban-heat-island-effect
Nobody doubts UHI. The literature has 100s of articles. What is astounding is that the temperature adjusters have concluded that it doesn’t matter…trivial. They adjust what helps the warming trend, ignore if it doesn’t.
Mk1 eyeballs says the trend for Hachijo Island has been flat since the late 1970s. Likewise, the trend for Tokyo was essentially flat from the late 1990s up to the recent Super El Niño.
It appears that the latest Super El Niño kept Hachijo Island’s temperature trend from declining since the late 1970s. Settled science, my ass.
Super El Niño of 1997-98 warmed the island more than did SEN of 2015-16, since which time it has joined in the global cooling trend. The Pause between the two SENs is also evident there.
Why is anyone really surprised…..
We’re told that Hachijojima Island is ‘rural’Yeah right OK, it’s not built-up urban that’s for sure.
But even from the Google Satellite view all you see, apart from the airport and steepest parts of the volcano, is what appears to be trees, very densely packed trees, vegetation and greenery
And a brief ride around on Street View confirms that….
Hachijojima Island is an extremely fertile and verdant place that has not been cut, burned, ploughed, fertilised or Rounded Up
And Ye Shocke Horreur, the temperature has remained the same.
If that is not proof of Soil Erosion at work almost everywhere else on this Planet, pray tell what is?
The soils of Hachijojima Island are brand spanking new and have not been eroded by the processes mentioned.
Thus, the ‘re-radiated in all directions radiation‘ has bounced clean off the place, assuming it even existed in the 1st place. And as far as CO2 goes, is not even measurable despite all the technology we now have.Oxygen and Nitrogen have vastly more absorption and emissivity than CO2 could ever hope for – there-in is The Big Lie of Climate Science.
I’ll further put my neck right out on the line and assert that Hachijojima Island is (another) one of the world’s Blue Zones.(It’s worth finding out what and where they are – they do have one notable thing in common – something that is never mentioned in their descriptions)
But how they came to fame is that Blue Zones are where healthy, happy, well-adjusted people live to be 100+ years old without turning into zombified blobs of brain-dead, magical thinking, chronically depressed, money-grubbing, diabetic, cancer riddled, arthritic, misanthropic and paranoid blubber, even before they get to age 50 as is the Western ‘never better‘ way. While the zombies stagger their way from one heart attack to the next.
‘simply’ because the Hachijojima Islanders live on a volcano. (and probably do a lot of their own gardening/food growing)
Don’t you wish you did…………
Your claim that “Oxygen and Nitrogen have vastly more absorption and emissivity than CO2 could ever hope for” is one I’ve never heard before.
Why do you think so?
Can you provide a reference that will support that claim?
Thanking you in advance.
Re: Urban Heat Island, more reading from an earlier WUWT article
The Climate Sciences Use Of The Urban Heat Island Effect Is Pathetic And Misleading – Watts Up With That?
Old example of constancy of temperatures under increasing global CO2
http://www.geoffstuff.com/macquarie_gw.jpg
Geoff S
Alex, I’ll take “urban heat island” for a million bucks. I’ll start planning my big vacation.
Well. There is lots of water around it to moderate the air temperature. Okinawa is pretty moderate too.
I think Roy Spencer showed all the supposed heating in the USA is from UHI, remove that and the continent has cooled over the last 90 years.
I know that the Scientologists will just say it’s a small part of the world, have to look at the whole world;
The USA isn’t the world but it has good records (at least for now)
The “world” graph seems likely to be all UHI as for most of the rest of the world the only long term temperature records are from major centers.
It seems to remain true that warming since the LIA has been very modest and very beneficial
Everything else is baseless speculation.
Odd then that large parts of Japan are seeing a record heatwave following a record early end to the rainy season
It’s called weather Griff. Look it up.
Moron. You are simply confirming exactly what this article says with no understanding of what you are talking about. All of the high temperatures recorded in Japan this year have been in cities – highly urbanised areas subject to extreme UHI effects. Meanwhile, outside of the cities, the rural temperatures are flat.
Climate Change is an artefact of Urban Heat Island effect solely – heat caused by modern activity and increased urbanisation. Change the city planning to cope with urban heat and there will be no more problem.
Paid troll spewing nonsense
Regarding mean monthly June temperatures at the Tokyo and Hachijojima Island sites, the JMA source cited states that there are “data inhomogeneity caused by changes in instrumentation, observation methods and/or site location” at Tokyo since 2016 and at Hachijojima Island since 2004 (denoted by the red lines on the charts). This should be reported in any attempted trend analysis.
So all the changes, methods, etc. caused temperature measurements to decrease thereby resulting in no temperature growth?
Funny how that hasn’t happened elsewhere where new measurement devices, locations, methods, etc., have always resulted in higher temperature measurements.
Of course 😉
We have increasing CO2 yet we still get cold. In fact, where I live, April was the 4th coldest ever. I tried running the Jeep more for the extra CO2 and it didn’t help.
How very convenient. I’m willing to bet that if the temperatures were increasing then there would be no problem, would there?
I wonder if Nick S will be along soon to tell us that the lack of warming is precisely what CAGW theory said would happen.
Or maybe Bigloilbob will swing by and post some nonsensical word salad.
But but but, whatabout heat waves, fires, floods, droughts, storms, refugees, wars, starvation, rapes, etc. etc.? Right Griff?
I have to say I’m not very impressed by these temperature trends restricted to a single month or season. Slightly interesting at best.
Do you think the adjust temperatures like they do elsewhere?
It’s a regular feature on
https://notrickszone.com/
You should follow it closely. I can’t recall a month and location showing significant warming
Statement of absence of warming at one island in one month of the year surely sounds like cherrypicking. So, I Googled for a map of trend of v. 6 of UAH TLT, and found one as of the March 2015 UAH data at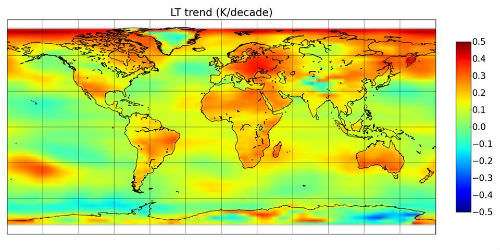
This is in https://reason.com/2015/05/04/satellite-global-temperature-trend-revis/
As of that time shortly before the big 2015-2016 El Nino spike, the trend from the beginning of 1979 to that time was .114 degree C/K per decade globally, .19 degree/decade over land, and .08 degree/decade over ocean.
The degree C/K per decade trends of UAH TLT v. 6 from January 1979 to June 2022 to the nearest .01 degree/decade are .13 globally, .18 over land, and .11 over ocean according to https://www.drroyspencer.com/ as of 7/4/2022.
The rate since 1979 has been about 1/3rd of what has been forecast. The UAH temperature measurement from space almost perfect matches the new CRN pristine rural network in the USA. The other data sources (BEST GISS HADCRUT RSS, etc) have all been recently adjusted…and surprise…the results are exactly what you would expect from the politburo controlling the data… stronger warming trend, cool the 1930s, much better match of T to CO2. Amazing.
Looks to me like Japan is basically in the 0 – 0.05 range (I’ll call it lime green).
The same for Katsuura (near Tokyo). No warming in the last 100 years: