Antarctica sea ice is at a “mind-blowing” record low winter area of 17 million square kilometres, reports a three-person BBC “News Climate & Science and Data Journalism Team”, as lower levels than those recorded in the recent past provide the cue for yet more media climate hysteria. Of course, the BBC headline is clickbait nonsense, not least because it has been generally known in scientific circles that early NASA Nimbus satellites showed even lower winter levels around 15 million sq. kms in 1966. But the BBC story does provide an excellent example of how science is twisted to fit the political narrative supporting the collectivist Net Zero agenda. Any unusual variation in weather and natural events is treated as evidence of a climate collapse requiring urgent human intervention.
The BBC reports that according to satellite data, sea ice surrounding Antarctica is well below any previous recorded winter level. It is said to show a worrying new benchmark for a region “that once seemed resistant to global warming” — that last phrase of course is a reference to the fact that Antarctica has shown little or no warming over the last 70 years. Dr. Walter Meier, who monitors sea ice with the Colorado-based National Snow and Ice Data Centre, helpfully added: “It’s so far outside anything we’ve seen, it almost mind-blowing.”
This would appear to be the same Dr. Walter Meier who was part of the science team that cracked open the secrets of the early Nimbus data that revealed significant Antarctica sea ice variability in the 1960s, including a high in 1964, not seen again until 2014, and the low for 1966. This is what he told NASA Earth Data in 2016:
Even in the passive microwave record [available since 1979] for the Antarctic you see these seesaws where the ice concentrations go up and down, so extreme high or extreme low are not that unusual. What the Nimbus data tell us is there’s variability in the Antarctica sea ice that’s larger than any we had seen from the passive microwave data. Nimbus helps put this in a longer term context and extends the record.
At the time, the Nimbus Data Rescue Project won awards and was highly praised for re-examining data that had been kept in store for 40 years. Meier noted that the longer term context that the Nimbus data provides is really valuable and useful for the science community. These days, Meier tells the BBC he is “not optimistic that the sea ice will recover to a significant degree”. Another member of the Nimbus recovery team has noted that the data would improve the accuracy of climate models, since predicting the past successfully can help projections going forward. Whether any of this has been taken on board is a moot point. Certainly Dr. Meier doesn’t seem to have shared his previous enthusiasm for the Nimbus data when he recently spoke to the BBC.
What a difference just seven years makes in the climate alarm business.
As the Daily Sceptic has often noted in the past, Antarctica is a difficult place to create climate panic. Over the last seven decades there has been little or no warming over large areas of the continent. What warming there has been on the west side is directly on top of large numbers of volcanoes. According to a recent paper (by Singh and Polvani), Antarctica sea ice has “modestly expanded” and warming has been ‘”nearly non-existent” in this period. According to NASA figures, the ice loss is 0.0005% a year. Another recent paper found that ice shelves surrounding the continent grew in overall size in the years 2009-2019. As an example of how humans cause the climate to warm by burning fossil fuel, Antarctica leaves a lot to be desired.
The BBC article, co-written by the increasingly prominent green activist Georgina Rannard, is a classic mainstream media cherry-pick of one year of natural variation to support the view that the climate is somehow heading for collapse. As can be seen in this case, evidence that challenges the wild ‘scientists say’ predictions is ignored, and seemingly not considered suitable for inquiry. Dr. Caroline Holmes of the British Antarctica Survey is reported to note that when summer comes, “there’s potential for an unstoppable feedback loop of ice melting”.
“Are we awakening this giant of Antarctica?” asks Professor Martin Siegert of Exeter University. “It would be an absolute disaster for the world,” he adds in response to his meaningless first utterance. Professor Anna Hogg, who is reported to be an “Earth scientist” at the University of Leeds, opines that there are signs that what is happening to Antarctica ice sheets is in the worst case scenario range of what was predicted. Predicted by what? Almost certainly computer models using a ‘pathway’ assuming 5°C global warming in less than 80 years. That pathway, regular readers will recall, infects about half the headline-grabbing predictions now made by climate science papers, despite the International Panel on Climate Change deeming it of “low likelihood”.
So it continues – ‘settled’ science corrupting much of the scientific process while inconvenient facts and data are ignored in the interest of persuading populations that time is running out to save the boiling planet.
Chris Morrison is the Daily Sceptic’s Environment Editor.
2023 max. is only marginally below 1986 too.
Zero trend in the entire modern satellite era.
And extent does not equate to total amount of sea ice anyway, need to take into account concentration and depth.
We’re doomed, all doomed….. I’ve still ordered my Christmas Turkey on the off-chance we survive that long.
“on the off-chance we survive that long.”
Bet the turkey doesn’t.
The BBC is tax payer funded and all we get is a constant stream of climate emergency doom ridden nonsense. I would like to see them privatized, sold off to Fox news and my license fee refunded .It seems that every hour of every day they campaign for net zero to be brought forwards to next week no matter what it costs
I’ll be dogged another case of extremely-common-rarities
“Claims of Record Low Antarctica Sea Ice on BBC”
For the last 24 hours or more the BBC has been wetting itself copiously every hour on the hour about the possibility that Sunak might row back on some of the Net Zero crap. Justin Rowlatt is having emergency surgery to relieve a clot on the climate region of his brain as I write. A sad case.
“Are we awakening this giant of Antarctica?”
Sorry, that news has been superceded. That’s the rolling news cycle for you.
something I noticed is that they no longer open comments on any climate stories. ##
Because, the last few times they did, their hysterical alarmism was utterly slaughtered.. Very few people now want to hear it.
## Maybe the moderator’s delete key is busted after I’ve had my way with it 😀
Gosh. They banned me back in the noughties
Text internet is peopled largely by philosophical proponents that cannot be noted or allowed to be known. One would think capitalism would fix it but … philosophy.
(The cool kids are posting pop culture on instagram)
One of my favorite stories about capitalism vs worldview conflict is Conan O’Brien describing how he was hired to draw young culture refiners but then criticized for not attracting old money accumulators. He used different/better words to tell the story but I doubt he can solve an integral. We getgoodstwhat we do, and unless we’re careful we forget that other people do to.
I’ve noticed that Yahoo seems to be preventing comments on gun control articles lately, even when MSN is allowing comments on the same article. Also, I’ve been informed by MicroSquish that the email account I have had with them for about 30 years has been locked, supposedly because I have somehow [unspecified] violated their terms of agreement. At the core, is that they have been asking me for months to provide both an email address and a phone number that will accept text, which I have resisted providing.
I changed banks (from Ally) because they required text for 2-factor auth. Where I live, SMS is unreliable. It’s not viable to have to drive 5 minutes to get a text then drive back just to log in to my account.
There are other options, but some companies don’t care that much about people who don’t have/want that sort of thing.
The extreme lefties at the BBC are so desperate that they are singing the praises of Margaret Thatcher and even Boris Johnson who they’ve just managed to get sacked because they believe them to be champions of screw ball net zero targets. They really are losing their tenuous grip on reality
Good catch of another example of the headlong rush to Net Zero Fantasy Land. Here is a problem with Antarctica sea ice, there are two types. Some is frozen in place seawater and some is land-originating glacier ice pushing out to the ocean. When there is a lot of snowfall over land the glaciers grow and undergo slow fluid movement toward lower topography, sometimes ending up in the ocean. This push from glacier ice can push seawater ice out far enough to destabilize it and it breaks off or melts. We need a distinction between the types of ice. No doubt the Antarctica is misbehaving with the Climate Change scam.
And, the ice-shelf breaking off into huge icebergs is, I suspect, at a hinge-line where the valley glaciers are grounded on an old terminal moraine. The tides probably cause the ice to flex and break at the hinge-line, and then up-welling water going back out to sea drags the raft with it after detaching along a tension or flexure crack.
I didnt think they had tides , but they do . But only once per day in The Ross Sea area and not in phase with moon. The Ross Sea has a large ice shelf
https://niwa.co.nz/sites/niwa.co.nz/files/import/attachments/tides.pdf
Tony Heller just did a video on this topic: https://www.youtube.com/watch?v=sPR5h3fJmNU
Heller is comparing sea ice extent for August 1966 to extent for September 2023, apples to apples. The sea ice extent for August 2023 was 15.5 million sq km:
Why anyone takes Tony Heller seriously I will never know.
Wrong. The video linked above compares sea ice extent for precisely the same dates in 1966 and 2023.
Nope, he compares the same dates in 2023 and 1986, but in that case the extent in 2023 is much lower than the extent in 1986. He then compares August of 1966 with September of 2023.
If you’re feeling confused by what Heller is done, that is precisely his intention. Obfuscate and mislead, that’s his modus operandi.
My error, I should have said 1986, but the 2023 difference is barely discernible and certainly not “much” lower.
I can’t agree with your description of Heller’s climate posts, which are quite straightforward and a valuable counterbalance to some of the hysterical reporting of ‘climate’ events. It’s a pity that he devalues them to some extent with excursions into Covid vaccinations etc. but they can be ignored.
I appreciate the acknowledgement. However the much bigger issue I pointed out is that Heller goes on to compare September of 2023 with August of 1966 – when you compare August 1966 with August 2023 you see that 2023 extent was actually lower. It’s blatant dishonesty on Heller’s part.
They aren’t straightforward at all, they’re convoluted and deceptive, as this one is. Every single one of his posts contains similar falsehoods when you dig into it even a little bit. He continues repeating the falsehoods even when his readers point them out to him, so there can be no ignorance defense.
It appears that August 1966 was used in the comparison because (according to the text in Meier’s article) that’s when the maximum occurred.
August was used because the film on Nimbus II ran out on August 31st. Note that Meier also says that the August 1966 is “not physically likely” because it was lower than the July 1966 value. Nevermind that the 15.9e6 km2 value for August 1966 is still HIGHER than the value from August 2023 anyway. This WUWT article is just dead wrong and even the most half-assed attempt at validating the claims therein would have uncovered the truth.
“there can be no ignorance defense.”
So what defence are you going to use ??
However the much bigger issue I pointed out is that Heller goes on to compare September of 2023 with August of 1966 – when you compare August 1966 with August 2023 you see that 2023 extent was actually lower. It’s blatant dishonesty on Heller’s part.
All garbage. You compare one year (or season) with other. Individual months have nothing to do with it. If 1966 coverage was greater than 2023, that is all we need to know.
That should be lower not ”greater”..
Oh this lack of edit is a problem….
Heller is the one comparing individual months. Best take this objection up with him.
So if you think it is unimportant why bring it up?
“My error, I should have said 1986, but the 2023 difference is barely discernible and certainly not “much” lower.”
Sept 20 1986 max 17.99km2
Sept 9 2023 max 16.96km2
Just over 1 million km2 lower.
Over a month of melting before it reached that level in 1986.
No, it was YOU who is misleading people since you left out some of the information Tony Posted,
LINK
Posted sea ice values,
Maximum extent this year occurred on September 12 at 17,588,125 km. sq.
September 1986: similar to 2023 while Meier stated 1966 was definitely LOWER than 1986.
August 1966: Walter N. Meier states the following in 2014,
LINK
bolding mine
Stop making misleading claims!
Heller says that September 2023 had a lower extent than September 1986. This is accurate. Heller then says that August of 1966 had a lower extent than September of 2023, without noting that maximum extent occurs in September, making his comparison apples to oranges. Heller knows this is not a valid comparison, because he has made it intentionally. He is trying to deceive you.
Again… being so anal that you are missing the point.
(Deliberately, I suspect.. as you attempt your
Even in the very short period of data..
…. Antarctic sea ice has been at similar low levels in the past.
And the world is still here.
So stop your childish chicken-little PANIC. !
Darn, half a line disappeared…
(Deliberately, I suspect… as you attempt your petty distraction)
” Heller then says that August of 1966 had a lower extent than September of 2023,without noting that maximum extent occurs in September, making his comparison apples to oranges”
You’ve got to be joking. Surely?? Forget the months. Compare the peak for one year with the peak of another year. If they are the same , or nearly so, It shows in this case, you cannot use the co2 narrative. Isn’t THAT THE POINT?
Comparing ice extent at the maximum is exactly what I am proposing that should be done, and it is not what Heller has done.
He also stated that the August 1966 data was probably wrong.
Rubbish. In one respect you’re quite right – in an ideal world he should have compared September 1966 and September 2023 as the annual maximum sea ice extent is during September and it is usually used as one of the reference points (maximum and minimum). However, early Nimbus data is patchy and incomplete – there is no data for September 1966 (extensive cloud cover possibly) but it is acceptable to use the nearest month that there is data for, which happens to be August 1966, in comparing maximum sea ice extent for both years. So he is comparing available data of maximum sea ice extent for both 1966 and 2023 and you really do get worked up over nothing.
Alan J is arguing over one prawn cracker after a $300 Chinese meal as if it’s important.
I am right in the only respect that matters. Heller is comparing sea ice extent in August, when the ice is still growing, to sea ice extent in September, when it is at its maximum, and claiming the two things are the same.
The mental gymnastics taking place in this thread to try to defend Heller is amusing to watch. The denial is slowly pivoting from “Heller is 100% right” to “Heller is wrong but who cares?”
And at least in the case of August 1966 probably incorrect as the article author’s own source says.
That is absurd because 1) the maximum usually occurs in September and 2) the August 1966 data probably isn’t even correct.
If we used August as a proxy for the maximum then from 1979 to present we would have been wrong 93% of the time. I don’t know about you, but I’m not going to be so cavalier in insisting on using a methodology that has less than a 7% success rate.
So you’re not a fan of facts then. More fool you.
If you’re curious the facts can be found in [Gallaher et al. 2014]. AlanJ has his facts correct. Chris Morrison…not so much.
The point is that Antarctic sea ice has been at similar low values in the past.. so..
DON’T PANIC !!
The cultists don’t panic, they obfuscate and dissemble. They are very deliberately dishonest shills.
Poor AlanJ.. Major comprehension issues yet again.
The maximum in 1966 just happened to be in August
Why is it you have such bad luck with your comments ?
The point is of course, that even over such a short time period as we have data, MASSIVE SWINGS have happened.
And of course the Antarctic has been COOLING since 1979…
Will be hilarious to see how AlanJ links to drop in Antarctic sea ice this year to anything humans have done.
But then , all his comments are a joke
I don’t think anyone is disputing that sea ice extent in Antarctica is highly variable. I certainly am not. What I’m doing is pointing out rather glaring factual errors in Heller’s video. You can both accept that Heller’s video is factually incorrect and be a global warming skeptic. Being wrong isn’t necessarily a prerequisite, though it seems like a popular option around here.
AlanJ.. Back piddling !
“though it seems like a popular option around here.”
Yepo.. Posts by AnalJ !
You purposefully ignored all of the clarifications provided by others that the point of August or September wasn’t the pertinent point as it was season vs season. You are attacking Heller because that is what cultists like you have to do.
Those clarifications are not valid. August vs September is comparing ice extent mid-seasonal growth to sea ice at its seasonal maximum. I am exposing Heller’s falsehoods because I believe he is intentionally dishonest.
Wouldn’t the high variability of sea ice extent, despite an overall cooling trend be evidence against any link between global temperature increases and ice extent at least in the Antarctic? In other words, while possibly misleading comparing August to September isn’t it much more intellectually dishonest to try to link Antarctic sea ice extent to climate change? Is the mechanism explaining the variability really understood and linked to human causes? To me this seems to be very big stretch, but they know a lay person sees “less ice in Antarctica” and thinks “Climate change is really happening and getting worse” which I’m pretty sure is the hoped outcome from activist scientists.
Jonny5, it is a good question. The problem scientists are faced with right now is that the recent Antarctic sea ice declines are not inline with expectations. For example, in 2013 the IPCC predicted that sea ice down there would more likely than not increase up until 2030 or even 2060 before beginning a long secular decline. So this recent and dramatic decline is raising eyebrows. Is it a transient decline or is it the beginnings of a new climate regime?
Further into the paper:
The maximum was not in August, it was in September, when the maximum usually is, but the satellite did not capture any data for September. You should probably dial back your snark until you get a better grasp on what’s being discussed.
You should dial up your intelligence until you figure out what is being discussed.
It Is not discernible at the moment!
Fact is that low Antarctic sea ice has been noted before, even in the short period of data we have.
Stop your pathetic whinging… and wake the **** up to reality.
Now where’s that fantasy of human causation.. !
“August 2023 was 15.5 million sq km:”
So, within the error margin of the 1966 reading.
You poor muppet !!
Also note that the minimum for August 1966 was 14.39 Wadhams..
… while the minimum for August 2023 was 14.80 Wadhams
Tony Heller has a knack for calling out bs in the most transparent way. Tony Heller for Climate Czar. Good Bye Kerry.
Sure, Tony makes mistake like every other human being. But when you watch his videos on a regular basis, he’s very convincing. Like, if somebody says, “the flood this year is the worse ever in the State of Whatever”- then Heller shows several newspaper and science journals discussing how there was a much worse flood in the State of Whatever a century ago- so do I believe the climate nut job with a degree in English lit writing the fear story or do I believe Tony, who is very highly educated with a track record of a master computer software debugger and years of studying the climate issue? I’ll go with Tony. But for Climate Czar I’d vote for Stephen Koonin with Tony as his assistant.
There’s a reason why Heller no longer posts here that’s because of his behavior when it was pointed out he didn’t understand how to read the Phase Diagram of CO2 and wrongly claimed that CO2 froze on Antarctica. He threw a tantrum and hasn’t been allowed back. He’s the last person who should be ‘Climate Czar’!
And you are the last person who should criticise Tony Heller.
You contribute absolutely nothing to anything.
On that occasion I was the first to criticize him and was proven right. His temper and refusal to accept the evidence presented to him led to being banned by Anthony.
So what? How does that invalidate all the evidence Heller has uncovered of fraud and data-tampering by the Climate Cultists?
Keep in mind that his claims of fraud and data tampering were so egregiously wrong that it eventually lead to WUWT banned him from further participation here.
Name Heller’s falsehoods.
It’s probably better to let Anthony Watts do that.
https://rankexploits.com/musings/2014/how-not-to-calculate-temperature/#comment-130003
An argument about averaging temperatures? That’s all you have?
There is no such thing as an average temperature for a geographic area as an intensive variable like temperature cannot be averaged.
You asked for falsehoods. I gave you a link to the ones that eventually lead to WUWT banning him.
Hopeless response from you. A difference of opinion between Watts and Heller about how to measure an unphysical, imaginary temperature.
Nobody’s perfect. Everyone who talks about the climate gets something wrong. He gets a lot of things right.
A historian, a student of “international studies”, and—huzzah!—someone with a relevant qualification, in remote sensing. But amusingly the one with the relevant qualification just draws the graphs.
I’ll add them all to my growing who’s-who of PPE graduates, entomologists, etc. whose opinions on climate and energy I am expected to take seriously.
I’m relevant! I do remote viewing!
As a student I learned “tell the professor what they’re asking to hear”. Independent thought has no place in liberal arts education- but lib arts ed is a standard side car for engineering curricula “to round us out”.
“According to NASA figures, the ice loss is 0.0005% a year.”
The quote above doesn’t specify whether this is sea ice or land ice, but at this rate, it would take 200,000 years for the ice to disappear. Which would leave our distant descendants living in coastal cities plenty of time to build sea walls or head for the hills.
Unless the trend reversed itself over the next few centuries. Which is entirely possible, since the Medieval Warm Period of circa AD 1000 – 1300 was followed by a sharp cooling trend between AD 1350 – 1700.
Hopefully “climate change via CO2” is close to what the bed-wetting pseudo scientists actually predict – we’re going to need at least an extra 3-5°C to insulate us once the current warming trend ends. And judging from the 1300’s and also the 500s when the Roman warming period seemed to end, the end of a warning period is sudden and sharp and usually associated with the onset of plagues and other disasters.
The Grand Solar Minimum has already started and even NOAA is predicting the Sunspot Number to start dropping in 2025 reaching single digits in 2031 and zero in 2040 when their forecast ends. The cooler sunspots are associated with the hotter area that together send out more energy than a quiet area so it will be getting colder as the number of sunspots decreases. The Earth’s current temperature is only a degree or two Celsius warmer than the end of the Little Ice Age in 1850.
https://www.swpc.noaa.gov/products/predicted-sunspot-number-and-radio-flux
Explains the utter panic to get all their moronic anti-society Nut Zero crap in place. !
Not enough humans understand what you just wrote.
0.0005% a year. We are all doomed. Can’t you see?
Breaking news…
“”Rishi Sunak confirms green policy ‘U-turn’: PM says drivers will still be able to buy petrol and diesel cars until 2035, working boilers will never have to be ‘ripped out and replaced’ and scraps plans for homes to have ‘seven bins’ each””
https://www.dailymail.co.uk/news/article-12540973/Rishi-Sunak-gives-major-environmental-speech-amid-furious-Tory-row-green-policy-U-turn-including-delay-petrol-car-gas-boiler-bans.html
Hopefully, the first of many axes to fall on the necks of the climate clowns
New petrol and diesel cars until 2035 and second-hand after that. Was there a clause in the original ban that meant you wouldn’t have been able to buy second-hand after the date of the ban?
That “around” is doing a lot of work, the winter extent in August 1966 as measured by Nimbus satellites was 15.9×10 sq km ± 0.3×10 sq km, according to NASA. The extent for August, 2023 was 15.5 million sq km from NSIDC.
Counting numbers up to 10 do real work.Numbers involving scientific notation or in Mega- or Nano- units are for retail stores that went out of business in the 1890’s
“On the other hand, in the 1972 analysis of the 1966 Nimbus II data, Sissala [14] reported an even lower August ice extent of 15.17 million km² .”
The point AnalJ is trying in vain to cover up is that Antarctic sea ice, even in a short 60 year or so period where we have the possibility of semi accurate data..
… has been AT SIMILAR LOW LEVELS
Unlike the Arctic, where biodata clearly shows current levels to be very much higher than most of the last 10,000 years
AnalJ.. you are acting like a deeply traumatised child, !
DON’T PANIC !
ps the value in the table in the pdf used is 15.9×10 sq km ± 0.4×10 sq km
so August 2023 was indistinguishable from August 1966
The establishment field of climate studies abandoned proper science 4 decades ago.
They saw more prosperity in hooking up with mainstream media outlets and career bureaucrats, both of which groups wield absolute power over elected politicians.
This cancerous climate co-op ain’t gonna go away voluntarily.
Paging Auntie Beeb (It’s me again, is that delete key fixed yet):“”Suella Braverman slams ‘militant’ climate activism and Chris Packham documentary””
Interesting from the Indy
Packham is only interested in one thing. Promoting Packham. He’s a most odious creature who wouldn’t know a fact if it slapped him in the face.
Agreed – a very unpleasant character, gets aggressive when he doesn’t get his own way. I am not surprised he’s turned to promoting climate terrorism.
Morrison seems to be wrong, the Nimbus data does not really show 1966 ice extent to be lower than today, on a strict month by month comparison.
This current anomaly is just that — an anomaly. It might be consistent with a huge warming pulse of CO2. But there was no such pulse, CO2 levels continue to rise, very slowly, as before.
It might be consistent with a pulse of another GHG, water vapor, which indeed did pulse, into the stratosphere, in the 2022 Tonga underwater eruption. But even that doesn’t fit the pulse curve very well.
Maybe it’s our old friend, Ekman divergence, which turns opposing Southern Ocean winds into upwelling ocean currents, which cause warmer upwelling currents to melt the Antarctic ice.
https://www.mit.edu/~mgl/pdf/ramadhan2022observations.pdf
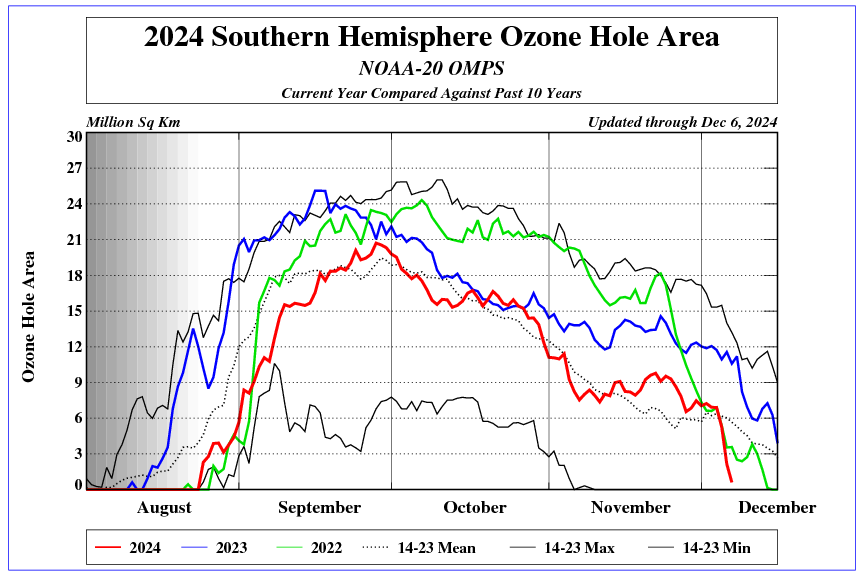
The so-called ‘ozone hole’ is anomalous this year too, opening early. I suggest that we wait to see what happens next year before we get too excited.
But…but…but it’s a climate EMERGENCY. We must act now! (OK, I’ll get my coat).
I should also point out that the Nimbus data from the 1960’s was instrumental in the discovery of polynyas, which are persistent pools of water convered by thin ice which were first observed by Nimbus in the Weddell Sea. This actually ties in with the Ekman pumping hypothesis I raised above, which may explain how the egdges of ocean ice are melted by certain wind patterns which induce the upwelling of warmer water in the Southern Ocean.
https://tc.copernicus.org/articles/17/2681/2023/#:~:text=Strong%20polar%20easterlies%20also%20produce,less%20dense%20relative%20to%20observations.
I’m using the free version of Windy which shows a humongous ozone hole (Dobsons < 220) over the entire Antarctic (CAMS model). Can’t run the GEOS-5 model. How big is it from your observation/model?
Of course, being a skeptic, I wonder why these ozone holes always seem to show up at the South Pole, but most of the corrosive halogens causing them are from the NH. Makes you wonder what this ozone-hole narrative is really about.
I attached an image of the Windy Antarctic ozone, but not sure it will show up. First time try.
Firstly the ice didn’t melt in the Antarctic, it was broken up by storm surge and strong winds in Feb-March this year, which inhibited extensive sea ice formation for the last few months.
Actually, I didn’t claim that any ice had melted. I was just theorizing about possible mechanisms to explain the anomalous extent, one of which included Ekman pumping which the authors claimed could cause upwelling warm water from the Southern Ocean to melt the ice from underneath.
But I have been to the Bransfield Straits in Feb and observed above zero temps and long hours of sunlight. The Antarctic ocean ice does break away and melt. That’s the main reason why the summer ice extent is so much smaller than the winter extent. Don’t you agree?
That’s the point I’ve been making, over and over again. Antarctic ice breaks away and when it finally does melt it is a long way from the ice shelves often in warmer waters outside of Antarctic waters.
Antarctic sea ice forms all year round but relatively warmer temperatures in summer slow down the formation of sea ice which then increases as the temperature gets colder towards the September winter maximum. Storms will break up sea ice and are the most common reason for lower than average sea ice extent – this year there was a violent storm season and some unusually warm weather that broke up sea ice and inhibited further sea ice formation in Feb-March which has had a knock-on effect this winter. You’ll notice from the charts of sea ice extent that this unusual weather pattern didn’t extend across the whole of Antarctica – some areas exceeded the average sea ice extent by a large margin.
“extreme high or extreme low are not that unusual.”
Someone needed to look in a dictionary 1 if extremes are not unusual in a context then they’re not extremes for that context.
Extreme cold happens every day in Antarctica.
Extreme hot is pretty common in desert climates.
But it seems IPCC are trying to make us believe that extremes are very,very rare, unless they are man-made.
Extreme is a relative term. What is common is not extreme.
| Extreme is a relative term.
It can also be absolute. Minus 60F is extremely cold. Happens a lot in the Antarctic. Do you not agree?
That’s hot compared to outer space at -453F.
For most of us humans -60F is extremely cold. That’s an absolute sensation for humans. Relatively cold for penguins. -128F is the coldest temp in Antarctica.
-60 is indeed very cold in human terms but its occurrence in Antarctic is not an extreme event, it is a common event. Extreme weather is relative to location. It is something that does not normally happen there, and more important, it is something fairly far outside the normal range there.
I’m unaware of even any Rule of Thumb that says improving the fit of a time-series will improve an extrapolation. Indeed, one is cautioned by the more experienced experimenters not to over-fit data out of concern that the fit will only apply to the particular data set, and be useless for a different set. That is, it will lose the utility of being a general predictor for even interpolation, let alone extrapolation.
What quality of people are being given sheepskins today?
| I’m unaware of even any Rule of Thumb that says improving the fit of a
| time-series will improve an extrapolation.
As a former practitioner of machine-learning (ten years retired) I agree that over-fitting a model on its training data is usually the enemy of generalization, if you intend to apply the model on data that was not contained in the training data.
But “underfitting” a model, by not allowing it to learn the patterns in the training data, is the enemy of learning in general. It would be the same as training on randomly generated data.
So in that sense, a climate model that cannot predict training data created from past data will be equally unskilled in predicting the future.
But in the case of the Nimbus data recovery by Gallaher, Campbell and Meier, there were more hardware issues than math modeling issues:
David W. Gallaher, G. Garrett Campbell, and Walter N. Meier; “Anomalous Variability in Antarctic Sea Ice Extents During the 1960s With the Use of Nimbus Data”, [2014]
So when the Nimbus recovery team said their efforts helped to “predict the past” what they meant (I think) was that through their hardware intensive recovery efforts they were able to create more data points in the past for future modelers to train their models on.
I think you would agree with the utility of that, but I think we both have doubts about trusting some of the future modelers to apply the past data correctly in their training sets.
So true. The punchline is that “they” know it but the people who request the graphs they Produce might not.
This statement is not correct.
1) The exact figure is 15.9e6 km2; not 15 million sq kms.
2) It is the mean for August.
3) It is likely incorrect given that the NIMBUS reading was lower in August than in July which is not physically possible.
4) If even if the 15.9e6 km2 figure is correct it is still higher than 2023.August 2023 came in at 15.5e6 km2.
See [Gallaher et al. 2014] and NSIDC for details.
The BBC report is correct according to the article author’s own source.
My apologies. I see that I am late to the game and that these points were already addressed by AlanJ.
WUWT editors…can you send this information to Chris Morrison so that he correct the article and resubmit for review?
Sadly what will most likely happen is that the falsehoods will be left untouched, anyone pointing them out will be downvoted to oblivion, and the falsehoods will be cited in ad nauseam in future WUWT discussion threads as though they are established fact.
Do you mean like Mann’s Hokey Schtick is served up as fact in all across academia, media, UN, bureaucracies, political parties, etc etc?
Or they ignore their chronic AGW based prediction FAILURES of the Hot spot and Positive feedback loop which they don’t talk about anymore…..
HAW HAW HAW……….
Yes, lies about Mann’s study are spread ad nauseam around this website as well.
Now into manic DENIAL .. you poor sad sod….
I suppose you think GISS is a manic fabrication..
Talk about “creative accounting”
It is rife throughout the whole of the climate scam.
You genuinely believe one can graft tree-ring data onto thermometric data, as Mann did? Really?
I don’t believe the loudest critics of Mann on this site actually understand the issues they’re angry about. Whatever problems there might have been in his early work, they’re never actually touched on, just the same rotating selection of rampant falsehoods. See: your comment.
Even the IPCC rejected Mann’s Hokey Schtick graph.
It is included in IPCC AR3 WGI SPM pg. 3.
Nothing gets downvoted to oblivion on WUWT. The downvotes are shown, but unlike on Ars the posts are not hidden.
And unlike on Real Climate, the posts are not deleted.
And unlike on both, and on Tamino, contrary posters are not banned.
This is one of the only places that permits real continued dissent and debate on climate and energy. Stop knocking it. Its giving you a forum which the climate activist sites will not do for dissenters.
Thank goodness too. The contrarians keep it interesting some days
Do you really think that variations in values to the right of the decimal point are meaningful for “amount of sea ice surrounding Antarctica” determined by pictures taken by early NASA Nimbus satellites? No doubt temperatures calculated to two decimal points are also life and death important differences.
I really want to see what fantasies the climate clowns come up with to blame this sudden drop in Antarctic sea ice on human CO2.
That will be hilarious. 🙂
| Do you really think that variations in values
| to the right of the decimal point are meaningful…
Did you consider that these statistics represent many thousands of IR readings and over 120,000 processed images. In those cases changes in the first or second decimal point may be statistically significant. [See my comment above about the Meier paper.]
As an example, the statistic number of children per family is always measured as an integer, but its expected value may include a few statistically significant decimal points, and can be useful for analyzing societies in terms of technology, education, wealth or occupation etc.
So think of the estimates of sea ice extent as expected values. Decimal points can be significant.
Given that sea ice extent is a discrete set of data with a set error range, covering instrument error, resolution error etc, using a derived figure with several significant figures would be ridiculous – almost as ridiculous as using a derived figure for temperature to 1/10th of a degree when the best instruments available can only measure to 1/3rd or 1/2 a degree.
But isn’t that exactly what scientists do? They create hypotheses (‘models’) of some phenomenon, which requires making observations/assumptions about its properties. These properties quite often end up as ‘random variables’, i.e. distributions of values representing measurements containing the various errors you mentioned. So the best they can do is ‘estimate’ the underlying ‘true value’, given the conditions and possible errors encapsulating the measurements.
So if you’re researching fertility drugs A and B, you might calculate the average number of children observed for test groups using one or the other drugs. If the average number of children of test groups A and B are 2.1 and 2.9 respectively, then doesn’t that suggest drug A is might be better than drug B? Even though not a single family was observed with 2.1 or 2.9 children?
Similarly, estimating Antarctic sea ice extent from the fuzzy and distorted recordings made by the pioneer Nimbus satellites might produce estimates with significant uncertainty.
For example, Meier and his team were unable to discern from Nimbus imagery if the polynyas they ‘observed’ in the Weddell Sea were open sea or thin blue ice.
| doesn’t that suggest drug
A isB might be better than drugBA?Sleep deprivation. :-]
“Are we awakening this giant of Antarctica?” asks Professor Martin Siegert
What is the name given to these sorts of questions when the answer is invariably, ‘NO’?
“Scared to make prediction but needing to sound confident” seems to fit.
Record ozone hole over Antarctica so far.
The southern jet stream seems rather wobbly at the moment, so we will likely see hot patches and cold patches around the SH, with large variations each way.
How can that be? We were assured that the Montreal Protocol in 1986, which banned CFC’s, would cause the ozone hole to close.
Banning of CFCs won’t cause the ozone hole to close. It will always be there. It’s just that it will shrink to its original size by around 2100 or so. We still have a long way to go before that happens.
The totally unknown “original size”, which may have often been as large or larger than since measurements began.
My memory must be faulty since I clearly remember being told at that time that the ban on CFC’s would cause the Ozone Hole to disappear.
You could be lying, of course, but thanks all the same for confirming that the Hole is perfectly natural.
Freedom of the press does not mean free to lie. We must find a way to punish these people. The proof that they were lying was easily at hand that is all you should need to dish out their punishment. I have already determined a suitable punishment for them. Any journalist/reporter or journal/news outlet caught flagrantly lying should be made to make sizable annual donations to outfits such as WUWT or Heartland or any number of climate skeptic organizations. Both the employer and the individual have to make the donations.
First, I’m not sure Chris Morrison was lying. The egregious mistakes here were certainly negligent, but that doesn’t mean it was necessarily intentional. Second, I don’t think having him make a donation to WUWT solves anything here. Afterall, WUWT had the opportunity to review the content for correctness and request changes. Rewarding them for choosing to post the article as-is seems counterproductive to me.
The BBC article posted this gob smacking hilarity since it is a hyperbolic statement that ignores how massively cold the Antarctica is:
HAW HAW HAW HAW HAW!!!
The small sea ice reductions are negligible when compared to the total surface area of the damn continent of which most of it is below ZERO year around.
Eggspurts huh!
Also, perhaps they should consider the fact that Antarctica has been GETTING COLDER ,;-)
And they still claim that the ice is melting in the Antarctic, with subzero temperatures!
1.5 degree Celsius warming should be cheered instead of condemned. The Earth is still in a 2.56 million-year ice age with 20% of the land area covered by glaciers or permafrost. 20 times as many people die each year from cool or cold weather compared to warm or hot weather. Increased strokes and heart attacks from cool weather are the main cause of the deaths.
‘Mortality risk attributable to high and low ambient temperature: a multi-country observational study’ https://www.thelancet.com/journals/lancet/article/PIIS0140-6736(14)62114-0/fulltext
The Singh and Polvani paper has been superseded. The slowest warming part of the planet is now also “warming faster than the global average”: https://www.nature.com/articles/s41558-023-01795-1#:~:text=We%20found%20that%20the%20warming,larger%20than%20climate%20model%20predictions.
. Over the last seven decades there has been little or no warming over large areas of the continent.
of course various species of plants, didnt get your memo.
its hard to argue with plants finding out its now warm enough to grow
somehow plants figured out ts getting warmer.
so lets see, Ice melts, plants grow.
its harder to be dumber than a block of frozen water or dumbr than a head of lettuce.
but go ahead and try
Nothing new there. Nothing at all. Was on the peninsula 30 years ago. Saw plants.
https://www.worldatlas.com/articles/native-plants-of-antarctica.html