Nic Lewis
Why matching of CMIP5 model-simulated to observed warming does not indicate model skill
A well-known Dutch journalist, Maarten Keulemans of De Volkskrant, recently tweeted an open letter to the Nobel-prizewinning physicist Professor Clauser in response to his signing of the Clintel World Climate Declaration that “There is no climate emergency”, asking for his response to various questions. One of these was:
The CLINTEL Declaration states that the world has warmed “significantly less than predicted by (the) IPCC”. Yet, a simple check of the models versus observed warming demonstrates that “climate models published since 1973 have generally been quite skillful predicting future warming”, as Zeke Hausfather’s team at Berkeley Earth recently analysed.
The most recent such analysis appears to be that shown for CMIP5 models in a tweet by Zeke Hausfather, reproduced in Figure 1. While the agreement between modeled and observed global mean surface temperature (GMST) warming over 1970–2020 shown in the Figure 1 looks impressive, it is perhaps unsurprising given that modelers knew when developing and tuning their models what the observed warming had been over most of this period.

Figure 1. Zeke Hausfather’s comparison of global surface temperature warming in CMIP5 climate models with observational records. Simulations based on the intermediate mitigation RCP4.5 scenario of global human influence on ERF through emissions of greenhouse gases, etc. were used to extend the CMIP5 Historical simulations beyond 2005.
It is well-known that climate models have a higher climate sensitivity than observations indicate. Figure 2 compares equilibrium climate sensitivity (ECS) diagnosed in CMIP5 models and in the latest generation, CMIP6, models with the corresponding observational estimate on the same basis in Lewis (2022) of 2.16°C and (likely range 1.75–2.7°C). Only one model has an ECS below the estimate in Lewis (2022), and most models have ECS values exceeding the upper bound of its likely range. CMIP6 models are generally even more sensitive than CMIP5 models, with half of them having ECS values above the top of the 2.5–4°C likely range given in the IPCC’s 2021 Sixth Assessment Report: The Physical Science Basis (AR6 WG1).

Figure 2. Red bars: equilibrium climate sensitivity in CMIP5 and CMIP6 models per Zelinka et al. (2020) Tables S1 & S2 estimated by the standard method (ordinary least squares regression over years 1–150 of abrupt4xCO2 simulations). Blue line and blue shaded band: best estimate and likely (17%-83% probability) range for ECS in Lewis (2022), derived from observational evidence over the ~150 year historical period but adjusted to correspond to that estimated using the aforementioned standard method for models.
So, how is it possible that Hausfather gets an apparently good match between models and observations in the period 1970-2020? Does it imply that the models correctly represent the effects of changes in “climate forcers”, such as the atmospheric concentration of greenhouse gases and aerosols, on GMST, and accordingly that their climate sensitivities are correct?
The key question is this. Matching by CMIP5 climate models, in aggregate, with observed GMST changes would only be evidence that models correctly represent the effects of changes in “climate forcers”, such as the atmospheric concentration of greenhouse gases and aerosols, on GMST if resulting changes in their combined strength in models matched best estimates of the actual changes in those forcers. The standard measure of strength of changes in climate forcers, in terms of their effect on GMST, is their “effective radiative forcing” (ERF), which measures the effect on global radiative flux at the top of the Earth’s atmosphere once it and the land surface have adjusted to the changes in climate forcers (see IPCC AR6 WG1 Chapter 7, section 7.3)
It is therefore important to compare changes in total ERF as diagnosed in CMIP5 models during their Historical and RCP4.5 scenario simulations over 1970–2020 with the current best estimates of their actual changes, which I will take to be those per IPCC AR6 WG1 Annex III, extended from 2019 to 2020 using the almost identical Climate Indicator Project ERF time series.
Historical and RCP4.5 ERF (referred to as “adjusted forcing”) in CMIP5 models was diagnosed in Forster at al. (2013), for the 20 models with the necessary data. I take the mean ERF for that ensemble of models[1] as representing the ERF in the CMIP5 models used in Figure 1.
Figure 3 compares the foregoing estimates of mean ERF in CMIP5 models with the best estimates given in IPCC AR6. Between the early 1980s and the late 2000s CMIP5 and AR6 ERF estimates agreed quite closely, but they diverged both before and (particularly) after that period. The main reason for their divergence since 2007 appears to be that aerosol ERF, which is negative, is now estimated to have become much smaller over that period than was projected under the RCP4.5 scenario. Updated estimates of aerosol ERF also appears likely to account for about half of their lesser divergence prior to 1983, with the remainder mainly attributable to differences in ERF changes for land use and various other forcing agents.

Figure 3. Effective radiative forcing (ERF) over 1970–2020 as estimated in CMIP5 models (mean across 19 models) and the best estimate given in the IPCC Sixth Assessment Scientific Report (AR6 WG1). The ERF values are relative to their 1860–79 means.
The IPCC AR6 best estimate of the actual ERF change between 1970 and 2020 is 2.53 Wm−2. The linear trend change over 1970–2020 given by ordinary least squares regression is 2.66 Wm−2, while the change between the means of the first and last decades in the period, scaled to the full 50 year period, is 2.59 Wm−2.
By comparison, the mean ERF change for CMIP5 models between 1970 and 2020 is 1.67 Wm−2. The linear trend change over 1970–2020 is 1.92 Wm−2, and the scaled change between the first to last decades’ means is 1.76 Wm−2.
It is evident that the AR6 estimate of the actual 1970–2020 ERF change is far greater than that in CMIP5 models. Based on the single years 1970 and 2020, the AR6-to-CMIP5 model ERF change ratio is 1.51. Based on linear trends that ratio is 1.39, while based on first and last decades’ means it is 1.46. The last of these measures is arguably the most reliable, since single year ERF estimates may be somewhat unrepresentative, and due to intermittent volcanism the ERF has large deviations from a linear relationship to time. As there is some uncertainty I will take the ratio as being in the range 1.4 to 1.5.
So, CMIP5 models matched the observed 1970–2020 warming trend, but the estimated actual change in ERF was 1.4 to 1.5 times greater than that in CMIP5 models. On the assumption that both the CMIP5 model ERF estimates and the IPCC AR6 best estimates of ERFs are accurate, it follows that:
- CMIP5 models are on average 1.4 to 1.5 times as sensitive as the real climate system was to greenhouse gas and other forcings over 1970–2020[2]; and
- CMIP5 models would have over-warmed by 40–50% if their ERF change over that period had been in line with reality.
It seems clear that the ERF change in CMIP5 models over 1970–2020 was substantially less than the IPCC AR6 best estimate, and that CMIP5 models substantially overestimated the sensitivity of the climate system during that period to changes in ERF. Moreover, the divergence is increasing: the ratio of AR6 to CMIP5 model ERF changes is slightly higher if the comparison is extended to 2022.
In conclusion, Maarten Keulemans’ claim that “a simple check of the models versus observed warming demonstrates that “climate models published since 1973 have generally been quite skillful predicting future warming” is false.
Contrary to the impression given by Zeke Hausfather’s rather misleading graph, CMIP5 models have not been at all skillful in predicting future warming; they have matched the illustrated 1970–2020 observed warming (which was past rather than future warming until the late 2000s, when CMIP5 models were still being tuned) due to their over-sensitivity being cancelled out by their use of ERF that increased much less than the IPCC’s latest best estimates of the actual ERF increase.
Nic Lewis 5 September 2023
[1] ex FGOALS-s2, the Historical and RCP simulations of which were subsequently withdrawn from the CMIP5 archive.
[2] There are some caveats to the conclusion that CMIP5 models were oversensitive by a factor of 1.4 to 1.5 times:
- the ensemble of CMIP5 models used in Forster et al. (2013) might not have been a representative subset of the entire set of CMIP5 model. However, there appears to be little or no evidence suggesting that is the case;
- despite their careful compilation, the AR6 best estimates of the evolution of ERF might be inaccurate;
- the CMIP5 model forcings derived by Forster et al. (2013) might be inaccurate. There are reasons to suspect that their method might produce ERF estimates that are up to about 10% lower than the methods used for IPCC AR6. However, Forster et al. present some evidence in favour of the accuracy of their method. Moreover, the agreement in Figure 2 between the CMIP5 and AR6 ERF time series between 1983 and 2007 (with divergences before and after then largely attributed to differences in particular forcing agents) is further evidence suggesting that the Forster et al. (2013) CMIP5 ERF estimates are fairly accurate; and
- due to the heat capacity of the ocean mixed layer, GMST is more closely related to average ERF exponentially-decayed over a few years rather than to ERF in the same year. Using exponentially-decayed ERFs would somewhat reduce the 1.4 low end estimate given above for the ratio of AR6 to CMIP5 model ERF 1970–2020 increase estimates, perhaps by ~10%.
This is way over my head! But I do, as always, enjoy the AI generated image at the top.
Otherwise, just watched a new video with Dr. Stephen Koonin, on Dr. Brian Keating’s YouTube channel and in this video Koonin does discuss climate models:
Steven Koonin: Stop POLITICIZING Climate Science!
https://www.youtube.com/watch?v=80vH3sTbHL4&t=1318s
The headline is:
Basically the climate models are still badly wrong in their basic assumptions but climate modellers are getting better and better at adding ‘fudge factors’ so they look like they’re following historical data faithfully. The implication is that the modellers know what they’re doing is fraudulent and immoral, but the money and acclaim makes it worthwhile.
Basically the ‘climate models’ are not ‘models’ rather they arefudged approximations fitted to historical data and then extrapolated forward in time.
An actial model uses the Navier Stokes Equations (of fluid momentum) and otherknown mathematical realionships addressing the physics of what is going on via a suitably fine mesh model using the method of CFD (computational fluid dynamics)/FEM (finite element modelling). The bsic practical problem of this is that in order to ‘model’ a particular element of physical interaction, say a tripical storm system orsimilar you need a mesh several tiles smaller than the system in focus. The smaller the mesh the more iterations the model has to go through and in practical reality that just blows the end out of the time budget, even with the sort of computing power available. So? Use a fudge factors and a coarser mesh which can pump out results in time for the next publication cycle!
What could possobly be wrong with that? Its all science, after all. Well sufficiently sciency to get past the pals who review this stuff.
I would say no. It’s been politicized since the beginning.
Politicized to the extreme.
Story tip :
https://vancouversun.com/news/local-news/bc-natural-gas-heating-ban-nanaimo
Anyone who’s spent 10 minutes clicking curve fit options in Exchel to make two lines look “same enough” on their chart for a presentation knows what the college students were doing to himdcast climate data.
Yeah, and they are hindcastig bogus data. What does that say about the models? They are matching bogus temperature readings to their models. That would make their models bogus, too.
What is interesting is that Nick Stokes doesn’t show up to defend the CMIP5 modeling scenario fantasies.
Thanks for the post, Nic, showing yet another way that the CMIP5 models are trash. For those new to the topic, see the collection of WUWT posts about the trashy CMIP5 models.
https://wattsupwiththat.com/?s=cmip5
If you’re really new to the topic, CMIP stands for Climate Model Intercomparison Project, which were the climate models referred to by the IPCC for their 5th assessment report.
Regards,
Bob
Alas, it’s just weather, but 10C in my area of Colorado this morning seems a bit cold for early September. Thankfully it wasn’t 9.95C.
I’m in San Francisco at them moment, temperature varies 5C between Golden Gate Bridge and Fisherman’s Wharf, a mere few kilometres apart.
Hit 38°F this am on the western slope at 6600′.
Was that 38.00? One of the alarmists that comments here says that 0.05C is significant.
The models are constantly being modified and tuned. But when the modified models are run going forward for comparison purposes, the recent climate record is now known. In fact the models would not be released unless they were tuned to match the recent climate history. In effect, they have seen the answer key to the exam.
Shouldn’t the modified models have to start the comparison period anew beginning with the present?
Yes let’s see what that 1973 model says about 2023. To those who would say “not fair”: why should we think 2023 models can predict 2073 much better?
Even the IPCC acknowledge the fat that:
“The climate system is a coupled non-linear chaotic system, and therefore the long-term prediction of future climate states is not possible.”
IPCC Third Assessment Report 2001
If you Google “how much warming do the models project by 2100” it comes up with “a likely increase of at least 2.7°F…”
First it should be noted that Google chooses to use Fahrenheit degrees since that produces a bigger number than 1.5 Celsius degrees. And really, would a world that’s 2.7 degrees warmer than today be a crisis? A crisis that requires us to destroy the economy?
Besides that, you can Google “The Little Ice Age” to find out that it was a
“climate interval that occurred from the early
14th century through the mid-19th century”
So there’s been a warming trend since 1850. You don’t need a model to figure out that it’s likely to continue for a while.
Then there’s this from the Nic Lewis article:
“it is perhaps unsurprising given that modelers knew when developing and tuning
their models what the observed warming had been over most of this period.”
Uh, didn’t they know over ALL of this period? Well anyway how well did the AR one two three four and five do? Here’s the 2100 prediction chart from the IPCC AR1 :
You can find that chart on Page 73 of the FAR Executive Summary (pdf-12)
That’s man made warming for sure. Such a beautiful change in function around 1975.
“It’s tough to make predictions, especially about the future”.
Yogi Berra
The warming trend started in the 1600 or 1700’s – once the Thames stopped freezing over solid every year.
Ok 400 years ago, and common sense says it will continue for a while, and that same common sense says it won’t go up forever.
Our good friends never say when it will stop going up, indeed some of them think the Earth will go the way Venus. At least the late Stephen Hawking thought so LINK
Even Mann called out that Hawking for that stupid theory. At least he did politely,
“Hawking is taking some rhetorical license here,” Michael Mann,
predictions that can’t be verified during the lifetime of the predictor are so easy to commit to.
1814 was the last time. The winter of 1813-14 was the very last London Frost Fair when the Thames was frozen over from December to February.
Let’s be clear, Hausfather has been no more skilful in hindcasting past measured temperature than had he simply copied and pasted the graph.
That’s essentially what tuning the models do – they aren’t improving the physics they are kust correcting the previous wild-ass-guesses.
That’s why when the model is run, even with 20 or more years of data built inside, the forecast still runs too hot to the same degree.
The math has gotten way ahead of the physics- a consequence of objective scoring systems and slowly passing time
I think I understand the tuning point, but isn’t the worst thing about Mr. Hausfather’s claim the fact that the graph he uses shows the models conforming with known temperature, not with a “prediction”? How well have the models done at predicting temperature? I appreciate that the models could still be useless even if they have made accurate predictions, but I’m still curious as to the accuracy of the predictions they have made. It doesn’t look like Mr. Hausfather’s graph addresses that issue. Or am I missing something?
Using a much higher climate sensitivity than modern estimates means that no matter how much ‘tuning’ or ‘fudge factors’ you use to recreate historical data, all predictions will run hot and sail off into the wide blue yonder of fantasy land. Not accurate.
You missed nothing. Mr H is counting on you accepting that historical performance guarantees future returns.
All CMIP5 produce a tropical troposphere hotspot that does not exist in reality.
They produce ECS significantly higher than observational EBM.
Hausfalter’s claim that they did well predicting GMST is almost beside the point. At least now we know why—lower projected ERF than AR6 says was the actual case. “Right for the wrong reasons” is not ‘science’.
Yeah, I keep looking for that increasingly mythical “Hot Sport” prediction too that was supposed to exist according to the modeling factory how long has the waiting been…. 25-30 years now?
To me at that point the CO2 climate change
theoryguess failed bythe data. As Feynman put it (I am paraphrasing)if the data does not support your
guess, your guess it wrong! It does not matter how smart you are or how elegant
your guess was, it is wrong, you need another guess. Somehow in their education they
missed that basic fact! It should have been, game, set and match at that point. Yet over 35 years later the failed guess continues. It looks to me lying pays rather well. Sad, very Sad.
From the title block to Figure 1 in the above article:
“Zeke Hausfather’s comparison of global surface temperature warming in CMIP5 climate models with observational records. Simulations based on the intermediate mitigation RCP4.5 scenario of global human influence on ERF through emissions of greenhouse gases, etc. were used to extend the CMIP5 Historical simulations beyond 2005.”
IMHO, there is a rather sophomoric sleight-of-hand trick being played by Hausfather in his graph.
It shows the generally good agreement of CMIP5 “multimodel” average hindcasts from 1970 through 2005. But, as duly noted in the article, these models were tuned (aka forced to match the observations (data) over this time period. Hence we see the excellent fits for the relatively rapid temperature dips starting around 1982 and 1991.
However, since the models used the RCP4.5 scenario (not data!) to forecast the temperature trending from 2006 onward, we do not see any further matching of the mutimodel predictions to the dips observed in 2007, 2010 and 2017. In fact, the multimodel predictions from 2006 onward appear to be nothing more than an extension of the slope (albeit with some very slight added fluctuations) of the least-square curve-fit of data of 1970-2005.
So, is it really “global human influence on ERF through emissions of greenhouse gases, etc.” using twenty or more $multimillion, supercomputer climate models as Hausfather claims, or is it instead nothing more than extending a simple curve fit of existing data?
You decide.
“The simplest explanation is preferable to one that is more complex.”
— Occam’s razor, itself simplified
As Pat Frank has shown, the climate models can be emulated by a simple linear equation. Neither the models or the linear equation tracks with observed data. The uncertainty associated with the linear equation is at least as small as what should be given for the climate models – and it gets so large so quickly that there is no way to tell what is going to happen in the future. The future uncertainty interval defines an area of “UNKNOWN” – i.e. a cloudy crystal ball. Like a fortune teller you can pick anything you want out of that cloudy ball – and the CAGW advocates pick a future that maximizes their power and fortune.
That’s my take. If lots of people are fitting models to a rising trend it is hardly a surprise if the mean of those models looks about right. It says nothing whatsoever about skill of individual models (which is generally poor).
You get zero points out of ten for predictive-modelling data that has already happened.
The climate modelling ‘community’ long ago abrogated any bonds of scientific trust they may have enjoyed.
Hausfather should ask himself whether he really wants to lumped in with them.
Zeke most definitely wants to be one of the AGW gurus.
He will lie, con, distort… do basically anything to try to support the AGW meme.
His whole life and income depends on it.
I’m a little confused about what Hausfather used for the model inputs. Model builders are always tweaking their models to better fit observed data. They’d be fools not to. The question is how much of model output in Fig. 1 is models that have had post hoc adjustment. A better comparison would have been older model outputs to current data.
For CMIP5, yearend 2005. Everything before is tuned to best hindcast. Everything after is a tuned model projection.
If they are hindcasting to ADJUSTED URBAN surface data then they already have a massive spurious, not-real, warming trend built in.
Anything they churn out after that is going to be just garbage.
First week of class is probably data recently from an elderly professor’s paper photocopy notebook onto a computer.
…. To run a python script written by an uncredited foreign grad student.
“A better comparison would have been older model outputs to current data.”
Winner.Comment sums up the whole debate in a sentence.
Couple of thoughts:
Looking back at Figure 1 doesn’t seem to indicate any delay at all in the biggest change in forcings (Pinatubo) by virtue of heat capacities. Nonetheless, one can bring out the exponentially-delayed horse argument and trot him around the track. Don’t the feedback models have already built into them these appropriate time constants? The cartoons of feedback don’t snow this explicitly, but the blocks actually operate in the “s” domain. The models, done in the time domain ought to show already this without saying.
In more honest times, the “Estimated Effective Radiative Forcing (ERF)” values graphed in Figure 3 would be simply called fudge factors used to tune the noted CMIP models to force them to match existing data.
If one were to politely ask what are the fundamental causes—due to mankind and/or due to nature—for the relatively rapid and high magnitude changes in ERF seen over the intervals of 1982–1986 and 1991–1995, no science-based answer would be forthcoming.
Are those two critical intervals of ERF change due to:
— Changes in solar irradiance at Earth TOA? No.
— Changes in Earth’s areal cloud coverage (albedo)? No.
— Changes resulting from periods of El Nino or La Nina? No. Very strong 1997–1998 and 2015-2016 El Ninos are not evident, and very strong La Ninas of 1998–2000 and 2007–2011 are not evident.
— Changes resulting from unusual global volcanic activity? Likely no. Major eruptions of El Chichón (1982, VEI5) and Mount Pinatubo (1991, VEI6) might be indicated, but major eruptions of Mount St. Helens (1980, VEI5) and Puyehue and Cordón Caulle (2011-2012, VEI5) are not evident.
— Changes resulting from comets or asteroid impacts? No.
— Changes in human emissions of CO2? Certainly no.
But those asserted ERF changes are certainly needed mathematically to “tune” climate models.
Go figure.
CMIP members exhibit wildly different proportions in feedback kernels. They are only constrained in historical temperature estimates. Otherwise, they are totally free.
Additionally, in spectral space, they have wildly different proportions of feedbacks in the FIR (water vapor band) v “window” spectra. Models are totally unconstrained in the “unknown” parameters of interest.
Evidently, there is still far too much freedom to glean information from GCMs. The lack of consistency suggests missing pieces of the puzzle. As a consequence, the puzzle is being arranged in wildly different ways. This should be the primary conclusion of the model intercomparison project to date. Why else run a MIP?
Simple models arrive at the same global temp estimates as complex models. MIP GCMs are supposed to test our knowledge of the mechanisms at work. The result to date is that knowledge is low.
The models are there merely to fool hoi polloi and give a “sciencey” veneer to a vicious Marxist powergrab.
Nobody has ever shown the physical climate works the way the climate models say they do.
In other words the climate modelers are applying the: “UEFF” (Universal
Engineering Fudge Factor), aka Finagle’s Constant
. . . except that it is NOT a constant, but varies as needed to match past observations, and as needed to support the “climate change” meme du jour.
Do any climate models honestly include unknown variables with unknown properties? If they dared to do that they’d be admitting predicting future climate is impossible.
Our understanding of the climate and the processes that are associated with it is incomplete – to a greater or lesser extent (opinions vary). Therefore, by definition, all climate models include ‘best guesses’ which are unknown variables and exclude some things, like clouds, that climate scientists don’t know how to model. All of these climate models are a complete fudge – they can’t represent reality because we don’t know all the factors and processes; they tell us nothing and are a waste of time and money.
I don’t think you will ever be able to model the climate with computer models, since the variables are nearly infinite, yet the run time of the model must be finite. Let alone the fact we don’t know most of the variables.
This is all a complete waste of time, since the so-called “observed” temperatures are fake data.
They are comparing their awful models with their fake temps.
yep ! Junk from start to finish !
@ToldYouSo;; Perhap’s it should more properly named “Finagle’s Correction”?
Is there another branch of physics where the average of a bunch of very inaccurate theories is held up as being a valid representation of the physical world?
String theory? (ducks).
CHIMP5 could do a better job, I’m sure. All the have to do is toss darts.
Looking at anomalies it is easy to forget to the spread in in the average temperatures:
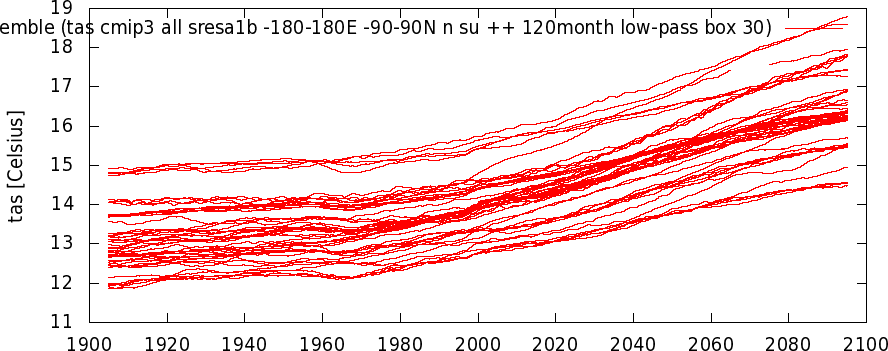
from Bob Tidale’s site
https://bobtisdale.wordpress.com/2018/11/27/what-was-earths-preindustrial-global-mean-surface-temperature-in-absolute-terms-not-anomalies/
Independent of their differences in absolute temperature, all of the plotted CMIP3 computer models have noticeable upward slope breaks that occur at around 1961.
Hmmmm . . . in 1961 the Soviet space probe “Venera 1” became the first man-made vehicle to reach Venus.
As is well known, Venus has the hottest sensible atmosphere of all planets in the Solar System. I’m not necessarily asserting Venusians are a vengeful species, but it does invite the question . . .
The IPCC (WG-I) report actually included an updated version of this graph using CMIP6 “Historical Data” (to 2014) and the SSP1-2.6 extension to 2100.
See the top panel of Figure 1.11, from page 190, which should appear “automagically” below …
PS : Hat-tip to Javier Vinos for digging out the “/ar6/wg1/figures/” URL at the IPCC website allowing the above “auto-magic” to occur (URL string must end with something like “.png” or “.jpg”, no “?<options>” suffixes allowed …).
Again, these updated charts invite the question: What the heck happened to/on Earth circa 1960 to cause the noticeable upward increase in the rate of global warming?
At least one inquiring mind would like to know, finding no ready explanation anywhere on the Web.
If I had to hazard a guess, I would say that it was the beginning of the UHI-poisoning effect on global surface temperature measurements . . . but that’s just me.
Question for ALL the knowledgeable folks here (I’ll leave the determination of who that might be to ‘consensus’, haha):
Why hasn’t the modelling of the Earth’s climate focused on total energy? In my inexpert opinion any representation using a temperature is inappropriate for characterizing the behavior of our climate. The ongoing argument has focused on the future value of temperature (and most times atmospheric temperature), but isn’t that a distraction from the true question that would lead to a determination (model) of climate:
‘Is the energy level of the earth increasing, decreasing or staying the same?’
In order to answer that question such variables as temperature must be measured, but just as, if not more importantly, thermal (energy) batteries such as the oceans, atmosphere and landmasses must be characterized properly. Energy transfer obviously must be characterized also.
Don’t the oceans represent the most massive thermal batteries (rechargeable, or capacitors) by far? For instance, how does a seemingly small shift in depth and/or value of the thermal gradient of the ocean compare to an equivalent shift in the atmosphere? It would seem that, given the very large energy capacity of water versus ‘air’, that determining the total level of ocean energy might be one of the the most important pieces of the puzzle.
For those purveyors of the climate doom scenario, I can understand the use of temperature as it provides an easily manipulated measure, that also can be used at the emotional level to scare laymen into belief of ‘settled science’.
But for those on the side questioning and refuting doomsayers predictions, I see you falling into the trap of letting your opponent define the terms and conditions of the argument.
Climate “Scientists” have never understood the fundamental distinction between temperature and enthalpy.
Well, there are two fundamental answers to that question:
1) Indeed climate scientists have attempted to model Earth’s total “energy balance” in more practically-expressed units of power flux (W/m^2) balances between incoming power and outgoing power, and the individual components comprising such. Overall, when averaged over hundreds of years, Earth can be consider as being in a near-equilibrium condition, so it is much easier to discuss the perturbations in energy than it is to discuss the total quantity of energy involved (e.g., the huge numbers associated with the thermal energy contained in the world’s oceans). However, at a finer level, Earth is in a state of continuous fluctuation about the long-term average due to things like day vs. night, seasonal changes, solar irradiation variation with sunspot cycle, PDO and AMO cycle variations, etc. Considering both viewpoints, it is more practical (useful) to examine the balance/imbalance of power crossing some well-defined interfaces, using the metric expressed as energy/unit time/per cross-section area normal to the energy flow direction, or W/m^2. This is the basic parameter evaluated in the original Kiehl and Trenberth diagram (1997, see attachment) describing the beakdown of components comprising Earth’s average “energy balance” (yes, the incorrectly named parameter of interest) as well as the numerous subsequent updates and modifications of such.
2) As you alluded to, it is inappropriate to use temperature as a metric to discuss energy or its rate of flow over time (power). For example, liquid water can undergo phase change to vapor at a constant temperature even though a significant exchange of energy is required per pound mass of water; similarly water ice can melt to liquid water at a constant temperature if it absorbs a substantial amount of thermal energy per pound water. Within Earth’s climate system and its hydrological cycle, water exists in solid, liquid and gas phases and frequently converts between these phases with involvement of large amounts of power.
Also, a change in temperature of a given mass of solid, liquid or gas can only be interpreted as a change in the energy of that quantity of matter with knowledge of the specific heat of the substance and with understanding of the nature of the change process (e.g., for gases, is it a constant pressure or constant volume process?). The there is the whole issue of establishing (and quantifying) the degree of temperature uniformity within any mass being considered. Things get complicated very quickly when trying to use material temperature changes over time instead of just using power as the metric of interest.
“Things get complicated very quickly when trying to use material temperature changes over time instead of just using power as the metric of interest.”
The problem is that the “metric” always falls back to being temperature, i.e. global average temperature.
The other big problem is attributing energy flows in and out properly to specific causes, e.g. CO2 growth.
How can any “model” that supposedly predicted the eruption of Mt Pinatubo be taken seriously?
And of course, the surface temperature fabrications used are URBAN/AIRPORT surface temperatures ADJUSTED in an attempt to meet the warming requirements of the models.
They are not representative of “global” temperatures.