CERES team
A new study published in the scientific peer-reviewed journal, Climate, by 37 researchers from 18 countries suggests that current estimates of global warming are contaminated by urban warming biases.
The study also suggests that the solar activity estimates considered in the most recent reports by the UN’s Intergovernmental Panel on Climate Change (IPCC) likely underestimated the role of the Sun in global warming since the 19th century.
It is well-known that cities are warmer than the surrounding countryside. While urban areas only account for less than 4% of the global land surface, many of the weather stations used for calculating global temperatures are located in urban areas. For this reason, some scientists have been concerned that the current global warming estimates may have been contaminated by urban heat island effects. In their latest report, the IPCC estimated that urban warming accounted for less than 10% of global warming. However, this new study suggests that urban warming might account for up to 40% of the warming since 1850.

Source: Maps taken from NOAA Climate.gov.
The study also found that the IPCC’s chosen estimate of solar activity appeared to have prematurely ruled out a substantial role for the Sun in the observed warming.
When the authors analysed the temperature data only using the IPCC’s solar dataset, they could not explain any of the warming since the mid-20th century. That is, they replicated the IPCC’s iconic finding that global warming is mostly human-caused. However, when the authors repeated the analysis using a different estimate of solar activity – one that is often used by the scientific community – they found that most of the warming and cooling trends of the rural data could actually be explained in terms of changing solar activity.
The lead author of the study, Dr. Willie Soon, of the Center for Environmental Research and Earth Sciences (CERES-Science.com) described the implications of their findings,
“For many years, the general public has been assuming that the science on climate change is settled. This new study shows that this is not the case.”
Another author of the study, Prof. Ana Elias, the Director of the Laboratorio de Ionosfera, Atmósfera Neutra y Magnetosfera (LIANM) at the Universidad Nacional de Tucumán, Argentina, explained:
“This analysis opens the door to a proper scientific investigation into the causes of climate change.”

This study finds similar conclusions to another study that was recently published in a separate scientific peer-reviewed journal, Research in Astronomy and Astrophysics. This other study involved many of the same co-authors (led by Dr. Ronan Connolly, also at the Center for Environmental Research and Earth Sciences). It took a different approach to analysing the causes of climate change – using an additional 25 estimates of solar activity and three extra temperature estimates.
For media inquiries, please contact Dr. Ronan Connolly (Center for Environmental Research and Earth Sciences) at ronan@ceres-science.com.
Links to both studies mentioned:
- W. Soon, R. Connolly, M. Connolly, S.-I. Akasofu, S. Baliunas, J. Berglund, A. Bianchini, W.M. Briggs, C.J. Butler, R.G. Cionco, M. Crok, A.G. Elias, V.M. Fedorov, F. Gervais, H. Harde, G.W. Henry, D.V. Hoyt, O. Humlum, D.R. Legates, A.R. Lupo, S. Maruyama, P. Moore, M. Ogurtsov, C. ÓhAiseadha, M.J. Oliveira, S.-S. Park, S. Qiu, G. Quinn, N. Scafetta, J.-E. Solheim, J. Steele, L. Szarka, H.L. Tanaka, M.K. Taylor, F. Vahrenholt, V.M. Velasco Herrera and W. Zhang (2023). “The Detection and Attribution of Northern Hemisphere Land Surface Warming (1850–2018) in Terms of Human and Natural Factors: Challenges of Inadequate Data”, Climate, 11(9), 179; https://doi.org/10.3390/cli11090179. (Open access).
- R. Connolly, W. Soon, M. Connolly, S. Baliunas, J. Berglund, C.J. Butler, R.G. Cionco, A.G. Elias, V. Fedorov, H. Harde, G.W. Henry, D.V. Hoyt, O. Humlum, D.R. Legates, N. Scafetta, J.-E. Solheim, L. Szarka, V.M. Velasco Herrera, H. Yan and W.J. Zhang (2023). “Challenges in the detection and attribution of Northern Hemisphere surface temperature trends since 1850”. Research in Astronomy and Astrophysics. https://doi.org/10.1088/1674-4527/acf18e. (preprint version).
I tried to post this from a tweet by Andy May but wasn’t able to paste what I copied. Is that prohibited?
Post a link and everyone wins.
At the time I thought that is what I was doing
The results of this study should be no surprise to those who have taken a look at the GHCN. It also confirms that PHA is effective at cooling urban data while unintentionally warming rural data creating a trend resembling that of a moderately urbanized area.
The results of this study should come as no surprise at all; it’s what quite a lot of people have been saying for some time. I like the understated lack of ambition with your moderate trend – we have no real way of knowing how severe the trend is at the moment because the measurement sites are too damn corrupted. Let’s move over to uncorrupted sites and then start to see the size of the problem, shall we?
It’s good that this information is starting to get out there. Soon and the Connolly brothers spent like 4 years digging into the GHCN exploring the data and comparing between stations. It’s quite impressive they managed to create a composite for the NH while also reproducing the current surface temperature used by mainstream science.
So they’re just now discovering UHI? If we follow the AGW adherents agenda we’re supposed to migrate from urban and rural areas to vertical cities to save on transportation. Won’t that make UHI worse?
“So they’re…”
Who is they? Tjis is written by Willie Soon et al.
Yawnnnnn, Zzzzzzz……..
What about the article Mr. Stokes?
Well, one thing I note is that for all stations, they get exactly the same results for NH land temperature as does anyone else who takes the trouble to calculate it:
So you are saying their data is widely accepted.
Your dishonesty is off the chart with your misleading post, when will you address the green area of the article?
The green area is not from their paper.
What is from their paper is an actual trend calculation of all stations vs rural only for the modern warming period. The difference is about 7%; less than the 10% they attribute to the IPCC:
All stations 1972-2018 3.27°C/Century

Rural stations 1972-2018 3.05°C/Century
More ducking and weaving. You show the original 1850 onwards data to supposedly make a point and then choose 1972 onwards and completely ignore the 62% difference between all and rural in your original time frame.
It isn’t me showing. It is from the paper by Soon et al.
The notion of urban heat island doesn’t really work for a time when there were no cars, bitumen, and little burning of fossil suels.
And once again Nick goes out of his way to demonstrate that he is either historically ignorant, or really bad at lying.
Are you really going to argue that before cars, asphalt and fossile fuels, there was no UHI?
Concrete doesn’t play a role?
Bricks and mortar don’t play a role?
Lack of vegetation doesn’t play a role?
Wood stoves and heaters don’t produce UHI, but fossil fuel powered ones do?
Even Thomas Jefferson wrote about how cities were warmer than the surrounding country.
interesting- can you quote him? I don’t like some of Jefferson’s politics but he was very intelligent
Why? Please explain, Nick, in your own inimitable way, why buildings, roads, streets and pavements should suddenly become a problem only after a certain time?
Because they were not a problem before they were built.
You mean in pre-Roman Europe? Around 50 BC?
And once again, Nick be-clowns himself by not answering the question asked, but rather one of his own making.
To re-phrase the original question. Why do you believe that roads built before a certain year are not a problem, but become one after that year?
LOL, never said it was Nick, but that green area significance eludes you as you ignored it because it doesn’t support your dishonest weaving game you have been promoting here.
Dishonest = Using a bogus Hockey Stick chart as evidence.
Well, that is what Soon et al did. I just posted a copy.
> Well, one thing I note is that for all stations, they get exactly the same results for NH land temperature.
That is stating the obvious and is a major component of the paper’s conclusions. You completley miss the significance of that fact.
As the paper says:
Two different temperature estimates were considered—a rural and urban blend (that matches almost exactly with most current estimates) and a rural-only estimate. The rural and urban blend indicates a long-term warming of 0.89 °C/century since 1850, while the rural-only indicates 0.55 °C/century. This contradicts a common assumption that current thermometer-based global temperature indices are relatively unaffected by urban warming biases.
Even rural thermometers are often positioned where the town expansion affects them.
New roads, new infrastructure, new estates, etc etc.
Stokes hasn’t missed the significance of the facts, he deliberately obfuscates and misleads … a confirming characteristic of the warmunista.
His nickname, “racehorse”, isn’t for nothing 🙂
Glue factory missing a gelding?
That’s actually not what is racehorsing, but you do you.
Yup just as the article pointed out early on,
“ account for up to 40% of the warming since 1850.”
And a much larger % the warming since the 1970s.
We know that the only atmospheric warming has come at 2 major El Ninos events ..
There is no reason to think there is any other real “global-scale” warming.
Every one of them build from UNFIT FOR PURPOSE urban surface sites.
Thanks for pointing that out, clown !
And no, They didn’t make their own for this study.. they used CORRUPTED urban data.
It is the data they relied on. If that is rubbish, then so is their paper.
No, The paper shows VERY CLEARLY that even using junk surface data, the surface fabrications are well and truly JUNK.
Junk built from junk.
Just the way alarmists like it.
“The paper shows VERY CLEARLY that even using junk surface data, the surface fabrications are well and truly JUNK.”
There is something wrong with the logic there.
Sorry if you have been infected by moosh’s lack of comprehension and understanding.
If there is something wrong in the logic, then a master debater such as yourself should have no problem pointing out exactly what it is.
Nick,
Rubbish? Then so is the IPCC work.
Geoff S
Yes. I think they are not rubbish, and nor is the IPCC work. But there is something wrong when you hold up a paper written by popular locals claiming to have proved something about the UHI effect, and dismissing their data as rubbish.
“Yes. I think they are not rubbish,”
BS.. You KNOW they are based on massively contaminated data.
If you can’t even admit to that fact, you obviously are nothing but a mindless, unthinking parrot. !
The data IS RUBBISH, because it is contaminated by UHI effects.
Nick,
I have studied near 100 Australian weather stations for learning about UHI, starting this work about year 2003. Some familiarity with raw data allows informed generalisation, be it right or wrong.
Overall, my main conclusions are that the more ‘pristine’ a station is, the poorer the data quality; and that most ‘pristine’ sites have data so poor that it is not fit for the purpose of inferences about the magnitude of UHI in Australia.
So, I have commented about UHI and its wonky data base for some time because researchers need to be warned of data limitations before writing learned treatises. You seem more inclined to comment to protect some of your preferred guiding dogmas.
Geoff S
Showing that junk is junk, is invalid because they used junk?
Is that graph based on raw or ‘homogenized’ data?
It is a graph from the Soon et al paper.
“It is a graph from the Soon et al paper”
A non-answer, that was not my question.
The answer is in the paper, which I seem to be the only one to have read.
Most surface use “pre-processed” data with the 1940s adjusted downwards.
Bastardized data, is a better description of what Nick uses.
I.e. fraudulent.
Please don’t call homogenized temperature constructs “data”.
Made-up numbers (blended, in-filled, assumed, etc) are not actual observed or recorded values (i.e. – “data”).
Fair criticism.
You mean use the same massively contaminated surface data?
That is the point, isn’t it. !
All of the “adjusted” data sites agree with each other. Imagine that.
And with Soon et al.
Yes, proving that surface sites are massively contaminated, and..
… totally unfit for the purpose of determining “climate” trends
As is usual for you Nick – attack the messenger rather than the message. I suppose it saves you reading the message!
Sorry Nick I love you to bits but Willy argues from cogently and invokes evidence. You squawk shibboleths
I was in London recently … walked by “Speaker’s Corner” in Hyde Park … there was an individual ranting on incoherently … An ‘image’ of Stokes flashed in my mind.
Willie Soon has magnitudes more scientific integrity and knowledge that you have ever had or will ever have.
Jealousy is a really bad look, Nick-pick.
”They’re” the alarmists who Willie Soon et al are calling out….
”In their new paper, Soon and his 36 colleagues found that when using only rural data, the temperature changes showed a more cyclical behaviour and less over all warming”
Are you hiding in the basement with a mask on? If not, why not?
As is usual for you Nick – attack the messenger rather than the message. I suppose it saves you reading the message!
No, just a modern attention to pronouns.
Have you read the message?
Yep, the main message is that MOST surface sites are UNFIT FOR PURPOSE for global temperatures over time.
They quote and use that data.
DENIAL that UHI exists and massively taints the surface data.
Very stupid of you Nick.
… to prove their point.
That is what still eludes him to this minute.
“They quote and use that data.”
Yes and then show it is massively tainted by urban warming.
You do know that even many rural sites are also contaminated don’t you.
Or are you in deep DENIAL of reality.
And yet another inaccurate evasion from the master of evasion.
Yes they quote the data, in order to demonstrate the problems with it.
That is not the same thing as using the data to try and prove anything about wither weather or climate.
Nice evasion. Did you get help writing it?
I was recently surprised and intrigued by a news story of volunteers mapping hot spots in a city I frequent. I had already thought of doing something like this in my city. Let’s hope this movement takes off with good news coverage and comparisons to nearby rural lands. It’s one way of getting involved and not being erased by advocates and news media or governments. This would be a large extension of surface station mapping.
Oh that’s good – I like that. I’ve been saying for the last couple of years that we don’t really understand how the UHI interacts with weather patterns around it. Perhaps now that people are starting to map UHI patterns across cities we’ll start to see some honest to goodness scientific research.
“Perhaps now that people are starting to map UHI patterns across cities we’ll start to see some honest to goodness scientific research.” honest scientific research this day and age, not going to happen. It far easier to make a model of you assumptions and run it and then call the output data.
I’m an eternal optimist!
I think data like this is why Michael Mann et al were so intent on doing away with the Little Ice Age. Eliminate natural variability, and claiming it is all GHGs is easier.
Finally, UHI and Solar Cycles are getting their due on their obvious effects on the temperature data and cyclic wind patterns.
I have seen the obvious heating effects of cities when I drive from the city to rural areas just 20 miles away that show drops in temperature of up to 10 degrees F.
Heck when I drive north out of the Tri Cities area to just 18 miles north in the summer it would drop from 100 to 92 degrees F.
It drops from 100 F to 88F from Pasco to Charbonneau Park that is around 22 miles in just 25 minutes driving in early afternoon.
Every day when I used to drive from Kennewick to Richland and back for work the temperature would often drop about 2 F right in between the two cities.
There is in reality only a very small warming trend which has in recent years stopped in my region as night temperatures are not as warm as they were in the 1990’s and early 2000’s.
You cite real world observations over desktop model constructs?
How do you expect to ever get published?
I live in a town of about 75,000. I’ve repeatedly measured a 2F drop from the center of town to where I live on the edges of town. To get truly rural, you would have to go another mile or two.
I live about 15 miles out of a town of 3000, and I see typically a 5 degree difference between home and town.
I posted this the other day, showing the increase in population on an urban and rural basis.
Note that the surge in urban population really kicks in around the 1970’s.
Many once “OK” sites have been consumed by this urban expansion… but a lot of rural sites have also been affected to a somewhat lesser degree.
IIRC Roy Spencer did a paper/report on the UHI effect related to urban population that showed this to be the case.
I have stated many time that the surface sites are totally unfit for the purpose of getting a time series of global temperature.
GISS et al are pure FANTASY when it comes to being even close to a representation of real globe temperatures.
Yep. So say we all!
Even without the issue of UHI contamination, as well as micro and macro site issues. There’s also the fact that the number of sensors, even for recent years, would have to increase by 2 to 3 orders of magnitude in order to come close to having adequate ground coverage. The oceans are virtually uncovered.
This problem gets progressively worse. Back in the 1850’s, there were only a few hundred surface stations for the entire planet, and almost all of them were in Western Europe and coastal areas of N. America.
That’s NOT news. We’ve known about it for ages. The technically-illiterate politicians have believd the myth spread by the alarmists, who read about a few U.H.I.s and think it applies generally. It doesn’t, it’s just around airplane exhausts and excessive concrete-areas, etc.
It’s also not news because the unmodified, written temperature record confirms that it is no warmer today than it was in the recent past, demonstrating that the official global temperature record is a fraud, that does not show the regular cycles in the Earth’s weather, where it warms for a few decades and then it cools for a few decades, and the warming and cooling stay within certain bounds.
Here is the temperature record for the United States (Hansen 1999). It shows the correct temperature profile for the world. It looks nothing like a bogus, bastardized Hockey Stick chart that alarmists use to try to scare everyone.
Notice how Soon’s new chart shows much more cyclical movement, similar to the U.S. chart, than does the bogus Hockey Stick chart.
The Connolly et al paper can be downloaded at this Research Gate link.
That correlates well with the fact that almost no one except urban parasites complain about AGW.
Here is their plot where they actually give the trends for the current warming period.
All stations 1972-2018 3.27°C/Century
Rural stations 1972-2018 3.05°C/Century
Hardly any difference
1972-2018 3.27°C/Century
ttps://s3-us-west-1.amazonaws.com/www.moyhu.org/2023/09/soon3.png
And yet there really should be, shouldn’t there? Everybody can see a difference driving out of a town or city and it’s much more than an unmeasurable 2 tenths of a degree. So it begs the question, has someone been cooking the books?
“And yet there really should be, shouldn’t there?”
Well, so you say. But that is what was measured, and calculated by Soon et al.
“2 tenths of a degree”
As usual, you are not distinguishing between the existence of UHI and a trend in UHI.
DO you DENY the fact that UHI can be up to several degrees.
Do you DENY that many “rural” site are also affected by UHI issues..
The trend in UHI is what accounts for nearly all the FAKE surface warming since the 1970s.
Your petty attempts at DENIAL are getting quite ridiculous… and laughable.
Wasn’t it in Austin where they found the difference to be around 7°?
Really bad site to use for a link.
Run by a rabid AGW zealot who twists and turns fact for his own purpose.
Basically mostly junk non-science.
It’s an image from the Soon et al paper (see below)
I’ve learnt never to click on something with Mo-who in it.
Oh yeah.
Rural stations are still contaminated by UHI. There are many other contamination issues that occur at both urban and rural stations.
3.27 / 3.05 = 1.07, so the blended data give a 7% higher trend than the rural.
The urban-only trend will be higher than 3.27. How much higher depends on the mix of stations in the blend.
The correct trend significance test should compare the urban trend to the rural trend.
Unless the data set is extremely noisy, the blended trend is almost certainly significantly different to the rural trend.
It’s too nice to be inside comparing trends today, so that will be this evening’s entertainment.
The mix of all stations is what is used. Soon et al claim rural only would be better. How much better? Well, 7%, if you accept this view.
It doesn’t matter whether it is stastically significant. It is 7%.
But I wouldn’t waste too much time on it. There is a greater failing, which is that they are comparing global rural/urban with the rural subset of a small subset of stations, namely USA, China, Arctic and Ireland. That is the main reason they look different. The 30’s warmth in the USA is a much bigger component of the rurals (in that subset) than it is of global.
Rural sites are almost certainly NOT AS CONTAMINATED as urban sites.
Yes, the 1930s/40s in the USA, and in fact ALL of the northern hemisphere, was MUCH warmer.
Wow.. Nick-pick is finally getting there. !
“Yes, the 1930s/40s in the USA, and in fact ALL of the northern hemisphere, was MUCH warmer.”
Just not true. From the paper of Soon et al:
Wrong again Nick.
That is a fabrication using unfit for purpose mal-adjusted data
You still haven’t figured it, have you.. Not very intelligent.
Soon et al found a way of emulating the farce of the surface temperature fabrications…
… then show that removing some urban warming cuts down the warming even by that farcical method.
Basically EVERY piece of real untainted, unadjusted data from the NH shows that the 1930s, 40s was a much warmer period than the GISS fabrications show. Similar to around 2000.
Heck they even advertised that they were going to get rid of the 1940s peak.
You haven’t been listening to what your brain-washers have told you.. naughty little child.
“That is a fabrication using unfit for purpose mal-adjusted data”
Fabricated by Soon et al?
“Basically EVERY piece of real untainted, unadjusted data from the NH shows that the 1930s, 40s was a much warmer period”
OK, where is that data?
NO, built from tainted surface data.
Soon just tried to emulate all the rancid data manipulation of GISS et al.
You really are making yourself look monumentally stupid with your pathetic efforts to DENY the massive URBAN HEAT CONTAMINATION of the surface data.
You have obviously turned a purposely blind eye to all the raw data showing a large warming peak in the 1930s,40s in the NH.
Or are you just PRETENDING TO BE IGNORANT to protect your brain-washed cultism?
I’m only going to bother posting one, because you are not worth any more waste of time..
Here is data from all around the Arctic. (and we know the USA raw data has a big 1930s/40s peak.)
Physical proof of the warming in the Arctic. The opens season at the coal port in Spitsbergen went from 3 months of the year before 1920 to over & months of the year in the late 1930s
Dang! – to over 7 months of the year in the late 1930s
And Hadcrut4
And From Phil Jones…
None global, all arctic.
“Basically EVERY piece of real untainted, unadjusted data from the NH shows that the 1930s, 40s was a much warmer period than the GISS fabrications show.”
That’s exactly right. All the unmodified (unbastardized) data shows it was just as warm in the Early Twentieth Century as it is today.
Nick can’t agree with that, otherwise, he would have to give up his claims that we are living in the hottest time in human history and it’s all because of CO2.
The truth is it is no warmer today than it was in the recent past. There are people alive today who have experience temperatures as high or higher than today. There is no unprecedented warming today, which means CO2 is a minor player in determining the Earth’s temperatures.
Nick doesn’t want to acknowledge these facts. It would destroy his worldview.
“All the unmodified (unbastardized) data shows it was just as warm in the Early Twentieth Century as it is today.”
But no one can locate that data, for NH or global.
Does that mean you will stop using temperature data from 1850 to 1950?
Snicker………..
I don’t use data from 1850. That was the heroes of this post, Soon et al. It’s even in the title of their article.
More hilarity as Nick tries DESPERATELY to PRETEND there is no such thing as urban warming contamination
The only person you are fooling is yourself, Nick-pick,
Everyone else is laughing at you. !
Now you are lying as YOU have used such numbers on your own in the past.
To oaraphrase Everett Dirksen:
7% here, 7% there, and pretty soon you’re talking real numbers.
You’re aging ourselves. Dirksen was more vain and status hungry than the folksy memory of him would suggest. Drill down into how Johnson teased him with car phones…
It’s the quote rather than the source of it. I had to look that up.
I’m surprised it hasn’t been attributed to Mark Twain 🙂
https://www.sciencedirect.com/science/article/abs/pii/S0012825218301235
Comparing the current and early 20th century warm periods in China
“Most proxy series imply a warm early-20th century period and a warm recent period”
end excerpt
That would contradict your claim, Nick.
It seems the rural stations comprise 14% of the blended set.
All else being equal, that puts the urban stations around 9% higher than the rural. That ties in with the IPCC’s approximately 10% of warming being due to UHI effects.
It’s not the dominant factor, but not small enough to be ignored, either.
Here is their plot where they actually give the trends for the current warming period.
All stations 1972-2018 3.27°C/Century
Rural stations 1972-2018 3.05°C/Century
Check out Figure 5hd, the urban data has a more significant difference between the periods 1850-1900 and 1995-2014 than the rural data. This is probably because of a sharper cooling trend in the 1938-1972 period and slightly less warming in the 1972-2018 period.
The rural data also suggests cooling trend starting in 1995 only to be interrupted by the 2016-present blip.
There weren’t many cities around in 1850-1900, and fewer cars. They made big adjustments to try to allow for that.
So you now admit that NATURAL warming is likely to be the cause of ALL of the slight warming out of the LIA,
Just that the latter bit of the surface fabrications, since the 1970s, has been highly contaminated by URBAN WARMING (even in some rural stations.)
Took you a while.. but you are finally getting there. !
Big adjustments eh? So, it isn’t data anymore right?
Adjusted by Soon et al.
Hardly. They took the same data as used by other scientists. If there were adjustments made then they were done to the data set before Soon et al got there.
“ If there were adjustments made then they were done to the data set before Soon et al got there.“
Here is what they said
” Therefore, to develop the rural-only time series, different approaches to correcting for non-climatic biases needed to be applied. The first step was to remove urbanization bias by excluding all non-rural stations for three of the regions (Arctic, USA, and Ireland) and applying empirically derived urbanization bias adjustments to any of the partially urbanized Chinese stations used for increasing the spatial and temporal representativeness of the region [ 5 , 7 , 37 , 76 ]. Documented time-of-observation biases (TOB) associated with the USA network were accounted for using NOAA NCEI’s empirically based TOB adjustments [ 80 , 81 ]. Additional biases due to the documented degradation in station exposure of many USA stations [ 82 ] were corrected by means of a regionally averaged and empirically derived bias correction [ 5 , 7 ]. Finally, biases due to documented station moves associated with the longest rural Irish station in the dataset were identified and corrected for experimentally in consultation with the station owners [ 7 ].”
It looks like their “rural” were just in China, US, Arctic and Ireland.
TOB has been proven to be NONSENSE,
Still in rabid DENIAL that a vast majority of surface sites are heavily contaminated by urban encroachment.
DENYING proven measurements… you nevre were a scientist, were you Nick
Just a mindless grubby propagandist.
How can you categorise a system of corrections to remove an artefact of the UHI warming as adjustments? If you had a load of bent nails and you straightened them you’d sell them as nails, wouldn’t you, not ‘adjusted nails’?
They said it:
” Therefore, to develop the rural-only time series, different approaches to correcting for non-climatic biases needed to be applied. The first step was to remove urbanization bias by excluding all non-rural stations for three of the regions (Arctic, USA, and Ireland) and applying empirically derived urbanization bias adjustments to any of the partially urbanized Chinese stations used for increasing the spatial and temporal representativeness of the region [ 5 , 7 , 37 , 76 ]. Documented time-of-observation biases (TOB) associated with the USA network were accounted for using NOAA NCEI’s empirically based TOB adjustments [ 80 , 81 ]. Additional biases due to the documented degradation in station exposure of many USA stations [ 82 ] were corrected by means of a regionally averaged and empirically derived bias correction [ 5 , 7 ]. Finally, biases due to documented station moves associated with the longest rural Irish station in the dataset were identified and corrected for experimentally in consultation with the station owners [ 7 ].”
Poor Nick. still desperately trying to DENY that urban stations provide a lot of urban warming to the surface data.
Also DENYING that the processes used by GISS et. al. add extra spurious fake warming.
It’s so funny watching him twist himself into a pretzel in the process.
Has ANYONE here ever taken an upper level lab course in a physical science where the professor allowed “CORRECTION” of data to what you thought it should be?
How about anyone who has worked in a certified lab? Did you get to fiddle with measurements?
In my telephone career, if data was bad, it wasn’t repeatable. Trend lines simply had a gap.
Exactly.
“Opinion” would be more accurate and honest nomenclature.
Who are “they”?
Your mom.
There weren’t many cities around in 1850-1900??????
I know you like to play ignorant Nick, but do you have to be so good at it?
Regardless, only a total fool would try to build an estimate of global temperatures in 1850 using just a couple of hundred sensors, almost all of which were located in Western Europe and coastal N. America.
“Regardless, only a total fool would try to build an estimate of global temperatures in 1850″
It’s what Soon et al are citing. In fact, it is only in the period 1850-1900 that they are able to show a significant difference between urban and rural.
WRONG again.. deliberately, no doubt.
Soon et al are trying to emulate the farce that is the global temperature fabrication.
Showing just how woeful it is, and how much urban warming is introduced.
“There weren’t many cities around in 1850-1900,”
Thermometers were around in that time period, and they show that the bastardized instrument-era Hockey Stick chart you are using is a Big Lie that “disappears” the warming of the past to make it appear that we are living in the warmest period in human history today.
It’s not true.
The global temperature record is a fabrication. A bastardization of reality. The real data, the written temperature record, puts the lie to the computer-generated global temperature profile.
You are Living a Lie. Wittingly or unwittingly, I don’t know.
UAH NH Land data shows current temperatures no warmer than the period from 2001-2015.
Also show basically no warming from1980-1997
A step around the 1998 EL Nino
Then no warming or slight cooling from 1998-2015
Then the 2015/16 El Nino spike followed by cooling to now
So there is still urban contamination in the even the rural surface data.
Last-line error correction
…. contamination even in the rural surface data.
bnice2000
That graph is quite revealing. I never crunched the numbers from the UAH for the Northern Hemisphere. I really cannot wait for GOATS to be rolled out. We will see once for all what the true situation is. I wouldn’t be surprised if it revealed a cooling trend. It would go to show how useless the official surface temperature record really is.
The United States has been in a cooling trend since the 1930’s.
Hansen 1999:
This U.S. chart shows 1934 as being 0.5C warmer than 1998. The UAH satellite chart shows 1998, and 2016 as being tied for the warmest temperature since 1998, which means 1934 was warmer than 2016, too. Therefore, the U.S. is in a temperature downtrend. No CO2 worries here, other than in some people’s heads.
UAH gives the trend for NH land over their data period. It is 0.2°C/decade.
UAH shows NO WARMING for basically the whole of the period.
Cooling for a period between 2001-2015.
Great to see you using El Nino as your warming crutch.
It’s almost as if you KNOW that the warming is absolutely nothing to do with atmospheric CO2.
No it isn’t straight from the man:
LINK
You mislead as usual.
That is global trend. I gave the trend of what b nice 2 no one plotted, which is NH land:
Thing is, stating a linear trend in stepped data is meaningless, because it hides the real cause of the warming.
There is basically ZERO trend for nearly all the UAH NH land data.
Just those two small El Ninos.
Any particular reason why you stopped your chart data in December 2022?
An oversight that makes absolutely zero difference.
Still +0.2C per decade warming then?
Only at El Ninos.
Zero trend at all other times
Cooling since the 2016 El Nino.
Absolutely ZERO EVIDENCE of any warming by enhanced atmospheric CO2.
Not even a good try… but a FAIL nevertheless, and as usual.
LOL you ignore the other 98% of the NO warming trend of his chart.
I guess CO2 just suddenly woke in 2023 and decided to warm the Earth.
woke up*
Man, you are one dishonest jerk since you suddenly change to a single year and to just the NH region while I QUOTED straight from DR. Spencer himself over his UAH data and provided the link.
Once again,
“Man, you are one dishonest jerk”
Tommy, you are thick as a brick.This paper is about NH Land data. It’s in the title
“The Detection and Attribution of Northern Hemisphere Land Surface Warming (1850–2018) in Terms of Human and Natural Factors: Challenges of Inadequate Data“
All the discussion has been about NH Land. bnice showed a graph clearly labelled NH Land. I said:
“UAH gives the trend for NH land over their data period. It is 0.2°C/decade.“
and you come back with talk about global land. I even located the numbers for you on Spencer’s UAH table. Here it is again
If you look at the numbers at the start of the red marked numbers, you will see the 0.14, 0.18 etc. They are the global figures. Then he goes on to NH, then SH. NH land is 0.2 C/decade, as red-ringed.
And then the nonsense about a single year. Spencer does not calculate over a single year. of course. He gives at the bottom of his table the trends for the full term of his data. I showed the bottom line of the monthly data (a single month) just to show that the table was up to date.
Now you are just misleading AGAIN since you wrote this which I corrected you twice since you try hard to inflate a claim by leaving out half the world:
LINK
The correction I gave you shows a different number from Dr. Spencer’s website:
I am aware of the articles title but Bnice2000 wasn’t arguing about it the way you dishonestly claim it was about the CAUSES of warming which was the El-Nino’s as he pointed out clearly here to Walter:
Your initial reply to Bnice2000 was also misleading because he was talking about long periods of no warming then a big El-Nino step up warming that are obvious in 1998 and 2016 in his chart but no warming in between them as he has stated over and over made the point that CO2 isn’t driving as it is an ocean cycle that drives it.
El-Nino effects the ENTIRE world not just NH as you insinuate.
You mislead a lot because you water down claims made by others repeatedly you think too much with too much data analysis and not enough reading what other people meant in their posts around the data.
Thanks for showing that Rural-only sites are also quite tainted by the urban warming effect.
People are gradually become aware of this fact..
You never will, though. You can’t allow yourself to see, because it would destroy your cult-based AGW fanaticism.
The chart I posted earlier, clearly shows rural populations also expanding in the latter half of last century, just to a lesser extent.
Rural sites are ‘homogenised’ upward to correlate with their ‘adjacent’ urban sites … Jennifer Marohasey has exposed this previously.
Good point.
Anyone can measure the heat island effect. My daughter Sarah did this when she was in middle school by mounting a temperature sensing thermistor outside her back seat window when we drove from Texas to New Mexico and back. Her data were logged by an Onset logger. She received awards for this project at science fairs. I did a similar project for my science column in Make magazine by mounting a temperature sensor on a pole mounted several feet above the cab of my pickup. I then drove across San Antonio and back at night to avoid heat from traffic and sunlight. This experiment found a very significant heat island effect of up to 10 degrees C between rural areas and San Antonio. You can see the temperature chart plus a color-coded route at:
https://makezine.com/projects/trackingheatislands/
Forrest,
This is very impressive. It’s quite shocking that people claim urban heat island has no significant effect. I’ve walked into my downtown area in the middle of July and then into the city park. It’s like I stumbled into a completely different climate.
You have to remember… Even though the surface site might be well within the expanded urban area, it will not register any urban warming (according to climate alarmists) 😉
… and those urban temperature need to be applied to the much large open rural area around them.
So even though the small urban area might be, for eg, 10km², that temperature gets applied to a couple of thousand km² of rural landscape.
A really NON-science way of fabricating wide-area surface temperatures.
Good point. I live near a town that is @ur momisugly eight square miles in area, and the official weather temperature gauge is positioned at the airport which is within the city limits. The county population is two per square mile, so this area is considered rural. The problem is the temperatures drop 8° F one mile from the city limits. I wouldn’t be greatly surprised to find that many rural area temperature stations are located within a local heat island, thereby unjustly causing elevated readings to be registered in the national data base.
Airports… even small out of town ones, have often undergone fairly substantial upgrades of runways, taxiways, building etc.
Plus they often have a significant increase in traffic of jet-engine planes rather than propellor driven planes.
There is basically no way of knowing how much this contaminates temperature measurements over time.
Apparently the % of airport sites in the mix has also changed significantly over time.
This is another thing that makes the surface temperature fabrications totally meaningless.
Airport sensors are deliberately placed in order to measure the temperature found on the runways. This is done so that the plane crews can calculate take off and landing temperatures. That after all, is what these stations are for. They are there as a service to pilots. They were never designed to be used for weather and climate calculations and simply are not fit for that purpose.
Yep, and as I have said a couple of times…
… that makes them totally unfit for uses in measuring changes in “climate”
And Anthony has already shown that many are located for easy access. That means close to heated buildings and HVAC systems and even mounted on parking lots.
I remember back then when you posted it! Very awesome idea! Kudos!!
It’s a classic case of the oldest statistical blunder in the book, i.e. correlation equals causation. The climate ‘scientists’ have ignored the UHI effect despite it staring them in the face. Anyone with an ounce of common sense can see the massive build-up of urban heat carrying capacity over the exact period where warming is claimed to be being caused by CO2.
It’s astonishing that the UHI effect hasn’t been looked at far more closely by climate ‘science’. It’s almost certainly having a significant impact on the claims being made but has continued to be ignored, which speaks volumes about the science supposedly being settled.
Quite how true scientists can ignore this is staggering.
Heat records set on concrete rooftops next to banks of air-conditioners. in the middle of treeless ever expanding urban areas.
..that’s how to measure “global” warming ! 😉
It’s not that astonishing when you remember that these so called studies were designed from the beginning to support the narrative of dangerous CO2.
Lansner used a similar method, trying to remove spurious local urban warming.
Similar result, but even less since the 1970s
I don’t think it is actually possible to remove UHI from a dataset, despite what ‘experts’ have pronounced. Even within one urban area it varies from one part to another, from one street to another, it varies according to the time of day and time of year. It’s almost impossible to generate an ‘average’ value of UHI that you could use to ‘remove’ it from the data.
“It’s almost impossible to generate an ‘average’ value of UHI that you could use to ‘remove’ it from the data.”
Cretinly how the AGW brigade would attempt it.
Make up a number… subtract it from past temperatures and pretend they have accounted for UHI effects.
Is this CONTENT, Be Nice?
“trying to remove spurious local urban warming”
What he is in fact removing is the effect of proxomity to ocean.
That would surely increase temperature, as the ocean is cooler than the land.
Ah.. so you now admit that the warming comes from the oceans… not from atmospheric CO2
Poor Nick.. your feet must be really tasty today, for you to keep them constantly in your mouth. !
Oh, Be Nice. The oceans do not *generate* heat. They *distribute* it.
The heat that is now in the oceans comes from somewhere else.
You and your silly equivocations!
WUWT readers browsing at Christmas 2018 would have already seen much of this concern over UHI. That is nearly 5 years ago. In that 5 years the establishment community has done little more than stay quiet and try to cancel the concept of UHI. Sorry, that evasive approach is not good enough.
Here is the main conclusion of my data studies on Australian temperatures at “pristine” sites. The more remote a site, the lower the quality of the data and the more that noise becomes a factor. This noise is severe and limiting.
This limits the nice theoretical approach of comparing urban and rural temperatures. Geoff S
https://wattsupwiththat.com/2018/12/20/the-science-of-the-urban-heat-island-effect-is-pathetic-and-misleading/
I don’t why people are bashing Nick. He’s not contradicting the findings of the study. He’s just taking figures provided by Soon and colleagues. Do you guys just like to fight with Nick?
don’t know*
Do you mean you think Nick Sokes agrees with the findings of this study? If so so he has a strange way of showing it
I don’t but if you think that’s what Nick is doing I shan’t bother to educate you.
He’s taking the figures and misrepresenting them.
Yeah, he MISLEADS in nearly every post which is why he gets a lot of flax over them and a lot of down votes.
Did you actually read most of the responses to Nick? If so, you would already know why so many people disagree with Nick’s postings.
Because he believes in AGW without any proof.
Despite evidence to the contrary, like unmodified, written, historical, regional temperature charts, which do not show it is hotter today than it was in the past.
If it’s not any hotter today then in the past, and there is more CO2 in the air today than in the past, and yet it is no warmer today than in the past, then where does CO2 come into the picture?
Nike wants to ignore all those facts, although he is well aware of all of them.
Nick
Still got the edit bug problem. A pain in the you know what.
Monkey,
I’m not bashing Nick, but I will suggest that this UHI matter has him arguing about the quality of data in the head paper, while rather ignoring the overall data quality as I state in the comment just above here.
There is a bigger problem that sort of minimises Nick’s comments.
Geoff S
“A new study published in the scientific peer-reviewed journal, Climate, by 37 researchers from 18 countries suggests that current estimates of global warming are contaminated by urban warming biases.”
Ya think?
“The UN’s Intergovernmental Panel on Climate Change (IPCC) likely underestimated the role of the Sun in global warming since the 19th century.”
Ya think?
“The study also found that the IPCC’s chosen estimate of solar activity appeared to have prematurely ruled out a substantial role for the Sun in the observed warming.”
Ya think?
“For many years, the general public has been assuming that the science on climate change is settled. This new study shows that this is not the case.”
Ya think?
Those of us here on WUWT have known all of this for years. Good to see that others are slowly “seeing the light”.
““The study also found that the IPCC’s chosen estimate of solar activity appeared to have prematurely ruled out a substantial role for the Sun in the observed warming.”
Ya think?”
Yeah, the IPCC started out assuming humans were causing Earth’s temperatures to warm and configured their research to confirm this outcome whether it was true or not. If it were not true, then the IPCC is out of a job, and they are not going to let that happen. They are going to “prove” that CO2 is a demon gas, no matter how many lies they have to tell.
But, I think their arguments have run out of steam. The holes are obvious and getting bigger, and more and more people are catching on.
Without a bastardized global temperature record, the climate change alarmists would have nothing to argue about. All they can do is point at the temperature record. But they are pointing at a lie. All they have is a lie.
And arguing about the minor changes in the 1979-to-present temperature record is missing the point. The real point is it was just as warm in the Early twentieth Century as it is today. That negates the theory that CO2 is the control knob of Earth’s temperatures, because there is more CO2 in the atmosphere now than in the past, but it is no warmer now than then. Thus, CO2 has no discernable effect on temperatures today.
If you see a temperature chart that does not show the Early Twentieth Century as being just as warm as today, then you are looking at a bogus, bastardized, fraudulent, instrument-era Hockey Stick chart. You are looking at the BIG LIE that is driving all the nonsense about regulating CO2, and is costing you money in the process. A lot of money, and it’s going to get worse if we continue down the path of the BIG LIE.
The BIG LIE is what needs exposing. The whole chart, not just the modern era.
“New Study Suggests Global Warming Could be Mostly an Urban Problem”
___________________________________________________________
Problem? Who writes these headlines? Urban Phenomenon maybe, but it’s not a problem.
Consider what happens if they use more electricity or there’s more urban activity within the UHI – it could be a problem for those that live these. The very good news is that it’s going to be a lot easier to mitigate an urban problem than a global problem!
The IPCC and its supporters have probably been aware of these facts for decades now, but such numbers interfere with their alarmist philosophy, so they’ve been artfully suppressed.
The goal of the IPCC when they started out was to find a human connection to global warming.
So it’s not surprising that they claim they have found such a connection. They would be out of a job if they did not find a connection somewhere, somehow.
Their problem is proving the connection.
Our problem is our ignorant/conniving politicians are acting like it has been proven and are acting upon it, and are bankrupting our economies as a result.
Dr Bill Johnston has done a detailed comparison of surface sea temperatures along the Great Barrier Reef, measured in a scientific expedition of year 1871.
He found no significant temperature change over that 152 years.
http://www.bomwatch.com.au/bureau-of-meteorology/trends-in-sea-surface-temperature-at-townsville-great-barrier-reef/
This observation needs to be incorporated into global warming hypotheses.
….
Next, Macquarie Island, in the middle of nowhere, between new Zealand and Antarctica. No urban heat island effect seems plausible. Here is an old plot:
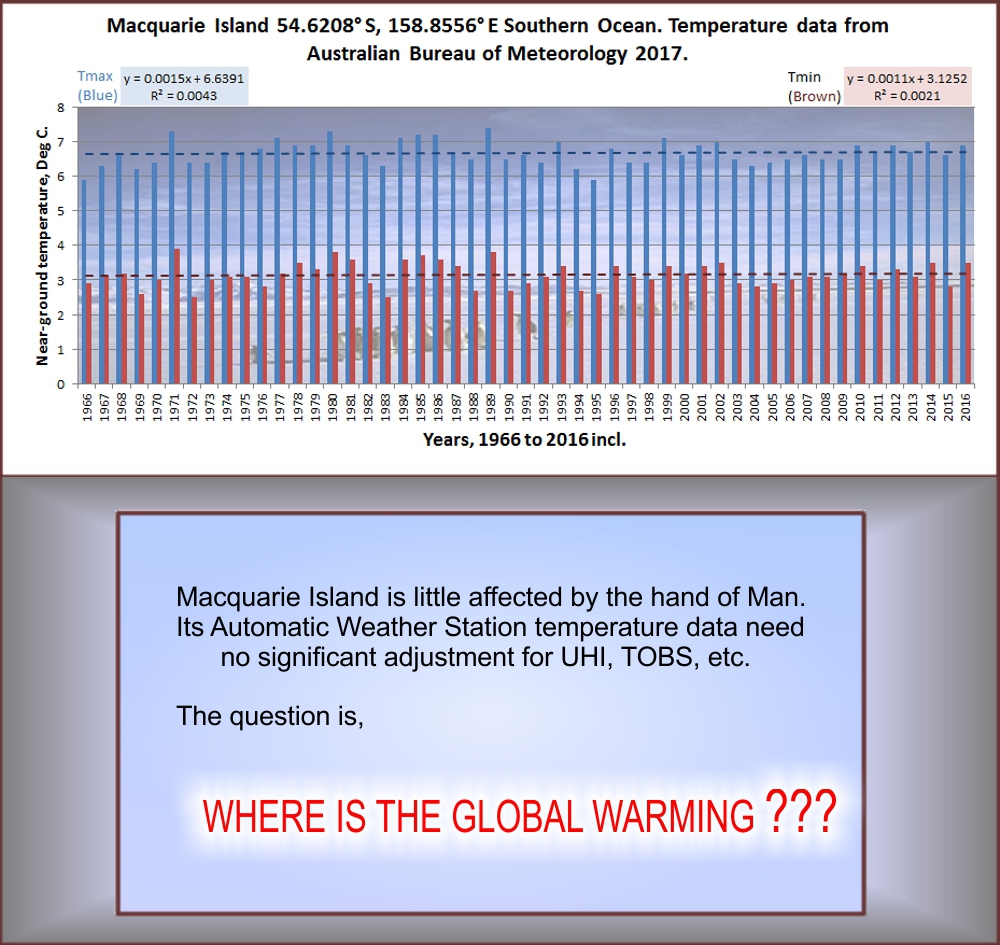
….
Point is, there are many locations that show no warming over many decades. They are seldom discussed or even acknowledged by The Establishment.
It is time that they were.
Geoff S
Last time I posted that chart for Mac Is. Nick S told me I shouldn’t use it.
Obviously the best thing is to ignore most of what Nick says.
It is usual rampant AGW cultist disinformation, distortion, deception or distraction.
Why I never in a million years! Groundbreaking! lol
in the middle of nowhere wisconsin our farmette is ALWAYS 4 degrees colder than the closest 5k person town. always. after adjusting for wunderground bias.
The US Climate Reference Network is all rural and shows very little warming if any since the network began operating in January 2005, nearly 18 years ago.
Yes. The supposedly urban contaminated ClimDiv record shows almost exactly the same
In fact the ClimDiv trend is higher.
“ClimDiv trend is
higherlower”Is that your final answer or would you like to phone a friend?
First, with an average, there should be 50% above and 50% below the mean. Looking at the 2.2+ ΔT and assuming that there are some close to 0 ΔT, where are the stations with a long term 4+ trend? Tell us where they are!
The problem with trending ΔT values without a common base is that you have no idea whether different stations are combining each year to keep the trend higher. Multivariate time series can be a bear to analyze. We have seen multiple stations scattered around the globe that have a zero trend. You need to show stations that have a large growth if you want to convince anyone.
It is beyond the time when averages are going to suffice in convincing people that something catastrophic is going on. Too many people have seen headlines that everywhere on the globe is warming too fast, everywhere is having more extreme storms, and everywhere is experiencing catastrophic fires.
If an average means anything, it means half the people are seeing these problems but half are not.
> First, with an average, there should be 50% above and 50% below the mean.
Hmmm. Big hmmm.
Where’s Nice One?
Over here, Nice One!
If you are questioning the fact that the 50/50% requires a normal distribution, then say so.
If you are hinting that skewed distributions are what is occurring then say so. There are large statistical issues about skewed temperature distributions that need real discussion.
> If you are questioning the fact that the 50/50% requires a normal distribution, then say so.
I’m actually reminding you that you are presuming normality, Jim.
Have you tested for it?
I have all ready addressed that in a post back to another of your posts.
No, Jimbo. You haven’t tested it. You’re just mouth breathing.
If the distribution is normal then 1/2 above and 1/2 below. If it isn’t normal then the average is meaningless. For a skewed distribution it should be described by a different statistical descriptor – such as the 5-number descriptor.
You can’t win this one. The GAT is garbage either way.
> If the distribution is normal then
That’s better.
Now, why would you presume that temperature anomalies are normal?
***
> If it isn’t normal then the average is meaningless.
Great. Should we tell the news to these traders around the world who use moving averages?
Tell you what. Tell the folks here what is the difference between a moving average and a distribution of values.
If you want to discuss something we need definitions from you.
Try putting this question into ChatGPT.
It might give you a hint about the difference.
What is the difference between a distribution and a moving average.
Then to assist you in learning about skewed distributions type in this question.
Is an average meaningful in a skewed distribution?
Conflating mean and average may not help your Riddler act, Jimbo.
Nevertheless, working with the mean of a skewed distribution is perfectly fine. It gives you something like the “size” of a trend. Since a median is “weightless” it has no real usefulness for trend followers.
In any case we’re dealing with temperature anomalies, so none of your metrological innuendos carry any weight, pun intended.
Nick again with the ClimDiv nonsense? Doesn’t reading Soon’s paper tell you something about the adjusted measurements?
Oh, Walter. You must be new to Climateball. You know that adjustments cool things down, do you?
Only in Zeke-land !
Willard funny seeing you here. It is my understanding that the adjustments cool the urban data while warming the rural data.
The adjustments I have seen Zeke try to say decreases the trend,
…actually make the warming trend from the 1970s steeper.
Which is, of course, exactly what the climate scammers want to show.
If it is from Zeke, or Nick… you KNOW it is a con. !
Sarcasm I assume
If you consider the oceans urban areas you are correct, Walter:
Willard,
Here is what I am referring to. Now please provide your counter evidence.
Here is the bit that should have been a tell, Walter:
“Japan and in the United States”
A hint is provided in the title of that piece:
https://www.carbonbrief.org/explainer-how-data-adjustments-affect-global-temperature-records/
Welcome to Climateball!
Except those aren’t RAW measurements.
They are a FABRICATION in there own… done after much adjustment of raw data..
Pretending a fabrication is RAW measurements is totally laughable, and something only the most moronic dullard would fall for.
We are talking the wholesale data adjustment before it even gets to the fabrication stage.. eg
And of course the continual changes made to GISS over the years. to shape the curve and remove the 1940s peak
https://wattsupwiththat.com/2023/09/02/new-study-suggests-global-warming-could-be-mostly-an-urban-problem/#comment-3777835
Still the childish game references.
What does Reykjavik have to do with global temps, Nice One?
We are talking about “adjustments, moron. !
We’re actually talking about the adjustments in the global temperature datasets, Nice One.
If you keep butting in everywhere I go, you need to be able to follow exchanges.
There’s the Nick-pick NAIVITY yet again
USCRN is now controlling the fabrication of the US surface data.
They would look pretty STUPID if they continued with their intentional warming “adjustments” and Climdiv continued to warm , wouldn’t they Nick.
You really have a gullible little mind for one that pretends to be educated.
The real conundrum is that Climdiv would end up showing that human energy use, land use, and building is responsible for warming and not CO2. Can’t have that! What to do, what to do?
This is what happens when you have basically NO URBAN WARMING contamination.
You get a near zero trend.
> 37 researchers
Don’t be shy, CERES team. The first three are you, and the others are a who’s-who of the Contrarian Matrix:
Willie Soon, Ronan Connolly, Michael Connolly, Syun-Ichi Akasofu, Sallie Baliunas, Johan Berglund, Antonio Bianchini, William M. Briggs, C. J. Butler, Rodolfo Gustavo Cionco, Marcel Crok, Ana G. Elias, Valery M. Fedorov, François Gervais, Hermann Harde, Gregory W. Henry, Douglas V. Hoyt, Ole Humlum, David R. Legates, Anthony R. Lupo, Shigenori Maruyama, Patrick Moore, Maxim Ogurtsov, Coilín ÓhAiseadha, Marcos J. Oliveira, Seok-Soon Park, Shican Qiu, Gerré Quinn, Nicola Scafetta, Jan-Erik Solheim, Jim Steele, László Szarka, Hiroshi L. Tanaka, Mitchell K. Taylor, Fritz Vahrenholt, Víctor M. Velasco Herrera, and Weijia Zhang
Well played!
So, absolutely NOTHING to counter the facts in the paper, hey dullard.
Next you will be quoting Mickey Mann or some other AGW charlatan. !
When do you pull out the “denier” canard?
From the quality of his posts, it’s obvious that he is not here to engage intellectually.
I thought Karlo was the flying-monkey-in-chief here, Mark.
Still waiting for your cogent counterpoint to the paper but you won’t because the material is too difficult for you to understand to be able make a decent argument on it.
Would you like mustard or mayo on your sammich, Tommy?
Still awaiting that you concede the ONLY point I made so far, against which you got nothin’.
You poor mindless zero-content dullard !
You haven’t made any point.
Every post you have made has been pointless.
Why are you trying to start a food fight, Nice One – is that because you want people to be nice?
He is trolling but that is now allowed despite that the policy says it should be moderated.
Tommy is still playing the ref.
Back in my days, bullies were tougher than that.
Is that what you call a rebuttal?
Dullard just doesn’t like the fact that every one of them has far more education and understanding of climate and the science behind it, than he could ever hope to attain.
Dullard haha.
Nice, bnice. Is this what you call a counter?
Is that preemptive whining about the D word, Karlo.
When all you offer are insults, what’s to counter?
For starters, the fact that the authors refer to themselves in the third person, Mark.
Interesting policy, BTW. Imagine if Nick applied it.
That’s how scientific papers is wrote.
Blogs are less formal.
> That’s how scientific papers is wrote.
You’re confusing the first person plural with the third person, Old Cocky One. Search for “illeism” or think of Julius Caesar.
In the case of this newsie it has a <em>check kiting</em> effect.
“He” or “he” occurs 10 times in the paper. “Him” or “him” do not occur. “She”, “she”, “Her” or “her” do not occur.
“They” or “they” occurs 24 times, not all in reference to people. “Them” or “them” do not occur.
The occurrences of “He” and “he” are in relation to referenced papers by Chatzistergos, Scafetta, and Harde. Scafetta and Harde are co-authors of this paper; Chatzistergos is not. Should references to papers by co-authors be treated differently to papers by third parties?
The occurrences of “Them” or “them” are in relation to temperature estimates, the CMIP6 organisers, papers by Connolly et al, Li et al, Richardson and Benestad, O’Neill et al, Gillett et al, Lüning and Vahrenholt.
The first person plural is generally used in reference to the current paper, third person singular or plural is used in referring to referenced papers. It helps to maintain context and reduce ambiguity.
The relevant sentence to parse was this one, Old One:
> A new study published in the scientific peer-reviewed journal, Climate, **by 37 researchers** from 18 countries suggests that current estimates of global warming are contaminated by urban warming biases.
The author of that sentence is identified as the CERES team.
The CERES team includes three of the 37 researchers.
In fact, they’re the first three authors.
They refer to themselves as if they were not.
I had to check who was the CERES team to see that.
Clearer now?
Fair enough; it’s rather bad form to write one’s own press release. It’s usually some PR flack who writes those.
I thought you meant the paper itself, which uses entirely conventional academic language.
trying to make irrelevant attacks on the authors.
Because you know you can’t respond to the science.
You are a mindless non-entity, dullard.
Then you have no objection to the CONTENT of the paper you keep dodging.
No CONTENT has been harmed by any of your comments so far, Tommy. Why is that?
Besides, you really should beware your wishes.
Your comments contain ZERO content, dullard
‘
If I make a comment that echoes yours and you say it has ZERO content, what does it tell you about the CONTENT of your comments, Nice One?
No he just thinks he’s wee’d up the wall higher than MarkW. Childish and, frankly, rather pathetic.
Thank you for telling everyone what I think, Richard.
Next time I want to know what I think, I’ll ask you.
“ the others are a who’s-who”
Not to mention that the MDPI journal editor responsible was our old mate Den Volokin.
All way more intelligent than Nick is.
Willard means they are actual scientists.
“The paper went through a normal blind peer-review and was accepted based on its scientific value.”
Jealousy still there, hey Nick !
Pathetic !
They were most certainly not blind peer reviewed. The first review begins
“The present paper by W. Soon et al. represents a most relevant,
interesting, and timely contribution to the ongoing debate…”
Blind peer review means no-one knows who the reviewer is.
Your ignorance is showing again.
That’s single-blind, Nice One.
Only double-blind matters.
I think that’s anonymous peer review.
Is that supposed to mean something?
Yes it is.
Perhaps you’re too old and cocky to get it.
Perhaps you could spell it out, then.
I’m only a poor old duck.
Which part of “Don’t be shy, CERES team. The first three are you” you do not get, Old Cocky One?
Do you mean they will favour a particular hypothesis?
Do you mean you think they are wrong?
Do you mean you don’t like the colour of their shoes?
In the words of one of our local politicians – Please explain.
Do you always play dumb and then ask leading and loaded questions when you are being spoon fed, Old Cocky One?
What the hell are you on about?
It was a serious question. What is your objection to the authors, and what relevance does that have to the paper?
All I’ve seen so far is that you seem to think they are all “deniers”.
Sorry, That should have been “The Contrarian Matrix”.
That they’re contrarians should be kinda obvious, Old One.
Why should I care about what a paper from a predatory journal says?
It’s obvious that they advanced an alternative hypothesis.
Was that supposed to be your point?
Why not just say so and skip the insults? Is civil discourse foreign to your nature?
> they advanced an alternative hypothesis.
They actually advanced many hypotheses over the years, Old One, most of them incompatible with one another. But it’s nice to see that they can coordinate and work together for once. Another decade and they might even be able to constructively contribute to science.
There is hope!
As for call for civility, when Tony’s flying monkeys will behave, I’ll see what I can do.
A number of posters here seem to be like English football “supporters”, but I find that winning a flame war is a Pyrrhic victory.
Agents provocateur are best ignored.
Oddly enough, that is how science progresses.
Some of the authors are less mainstream than the others. It does seem an unusual grouping. The incompatible hypotheses seem to arise from the overall author list rather than the individual authors or their more usual smaller groupings.
This could, indeed, be seen as putting aside personal opinions to assist colleagues, which is rather in the spirit of science.
Oh, and your mother was a hamster and your father smelt of elderberries.
*Hearing the sound of a flying cow, ducks and covers.*
👍
poor dullard,
You haven’t been able to counter one single thing in the paper.
So funny that you carry on with your petty attempts at smearing
But that is the AGW way… its all you have.
Poor Nice One. Even if the paper was right, AGW still stands. In fact if he thought about it for one second he’d realize it reinforces it!
Let’s hope he’s not betting the house on one paper in a predatory journal.
Ah the old and worn out Authority fallacy is once again employed.
Might as well dump all the research by people some who didn’t even attend college because they don’t meet the education fallacy warmist/alarmists loves to promote.
Here are a few names to ponder over:
Clyde Tombaugh
Milton Humason
Alfred Wegener
Ignaz Semmelweis
Charles Messier
William Herschel
Nicholas Copernicus
There are many more names of people who didn’t have the education or experience to succeed with.
I point at:
(TOMMY) Ah the old and worn out Authority fallacy
(ALSO TOMMY) Here are a few names to ponder over:
That is all.
The significance of my post zoomed over your head because you don’t understand it.
Cheers.
Oh, Tommy. I actually could explain the three mistakes you make.
But why bother?
No, you couldn’t explain the mistakes…
You don’t have the intelligence to make up a rational explanation of anything.
You would just give another mindless irrelevant rant..
I see. We have a tough customer. Allow me to explain another, but related mistake you just made:
I told you that you made three mistakes, but that I won’t bother explaining them. From that you infer that I could not. Your inference is invalid. In fact you’re trying to pull me in.
Silly flying monkeys!
The moderation standards have slipped here since trolling and thread bombing with empty replies is being allowed at a greater rate than before, if this goes on more and more, I will quit this blog.
Playing the ref, Tommy?
You and Mister Nice Guy are the ones who keep ankle biting, BTW.
I simply respond in kind.
Tommy,
Willard seldom comments here. He lurks in the comments of Roy Spencer’s blog. Someone there sent a link to this thread.
bnice2000,
It seems like you’ve made a new friend.
Quite right, Walter. I like nice guys, and Be Nice is the nicest guy around. He can join us any time:
https://www.drroyspencer.com/2023/08/martha-stewart-exposes-the-ignorance-of-climate-alarmists/#comment-1529518
Please don’t tell him that Roy’s is a contrarian honey trap.
They may be “Contrarian Matrix” fellows to you but calling them names only make you look jealous and petty.
Soon, Briggs, and Steele stand out to me as experts. I guess if you can’t argue facts, spit out ad hominem’s as fast as you can.
Willard strikes me as the type who posts only to prove to the girls in his class room how cool he is.
Hot girls may not read Tony’s, Mark.
You and Tommy ought to discuss how to deal with appeals to authority, Jim.
Have you audited the paper, BTW?
You have yet to counter the paper………………….
Snicker.
You have yet to show you read the paper…
Mars.
You are trolling as I have exposed your disinterest in the article that drives this thread.
Cheers.
You exposed absolutely nothing, Tommy boy, except perhaps your wish to become the in situ moderator.
Since I didn’t appeal to any authority, I’m not sure where you see that I commit an ad verecundiam. Not that appealing to an authority is eo ipso infelicitous, mind you. Nevertheless, by your own logic you are making an invalid argument, since you name drop.
Look. Nick simply looked at one graph and y’all throw an hissy fit. The best you got was Jim making an elementary statistical blunder.
Is this the best you can do?
Honest question.
No blunder except by you. Normal distributions are assumed almost 100% throughout climate science. You need to show where you or any climate scientist has done any of the more complicated analysis of dealing with skewed distributions.
I have. I analyzed the temperature distribution in NIST 1900 Ex2. The assumption there is that a Student’s T distribution, a basically normal distribution, would apply. When doing a quartile assessment, the mean and median differed by 1° C. That explains why an expanded experimental standard uncertainty is required and may be too small.
You know nothing of my background nor my knowledge. Your criticism of my comment being an elementary statistical error is an ad hominem attack.
Your argument FAILS.
> Normal distributions are assumed
Check this graph, Jim:
Does it look like a normal distribution to you?
You are lost in the dark. Why do you call this a DISTRIBUTION?
It is not. Come back when you learn what a statistical distribution is.
Here is a hint – frequency!
Maybe you can tell the blog what graph is actually called.
Here is a hint – time!
Are you really suggesting that time series have no DISTRIBUTION, Jim?
You know, I really don’t care about your background etc. All I need is what you write in your comments to know that you’re the biggest poseur of all those who comment here.
And that includes our Viscount.
You really are a troll with little knowledge.
The graph you posted is NOT a statistical distribution. It is not even a graph of a functional relationship. I suspect you don’t even know what that is.
You want to illustrates the fact that you have some knowledge, show a statistical distribution of the value in the trend graph.
Jimbo, you goose. What’s the name of the red line, again?
Look at the x-axis dumba**. Do you truly think those are some kind of measured quantity?
So now temperature anomalies are not measured quantities, Jimbo?
You really are the formal guru Tony’s crowd needs!
You don’t know what embarrassed means do you? Obviously you do not or you wouldn’t be giving such vacuous responses that betray your ignorance.
> You don’t know what embarrassed means do you?
Indeed I do, Jimbo. But do you?
Nick isn’t far from being a saint to bear with you.
I’m not appealing to authority. You are the one who mentioned the names first. I simply responded what my OPINION of a few of them were.
If you are saying that I shouldn’t be able to express a different opinion than you, you have a large problem in your personality.
> I’m not appealing to authority
You actually do, Jim. Right here:
(JIM) Soon, Briggs, and Steele stand out to me as experts.
Why the hell would you try to deny what every single reader can see?
Tell me exactly what I claimed in my post that required a reference to authority!
You fail.
Since I just quoted you, Jim, I’d have better chance with a thirsty horse.
Yeah, that’s what I thought. You FAIL again!
Why don’t you leave Mama’s basement and do something useful for society?
Oh, Jim. You goose.