From NOT A LOT OF PEOPLE KNOW THAT!
By Paul Homewood
Do they think we are really so gullible?

Tuesday was the hottest single day on Earth in the history of human civilization, according to a combination of global satellite data and historical tree ring analysis. One point in far northern Canada was hotter than Miami. In Siberia, the temperature in Altai hit 94°F. Despite July being mid-winter in the Southern Hemisphere, temperatures in Argentina and Chile soared to more than 86°F (30°C). In the Philippines, Metro Manila recorded its hottest-ever July day. The temperature in Iran, Algeria, and Oman all reached 122°F (50°C).
“It hasn’t been this warm since at least 125,000 years ago, which was the previous interglacial,” Paulo Ceppi, a climate scientist at London’s Grantham Institute, told the Washington Post. Given Earth’s annual temperature cycle typically peaks in late July, this is a record that could be broken several more times this month.
The idea that we know the global temperature today is absurd in itself. But the idea that we actually know what it was on a given day 100 years ago, or 1000 years ago, never mind thousands of years ago is sheer fraud.
And the claim that it is hotter now than 5000 years ago is a total lie – there is abundant evidence that it was much warmer then.
And as always with all of these silly scare stories, they cherry pick some high temperatures in the Arctic, knowing that the public will find them alarming because they assume the Arctic is always freezing normally.
For instance, “One point in far northern Canada was hotter than Miami.”
The link takes us to Kuujjuaq:

And the daily temperature from KNMI shows that temperatures over 90F, 32C, are not uncommon there. The new record of 93F replaces the old record of 92F set in 1999, which is hardly cause for panic!

https://climexp.knmi.nl/selectdailyseries.cgi?id=someone@somewhere
Then there’s Siberia:
“In Siberia, the temperature in Altai hit 94°F.”
But again we learn that temperatures often exceed 90F there; the record of 96F was set in 2000:

And according to the con merchants, there has been record-setting melt of the Greenland ice sheet.
Maybe Eric Holthaus has been holding his graph upside down! Greenland has added 100Gt of ice during June, when it is supposed to be melting.

http://polarportal.dk/en/greenland/surface-conditions/
Naturally the BBC and the rest of the media lackeys have been peddling the same lies and nonsense:

https://www.bbc.co.uk/news/science-environment-66104822
no problem – the US & UK governments have a plan to block out the sun – what could possibly go wrong with that?
I matters not that you have experienced a pleasant spring and mild summer were you live, a place that has had hot and humid springs and should reliably be in the 90’s to 100 by July but is currently 85 degrees and sunny.
The keepers of the data (kept behind closed doors under lock & Key) have manipulated the Global Averages (East Anglia anybody?) to be “THE HOTTEST DAY ON RECORD!” It’s over there not everywhere don’t you know.
They beat this drum to brainwash those future voters whose earliest memory of spring and summer only goes back 1O years to voluntarily crowd into the cities and take the bus which will reliably break down because it is run on an unreliable battery they pretend is charged by the Sun (which is suspiciously absent casual relationship in their propaganda on Global Warm…ahh we really meant Climate Change all along).
As these future voters grow up, their evidence of the “Hottest day on record” will be supported by the experience of sitting in a hot bus waiting for the diesel version to rescue them and get them to their destination 2 hours late.
Here in Central Ohio it has been unusually cool this summer. Daytime high temps have not yet breached 90 degrees even once and it’s already the second week of July. They aren’t forecast rise above 82 anytime in the next 10 days, either.
I prefer cool weather, so I’m not complaining. I always think about these things in a particular way:
The total insolation received by the Earth doesn’t really change, nor do any of the other bulk characteristics which would effect average temperature. Therefore, the average temperature remains the same; at least, temperature and area integrated over time will not vary.
That means that if it’s too hot somewhere, it must be too cold somewhere else. It isn’t possible for the whole planet to heat up unless you actually changed the albedo.
According to all these graphs of the Earth’s hottest day in July, the temperature of the entire planet should go down about 4 degrees by the time we get to Jan. 2024.
That happens every year. The graph says the climate mean is 16.21 in July and 12.41 in January, when we are closer to the Sun.
What mechanism causes the temperature of the entire Earth to go up or down by 4 degrees each and every year?
And if we can survive the Earth’s temperature rising by almost 4 degrees every 6 months, can we survive the temperature rising by 3 degrees in a century?
Singular temperature records shouldn’t really be focused on. Global warming continues apace and that fact is concerning enough, whether we had the hottest day ever or not.
Please state what humanity needs to be concerned about adapting to if current temperatures reach or exceed those of say the Roman times.
The Roman period warming was a regional phenomenon, not global, and global temperatures were cooler than today.
Nope – wrong guess, try again. You really are bad at this game aren’t you? Next time try thinking for yourself rather than regurgitating some garbage you stumbled over on an alarmist blog somewhere.
Sorry, the latest scientific research affirms my post. The warming was regional, not global. References are cited here: https://en.wikipedia.org/wiki/Roman_Warm_Period#:~:text=More%20recent%20research%2C%20including%20a,%2C%20not%20globally%2Dcoherent%20episodes.
Wikipedia? I was right then -regurgitated garbage you stumbled upon. I have already mentioned a couple of papers that refute your ill-informed opinion, showing that temperatures were higher in the Roman warm period. Cite scientific studies please not substandard alarmist rubbish from wikipedia.
Refer to Alan J’s post from ‘Nature’, or to the references cited in my Wikipedia post. . Yours is outdated.
Wikipedia, really?
“””””More recent research, including a 2019 analysis based on a much larger dataset of climate proxies, has found that the putative period, along with other warmer or colder pre-industrial periods such as the “Little Ice Age” and “Medieval Warm Period,” were regional phenomena, not globally-coherent episodes.[7] “””””
Your research capabilities are lacking. See this link that points out Pages 2K contradicted itself after only 4 years. Their 2019 graph shows there was no Little Ice Age, just1900 years of very cold temperatures! If you look around you will find studies that shows there was a global Little Ice Age. That refutes the Wikipedia page. Sorry about that.
https://iowaclimate.org/2021/08/16/the-ipccs-latest-pages-2k-2019-temperature-hockey-stick-is-contradicted-by-pages-2k-2015/
Not from a reliable source and not peer reviewed. Fail.
It has been my experience, and that of others, that Wiki’ does a reasonably good job of explaining science and math, but an abominable job of being objective with topics that are politically polarized, and tends to support the woke narrative instead of presenting both sides of the evidence. Just because a particular published paper contradicts a position doesn’t mean it is right or that there won’t be further research that contradicts it. Science advances with back-and-forth exchanges, and your willingness to accept something because it is recent or supports your beliefs says a lot about your approach to science.
What you are really saying is that there was a warm period in the known world. Little is known about the New World or Siberia because of a lack of written records or well-characterized proxies. The Wiki’ article seems to support a more widespread warming based on proxies.
LOL.. Pages2K interpretation by Wikipeedia…… that is funny.
Many tree rings, so is actually showing the CO2 deficit.
It is meaningless trite for temperatures.
He’s hitting us with all the talking points. Apparently, he doesn’t realize we’ve heard all this before. He thinks he is enlightening you, Richard.
It always ends the same though. Good for entertainment value. 🙂
Yes, hitting you with Science. Once again.
“Science”? You mean “The Settled Science” responsible for all that’s on “The Failed Prediction Timeline” on the top bar?
Got it.
You mean “The Settled Science”.
(Or maybe Fauci?)
Great graph showing how CO2 effects natural growth of all plant species. !
Clearly shows the limits of growth being a deficit of CO2 over that period.
Well done.
You do know the main necessity of tree growth is CO2, don’t you… and that trees are basically useless as thermometers.
You do know that these graphs are “PAID-FOR” pre-determined results, specifically to support the Mannian malfeaces. .. don’t you !
Peer reviewed science. You know, the stuff developed by educated researchers, found in University and High School textbooks, reference libraries and affirmed by Scientists. You should read it.
We’ve seen it all, and what we see is there is no evidence CO2 is doing what the climate change alarmists claim it is doing.
I won’t ask you to provide evidence because I know you don’t have any evidence, despite your appeal to authority. The authorities don’t have the evidence, either. Going by what they say is leading you astray. You and millions of others.
Nice hockey stick!
Kook.
Funny how you want cited references from everyone but yourself!
Worse, you can’t even find a current graph using Google search!
Cherry picked science.
Talking points. No evidence.
Well, by that standard of logic, the change in conditions in Antarctica (as per TheFinalNail’s comment above) is also a regional phenomenon, not global.
So Antarctic conditions have no relevance to “the hottest day evah!
(Shall I tell TFN he’s full of it, or will you?)
A regional warming in the Roman times tells us that AGW is (or is not) not happening today? How is that relevant at all?
You are assuming the warming was regional. Where’s your proof?
Do you think Europe would remain unusually warm for decades while all around it was a colder world? Do you see any real-world examples of that happening today?
I didn’t think so.
The earth today is warmer than it was during Roman times:
The concerns that humanity should have for this are neatly laid out in the latest IPCC report.
No problem;
According to all the graphs showing the hottest day ever in July, the entire planet will cool down by about 4 degrees over the next 6 months.
Problem solved!
What is the mechanism which lowers and raises the temperature of the entire planet by 4 degrees every 6 months, according to all the graphs the BBC has been showing?
Unless you have a magic crystal ball, you can’t know what global avg temps will do in 4 days.
This is where science comes in handy.
The attached graph, your chosen evidence for the hottest day ever, shows that we can expect global cooling on a truly massive scale over the next 6 months.
Down from 17 to 13 degrees!
Either this evidence for the hottest day ever is garbage, or there is some mechanism heating and cooling the entire planet by 4 degrees every 6 months.
https://www.axios.com/2023/07/07/earth-four-hottest-days-thursday
2023 daily results doesn’t have to repeat 2022. That’s really absurd.
Astonishing. You have a big line showing 1979-2000 , and you are now bare-facedly denying the evidence of your own evidence.
A mean line of all temps doesn’t predict the specific behavior of temps 4 days in the future! You’re not covering yourself with glory here.
And you are covering yourself with nonsense and BS.
As you say, 4 days is NOT climate… it is weather.
One day you may become educated enough to tell the difference.
But probably not in this lifetime.
Yes, as I say, and as scientists say, 4 days is weather , not climate. I think she’s got it!
Nor can you.
You could have a good game of hockey with that graph – which is about all it’s fit for. Please link to an actual scientific study please, not a political opinion piece.
That is the data.
The link I provided is to a scientific study that was published in Nature.
You need to read this article:
https://wattsupwiththat.com/2023/06/29/the-verdict-of-instrumental-methods/
It talks about the temperature record you are using.
Not scientifically correct.
A Mosher! Who appointed you the arbiter of scientific correctness?
This is a peer reviewed paper. You are also calling the editor and reviewers incompetent.
You obviously highly value your analytical skills. Explain what is not correct, in detail!
This is not a peer reviewed paper. Its a blog.
Hmm so you never read it then – that figures. You see, if you had actually read it then you would have realised that this was a summary of a peer-reviewed paper published in an honest-to-gosh scientific journal. The fact that you had already decided that your opinion trumps that of a published, peer-reviewed scientist says it all really – especially when you support your argument with rubbish from Wikipedia!
A Blog that is a superior peer review.
Even you get to put in your two cents worth.
“A Mosher! Who appointed you the arbiter of scientific correctness?”
He appointed himself. Which is fine, if he has his facts straight, but he doesn’t.
Why should we accept your dismissive remark without any support whatsoever?
Tell you what. I’ll evaluate your remark at not charge: Not scientifically correct.
Oh, so you only defer to authority when the peer reviewed science agrees with your personal beliefs.
This is the way people stay in the False Reality they live in, by rejecting anything that doesn’t fit with their False Reality. You have quite a bit of company in this Human-caused Climate Change False Reality of yours, but you don’t have one particular resident: The Truth.
I read it, and refer you to the thoughtful comments dismantling the nonsense Pat Frank is spreading.
Give some examples that were not refuted. Otherwise you have no argument.
Refer you in particular to the comments from Nick Stokes. None of those comments were refuted, and they are thoughtful and clear and devastating to Frank’s argument. “Replied to” and “refuted” are not synonymous.
There is a fascinating microcosm of posters on this site who subscribe to some really bizarre and stupid ideas about statics and mathematics – I don’t know if the general user base actually agrees with them or just cheerlead people like Frank because he is fighting for their “side.” If you’ve drunk the koolaid there probably isn’t much on this earth that could ever persuade you from believing the nonsense, certainly not rational argument.
You just described the Climate Crisis Cult with pinpoint accuracy.
It’s called “projection”.
You do know that your link to Nick’s posts shows just how ignorant about statistics he really is, don’t you.
Has little understanding of when the “root N” large samples can be used and when it can’t.
He does NOT refute Pat’s work, all he does is show how clueless he is about the subject.
No he explains in clear detail. Must be above 6th grade Science level for you not to understand.
Last resort of the loser, ad hominem attacks.
You continue the high school debate failure of Argument by Authority.
Are you afraid of stating what and why you disagree with specific conclusions.
“bizarre and stupid ideas about statics and mathematics”
Yep, a great definition of that post from Nick..
And nothing to do with “statics”, btw. !
Refutations must be presented to the publisher to be valid and published. Otherwise they are nothing more than what you said, a blog post.
“ I don’t know if the general user base actually agrees with them or just cheerlead people like Frank because he is fighting for their “side.”
The fact that more data can make both averages and trends more statistically durable than that of any of the individual data points is both true and counterintuitive, when those parameters are falsely conflated. Frank exploits that to keep a core of sheeple thumbing him in these fora. There are plenty of true scientists like Roy Spencer who have problems with both models and the impacts of AGW, who nevertheless mercifully ignore Dr. Frank.
But on the bright side, the Stanford SLAC tells us that he is a good lab manager and if you have a question about lab waste, he’s the go to guy.
https://sites.slac.stanford.edu/scienceinfrastructuresafety/about-us
blob the clown shows his oil spill-soaked feathers.
Nice ad hominem.
Here is the description from you source.
“””””Patrick Frank supports the Science Directorate as a resource with considerable experience in Chemistry and Synthesis. He is a member of the scientific staff at SSRL and carries out independent research, manages the campus laboratories of Prof. Keith Hodgson and Prof. Britt Hedman, and supervises the management staff of the Sample Preparation Laboratories (SPLs) at SSRL and LCLS.”””””
What do you think “He is a member of the scientific staff at SSRL and carries out independent research”, means.
Are you part of a scientific staff? Do you do independent research at the Doctoral level?
I’m guessing that his chemical research is fine. But the “ad hominem” of “independent research” certainly applies to all staff there who are nominally qualified and who don’t have job descriptions good enough to cover 30+ hours a week.
We have already seen his non chem “research”, and it is – again – mercifully ignored above ground.
Jealous much? Unbecoming!
Idiot.
In other words, you are very comfortable living in your Human-caused Climate Change False Reality.
Hand waving without any specific citations.
Got a link to those thoughtful comments? I must have missed them.
I read the comments. I didn’t see any dismantling of Pat’s paper.
Just,
You can’t do this.
You can’t do that.
The GUM says this.
The GUM says that.
Never addressing what was done in the paper and WHY there were incorrect assumptions and how it should be done.
One can say this doesn’t look correct to me, but that is not a refutation.
A lot more work and knowledge must be applied to SHOW something is incorrect.
I haven’t seen anything in that vein. Too many folks think you can increase the resolution of a measurement by averaging! IOW, I can measure a brake rotor to the nearest inch, do it every degree, and get an average to the nearest 3 thousandths of an inch. Ridiculous!
The linked article does not claim what you did.
The description of these graphs says –
Figure 1: (A) Reconstruction of global mean temperature over the last 2000 years using multiple methods demonstrates the unprecedented rate of current warming. (B) Spatially resolved temperature reconstructions demonstrate that warm periods prior to the current warming were not globally synchronous.
The article also reveals that its conclusions were based on “ensembles of millennial-length climate-model simulations”.
And without confidence levels shown, one can assume the compliers of these graphs believe they have computed absolute accuracy & precision of temps values?
Please reread the point B you’ve quoted and try to comprehend what it is saying.
Alan, I do comprehend that this statement –
The earth today is warmer than it was during Roman times
does not carry the same meaning as this message –
Spatially resolved temperature reconstructions demonstrate that warm periods prior to the current warming were not globally synchronous.
The first is an assertion that now is warmer than back then.
The second is an assertion that warmer temps back in history were not experienced everywhere around the globe at the same time.
I can recommend some effective and affordable remedial English comprehension courses which you should seriously consider taking.
Both statements are consistent.
They are not. You obviously do not know what a mean value of a normal distribution and neither do these scientists.
A mean is meaningless without a variance. At best, with a normal distribution half the data is below the mean and half is above. This makes the statement “were not globally synchronous” dubious. Of course they weren’t synchronous.
Read this page at Climate Audit. Perhaps you can refute Steve McIntyre’ statistical analysis. He has another page on 30 – 60S. Good luck criticizing his work!
The statements are consistent with each other. “were not globally synchronous’ means the Roman warm period and other regional warm periods did not occur at the same time, so therefore global avg temperatures did not track the Roman warm period, and explains why global temperatures did not rise as Roman temperatures rose.
Steve Mcyintire? He already lost his round to Michael. Mann. Not a very good statistician.
Who pays you to type this tripe?
“The statements are consistent with each other. “were not globally synchronous’ means the Roman warm period and other regional warm periods did not occur at the same time”
It is ridiculous to think that the Medieval Warm Period was a regional phenomenon. This warm period lasted for decades, and you want us to believe that the rest of the world remained much cooler for decades. This warm period was not a “flash in a pan”. It lasted for decades. They couldn’t have grown barley in Greenland without an extended warm period.
You can’t cite one real-world example of this regional warming happening.
The world today is at a certain temperature. There is a slight difference between the northern and southern hemispheres, with the northern hemisphere being a little warmer than the southern hemisphere (attributed to sun angle), but we are talking about tenths of a degree here, so the differences are not that much.
But you want us to believe that a region in this world of ours can become noticeably hotter and stay that way for decades while the rest of the world stays cooler.
It’s not logical. Weather and the temperatures travel around the globe taking cold and warm temperatures with them and spreading them all over the world.
To think that one region of the globe experiences radically different weather from other areas for decades is absurd.
You conflate “not globally synchronous” with “regional.” Various parts of the world did experience anomalous warmth over the long stretch of time encompassed by the MWP. The point is that all parts of the world did not experience anomalous warmth concurrently. Therefore the global mean temperature never reached the warmth of the modern area at any point during the MWP.
You say there are studies that say there was no Roman or Medieval Warm Periods globally. This page has numerous references to published peer reviewed studies that refute the assertion that there was no warming or cooling globally.
http://www.co2science.org/subject/d/summaries/rwpdacp.php
LOL.. a Mannian hockey stick, we all know how statistically deprived that was.
And the others are just PAID anti-science to attempt to cover up his malfeaces
It is however a great graph showing the effect of tree and other growth by increased atmospheric CO2.
More pasting of averaged thermometer readings (a major no-no right there) onto proxies, which may or may not be responding to temperature changes at any given time. The Divergence Problem.
Global warming continues apace as punctuated warming, with plateaus between the El Nino events. We aren’t really sure what causes the El Ninos, but they appear to be natural rather than caused by humans.
It should be “concerning” only if it can be demonstrated unequivocally that most of the temperature increase is a direct result of something that humans are doing that can be changed easily. If humans aren’t responsible, or the forcing is anthropogenic but is not amenable to change, then we should focus on adaptation or remediation.
The pattern you describe is a statistical artifact. It is the pattern you get when you add a linear increase to a sinusoidal function:
The underlying warming trend is mostly linear because it is being driven by linear forcing.
Oh look a child-minded fantasy graph !
Now draw a graph of UAH temps versus CO2 and see if you can come up with a sine wave on a line over the last ten years. Use time on the x-axis and y1 put temp and on y2 put CO2 concentration. I’ll bet you can’t show a correlation.
You’re asking for proof that CO2 has driven interannual (unforced) variability in the climate system over a short period – iif you can recognize why this is nonsensical you will have taken a great stride forward in your understanding of the subject of climate.
You are the one who postulated a sine +linear hypothesis, not me.
I simply asked you to show that CO2 concentration vs temperature is related in that fashion. Apparently you can not do so.
The relationship is between CO2 forcing and temperature, and it is quite trivial to show a tight coupling:
But that isn’t the question you asked, you asked me to show such a coupling for a very short time interval, over which unforced natural variability in the climate system dominates. And of course that is nonsensical, because climate forcing does not drive unforced variability. If you can come to understand why your question as posed is nonsensical, I think you will have started down a path of genuine understanding.
I knew exactly what I was asking. You stepped right in it. Too many studies show that temperature precedes CO2 ppm increases. CO2 can not warm the oceans, only the sun can do that.
What you have done is copied a graph probably from Wood for Trees. You didn’t cite the source which is a no-no. This is known as curve fitting that attempts to show a casual relationship. All it shows is a correlation which could be postal rates vs temperature.
Scientists know that to show a casual relationship, one must show the relationship between independent and dependent variables. Since you claim CO2 is causing the forcing, it should be the independent variable and temperature the dependent variable. Try that and see if you get a constant relationship.
See those last few points. Do you find it amazing that natural variation can EXACTLY offset CO2 warming so that a pause exists? If that is true, can natural variation also cause warming of that amount? If you say no, then you will be claiming that natural variation can only cause cooling. I wouldn’t bet on that interpretation.
I do very much recognize that rather than engaging in good faith discussion you are attempting to posit “gotcha” questions to try and trip me up. My claiming that you are acting from ignorance instead of deceitfulness is an attempt to be gracious. The data sources are listed on the graph, which I constructed myself. Please spare the disingenuous proclamations about needing sources – they are there if you actually looked at the information I’m providing.
Modern global warming is not preceding the modern CO2 increase, it is being driven by it. I do not find it amazing that short term internal variation in the climate system is large and can obscure the long term trend on short timescales, that is not remotely surprising to anyone who understands fundamental concepts about the climate. Short term natural variation can both inhibit and enhance CO2 driven long term warming – during La Nina years, the variation detracts from the long term trend, and during El Nino years it enhances it. That is exactly why we have the sinusoidal pattern of peaks and valleys superimposed over the steady long term warming trend.
A poor representation of what the data actually look like, and no explanation for the linear forcing, since the CO2 is a logarithmic forcing.
El Niños are understood by science. They are cyclic, not caused by the greenhouse effect. Cyclic means the temp rise is temporary , caused by internal energy exchanges not external.
In contrast, Man’s addition of Greenhouse gases to the atmosphere are causing heat to be increasingly retained in earths system, and are the cause of the multi decade rise in global temperatures that are currently adding to the effect of el nino, and cause a persistent underlying rise in global temps of 0.18C per decade.
“not caused by the greenhouse effect.”
Thank you..
Yet they provide the ONLY warming in the reliable atmospheric data.
You have just proven beyond a doubt, that CO2 does not cause any warming… well done. 🙂
“causing heat to be increasingly retained in earths system”
And then you follow with a load of anti-science mantra BS, unsupported by any actual science… A mindless conjecture, pertaining to nothing.
Proving yet again, you are a nothing but a mindless, non-science regurgitating parrot.
All incoherent nonsense
To you maybe, not to everyone. Your mumbo jumbo is all over the internet but it is still unproven after 50 years of trying. Thermodynamics involving radiation, conduction, and convection and latent heat is difficult and has not been handled properly.
I’ll ask you to do the same as AlanJ.
Now draw a graph of UAH temps versus CO2 and see if you can come up with something showing a casual connection over the last ten years. Use time on the x-axis and on y1 put temp and on y2 put CO2 concentration. I’ll bet you can’t show a correlation.
“In contrast, Man’s addition of Greenhouse gases to the atmosphere are causing heat to be increasingly retained in earths system,”
How much heat is being retained? Answer: You don’t know.
“and are the cause of the multi decade rise in global temperatures that are currently adding to the effect of el nino,”
You couldn’t prove that if your life depended on doing so.
This is all speculation, assumptions and assertions based on one leg of a cyclical climate pattern, where the climate warms for a few decades and then it cools for a few decades, and then this repeats. You, and climate alarmists are taking a warming phase and doing a lot of speculation about it. Pure speculation, I might add.
In the past, the temperatures have warmed and then they have cooled, but you are expecting that the cooling phase will not kick in this time because of CO2. Time will tell. All this warming could very well be caused by Mother Nature. She has done the same thing in the past, no CO2 required.
That is not the case. There is a rapid decline after the peak temperature, but then the temperatures are flat until the next El Nino.
Just what are those? Are they known well enough to allow us to predict the next El Nino?
Las Vegas, Nevada didn’t get the memo:
https://www.reviewjournal.com/local/weather/its-been-267-days-without-a-100-degree-high-in-las-vegas-2788168/
Las Vegas has been slightly cooler than average of late.
Global warming can’t be happening.
Correct.
Even if you don’t understand why weather events don’t = climates’ profiles.
That was despite the massive heat island effect.
““It hasn’t been this warm since at least 125,000 years ago, which was the previous interglacial,” Paulo Ceppi, a climate scientist at London’s Grantham Institute, told the Washington Post.”
Wait a minute. If it was this hot 125,000 years ago, doesn’t that completely obliterate the premise that temperature rise is man made???
How so?
It was the Neanderthals using “biofuel”.
https://www.wsj.com/articles/prehistoric-site-shows-modern-humans-werent-first-to-change-the-world-11639595870
Everything was fine until Man struck the first match! 😎
Doesnt answer the question.
Because the AGW theory states that the increase in temperatures since 1850 is at an unprecedented and dangerous level. If they’ve just admitted that temperatures were as high or higher 125,000 years ago then they are not unprecented and, since Humans were around then and are still around now, then they weren’t as catastrophic as they are making out. Plus of course that the temperatures today are only achievable because of man-made emissions. It completely undermines their credibility.
There is nothing in “AGW theory” that states the increase in temperatures since 1850 is at a dangerous level, or that the current temperature is unprecedented in the history of the planet.
You forgot the “C” in “AGW theory”. (Again, check out the “Failed Prediction Timeline”.)
Without the “C”, why all the fuss about fossil fuels?
There is no “C”, only in Denierland . Nor can you cite any failed predictions in the scientific literature. There aren’t any.
There are hundreds of failed climate predictions,
Wrong Again: 50 Years of Failed Eco-pocalyptic Predictions – Competitive Enterprise Institute (cei.org)
No failed climate predictions by scientists in there
Sure there is. Anywhere there is a hockey stick on a graph, there is no ending of the growth rate. That can only happen if you deny saturation and/or the logarithmic reduction of CO2’s effects.
You’re making the same mistake Angstrom made. The greenhouse effect doesn’t saturate. The TOA keeps rising.
Again, show a peer reviewed scientific study of measured values that show that. Your insistence for everyone to keep showing references means you need to do the same.
Alright how about IPCC model ensemble predictions of temperature. According to you, those are from scientists. Not one has come true.
ECS ranges have gotten wider not smaller over 50 years.
Tell us again how good the science is.
Got yer battery car yet, tripe-guy?
There’s no “C”?!?
Then why all the fuss about fossil fuels?
Then why build all the pinwheels and solar panels?
Sorry all sometimes the context of a “reply” gets lost amid other other replies.
I’ll add, If there’s no “C”, what is the “existential threat” that justifies all the all this Green Cr@p?
https://wattsupwiththat.com/failed-prediction-timeline/
Current temperature is actually at the COOLER stage of the Holocene..
Barely a degree or so above the coldest period in 10,000 years.
Holocene has been much warmer for most of that period.
You’re not looking at accurate information.
And you aren’t presenting any
The fact you are too brain-washed and scientifically challenged that you can’t see the difference between the politically motivated rhetoric and claptrap of the IPCC, and actual real science, tells us all we need to know about you.
If your last resort is to deny peer reviewed science, you’ve already lost.
You are safe, no clues will ever penetrate your shields.
One thing about the residents of Denierland –they are consistent
One thing about the residents of Denierland –they are consistent
Deniers of what? I have already shown you that the science you rely is broken. In this subject, one side relies on speculation the other on observation. Their evidences do not agree. Guess who will win…..It is you who are the denier, however I’m equally sure that you are incapable of recognizing that fact. You protestations here are similar to what we hear from high school protesters. You won’t make any inroads here unless you come up with empirical evidence. Calls to authority won’t cut it.
You haven’t shown anything — other than your bad science.
”If your last resort is to deny peer reviewed science, you’ve already lost.”
IPPC was recently found to include data from non-peer reviewed.
Eschewing there own paramenters. More…over 50% of peer reviewed papers are unreplicable garbage. Not a claim, a fact.
Your argument is invalidated. Catch up or move on.
On top of which, the IPCC are a bunch of liars.
The Liars changed the IPCC scientist’s report from saying there was no evidence of human involvement in climate change, to saying the exact opposite when the summary for the general public and politicians was written.
The IPCC put out a blantant lie and have never corrected themselves or been held to account.
I think the House of Representatives ought to hold a hearing over this Biggest Lie in Climate Change Science history.
The Western world is wasting TRILLIONS of dollars on this blatant lie about CO2.
That fact you think “peer-review” actually means something is true and correct…
.. shows just how little you know about science.
Are a low-level arts drop-out, perchance ?
You aren’t helping yourself by not showing any references to back up your assertions.
You would fail a high school debate class doing the trolling that you are doing.
It’s easy. Hardly anyone posts references, or references that represent mainstream science.my comments are all supported by the peer reviewed science. If someone makes a legit argument with references, I’ll cite references, so far, no one other than Alan J, Simon, Nick Stokes, or Mosher have done so.
Nick has made no comments on this thread, Warren, and Simon has linked no references
More bullshit from you.
Nice lits of your fellow kooks.
It’s a tag-team match.
Reminds me of the Three Stooges.
See no evil, hear not evil, speak no evil
“””””.my comments are all supported by the peer reviewed science”””””
The ultimate Argument by Authority.
You can safely ignore anything that you refuse to read. It doesn’t exist in your mind.
Once again, an assertion without a citation, which is egregious since you claim that only peer-reviewed publications are to be relied upon.
Occam’s Razor
We can certainly dismiss any claims of “unprecedented.” Maybe, things acted differently 125,000 years ago! 🙂
They never said “unprecedented” without a qualifier, Eg millennia
For my little spot on the globe the high for July 6 was 86*F.
July 5 it was 90*F and July 4 it was 91. So it actually cooled off.
The record high for July 6 was 101*F set in 2012, breaking the previous record of 98*F set in 1881.
Apparently my little spot on the globe is out of this world.
Hottest ever?? The receding glaciers are uncovering the remnants of once-established forests provide more accurate evidence than GIGO computer models.
I once asked a “cultist” how much warmer than now it must have been for trees of that size to have grown where those tree stumps were found.
Poor muppet was clueless. ! (as they all are)
1, satillite data
https://climatereanalyzer.org/clim/t2_daily/
exactly what you guys demand
Proper spelling, grammar and punctuation are the first things we demand.
Yep, when considering global devastation we need to spell things correctly.
We do.
If humanity is on the edge of doom from catastrophic climate change as is being hysterically claimed by your good self et al, surely we can employ doomsters who can at least spell.
“who can at least spell.”
Even if they are Eng-Lit majors and not remotely resembling a scientist.
“when considering global devastation”
Yet you support the wind and solar industry. !
And hate the very gas that gives life to all life on the planet. !
I’d say, if correct, that is excellent proof (if you need more) that co2 has zero to do with the current temperatures. Thanks!
Not enough info to make a prediction.
Thanks for the link.
I looked at that graph.
Let’s assume the temperatures on that graph are not statistical artefacts.
Exactly what is the mechanism which raises and lowers the temperature of the entire planet by 4 degrees every 6 months?
And if your chosen graph really is telling us what happens, may I suggest that a rise in temperature of 3 degrees each century is a minor perturbation in an Earth where the temperature rises and falls by almost 4 degrees each 6 months?
“satillite data”
Yes, 43 years of coverage (1979 to present), during a cyclical upswing. A snapshot in time that is too short to determine much of anything about the climate.
No satellite coverage 125,000 years ago.
This will undoubtedly be one of the alarmist pitches at COP 28. Then it will be followed by the standard exhortations that we’re burning too much fossil fuel, creating too many emissions, not switching to more sustainable lifestyles, ad nauseam. So let’s all pay more taxes and accept new laws and restrictions; otherwise, civilization is doomed. The same old refrain except people stopped listening years ago
When I look at Roy Spencer’s monthly satellite record, I see both 1998 and 2016 as hot years, with June for both years hotter than the recent June for 2023. I doubt that the satellite data is going to show that the month of July will be hotter than the hottest month in 1998 and 2016. So if the claim is true, then for some impossible reason July 6, 2023, has somehow sucked in a lot of heat from a mystery location to make the claim possible and then expelled that heat so that the monthly average is less than those recorded previously.
Conclusion; the claims made are a total falsehood.
Then, with respect, you’re not looking very closely.
June 2016 was only the 5th warmest June in the UAH record (+0.21C); June 2023 was +0.38C, the second warmest.
Conclusion: look closer.
To whoever voted my comment down, and you’re perfectly entitled to do so, may I ask why?
Is anything I said wrong? If so, what?
Thank you.
Sorry TFN.
My laptop has an AI add-on that automatically concludes “bullshit” when it sees “TheFinalNail” anywhere.
Useful add-on I’d say.
“Useful add-on I’d say.”
And totally fact-based. !
To whoever voted my comment down”
You poor, pitiful “victim” !
WAAAAAAAAAAAAAAAAAAAAA! The very fact that you pay attention to that crap says it all.
Compare what will be July 2023 to the hottest months for either 2016 or 1998. Reread for detail.
On a year-to-date basis 2023 is only in 5th place
A warm June after a few much cooler months.. SO WHAT !!
Are you seriously SCARED of 0.38C warmer than some other months?
Perhaps you should move to somewhere that actually does get warm, instead of the tepid dismal place you currently live.
Yep, there are 21 months where the anomaly is greater than 0.38ºC
June 2023 was nothing out of the ordinary.
Maybe “hottest evah” stories no longer deserve much attention at WUWT
Here are the “front page” stories on each of several major daily news sources across the U.S. A word search for “hottest” yielded results at three, but they are side bar stories, or you have to scroll way down the main page to see them. The subjects of the headline stories on each source are given.
WSJ
Evan Gershkovich Captivity
Washington Post
Twitter and Tik Tok
New York Times
Biden Defends Cluster Bomb Sales
Los Angeles Times
Earthquake Safety
San Francisco Chronicle
Mayor Breed Does Not Support Reparations Payments
(and, scrolling way down…)
The planet saw its hottest day ever this week. Here’s why the Bay Area…
BY ANTHONY EDWARDS, JACK LEE
Denver Post
Italian Beef Spots and Taylor Swift Fans Without Tickets
NPR
The World is Officially Free of Chemical Weapons
(and scrolling way down…)
This week has had several days of the hottest temperatures on record
USA Today
North Carolina Beach Houses Threatened
(and side bar story)
Every day since Monday has reached hottest global temp on record
Yes, “hottest ever” articles are still referenced in some of these. But maybe people are getting tired of the drum beat.
I just got back from the grocery store where I was cursing aloud. Inflation and energy costs are lead-off articles at the Bill Parsons Examiner … our circulation has been flagging.
This should be a lot scarier than the “hottest day evah” proclamation by the marxist climastrologers.
According to the corporate media and some here, Ukraine is winning hands down. So why do they need CBs? There are three correct answers to the question.
Thankfully, there is plenty of opposition to this, even within the democrat party.
Don’t misunderstand my position on CBs. I do believe them to be legitimate weapons of war.
CBs took out far more of Sadam’s AAM and AAA sites than HARMs or any type of missile did. They are THE weapon of choice for aggressive Wild Weasles that aim to destroy enemy AA capability rather than to just temporarily suppress it.
They are extremely effective in taking out parked or taxiing aircraft and vehicle and troop concentrations also.
And as for post combat civilian casualties? Those caused by unexploded CB bomblets, cause far fewer deaths and wounds than unrecorded minefields.
Don’t forget that the current leadership in Ukr. was installed after the Obama-Biden 2014 revolution, and Brandon’s family history of soaking up cash from foreign governments.
The pilot dropping a CB has 3 selections for the dispersion pattern of the bomblets. They are extremely effective weapons when used correctly.
It is revealing that the countries that condemn their use are pretty much all of those that have not had their forces involved deeply in a general war for a long time.
Ukraine’s offensive has had slow going, although they are claiming they have taken back territory. The Defense has the advantage over the Offense, and Russia had been preparing their defensive positions for months, and are dug in. One claim this morning was they were dug in at some places 12 miles deep.
Cluster bombs will devastate Russian troops manning these dug-in defenses. They will also clear the mine fields the Russians have laid to prevent the Ukrainians from crossing.
Biden, the Stupid, said yesterday that one reason he agreed to supply cluster munitions is because they are running out of ammunition in Ukraine. Both sides have already fired millions of artillery shells at each other. Russia is also short of ammunition, and are buying their artillery rounds from North Korea. One former American general said this morning that the U.S. usually keeps at least a four-month supply of artillery rounds, and sometimes up to a six-months supply.
I think if the Ukrainians get their cluster munitions, they will allow the Ukrainians to break out into the rear of the Russian defenses, and if that happens, then the Offense has the advantage over the Defense and the Russians are going to be on the run.
They are running out of ammunition and about all they have left are munitions with cluster bombs in them, or so they said.
Isn’t it about time the U.S. started doing something to replenish our weaponry?
When Trump first took office, the Secretary of Defense came to him and told him the U.S. military was “critically short” of ammunition. Thanks to the neglect of Obama and Biden.
Shortages of ammunition seems to be a pattern with the appeaser, Joe Biden.
We need to impeach this man and remove him from office, along with the imbecile, Kamala Harris. They will do a lot more damage to the U.S. between now and 2025. We need to remove them now.
During this same time period that Barry O was stripping out the military, the new Def. Minister began doing the opposite in Russia. The NATO proxy war against Russia is just insane, but the leftist clowns in America have been using “Putin” to paper over their failings for more than a decade. This is just the latest installment.
Bidennomics.
Lots of BS out there.
Responding to a BS claim has its place.
Some will hear (or read) and choose not to swallow the Green Kool-Aid before checking it out.
Here also in Switzerland, one can clearly see the journalistic trend of citing temperatures that are not taken in the shade as it should be, but in full sunlight which can easily add 5-10 degrees C or more to the “real” temperature. One can often see it when “record temps” are cited somewhere. One just goes to google and types in “place” and “weather”. The discrepancies are huge.
The average Global temperature, this minute, is 14.16C – htpps://temperature.global
How did they ever come up with 17C?
What was the Global temperature in the 1800s, how many data points around the world were used to record it and how accurate were these early thermometers?
Here is part of the answer to your questions from Tony Heller.
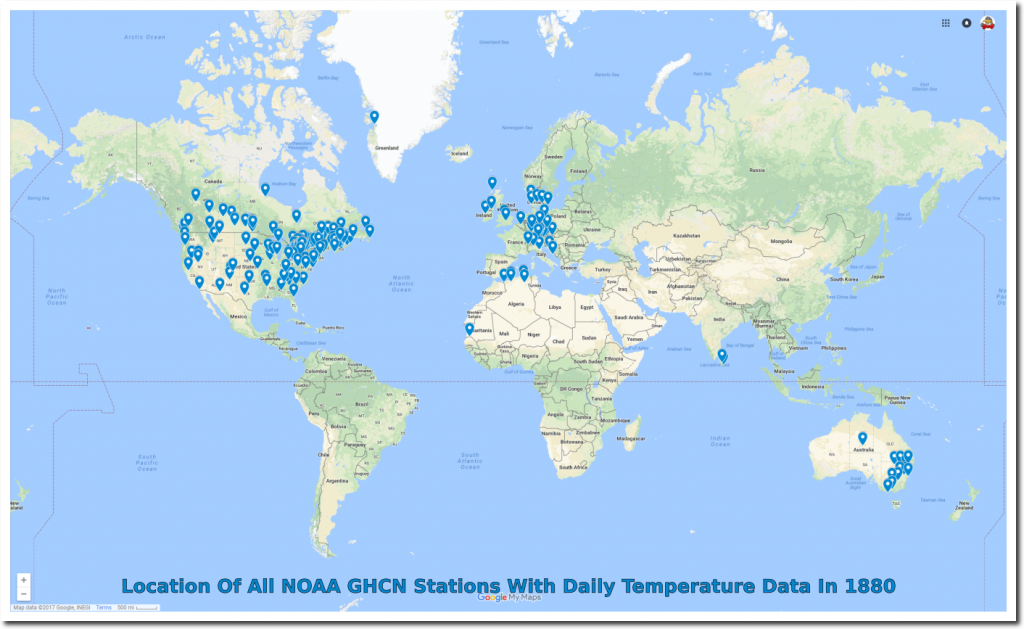
Unambiguous Fraud In The National Climate Assessment | Real Climate Science
Note that above in the comments Warren B. claimed that these same global numbers were known in the Roman period two thousand years ago, and can therefore be compared with modern measurements.
It is an estimated forecast from what is a weather model. NOAA has disavowed it.
““The purpose of the interactive chart and maps on this page is to view daily snapshots of temperature as estimated from the Climate Forecast System.”
Tuesday was the hottest single day on Earth in the history of human civilization, according to a combination of global satellite data and historical tree ring analysis
The link is a Twit that references the NOAA NCEP Climate Forecast System, a “fully coupled model representing the interaction between the Earth’s atmosphere, oceans, land and seaice. It became operational at NCEP in March 2011.”
https://cfs.ncep.noaa.gov/
It should be noted that the NOAA polar satellites cannot scan the entire globe in a single day, so this “forecast” seems dubious.