By Andy May
In May 2023, Clintel published a book (see figure 1) criticizing AR6 (IPCC, 2021), a publication that was supposed to summarize climate science research to date. We found that AR6 was biased in its reporting of recent developments in climate science, and they ignored published research contrary to their narrative that humans have caused all the warming since the Little Ice Age (the so called “preindustrial”), and that recent warming is somehow dangerous. Comments and reviews of the Clintel volume can be seen here and on Judith Curry’s website here.

This post discusses a twitter debate about possible mistakes in the Clintel volume, specifically the Chapter 6 (written by Nicola Scafetta and Fritz Vahrenholt) discussion of the evidence that changes in the Sun affect Earth’s climate. We argue that recent evidence supports a role for the Sun in modern climate change, and the IPCC argues that the Sun has not contributed to recent (since 1750, see AR6, page 959, figure 7.6) warming or recent climate change.
We will see that Theodosios Chatzistergos, who also argues for no contribution from the Sun seems to confuse opinions with facts, and considers opinions different from his own as “mistakes.” This is a common problem with younger scientists, and undoubtably it is a product of poor scientific training in universities today. Opinions, regardless of who holds them, are not facts. Differing opinions, based on the same pool of evidence, are not mistakes, they are just different opinions. It is easy to see how “climate science” has devolved into “climate politics.”
Dr. Judith Curry praised the Clintel volume on twitter, which led to criticism from Dr. Theodosios Chatzistergos. Chatzistergos claims that Scafetta and Vahrenholt’s Chapter 6 had several errors, claims that I discuss in detail below.
Chatzistergos Point 1:
Chatzistergos points out that most TSI (total solar irradiance) composites agree with the IPCC favored PMOD composite and that all TSI composites show a declining trend since the mid-1990s. These points are questionable, because I would argue that RMIB (sometimes abbreviated IRMB) and NOAA composites are similar to ACRIM, see below and here, for more details on comparing the three composites. You can decide for yourself. All the composites are very similar, the differences are quite small and below the uncertainty in the data, see figures 5 and 6 here, and figure 2 below.

Chatzistergos point is that the longer-term trend in solar activity can only be detected during solar cycle minima because solar cycle maxima are highly variable, yet the uncertainty in TSI does not drop enough to detect a possible trend until after 1996, all records more-or-less agree after that time. There are only two fully resolved solar cycle minima after 1996, including the most recent one. Two are not enough to resolve a trend with any confidence. Besides the critical difference in the longer-term trends occurs between 1985 and 1996 when the data during the ACRIM Gap (1989.5-1991.75) are very uncertain due to the trend difference between the Nimbus7 and ERBS data. See Scafetta et al. (2019) for a detailed discussion.
In any case, consensus, that is the majority of the TSI reconstructions, has little to do with science, and if more composites are similar to PMOD than ACRIM, that simply means there are more opinions that PMOD is preferred. This does not mean that the opinions expressed by Scafetta and Vahrenholt in the Clintel volume chapter 6 are mistaken. Nor do these opinions invalidate Connolly, et al., 2021 or Soon, Connoly, and Connolly, 2015. The truth is, the data we have on TSI is so poor prior to 1996, that any of the various TSI reconstructions could be correct, as Chatzistergos himself admits in his 2023 paper, quoted below:
Measurements of total solar irradiance (TSI) exist since 1978, but this is too short compared to climate-relevant time scales. Coming from a number of different instruments, these measurements require a cross-calibration, which is not straightforward, and thus several composite records have been created. All of them suggest a marginally decreasing trend since 1996. Most composites also feature a weak decrease over the entire period of observations, which is also seen in observations of the solar surface magnetic field and is further supported by Ca ii K data. Some inconsistencies, however, remain and overall the magnitude and even the presence of the long-term trend remain uncertain. Emphasis added.
(Chatzistergos, Krivova, & Yeo, 2023)
Chatzistergos Point 2:
Chatzistergos claims that the analysis of the NRLTSI2 (Coddington O. , Lean, Pilewskie, Snow, & Lindholm, 2016) and SATIRE (Krivova, Solanki, & Unruh, 2011) data performed by Nicola Scafetta is incorrect. For my discussion of Scafetta’s paper see here. Since 1996, the trends in all the TSI constructions match, the differences are in the period from 1978 to 1996 where the data is quite poor. Extrapolations of TSI into the past rely on solar models (such as SATIRE). As Scafetta and many others have pointed out, these models are based upon many speculative assumptions that are not consistent with the satellite data, particularly during the critical ACRIM data gap (see figure 3). Chatzistergos offers no evidence that Scafetta’s analysis is incorrect, just his opinion, which is contradicted by the quote above from Chatzistergos’ own 2023 paper.

Figure 3 highlights the critical portion of the early TSI record. Figure 3a shows how the TSI satellite composite appears when the original TSI satellite records published by their original experimental teams are adopted (it looks more like ACRIM); Figure 3b shows how the TSI satellite composite appears when one adopts the TSI satellite modified by PMOD. Both figures were published by Dudok de Wit (Dudok de Wit, Kopp, Fröhlich, & Schöll, 2017) using the same composite methodology. The differences appear tiny, but when extrapolated back to the Little Ice Age Maunder Solar Grand Minimum, they make a big difference in the level of solar activity then versus now. Data does not exist at this time that can determine whether Chatzistergos or Scafetta are correct about the long-term trend in solar activity or how well it correlates with climate changes in the past.
Chatzistergos Point 3:
Chatzistergos claims that the following sentence in our book is incorrect.
“The main difference between the ACRIM and PMOD TSI satellite composites is that while the former uses the original raw satellite TSI records, the latter is based on TSI satellite records modified with a model.”
(Crok & May, 2023, Ch 6)
ACRIM uses the satellite data as interpreted by the respective satellite teams to compute TSI and prefers to bridge the ACRIM-gap using the Nimbus7 record because it is considered more accurate than the ERBS record from an experimental point of view, then the ACRIM team splices the data, as described here, and similar to the RMIB and Dudok de Wit reconstructions illustrated in figures 2 and 3a. One could nitpick, as Chatzistergos does, and claim that Dudok de Wit, the ACRIM team, and the RMIB team used a simple model to splice the satellite data together. But when we consider that the PMOD team changes the Nimbus7 satellite data to conform to their solar models, his nitpicking looks weak. The weak justification for the data changes made by the PMOD team is explained by Douglas Hoyt, the leader of the Nimbus 7 satellite team:
“[The NASA Nimbus7/ERB team] concluded there was no internal evidence in the [Nimbus7/ERB] records to warrant the correction that [PMOD] was proposing. Since the result was a null one, no publication was thought necessary. Thus, Fröhlich’s PMOD TSI composite is not consistent with the internal data or physics of the [Nimbus7/ERB] cavity radiometer.”
(Scafetta and Willson 2014, Appendix A)
One could quibble over the language of the contested statement from our book, but the bottom line is that the ACRIM adjustments can be justified by solid engineering data from the satellite teams, whereas the PMOD adjustments are not consistent with the satellite data according to the satellite teams. Our sentence, while possibly poorly worded, is correct.
Chatzistergos Point 4:
Chatzistergos complains that our book points out that the IPCC has progressively downgraded their estimate of the influence of the Sun, then admits that we are correct, but adds that the IPCC did nothing wrong. That is his opinion, ours is different. He claims again that “we” understand the Sun better today than in the 1980s and now “know” the Sun has little influence on climate change, nearly opposite of what he says in his own 2023 paper as quoted above. The truth is that a considerable amount of evidence exists that the Sun plays a role in recent climate change, but how the Sun accomplishes this is still debated and poorly understood. For a comprehensive discussion see here and here, Scafetta’s recent paper here, or Javier Vinós’ book (Vinós, 2022).
Chatzistergos Point 5&6:
Chatzistergos claims that the statement below, from Chapter 6 of our book, is incorrect:
“[The IPCC] TSI record is a combination of two TSI records (NRLTSI2 and SATIRE) that show a very small secular variability while many other TSI reconstructions show a much larger, up to about 10 times, larger secular variability and also slightly different patterns.”
(Crok & May, 2023, Ch 6)
Then confusingly, writes: “There are indeed many models reconstructing TSI in different ways…” He never explains how the statement from our book is incorrect, it just seems to be his opinion. On the face of it, the statement above is clearly accurate and well written.
Chatzistergos Point 7:
Here he claims that we listed the evidence that the Sun influences the number of cosmic rays that strike the Earth, which affects cloud cover and thus the climate, but that we ignored the evidence against this hypothesis. He did not read very carefully. The following is also from our book:
“During the period 1983-2002 global cloud cover developed synchronously with the eleven-year solar cycle (see Figure 3). After then, however, the relationship broke down, which led to criticism from Svensmark’s scientific opponents.”
(Crok & May, 2023, Ch 6, p 87)
The evidence against the hypothesis is the breakdown in the cloud/cosmic ray correlation during the 1990s, as described in our book, nothing was ignored.
Chatzistergos Point 8:
His opinion is that figure 2 in chapter 6 of our book is cherry picked and that the series shown in the figure are somehow inferior. Our opinion is different, and he does not present any evidence to support his opinion. The correlation between the long-term (century or more) trends in solar activity and the long-term trends in climate is clear and has been recognized by paleoclimatologists for centuries, see here and here. However, a proper explanation or model of the mechanics of the solar influence on climate eludes us.
Chatzistergos Point 9:
His point is that we “mislead with the grand solar maximum of the 20th century by conveniently failing to mention that solar activity peaked during late 50’s…” Here Chatzistergos makes the implicit assumption that solar changes affect climate in some linear and instantaneous way. If that were true, the mechanism would have been discovered long ago. The Modern Solar Maximum lasted from around 1935 to 2005, it was the longest solar maximum in at least 600 years, as described here. Figure 4 shows the Modern Solar Maximum, as reconstructed from sunspot records.

Chatzistergos Point 10:
Chatzistergos’ 10th point is that we mislead when we state that “the increase in solar activity correlates well with the current global warming” referencing Connolly et al 2021. He claims this is incorrect, even though more than 50 paleoclimatologists have written that the solar modulation of climate is obvious in the data and that research should focus on finding out how it occurs, as reported by Vinós and myself here.
Conclusions
Chatzistergos inability to see the difference between opposing opinions and actual mistakes is not surprising given the appalling level of scientific training today and the politicization of climate science. That is why I took the time to write this post defending our book.
His tweets confuse facts with opinions. This is also commonly seen in supposed “fact checks” by Climate Feedback and other organizations of that ilk, as we discuss here. Clearly our universities are not training our young scientists very well, this is a real problem that should be addressed.
Download the bibliography here.
Sorry, you didn’t declare your pronouns.
No idea about Andy, but I’m a teep-hot.
My preferred pronouns are “short” and “stout”.
Alien Confused As Earth Leaders Try To Explain All The Human Genders
There are no human genders. There are two human sexes, as with all mammals. Gender refers to languages, such as German, French, etc, which have genders (behaviors: Masculine, feminine), attached to nouns.
In the above article’s Figure 2 and Figure 3 graphs, I note for the period around 2008 to 2010/2011 the various TSI composites that are plotted have an apparent resolution of <= 0.1 W/m^2 out of ~1361 W/m^2. That equivalent to 1 part in 10,360.
That does not pass a smell test with me.
I challenge anyone to show by rigorous error analysis—say of the high quality presented by Pat Frank in his recent WUWT article The Verdict of Instrument Methods, https://wattsupwiththat.com/2023/06/29/the-verdict-of-instrumental-methods/ —that it is credible to assert such a claimed level of meaningful resolution when all sources of instrumental error and uncertainty, as well as parameter conversions and mathematical/statistical operations in the calculations to derive TSI, are taken into account.
In simpler terms, the resolution of 1 part in 10,360 in calculated TSIs as indicated in the referenced graphs is BOGUS.
ToldYou So,
You have my vote in agreement.
Practical measurement is often inconsistent with expectation.
Hard scientists take the measurement and express it with uncertainty bounds
Geoff S.
Chatstergos wrote “these measurements require a cross-calibration, which is not straightforward, and thus several composite records have been created.”
This old image shows the problem:
The problem is not with cross calibration. The problem is that nobody knows which satellite produces the correct result.
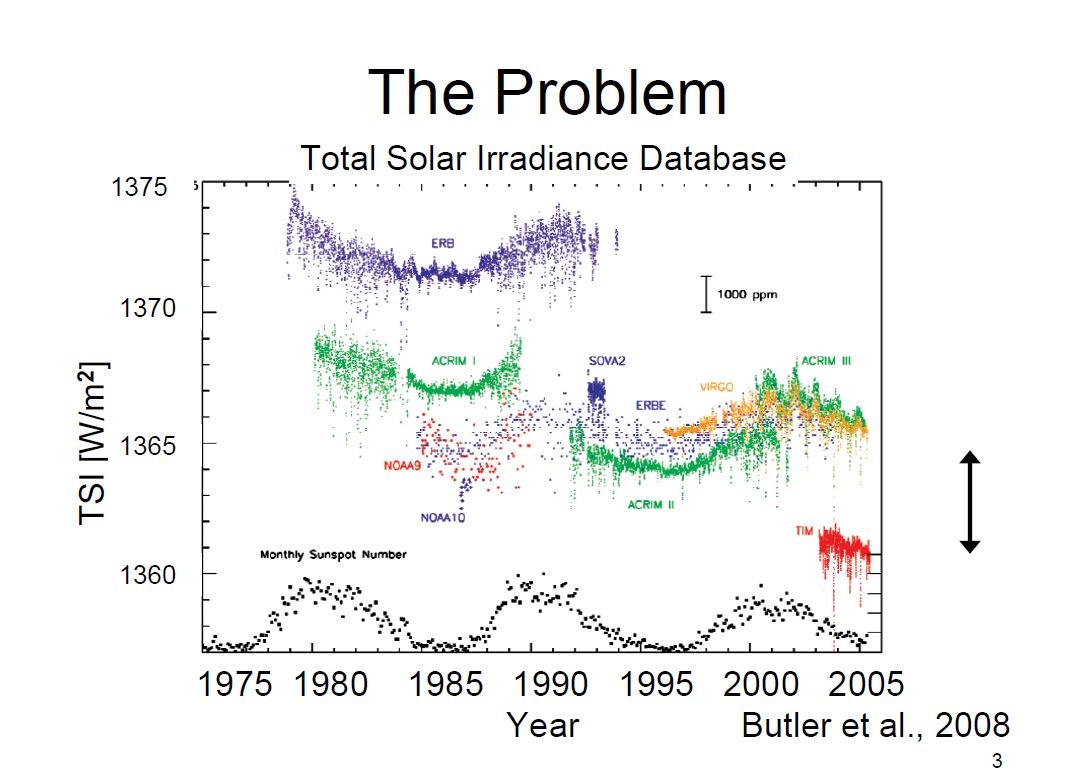
Therefore, all calibrations are guesses.
Quite a significany problem, to seek signals around 0.5 W/m2 from the difference between in and out of about 1360 W/m2
Geoff S
Rather than start by discussing the role of the sun in climate change, the first step should be to show that any change in temperature from CO2 is too small to measure. Next it is necessary to evaluate the contributions from ocean oscillations, urban heat islands, temperature ‘homogenization’ etc. Then, longer term trends such as the Minoan, Roman, Medieval and Modern warmings and the recovery from the Little Ice Age need to be evaluated as solar induced climate change.
Most of this is discussed in the recent book ‘Finding Simplicity in a Complex World – The Role of the Diurnal Temperature Cycle in Climate energy Transfer and Climate Change’ by Roy Clark and Arthur Rörsch. This is available on Amazon (Paperback: B0BZBPV32Q; ebook: B0BY7Y6FYT). A summary and selected abstracts including references relevant to this discussion are available on researchgate. The link is:
https://www.researchgate.net/publication/369559464_FINDING_SIMPLICITY_IN_A_COMPLEX_WORLD_The_Role_of_the_Diurnal_Temperature_Cycle_in_Climate_Energy_Transfer_and_Climate_Change
The basic argument is as follows:
Since the start of the Industrial Revolution about 200 years ago, the atmospheric concentration of CO2 has increased by approximately 140 parts per million (ppm), from 280 to 420 ppm. Radiative transfer calculations show that this has produced a decrease near 2 W m-2 in the longwave IR (LWIR) flux emitted to space at the top of the atmosphere (TOA) within the spectral range of the CO2 emission bands. There has also been a similar increase in the downward LWIR flux from the lower troposphere to the surface. For a ‘CO2 doubling’ from 280 to 560 ppm, the decrease in outgoing longwave radiation (OLR) is estimated to be 3.7 W m-2. At present, the average annual increase in CO2 concentration is near 2.4 ppm. This produces an increase in the downward LWIR flux to the surface of approximately 0.034 W m-2 per year. The issue that has to be addressed is how do these changes in LWIR flux alter the surface temperature of the earth?
The short answer is that thermal engineering calculations of the change in surface temperature using the time dependent flux terms coupled to the surface thermal reservoir show that any CO2 induced change in surface temperature is ‘too small to measure’. The whole concept of radiative forcings, feedbacks and climate sensitivity as discussed in Chapter 7 of the AR6 Working Group 1 Report is pseudoscientific nonsense.
There are five parts to the engineering analysis.
1) The radiative transfer calculation of the change in LWIR flux at the top of the atmosphere (TOA) is incomplete. It has to be extended to include the change in the rate of cooling of the troposphere. When this is done, the maximum change for a ‘CO2 doubling’ is a decrease in the rate of cooling, or a slight warming of +0.08 K per day. At a lapse rate of -6.5 K km-1 an increase in temperature of +0.08 K is produced by a decrease in altitude of about 12 meters. This is equivalent to riding an elevator down four floors.
2) The upward and downward LWIR flux terms are decoupled by molecular line broadening. Almost all of the downward LWIR flux to the surface originates from within the first 2 km layer of the troposphere. Approximately half of this flux originates from the first 100 meter layer above the surface. This means that the small amount of tropospheric heating produced by a ‘greenhouse gas forcing’ is simply re-radiated to space as wideband LWIR emission (there may also be a change in altitude and therefore gravitational potential). THERE IS NO CHANGE TO THE ENERGY BALANCE OF THE EARTH. (The changes in cooling rates in the stratosphere require very small changes in flux because of the low air density).
3) At the surface, the penetration depth of the LWIR flux into the oceans is less than 100 micron (0.004 inches). Here it is fully coupled to the much larger and more variable wind driven evaporation (latent heat flux). Using long term zonal averages, the sensitivity of the latent heat flux to the wind speed within the ±30° latitude bands is at least 15 W m-2/m s-1. The 2 W m-2 increase in downward LWIR flux to the surface from 140 ppm CO2 is dissipated by an increase in wind speed of 13 centimeters per second. The annual increase of 0.034 W m-2 from 2.4 ppm CO2 is dissipated by an increase in wind speed of 2 mm s-1. Any CO2 induced ocean temperature changes are too small to measure.
4) Over land, all of the flux terms are absorbed by a thin surface layer. The surface temperature initially increases after sunrise as the solar flux is absorbed. This establishes a thermal gradient with both the cooler air above and the subsurface ground layers below. The surface-air gradient drives the evapotranspiration and the subsurface gradient conducts heat below the surface during the first part of the day after sunrise. Later in the day, as the surface cools, the subsurface gradient reverses and the stored heat is returned to the surface. As the land and air temperatures equalize in the evening, the convection stops and the surface cools more slowly by net LWIR emission. This convection transition temperature is reset each day by the local weather system passing through. Almost all of the absorbed solar heat is dissipated within the same diurnal cycle. The day to day changes in convection transition temperature are much larger than any temperature change produced by CO2.
5) When the global climate anomaly record, such as the HadCRUT4 data set is evaluated, the dominant term is found to be the Atlantic Multi-decadal Oscillation (AMO). The additional part of the recent warming may be explained as a combination of three factors. First there are urban heat islands related to population growth that were not part of the earlier record. Second, the mix of urban and rural weather stations use to create the global record has changed. Third, there are so called ‘homogenization’ adjustments that have been made to the raw temperature data. These include the ‘infilling’ of missing data and adjustments to correct for ‘bias’ related to changes in weather station location and instrumentation. It has been estimated that half of the warming in the ‘global record’ has been created by such adjustments.
The climate models are based on an invalid correlation between a contrived set of radiative forcings and an equally contrived ‘global average temperature’. Such models have no predictive capabilities over climate time scales because of Lorenz instabilities. The solutions to the large number of coupled non-linear equations is unstable and the errors increase over time. The models are simply ‘tuned’ to match the global average temperature record. Simple inspection of such records reveals the 1940 AMO peak. The IPCC climate fraud then continues by separating the contrived radiative forcings into ‘human’ and ‘natural’ factors. The models are then rerun with just the natural factors and this is used to ‘attribute’ climate change to ‘human’ or ‘anthropogenic’ causes. This is illustrated in Figure 1 using illustrations and data from IPCC AR6 WG1.
A good starting point for any realistic discussion over the influence of the sun on the earth’s climate is the recovery from the Little Ice Age shown in Figure 1g. The energy transfer processes are complex. Most of the change in the solar flux is in the blue/UV spectral regions and this needs to be included in the analysis for both the stratosphere and the ocean coupling.
Figure 1: Understanding the IPCC climate fraud: a) Changes in radiative forcings since 1750, b) simulated temperature increases from 1750 to 2019, based on a), c) time dependence of the radiative forcings and d) time dependence of the temperature changes derived from c), e) ‘tuned’ temperature record using a contrived set of radiative forcings that appear to simulate the global mean temperature record, f) the separation of the contrived forcings to create fraudulent ‘human’ and ‘natural’ temperature records, g) the contributions of the AMO, UHI etc. to the global mean climate record, h) the [pseudoscientific] equilibrium climate sensitivity (ECS) estimated from the CMIP6 models (IPCC AR6, WG1, figures 7.6, 7.7, 2.10, 7.8, 3.4b and FAQ 3.1 Fig. 1, ECS data from Table 7.SM.5).
Interesting comment. I read the summary at the researchgate link. While not criticizing the Clintel work, I do tend to agree with your statement, “Rather than start by discussing the role of the sun in climate change, the first step should be to show that any change in temperature from CO2 is too small to measure.”
One way to show this visually is to watch an animated series of images at relatively high resolution from the GOES East geostationary satellite for Band 16, centered at a wavelength of 13.3 microns, at the edge of the “atmospheric window.” NOAA calls this the “CO2 Longwave IR” band. More here from a comment at WUWT about what it implies, as I see it.
https://wattsupwiththat.com/2022/05/09/climate-models-have-not-exaggerated-global-warming-except-when-they-do/#comment-3513911
An amazing comment, Roy Clark!
Perhaps you can expand this comment into an article for WUWT publishing?
“The IPCC climate fraud then continues by separating the contrived radiative forcings into ‘human’ and ‘natural’ factors.”
From a 2019 Pat Frank article, a comment by gbaikie said it all,
gbaikie was right, as there is no ocean contribution in the IPCC radiative forcing regime.
I call it the Radiative Forcing Fiasco, where the implied CO2 forcing overrules all others.
However when it’s fully understood that atmospheric CO2 is mainly from outgassing, it becomes clear that their supposed GHG forcing reduces to a minimum (their green line).
The key: CO2 is a good proxy for global SST, given their significant solubility relationship.
It is then trivial to find the lower troposphere significantly lags the ocean SST by 2 months.
gbaikie was right, the IPCC has no ocean contribution in their schemes, to our favor!
Below I give more support to my assertion that CO2 is mainly from outgassing:
Let’s take a look at how climate science distorts reality to shoehorn CO2 in as climate driver.
climate.gov has proven itself to be a major source of CO2 disinformation in this world, by making a false statement and then supporting it with their disingenuous graphic.
What’s wrong with this picture? The units don’t match. Hint: 1 ppm equals 7.80432 gigatons.
The US government and climate scientists don’t know how to apply simple high school chemistry to the graphical CO2 information above, thus they created mis/disinformation.
The govt/cli-sci/media expect you to infer, and repeat after them, that the measured atmospheric CO2 increase from Law Dome and Mauna Loa came only from the increase in man-made emissions [MME]. They expect you to see and think the r=.97 correlation between MME and atmospheric CO2 is absolute proof the MME are driving the CO2 increase.
However when the graphic is remade with matching units for the data, a different picture emerges, one where the man-made portion is a much smaller portion of the whole:
In 2021, 1 ppm of man-made CO2 was swamped by 86 ppm of CO2 from other sources (outgassing and land use changes).
All emissions since 1750 do not even approach the amount for any single year!
This means the cherished canard that the ocean is a net CO2 sink is wrong.
The IPCC’s climate science has far more fundamental errors than people realize.
But this still points back to Roy Clark’s comment regarding the necessity of the alarmists proving that CO2 atmospheric volumes are the significant factor in the supposed warming of the atmosphere which I can’t see has ever been demonstrated. They always claim the evidence for this is overwhelming, but they never seem to be able to provide any. And even if they could somehow surpass the first hurdle pertaining to CO2 atmospheric volumes solely, next they have to show how humanity’s miniscule contribution to that is the major finger on the Earth’s thermostat.
Excellent analysis. Of course, since I’ve been proposing many of the same processes for a few years now, it’s easy for me to agree.
The inclusion of the boundary layer (lower 2km) is key. Internal energy transfers within this layer compensate for any increases in downwelling IR at the surface. However, since this same IR increases evaporation at the surface, some of the energy ends up being removed from the boundary layer by convective currents.
What happens is the hydrologic cycle is enhanced leading to more precipitation as well as more clouds and reduced high altitude water vapor. All of these are cooling effects and they are missed by climate models.
It’s good that CO2 also absorbs a little extra energy from the atmospheric window. This counters the direct cooling effect described above.
Roy, I’m surprised that you don’t seem to include in your reasoning the powerful effects arising from the PDO. I agree that the AMO is a significant factor, but I think how its cycle interacts/intersects with the PDO is even more significant. We know the PDO is the dominant factor in the ENSO/LaNino cycles. I believe the PDO’s cycles between warming and cooling every ~30 years, and the AMO does the same every 60 years. I may be wrong and am certainly not scientifically erudite enough to demonstrate what I am asserting, but I do think there is a great deal of evidence of the PDO’s significant role in temperature changes.
I am not surprised by the controversy surrounding the solar chapter of CLINTEL’s report. Solar effects on climate have a 200-year-long history of controversy, and even here at WUWT, it is one of the most controversial issues.
One of the problems has always been people’s assumptions and expectations about how changes in the Sun should affect climate. Even NASA falls for this trap when it says:
They even ignore the assumption they are making that for the Sun to cause warming its activity should increase. That assumption doesn’t need to be correct. If you light a fire under a pot its contents will warm whether you increase the fire or decrease it. Only the rate of warming will be affected. It will warm as long as the amount of heat going into the pot is higher than the amount of heat coming out of the pot.
Above-average solar activity will warm the planet regardless of its trend. The discussion over its recent trend is of little consequence to a solar effect on climate. Sometimes scientists are unable to see the implicit assumptions in their position and this is a problem because the scientific method fails where assumptions are made. It only works under no-assumption conditions. Everything behind an assumption is hidden from the scientific method.
The planet is warming more slowly since 1998 because solar activity is below average. It is not cooling yet because The AMO is still in warm mode, counteracting part of the solar effect. Once the AMO starts changing into cool mode the global average surface temperature will start to decrease. I expect the change in AMO for 2025, but there are signs it might change earlier.
Your points are very good. And, even if the sun didn’t cause the warming out of the LIA, we know it wasn’t CO2. The warming started before CO2 could have had any noticeable effect.
As to the AMO, I’m wondering whether the slow down in Southern Ocean currents might be a signal of the coming AMO phase change. If so, it would appear the change is starting now. It just won’t appear in any AMO index for awhile.
Javier, your points are well made, but I think fall short of the real impediment to determining how changes in TSI (at TOA, of course) might affect Earth’s global temperature. IMHO, the real issue is the net sum of (a) the fraction of TSI actually absorbed by Earth’s atmosphere and surfaces, and (b) the total total power thermally radiated away from Earth’s atmosphere and surfaces, over any defined time interval.
A declining TSI can be associated with either a warming or cooling average global temperature depending on variations of an independent parameter as “simple” as Earth’s albedo. Similarly, an increasing TSI can be associated with either a warming or cooling average global temperature depending on variations of an independent factor, such as albedo, changing the power flux balance as integrated over Earth’s surface.
Given all the complexities and uncertainties of modeling clouds and their reflective/radiative properties—plus the fact that there are NO good paleoclimatology proxies for percentages of global cloud cover thousands of years ago to hundreds of millions of years ago, it is a fool’s errand to try to connect Earth’s current and past temperatures directly to TSI and its variations.
I think we agree that the percentage changes in Earth’s albedo that can be scientifically accepted as reasonable in Earth’s past are much, much larger than the percentage changes in TSI that would be be scientifically accepted as reasonable over the same time period.
“Chatzistergos points out that most TSI (total solar irradiance) composites agree with the IPCC favored PMOD composite and that all TSI composites show a declining trend since the mid-1990s.”
The declining TSI trend is their ‘get out of jail’ card wrt the sun, similar to autocorrelation.
They don’t ask the question I asked myself in 2014 when I started my solar threshold work, “How much solar energy over time is just enough to keep the ocean temperature the same?”
The effect of TSI is better understood as cooling below the threshold and warming above it.
It appears Andy May and Chatzistergos neglected Leif Svalgaard’s work on TSI, because if they hadn’t, they’d know the physical science behind TSI reconstructions has improved.
I put these images together in 2018 of a few TSI reconstructions; the differences are mostly in the magnitudes of the solar maximum peaks which reduces down to the degree of SN-TSI linearity. iirc, the Lean reconstruction is based on SATIRE, but don’t quote me on that.
Please see the upper right inset in the second image. PMOD TSI is compared to sunspot number; it is clear different solar cycles have more or less linearity wrt cycle TSI/SN plots.
“The Modern Solar Maximum lasted from around 1935 to
2005…”The Solar Modern Maximum was from 1935-2004, 70 years; including 2005 is inappropriate.
“Chatzistergos makes the implicit assumption that solar changes affect climate in some linear and instantaneous way.”
This was my first and most basic insight in 2014 into the wrong interpretation of TSI effects.
There is a degree of linearity to the solar forcing after TSI reaches the decadal sun-ocean warming threshold I established in 2014/15. My work with SORCE TSI indicated a 0.5°C change in global SST per watt of TSI change in a calendar year starting in January.
This knowledge enabled an accurate prediction for the SST change in 2015.
The idea of only instantaneous TSI forcing precludes the storage of absorbed solar radiation in the ocean, thereby eliminating the concept of lagging TSI effects, which is completely wrong.
The ocean stores ASR >10x longer that it takes to deliver the solar energy, allowing for ocean heat content to accumulate from solar cycle to solar cycle as long as the amount of solar energy is sufficiently high ie, above the TSI decadal warming threshold.
The overall lack of appreciation for this mechanism has lead atmospheric scientists to wrongly believe the atmosphere controls the climate instead of the sun & ocean together.
Climate modelers don’t know how to judge the physical reliability of their own models.
Air temperature record compilers don’t understand thermometers, instrumental resolution, or measurement error.
I’ve yet to encounter a climatologist who understands physical uncertainty, including among AGW skeptics.
The problem with modern climate science is that there are no scientists in it.
True, only politicians pretending to be scientists.
. . . and even charlatans masquerading as politicians.
(If one is permitted to make such distinction, that is.)
Pat,
I hope you are yet monitoring replies on this page, but I finally had time to read your paper on the past 200 years of global temperature records from the standpoint of metrology, and I have to say it’s a monumental work. I enjoyed reading about and then pondering all the issues you raise, and admire your tenacity.
It is very difficult to reach people about the distinction between error and uncertainty. More education and unwarranted confidence that “I know what I am doing” just makes the effort more difficult.
Best to you.
Thank-you Kevin. I can’t tell you how much your critical support means to me.
I’ll put my faith in Clintels WCD 1500+ signatories and the 33000 signatories of the Oregon petition
“The correlation between the long-term (century or more) trends in solar activity and the long-term trends in climate is clear and has been recognized by paleoclimatologists for centuries”
Paleoclimatology has been in practice for centuries?
Yeah, quite possibly for just around two centuries, depending on how one wants to define “paleoclimatology”.
“The scientific study field of paleoclimatology began to further take shape in the early 19th century, when discoveries about glaciations and natural changes in Earth’s past climate helped to understand the greenhouse effect. It was only in the 20th century that paleoclimatology became a unified scientific field.”
— https://en.wikipedia.org/wiki/Paleoclimatology#
(my bold emphasis added)
I read an interesting little book on the history of diluvial thought in Western science, called “Noah’s Flood: The Genesis Story in Western Thought” by Norman Cohn (Yale U. Press, 1996).
It’s worth noting the response of two men, geologists both, who lived and worked at the cusp between the time when diluvialism was the foundation-stone of geological theory, and when it was abandoned due to conflicts with the evidence.
One was William Buckland who was a brilliant eccentric and Oxford University’s first Professor of Geology in the early 1800’s. Buckland had also taken Holy Orders, and finished his life as Dean of Westminster.
His inaugural lecture at Oxford in 1819 was titled “Vindiciae Geologicae, or the Connexion of Geology with Religion Explained“. It was a complete theory of Flood Geology and the status of the Flood as the “decisive event in earth history”
(p. 116).
In 1823 Buckland published a book the title of which illuminates his thoughts: “Geological Phenomena, Attesting the Actions of an Universal Deluge“.
And yet because no human fossils were ever found in what were taken at the time to be diluvial deposits (deposits reckoned to have been laid down by the Noachian deluge), he eventually abandoned the idea that the Flood involved humans at all. (The diluvial deposits were actually glacial moraines).
In 1836 his last treatise “Geology and Mineralogy Considered with Reference to Natural Theology“, Buckland “quietly disentangled the history of mankind from earth-history. The identification of the six days of creation with periods of geological time was abandoned, and there was no longer any pretense that the Flood could be connected with geology.”
The other man was Adam Sedgwick, who was the Woodwardian Professor of Geology at Cambridge. In 1825 he wrote: “The sacred record tells us, [and] … the investigations of geology tend to prove that the accumulations of alluvial matter have not been going on for many thousands of years; and that they were preceded by a great catastrophe which has left traces of its operation in the diluvial detritus which is spread out over all the strata of the world.” (p. 117)
By 1831, merely 6 years after writing the above, Sedgwick gave his last address as President of the Geological Society. He said this: “Having myself been a believer, and to the best of my power a propagator, of what I now regard as a philosophic heresy … I think it right as one of my last acts before I quit this Chair, thus publicly to read my recantation.
“We ought, indeed, to have paused before we first adopted the diluvian theory and referred all our old superficial gravel to the action of the Mosaic Flood. For of man, and the works of his hands, we have not yet found a single trace among the remnants of a former world entombed in these deposits.” (p. 119)
Both men, though deeply religious, one of whom died an Anglican Bishop, combined personal courage with intellectual integrity and abandoned a theory which, no matter how attractive and personally comforting, did not meet the data.
Thus the origin of paleoclimatology in the early 19th century.
And a perfect lesson illuminating those today lacking that courage and intensity, advocate nonsense while mesmerized by their secular religion.
As you quoted from Adam Sedgwick (1831):
“For of man, and the works of his hands, we have not yet found a single trace among the remnants of a former world entombed in these deposits.”
Wow. What powerful, science-based words!
Thus, perfect for this paraphrase:
“For CO2, and its net effects of warming Earth’s average temperature, we have not yet found conclusive evidence among the remnants of a former world as entangled in paleoclimatology proxies.”