One of the most frightening aspects of global warming, aka “climate change” is the graphs produced from temperature data for public consumption and trumpeted by an unquestioning and compliant media. When it comes to measuring climate, in order to actually see any temperature differences over the last century, they must be highly magnified using the temperature anomaly method.
The most often cited global temperature anomaly graph is from the NASA Goddard Institute of Space Studies (GISS), showing yearly average temperatures since 1880, as seen in Figure 1 below.

To the untrained and uninitiated (i.e. the general public) it looks like Earth’s temperature is on a trajectory for a hot and terrible future.
Sometimes, media outlets such as the daily-doom newspaper known as The Guardian, will take that data and make their own graphs, making them look even steeper and scarier, such their highly statistically amplified graph from their 2019 article as seen in Figure 2.

Written by the ever-alarmed and always unreliable Damian Carrington, it is no wonder some children think they have no future due to “climate change”.
But in the real-world, people don’t experience climate as yearly or monthly temperature anomalies, they experience weather on a day to day basis, where one day may be abnormally warm, and another might be abnormally cold. Sometimes new records are set on such days. This is normal, but such records are often portrayed by the media as being evidence of “climate change” when if fact it is nothing more than natural variations of Earth’s atmosphere and weather systems. In fact, is doubtful humans would even notice the mild warming we’ve had in the last century at all, given that the human body often can’t tell the difference between 57°F and 58°F in any given moment, much less over a long term.
Essentially, what we know as climate change is nothing more than a man-made statistical construct. You can’t go outside and hold an instrument in the air and say “I’m measuring the climate.” Climate is always about averages of temperature over time. It’s a spreadsheet of data where daily high and low temperatures are turned into monthly averages, and monthly averages are turned into yearly averages, and yearly averages are turned into graphs spanning a century.
But, such graphs used in press releases to the media and broadcast to the public don’t really tell the story of the data honestly. They omit a huge amount of background information, such as the fact that in the last 40 years, we’ve had a series of El Niño weather events that have warmed the Earth; for example, 1983, 1998 and in 2016. The two biggest El Niño events are shown coinciding with temperature increases in Figure 3.

These graphs also don’t tell you the fact that much of the global surface temperature measurements are highly polluted with Urban Heat Island (UHI) and local heat-sink related siting effects that bias temperatures upward, such as the wholesale corruption of climate monitoring stations I documented in 2022, where 96% of the stations surveyed don’t even meet published standards for accurate climate observations. In essence – garbage in, garbage out.
But, all that aside, the main issue is how the data is portrayed in the media, such as The Guardian example shown in Figure 2.
To that end, I have prepared a new regular feature on WUWT, that will be on the right sidebar, combined with the long-running monthly temperature graphs from the state of the art (not polluted or corrupted) NOAA operated U. S. Climate Reference Network and the University of Alabama Huntsville (UAH) satellite derived temperature global record.

I’m utilizing the NASA Goddard Institute of Space Studies GISTEMP global dataset. The difference is simply this – I show both the absolute (measured) and the anomaly (statistically magnified) versions of the global temperature. This is accomplished by doing the reverse procedure as outlined in UCAR’s How to Measure Global Average Temperature in Five Easy Steps.
In this calculation, the “normal” temperature of the Earth is assumed to be 57.2°F. and that is simply added to the anomaly temperature reported by NASA GISS to obtain the absolute temperature. The basis of this number comes from NASA GISS itself, from their FAQ page as seen in August 2016 as captured by the Wayback Machine.

Of course GISS removed it from that page as seen today, because they don’t want people doing exactly what I’m doing now – providing the absolute temperature data, in a non-scary graphical presentation, done in the scale of how humans experience Earth’s temperature where they live. For that I’ve chosen a temperature range of -20°F to +120°F, which is representative of winter low temperature near the Arctic Circle and high summer temperature in many populated deserts, such as in the Middle East.


Can you tell which graph visually represents a “climate crisis” and which one doesn’t?
Feel free to check my work – the Excel spreadsheet and the calculations are here:
To create the graphs above in Figures 5 and 6, I used the data from the Excel Sheet imported into the graphing program DPlot.
Note: some typos in this article were fixed and some clarifications added within about 30 minutes of publication. -Anthony
Cue the predictable, inane, and pointless commentary from apologist Nick Stokes, trying aimlessly to defend NASA GISS.
Well, since you asked 🙂 what is the difference here? Seems to me it is the same plot with 57.2 added to the numbers on the y-axis.
Obviously Nick is blind.
Nope. But you can do this to anything. Here is the US national debt:
See? Nothing to worry about.
Nick, I have a degree in economics. We were taught to scale meaningfully. Your posted scale goes from 0 to 500 trillion increments, when the federal debt is now on order of 30 trillion. NOT a meaningful scale.
AW did not pull the same obvious trick you just did.
“We were taught to scale meaningfully.”
Exactly. You were taught to use a scale that was most informative. One that gives the best resolution while still getting all the data on the page. That is what GISS and everyone else does.
The AW trick was to relate it to what we “experience”. But famously, we don’t experience global average temperature. During the last glaciation, the global temperature dropped to about 45F. People have “experienced” much colder than that. But their experience of the glaciation was much more severe than that.
Nick, repeating my comment to Anthony: So, we should use a scale something like the OSHA recommended temperature range for offices in the US:
Kip,
The thing is that humans do not feel the global average temperature. As AW says, you can’t go out and measure it with a thermometer. What counts is what fluctuations signify. And as I said, a glaciation has to be a significant fluctuations, with bad implications for NY real estate. But the average was 45F, easily within our normal experience.
It’s a bit like the doctor finding your temp is 104F, and you say, no worries, it is within the OHSA range.
Nick: Humans don’t feel temperature anomalies of less than 2C either. In fact I defy anyone to determine the temperature, indoors or out, to an accuracy of +/- 3C by how it feels. We need thermometers to be able to tell what the temperature really is.
But we all experience a temperature change of around 10C on a daily basis and most of us experience a range of about 50C over the course of a year. Without a vast network of weather stations and thousands of people recording and processing data we’d have no idea if there was any trend in long term temperatures. We can’t feel it and we can’t observe any affects on the environment that are outside of our sense of normal weather variability. A 1.5 to 2 C warming over a century – please! – not scary to me or anyone else except followers of the Catastrophic Climate Change Cult (CCCC).
This is exactly the position I have reached. I have seen too many local temperature graphs with little to no warming to think that we are truly seeing these kinds of increases worldwide. One only has to read all the headlines that trumpet “so and so place is warming faster than the global average” to recognize the propaganda that global anomalies produce.
My preliminary looks using NIST TN 1900, Example 2 procedure for examining Tmax and Tmin lead me to believe that only local values for these, when done separately, is the only valid way to decide if climate alarmism is correct or not. My guess is that we are having “statistical” trickery being used, willfully or not, to see things that aren’t there.
My guess is that this was originally done by unaware climate scientists that just assumed simple arithmetic averages would show something valid, and then proceeded to average averages over and over and saw what they wanted.
you havent reviewed 40000 local graphs. i have
My guess is that this was originally done by unaware climate scientists that just assumed simple arithmetic averages would show something valid, and then proceeded to average averages over and over and saw what they wanted.
bad guess!!!! you dont even know what an average is
or how to estimate one.
go ahead show your math
In fact I defy anyone to determine the temperature, indoors or out, to an accuracy of +/- 3C by how it feels. We need thermometers to be able to tell what the temperature really is.
i can definately tell the difference between 26 and 27C/
so can plants and animals
animals dont need thrmometrs
https://www.nationalgeographic.com/science/article/climate-change-species-migration-disease
neither do plants
https://www.jstor.org/stable/27856854
Nick ==. I quite agree, the scale must be very pragmatic — have a very specific practical basis. The practical basis for human body core temperature is based on long-term medical study (despite the exact value of “normal” still being controversial) — the range between death from “too low” and death from “too hot” — low is below 80°F (organ systems begining to fail) high is over 108°F…want to use that scale? 28°F?
Office temperature designated by OSHA has a 5°C comfort range — 68°F to 77°F. That’s 11°F. Want to use that range?
The range NOT to use is the auto-scale range of various stats and spreadsheet programs. Such scales have NO pragmatic reality — only a numerical relationship of highes-lowest spread.
“Office temperature designated by OSHA has a 5°C comfort range — 68°F to 77°F. That’s 11°F. Want to use that range?”
That’s 20 – 25°C.
By that logic every year on earth has been well below the minimum acceptable office temperature of 20°C.
Looking through NOAA’s time series for the states, the only location on the mainland of the USA which is habitable by that standard is Florida, which usually has annual mean temperatures above 20°C.
Did you *really* think about this before posting it?
No, it was entirely randomly generated. What part did you disagree with?
Do you wear clothes outside? If you do then why do you do so?
If necessary. The same in an office. Do you have a point?
Florida was made habitable by the air conditioner.
Think again. People lived in Florida long before air-conditioning was ever conceived.
The area was inhabited when Spaniards first arrived, so no AC. I don’t think (aka opinion) FLA would be thickly settled by USA citizens without nearly universal AC. Google search – yes the reference period contains USA’s baby boom generation:
“In 1950, the population here was 2.7 million. By 1960, with some air conditioning, the population increased to 4.9 million.”
AC Market penetration is about 85%, meaning that if you can afford AC in FLA today, then you probably have it. TG seemed to be trying to get to the point that humans can adapt to a wide range of climates by using technology. It seemed to be taking a long time to get there.
The funny thing is Florida’s temp is pretty close to the point where humans can live naked. Probably accounts for all the swimsuits😉
You didn’t answer as to why you wear clothes.
That lies at the base of the whole point.
I find your obsession of what I’m wearing a bit disturbing.
If you have a point, state it. Otherwise I’m just going to assume you are obsessed with he thought of me naked.
Your assumption says more about *you* than it does about me!
You are just avoiding answering because you know what the answer has to be.
Still no idea what point you are trying to make, and if I have to guess you’ll just say I’m missing the point. You’re inability to just say what point you are trying to make, speaks volumes. I suspect if you did just come out with it it would be something completely inane, so much better to rely on these cryptic questions.
Malarky. You know what the point is, you just don’t want to admit it. How many flannel shirts do people living in FL keep in their closet?
Yet you still won’t state your argument. Just keep asking more meaningless questions.
I can only assume your asinine argument is that an ice-age wouldn’t be a bad thing because you can just put on more clothes.
You won’t answer the question. Why?
And if it warms then take clothes off.
Humans survive above the Artic Circle and have for thousands of years. Humans survive in the Middle East and have for thousands of years.
How much wheat do you suppose the Iniut grow?
Because they are stupid questions that have no relevance to the point.
You ask if I wear clothes. I said I usually did.
You ask why I wear clothes. That’s such a trite question it isn’t worth answering. But if you insist I answer it, because people tend to object if I don’t. Because they other some protection. Because they keep me warm on a really cold day. Because they keep me dry when it’s raining. Because I need pockets to keep thing in. Is that enough answers for you, or do you want to discuss the colour of my underwear next?
You ask how many shirts someone living in Florida has. I have no idea. Do you have the statistics? Would you accept an average, or would you complain that, say nobody actually has 2.3 shirt, or whatever?
“And if it warms then take clothes off.”
There’s an obvious limit to how far that will get you. You can’t get more naked than naked.
“Humans survive above the Artic Circle and have for thousands of years.
Humans survive in the Middle East and have for thousands of years.”
Humans survived for thousands of years without electricity.
Humans survived for thousands of years without cars.
Humans survived for thousands of years without antibiotics.
Humans survived for thousands of years without fossil fuels.
“How much wheat do you suppose the Iniut grow?”
Are there 8 billion Inuit?
“You ask why I wear clothes. That’s such a trite question it isn’t worth answering. But if you insist I answer it, because people tend to object if I don’t. Because they other some protection. Because they keep me warm on a really cold day. Because they keep me dry when it’s raining. :”
In other words you ADAPT to your climate. There isn’t any reason for everyone to live in FL because it has an average temp above 20C.
“You ask how many shirts someone living in Florida has.”
That is *not* what I asked. Your reading skills (or lack thereof) are showing again.
“There’s an obvious limit to how far that will get you. You can’t get more naked than naked.”
Your lack of knowledge about the real world is showing again. What do Bedouins wear?
“Are there 8 billion Inuit?”
Red herring. If the Inuit can survive for thousands of years in their climate why couldn’t people in SD do the same?
“In other words you ADAPT to your climate.”
You keep arguing with shadows. I’ve already said people can adapt to their climate. Wearing clothes is a very limited way of doing it.
“There isn’t any reason for everyone to live in FL because it has an average temp above 20C.”
The point I was trying to make is that there is a big difference between average global annual temperatures, or in this case just annual averages, and what may be considered necessary in a dingle point of time.
I assume Texas or New Mexico are considered warm states, yet the annual average temperature is considered too cold for an office. You think that just means everyone in Texas should wrap up warm, rather than consider that you can’t compare the average with everyday expectations.
“That is *not* what I asked. Your reading skills (or lack thereof) are showing again.”
You ask facile questions, then object when I don’t treat them seriously. What you actually asked was
I simplified that to
And you attack me because I omitted the words “flannel” and “closet”. And you wonder why I decline to always answer your dumb questions.
“Your lack of knowledge about the real world is showing again. What do Bedouins wear? ”
I was responding to your, and only your, statement t
Again, I am not responding to your every point as is it was worth a detailed response.
“Red herring. If the Inuit can survive for thousands of years in their climate why couldn’t people in SD do the same?.”
No worries then. Everyone in SD can give up eating bread and survive by hunting seals.
“The point I was trying to make is that there is a big difference between average global annual temperatures, or in this case just annual averages, and what may be considered necessary in a dingle point of time.”
Climate is *NOT* the average, not the annual average, not the monthly average, not even the daily average!
Climate is the *entire* temperature profile. Two different locations with the same monthly and annual average temperature can have different climates.
You think that just means everyone in Texas should wrap up warm, rather than consider that you can’t compare the average with everyday expectations.
So now you are back to being a psychic again? You *know* what I think?
You just proved my entire point. You *can’t* tell daily expectations from the average. The average tells you NOTHING about the variance.
If the average doesn’t tell you anything then what good is it?
“And you attack me because I omitted the words “flannel” and “closet”. And you wonder why I decline to always answer your dumb questions.”
ROFL! Why did you omit the word “flannel”? The question wasn’t dumb, your answer was because you deliberately misquoted me!
“No worries then. Everyone in SD can give up eating bread and survive by hunting seals.”
Yep. Or then can move somewhere else and adapt to that location! Why don’t the Inuit move?
“Climate is *NOT* the average, not the annual average, not the monthly average, not even the daily average!”
Define it how you want. I didn’t say “climate” I said the global average temperature. A change in that of 2°C will have big effects on the planet.
“Two different locations with the same monthly and annual average temperature can have different climates.”
Indeed. As always you keep saying things like this as if it has any relevance to what we were discussing.
“So now you are back to being a psychic again? You *know* what I think?”
Make your fracking mind up. First you refuse to explain what point you are trying to make, insisting I must know what you are getting at. Then when I try to guess at what your argument is, you insist that it’s impossible for me to actually know it.
“You just proved my entire point. You *can’t* tell daily expectations from the average.”
And there you go, winning over another strawman.
“ROFL! Why did you omit the word “flannel”? The question wasn’t dumb, your answer was because you deliberately misquoted me!”
And you are back to assuming I can fathom out what goes on inside your head. I don’t know how many shirts an average person has, let alone what they are made of.
At the risk of being accused of *knowing* what you think again. I’m guessing your point is that “flannel” shirts are considered warm and are so less likely to be warm in a hot part of the world. And that in some way you think this is a telling point with regard to office temperatures, compared with global averages.
“Define it how you want. I didn’t say “climate” I said the global average temperature. A change in that of 2°C will have big effects on the planet.”
How do you know that from the global average temperature? Do you know the variance that goes along with that average? Do you know you know where this is going to come from? The Arctic? Central Africa? Australia? Are some areas going to go up and some go down? Which ones will go up and which ones will go down?
If you don’t know that then how can you judge what the “big effects” will be?
tg: “Two different locations with the same monthly and annual average temperature can have different climates.
“Indeed. As always you keep saying things like this as if it has any relevance to what we were discussing.”
It has *everything* to do with it! Jeeesh!
The average annual temp in Miami is 83F and in Las Vegas it is 80F. Hardly any different in annual average. Yet vastly different climates due to humidity (i.e. to enthalpy as opposed to temperature) and temperature variance.
The average summer high is 89F in Miami. The average summer high in Las Vegas is 104F. The average winter low is 60F in Miami. The average winter low in Las Vegas is 37F. Vastly different variances, 29F for Miami and 67F for Las Vegas. BUT BOTH HAVE ALMOST THE SAME AVERAGE ANNUAL TEMP!
You just epitomize the typical climate alarmist! Belief that 2C increase in the GAT will have big effects yet just dismiss the variance of the temperatures that are combined to calculate that anomaly.
It’s religion. Not science.
“And there you go, winning over another strawman.”
ROFL!! You can’t tell daily expectations from the average monthly or annual average and you consider that to be a strawman argument! And yet you think average annual temperature define the climate! Unfreakingbeliveable.
“And you are back to assuming I can fathom out what goes on inside your head.”
The issue is that you purposefully misquoted me. And you are still doing it!
“I’m guessing your point is that “flannel” shirts are considered warm and are so less likely to be warm in a hot part of the world.”
Have you lived every day of your life in a basement?
“How do you know that from the global average temperature? Do you know the variance that goes along with that average? Do you know you know where this is going to come from? The Arctic? Central Africa? Australia? Are some areas going to go up and some go down? Which ones will go up and which ones will go down?”
I couldn;t say. But I am confident that unless all your ducks fall in just the right places, a drop of 2°C in global annual average temperatures over a period of time will have very big effects.
Things can change even if the average stays the same. The converse is not true.
“I couldn;t say.”
If you knew the variances associated with all the averages used to calculate other averages you *could* say. But you aren’t interested in knowing that, are you?
“But I am confident that unless all your ducks fall in just the right places, a drop of 2°C in global annual average temperatures over a period of time will have very big effects.”
You couldn’t say but you are *sure*. Cognitive dissonance at its finest.
What if the drop only occurs at the equator?
“Things can change even if the average stays the same. The converse is not true.”
But WHAT “things” change? If you only know the average then you have no idea of what things are changing. Meaning you have to guess – a subjective process at best, producing nothing but confirmation bias.
BTW, you are confusing average with median. If you have skewed distributions the average can change while the median stays the same. That’s the problem with using (Tmax+Tmin)/2 as an average – it assumes a Gaussian distribution of temperatures. But in the general case its only a median. But then, EVERYTHING is Gaussian, isn’t it?
“If you knew the variances associated with all the averages used to calculate other averages you *could* say.”
No you couldn’t. Either the variances stay the same across each location or they change as the temperatures change. But in either case that won;t allow you to predict by how much any location changes. Nor will it allow you to predict what other climatic changes happen as a result in the drop in average temperatures.
“You couldn’t say but you are *sure*. Cognitive dissonance at its finest.”
You ignored the clause starting “unless”.
“What if the drop only occurs at the equator?”
Then it will have to be a pretty big drop. If global temperatures fall by 2.5°C, and say 20% of the glob centered on the equator is the only place to change, that means it’s cooled by 12.5°C. With land temperatures probably changing much more.
It’s also very improbable, given that cooling is more likely to affect the higher latitudes. The 1690s were mostly felt in northern Europe and the US, not at the equator.
“If you only know the average then you have no idea of what things are changing.”
That’s my point. You cannot compare a change in average global temperature, with the experience of working in an office. You cannot assume that a 2.5°C drop in global temperature is OK because you could live with a drop of 2.5°C in an office.
“Meaning you have to guess – a subjective process at best, producing nothing but confirmation bias.”
Says someone who guesses that all the cooling might just happen at the equator, so everyone’s OK. The point is, if you don’t know what changes will happen with such a drop, then it should worry you.
“No you couldn’t. Either the variances stay the same across each location or they change as the temperatures change.”
Nope, The variance of the daytime temp is different from the nighttime temp. So they don’t stay the same even at the same location!
“But in either case that won;t allow you to predict by how much any location changes.”
Variance is a measure of the uncertainty of a distribution. The wide the variance the more uncertain the expected value is. So if you know the variance you *can* predict by how much a location will change.
I thought you were a statistician?
“Then it will have to be a pretty big drop.”
How do you KNOW that isn’t the case? The equator is where the most sun insolation occurs. That is where you would expect to see the biggest temperature change.
“It’s also very improbable, given that cooling is more likely to affect the higher latitudes. The 1690s were mostly felt in northern Europe and the US, not at the equator.”
And was that because there was less CO2 in the atmosphere in the higher latitudes?
“You cannot assume that a 2.5°C drop in global temperature is OK because you could live with a drop of 2.5°C in an office.”
Why *can’t* you compare them. Office temps are supposed to be where the survival of the human race is supposed to be.
You can’t say that a 2.5C drop in global temp will be catastrophic because the metric doesn’t allow you to know the inputs to that average!
“Nope, The variance of the daytime temp is different from the nighttime temp.”
I swear sometimes I really think you must be a not very good machine learning chat bot. You just keep repeating things like this regardless of their relevance to the discussion.
“Variance is a measure of the uncertainty of a distribution. The wide the variance the more uncertain the expected value is. So if you know the variance you *can* predict by how much a location will change. ”
What nonsense. How does knowing the variance of temperatures in the current climate at a particular location allow you to predict how much it will change if the global average changes?
“I thought you were a statistician?”
Then you’ve forgotten all the times I’ve pointed out I’m not a statistician.
“How do you KNOW that isn’t the case?”
I don’t. That’s why I used the word “if”.
“You can’t say that a 2.5C drop in global temp will be catastrophic because the metric doesn’t allow you to know the inputs to that average!”
Take it up with everyone who comes on here claiming it will be a disaster if we return to mini ice age conditions. Take it up with Monckton who insists a 1 degree rise in temperature can only be for the good.
“I swear sometimes I really think you must be a not very good machine learning chat bot. You just keep repeating things like this regardless of their relevance to the discussion.”
The variance in average daily temps for Miami and Las Vegas is 89-61F and 104-37F for Las Vegas. Yet the average monthly high temp is almost the same for both.
Only you would think that variance in temperature is not relevant to discussions having to do with climate.
“What nonsense. How does knowing the variance of temperatures in the current climate at a particular location allow you to predict how much it will change if the global average changes?”
Look at the stats for Miami and Las Vegas. The temp variance for Miami is from warm to slightly below warm. For Las Vegas it is from very hot to very cold.
No one is going to notice a 2.5C change in the temperatures at Las Vegas. They *might* notice it in Miami but its doubtful.
Only you would think that variance in temperature tells you nothing about climate change.
“Then you’ve forgotten all the times I’ve pointed out I’m not a statistician.”
You aren’t a physical scientist either. So what are you doing on here pretending to be both? Just being a troll?
Minimum temps going up 2.5C will *not* boil the oceans, it won’t melt ice where the tmax temps are more than that below freezing, and it won’t kill off the food supply.
Yet you can’t tell from the global average temperature what is happening. That’s why the variance associated with the GAT is so important. And it’s why climate science refuses to consider it, it would be so wide no one would worry about the average!
“Only you would think that variance in temperature tells you nothing about climate change.”
Stop twisting.
The question was – if the world cools by 2.5°C, can you predict which parts of the world will be cooling the most, which cooling by the average, which not cooling at all, possibly which will actually warm? I say, knowing the current variance at any location will not allow you to do that. You just spout your usual gibberish.
“Just being a troll?”
Says someone who admitted to lying just to get people to hoist themselves by their own petard.
“Minimum temps going up 2.5C will *not* boil the oceans”
*** STRAW MAN ALERT ***
We were talking about cooling not warming, and nobody – certainly not me – thinks a rise of 2.5°C will “boil oceans”.
” it won’t melt ice where the tmax temps are more than that below freezing, and it won’t kill off the food supply.”
Depends on where the biggest rises are.
Remember, you can’t tell that just by knowing what the average rise is.
“That’s why the variance associated with the GAT is so important. And it’s why climate science refuses to consider it, it would be so wide no one would worry about the average!”
You realize that if the average changes and the variance doesn’t, that the whole range of temperatures will shift? I think you ignore how much has to change to get a small change in the overall average. Even in a single location people notice the difference in a year with a just a few degrees difference in the average.
Your variances are the seasonal variance. Nobody expects a 2.5°C change to mean summers are colder than winters used to be. But it means that on average every day of winter has to be 2.5°C colder, every day of summer 2.5°C colder. Or you have prolonged periods which are much colder than that interspersed with more average temperatures. Either way, you will notice it.
“I say, knowing the current variance at any location will not allow you to do that. You just spout your usual gibberish.”
It’s no wonder you thing the GAT with no associated variance has meaning for climate change!
“We were talking about cooling not warming, and nobody – certainly not me – thinks a rise of 2.5°C will “boil oceans”.”
Does that mean you think a drop of 2.5C will freeze the oceans?
“Depends on where the biggest rises are.”
That’s the whole point! And you are just now figuring that out?
“You realize that if the average changes and the variance doesn’t, that the whole range of temperatures will shift?”
Really? How does the range of temperatures shift without the variance shifting? Variance is based on (X_i – average). If the average changes then the variance changes. If the range of temperatures changes, i.e. X_i values, then the variance changes.
Did you think about this before you posted it?
“Your variances are the seasonal variance.”
My base variance is the DAILY temperatures. Those need to be propagated through the whole process of average -> average -> average in order to get to a GAT average.
“Does that mean you think a drop of 2.5C will freeze the oceans?”
Idiotic question.
“How does the range of temperatures shift without the variance shifting?”
The mean can change, the variance remains the same. You should understands this. You keep going on about Gaussian distributions.
“Variance is based on (X_i – average). If the average changes then the variance changes. If the range of temperatures changes, i.e. X_i values, then the variance changes.”
Seriously? You don’t get this?
If every value in the distribution changes by the same amount, say everything cools by 2°C, then X_i becomes X_i – 2 and the average becomes average – 2. So (X_i – average) becomes (X_i – average).
Of course, it’s entirely possible that the distribution doesn’t change at the same rate, in which case you get a change in the variance, and / or it becomes more or less skewed.
“My base variance is the DAILY temperatures.”
I assume you mean daily temperatures throughout the year. The range you quoted was “The variance in average daily temps for Miami and Las Vegas is 89-61F and 104-37F for Las Vegas.” And I assume you don’t actually mean variance.
“Those need to be propagated through the whole process of average -> average -> average in order to get to a GAT average.”
Why do you want to propagate the variance when taking an average. The temperature on a given day is the temperature on that day. Why would knowing the range of all temperatures during the year change that?
“BTW, you are confusing average with median.”
Not this nonsense again. We went through it all a couple of weeks ago. Have you forgotten already.
“If you have skewed distributions the average can change while the median stays the same.”
Which has nothing to do with anything we’ve been talking about.
“That’s the problem with using (Tmax+Tmin)/2 as an average – it assumes a Gaussian distribution of temperatures.”
It does not assume anything of the sort. The distribution of temperatures during a day is almost never going to Gaussian. Assuming anything like a sine wave means that the distribution will be U-shaped, with most of the temperatures being closer to the max or minimum than the average.
If you want to think of the daily mean temperatures based on the average of max and min, as representing the actual mean temperature, then you would need the distribution to be symmetrical. It does not need to be Gaussian. But for most cases I don’t care if it not the exact mean, it’s just a convenient way of getting a representative daily temperature when that is the only data you have available.
“But in the general case its only a median.”
As I said last time, if the distribution is skewed it’s more likely that (Tmax+Tmin)/2 will be closer to the mean than it will be to the median temperature.
“But then, EVERYTHING is Gaussian, isn’t it?”
I’ve really no idea why you would think that. I’ve given you numerous examples of non-Gaussian distributions, but for some reason you think that all distributions must be Gaussian.
Have you learnt yet what a Gaussian distribution actually is? I remember a little while ago you seemed to think that any symmetric distribution was Gaussian.
“Not this nonsense again. We went through it all a couple of weeks ago. Have you forgotten already.”
Yes, we did. And you still can’t accept that (Tmax+Tmin)/2 is ALWAYS a median value. It is only an average value if you have a Gaussian distribution. Nor can you accept that the median value of a combination of a sine wave distribution and an exponential decay distribution is *NOT* an average, it is a median.
“Which has nothing to do with anything we’ve been talking about.”
Of course it does. *YOU* claimed the average couldn’t change. Now you are trying to ignore you said that.
“It does not assume anything of the sort. The distribution of temperatures during a day is almost never going to Gaussian.”
Then the average is *NEVER* going to be the median.
“Assuming anything like a sine wave means that the distribution will be U-shaped, with most of the temperatures being closer to the max or minimum than the average.”
But the nighttime temperature is an exponential decay where the mean is 1/λ and the median is ln(2)/λ. They are not the same so it is a skewed distribution. When you combine them the average will *NOT* equal the median.
“ But for most cases I don’t care if it not the exact mean, it’s just a convenient way of getting a representative daily temperature when that is the only data you have available.”
We *know* you don’t care if your representation is actually physically realistic or not. You never have!
“when that is the only data you have available.””
We’ve had the data for over 20 years. Why hasn’t climate science changed over to using the more realistic metric of degree-days?
Because tradition? appeal to tradition: Believing something is right just because it’s been done around for a really long time.
Assumes: 1) The old way of thinking was proven correct when introduced, i.e. since the old way of thinking was prevalent, it was necessarily correct, 2)The past justifications for the tradition are still valid at present.
When is climate science going to change? If not now, then when?
“As I said last time, if the distribution is skewed it’s more likely that (Tmax+Tmin)/2 will be closer to the mean than it will be to the median temperature.”
Malarky! The median is *always* the median! (Tmax+Tmin)/2 IS ALWAYS THE MEDIAN. It can’t be closer to the mean.
“but for some reason you think that all distributions must be Gaussian.”
OMG! *I* am the one that has been trying , for at least two years, to educate you on the fact that not all distributions are Gaussian. Multiple single measurements of different things is almost guaranteed to not be Gaussian and, after two years, YOU STILL DON’T BELIEVE THAT!
“And you still can’t accept that (Tmax+Tmin)/2 is ALWAYS a median value.”
I really can’t figure out at this point if you are deliberately lying or suffering from some cognitive decline.
No. I said that (Tmax+Tmin)/2 is the median. When you have just two values the median and the mean are identical. What I can’t understand is why you are so insistent it has to be called the median and not the mean.
“It is only an average value if you have a Gaussian distribution.”
Nonsense squared.
“Nor can you accept that the median value of a combination of a sine wave distribution and an exponential decay distribution is *NOT* an average, it is a median.”
Of course I accept that a median is a median. (It’s semantics whether you consider a median to be a type of average – some sources do others don’t).
But we don’t know what the true median is anymore than we know the true mean when we only have two values. By all means, try to estimate the true mean or median based on a solar model, and then take it up with all those who insist that infilling is always wrong.
“Because tradition?”
Because you want to see what’s been happening over more than 20 years.
And I don’t have to take being called a traditionalist from someone who still uses feet and inches.
“Malarky! The median is *always* the median! ”
And the mean is always the mean. Go on. Demonstrate that the median is yet another word you like to throw about without knowing what it means.
“(Tmax+Tmin)/2 IS ALWAYS THE MEDIAN.”
The MEDIAN of what? It’s trivially the median of the two values, but you seem to want it to have a deeper meaning.
“OMG! *I* am the one that has been trying , for at least two years, to educate you on the fact that not all distributions are Gaussian.”
He he. Someone doesn’t like the taste of their own medicine. Yes. I know you keep trying to “educate me” that not all distributions are Gaussian. For some reason you repeatedly do it no matter how many times I tell you that not all distributions are Gaussian.
“Multiple single measurements of different things is almost guaranteed to not be Gaussian and, after two years, YOU STILL DON’T BELIEVE THAT!”
That depends on what the distribution of the different things you are measuring. Random values from a Gaussian distribution will have a Gaussian distribution. Random values from a uniform distribution will have a uniform distribution.
But none of this matters because there is no requirement that the distribution be Gaussian. That’s just your fantasy.
“Because you want to see what’s been happening over more than 20 years.”
ROFL! So you should never start using the new process. That just insures that you’ll *never* have the benefits of the better method!
Again, “Tradition”, to quote Teyve. Never change is the battle cry.
You didn’t even bother to read about the Appeal to Tradition, did you? “The past justifications for the tradition are still valid at present.”
“And the mean is always the mean. Go on. Demonstrate that the median is yet another word you like to throw about without knowing what it means.”
(Tmax+Tmin)/2 is the median. It never changes even if the daytime and nighttime distributions changes. Therefore it can’t tell you what is going on all by itself. It’s the same with the average. The average *can* change without changing the median. So the average by itself isn’t sufficient to tell what is going on.
You just love arguing blue is green, don’t you? A true troll.
“The MEDIAN of what? It’s trivially the median of the two values, but you seem to want it to have a deeper meaning.”
“The MEDIAN of what? It’s trivially the median of the two values, but you seem to want it to have a deeper meaning.”
*I* am not the one that wants to have a deeper meaning! You haven’t read a single thing I’ve said, have you? Put down the bottle! Why do you think I keep telling you that (Tmax+Tmin)/2 is a median and is a piss-poor way to model the climate profile? You are the one that wants the median to have a deeper meaning so it can be used to model the Global Average Temperature. It should be renamed the GLOBAL MEDIAN TEMPERATURE because it has nothing to do with the “average” temperature.
“ROFL! So you should never start using the new process.”
You can use your new process whenever you want. But if you want to compare current temperatures with those in the 1930s it won’t be much use.
“Again, “Tradition””
Yet every time there’s the slightest change in the methodology people here scream “fraud” and start pointing to 25 year old charts to show the temperatures they prefer.
“(Tmax+Tmin)/2 is the median.”
It is. But the question is why you think it’s not the mean.
“It never changes even if the daytime and nighttime distributions changes.”
Unless that change in the distributions causes the min or max to change.
“The average *can* change without changing the median.”
The average of what? Are you talking about the average of max and min, or the actual daily distribution? I’m sure it’s accidental but you do keep bringing in these ambiguities.
If you mean the average of max and min, you are wrong. The mean and median will always be in lockstep, because they are the same thing. If you mean the “true” daily mean and median, then it’s possible but also the median could change without the mean changing.
“Why do you think I keep telling you that (Tmax+Tmin)/2 is a median”
I don’t know. That’s why I keep asking you to explain yourself. But as usual all I get is patronizing insults and rants.
“no matter how many times I tell you that not all distributions are Gaussian.”
EVERY TIME you assume that all measurement uncertainty cancels you are assuming that all distributions are Gaussian. You keep denying it but you do it EVERY SINGLE TIME.
“That depends on what the distribution of the different things you are measuring.”
See! You are doing it again! Assuming that measurements of different things give you a Gaussian distribution. If you measure one horse out of the multiplicity of horse species you will NOT* get a Gaussian distribution. If you measure the crankshaft journal diameter on a 327 cu. in V8 engine, on a 409 cu. in. V8 engine,a Ford 351 cu in V8, etc. you will *NOT* get a Gaussian distribution. If you measure the diameter of Big Boy, Early Girl, Beefeater, and etc tomatoes you won’t get a Gaussian distribution.
Why do you think the measurements of different things will give you a Gaussian distribution? Even the daily temperature profile is not Gaussian or symmetrical.
“But none of this matters because there is no requirement that the distribution be Gaussian. That’s just your fantasy.”
No, not *MY* fantasy. Taylor, Bevington, and Possolo *all* say that. None of their books, notes, or papers show how to handle measurement uncertainty for a skewed distribution using just the average value of the measurements as a “true value”.
*YOU* are the only one that is adamant about assuming that all measurements of different things is Gaussian and the average is a “true value”.
TG said: “No, not *MY* fantasy. Taylor, Bevington, and Possolo *all* say that.”
Show me where Taylor, Bevington, and Possolo say that a distribution has to be Gaussian for the law of propagation of uncertainty to hold. I expect 3 different links with 3 exact page numbers. Stay focused and stay on topic. Don’t deflect. Don’t divert.
Tim has been busy so I’ll give you an answer. First, you are creating a strawman argument and showing his statement out of context. Here are the pertinent statements.
Neither of these mention the propagation of uncertainty. They are about achieving the true value of a measurand such as the current temperature at a given point at a given time. Not one climate temperature exists that has a distribution of multiple measurements of the same thing with the same device. Not even ASOS provides this.
This from the GUM:
Note here that experimental standard deviation still requires using the same measurand.
From TN 1900:
Lastly. look at the image from Taylor. If “errors”, i.e. are not Gaussian and are skewed, the “error’s will not cancel out and the “true value” will not be an accurate portrayal of the appropriate measurement.
If you want to avoid misunderstandings about your claims, you need to explain what you are talking about better.
Tim’s assertion was that if you assume all measurement uncertainty cancels you are implying all distributions are Gaussian. What do you mean by “all” measurement uncertainties cancel? What distribution are you talking about? The distribution of measurement errors, or the population of things you are measuring?
In neither case is there any requirement for any distribution to be Gaussian in order for some of the uncertainties to cancel when you a etage multiple things, and none of your quotes suggest that. It can be useful to assume a Gaussian for some cases such as hypothesis testing, but that does not mean having non-Gaussian distributions result in errors not cancelling when taking an average.
I do suspect the problem is as simple as not understanding what a Gaussian distribution is. In a past discussion it did seem that Tim though Gaussian just meant symmetrical.
As to your three over long quotes:
The GUM one doesn’t mention Gaussian once
Taylor is only samling that it’s reasonable to assume the result of a measurement based on multiple errors is likely to be Gaussian. It does not require the multiple errors to be Gaussian. Indeed, he’s explicitly assuming they are not Gaussian, either + or – a fixed value.
TN 1900 is the only one that requires the assumption of s Gaussian distribution, and that’s in the context of using s Student-t distribution. This is correct, but again does not mean that a small sample from a non-Gaussian distribution will not have some cancellations. It’s about what shape the sampling distribution will have.
BTW, you might have taken note of this when you were using a Student-t distribution to calculate theuncertainty of the annual temperature, or of the daily average temperature based on max and min values.
You’re full of it. Here is a university discussion on skewed distributions.
web.ma.utexas.edu/users/mks/statmistake
Some remarks from the web site:
“””””But if a distribution is skewed, then the mean is usually not in the middle”””””
“””””A better measure of the center for this distribution would be the median”””””
“””””But many common statistical techniques are not valid for strongly skewed distributions.”””””
“””””Indeed, if you know a distribution is normal, then knowing its mean and standard deviation tells you exactly which normal distribution you have.”””””
“””””For a normal distribution, the standard deviation is a very appropriate measure of variability (or spread) of the distribution.”””””
“””””But for skewed distributions, the standard deviation gives no information on the asymmetry. It is better to use the first and third quartiles4, since these will give some sense of the asymmetry of the distribution.”””””
This site recommends using quartile (five number) regression to better see what is occurring. You have been told this before.
Look, if you end up with a skewed distribution after taking multiple measurements of the same thing, then canceling uncertainty is the least of your problems.
Ultimately, a skewed distribution can not predict a “true value”! If you think otherwise then you need to show references backing up your position.
I have repeatedly shown references for my position. You have shown NONE. Guess you can’t find any!
“You’re full of it.”
I’ll take that as a complement.
“Some remarks from the web site”
Not one of them saying uncertainties don;t cancel if you don’t have a Gaussian distribution. Again non-Gaussian does not mean the distribution is necessarily skewed.
“But if a distribution is skewed, then the mean is usually not in the middle”
That’s pretty much the definition of a skewed distribution.
“Indeed, if you know a distribution is normal, then knowing its mean and standard deviation tells you exactly which normal distribution you have.”
Indeed. That’s why the CLT is so useful.
“But for skewed distributions, the standard deviation gives no information on the asymmetry.”
Very observant, standard deviation is not a measure of skewness.
“I have repeatedly shown references for my position. You have shown NONE. Guess you can’t find any!”
What position? The claim was that a distribution had to be Gaussian for cancellation to occur.
Your response is to point to facts that have zero to do with the requirement that distributions be Gaussian.
You are trying to make a straw man to win an argument. Okay, make some triangular and some uniform and others Gaussian. You must still assume that all errors cancel, EVEN SYSTEMATIC. You still are dancing around the problem.
Find this book and download it.
“Measurement Uncertainty: A Reintroduction”
https://nrc-publications.canada.ca/eng/view/object/?id=1bfd93be-dba3-42ee-b1c8-180dcd3b3c61
I have included a page as an image. The page discusses finding the uncertainty of a simple functional relationship. Since you insist that an average is a functional relationship, let’s find the uncertainty using the info on this page.
Equation definitions —
TmA => monthly average of daily averages.
Tavg_n => daily Tavg_1 … Tavg_n
Tavg_n uses daily averages from Topeka Forbes for January 1953.
Uncertainty of measurements = ±1°F
TmA = (Σ(Tavg_1 + … + Tavg_n)) / n
“n” disappears in the following equation because it is a defined number with no uncertainty just as the book shows for “π”
(u(TmA) / TmA)^2 = (u(Tavg_1) / Tavg_1)^2 + … + (u(Tavg_n) / Tavg_n)^2
u(TmA) = TmA • √(u(Tavg_1) / Tavg_1)^2 + … + (u(Tavg_n) / Tavg_n)^2
u(TmA) = 33.9 • √{(1 / 34)^2 + … + (1 / 44)^2}
u(TmA) = 33.9 • √ 0.039 = ±6.7°F
Topeka Forbes January 1953 Average Temperature is:
33.9 ± 6.7° F
You have been shown example after example and reference after reference. You continuously post without including any references to support your position. The Internet has a plethora of statistics books and university based statistics information. In the future if you do not post a reference to support a claim and assumptions, you will only get a 3 word response — SHOW A REFERENCE.
“You are trying to make a straw man to win an argument.”
Do you understand the meaning of the word? The claim that
I assume all distributions are Gaussian is exactly what Tim has been saying for years. I repeatability suggested he doesn’t understand what Gaussian means, but now I’m accused of making a straw man argument when I point out he’s wrong about Gaussian distributions.
“You must still assume that all errors cancel, EVEN SYSTEMATIC.”
Again, that ambiguity of the word “all”. I keep asking what you mean by all errors cancel, but just get the usual platitudes thrown back.
I absolutely do not believe that systematic errors cancel. That’s the very definition of systematic error. But howeer many times I point this out it get lost in the repeated lie about “Gaussian” distributions.
As I tried to point out to Tim months ago, the issue is not about the shape of the distribution or even if it’s skewed. It’s about what it’s mean is. If you are talking about measurement errors, then if the mean of their distribution is zero, all errors are random and will tend to cancel as the number of measurements increase. If the mean is not zero, then repeated measurements will tend to cancel out towards that mean. Hencve you are left with a systematic error equal to the mean of the distribution.
This is why the continued lies about assuming all distributions are Gaussian are so distracting. A systematic error can occur in a Gaussian distribution, there may be no systematic error in a non-Gaussian or even skewed distribution. The only thing that matters is what the mean of the distribution is.
Show a reference . Your claims need support.
Which claim? I keep showing references, but you just ignore them, or change the subject, or claim I’m cherry-picking, or ignoring assumptions, or the reference can only be used in some exact way.
A reference to my claim that non-Gaussian including skewed distributions will have errors that cancel can be found in just about any reference tot he Central Limit Theorem. E.g.
https://en.wikipedia.org/wiki/Central_limit_theorem
See attached diagram.
Why, why, why do you want to always use the CTL as proof of anything?
1st, read this:
“””””In probability theory, the central limit theorem (CLT) establishes that, in many situations, for identically distributed independent samples, the standardized sample mean tends towards the standard normal distribution even if the original variables themselves are not normally distributed.”””””
See that part that says “identically distributed independent samples”. Are the samples you use INDEPENDENT? Daily Tmax & Tmin are correlated at better than 0.90. They are NOT Independent! Tavg is not an accepted transform to convert from dependent random variables to independent random variables.
Have you plotted all the “samples” to determine if they have identical distribution? I’ll guarantee that there will be differences as the seasons change. Prove me wrong with data.
2nd, you realize that the CTL only deals with estimating the mean, right?
Read this closely from the wiki page.
“””””For large enough n, the distribution of X_bar_n gets arbitrarily close to the normal distribution with mean μ and variance σ^2/n.
What does this tell you?
That you may infer from the CTL statistic of μ that the population mean is also μ.
However, the CTL statistic of “s^2” (σ^2/n) does not infer that the population variance is “s^2. In fact the inference is that the population variance is
σ^2 = “s^2 • n”!
Basically, the CTL is used to obtain statistics that can be used to infer the population descriptors of μ and σ. The population parameters do not change. As “n” increases the variance of the samples gets smaller and smaller. That DOES NOT mean the population variance also gets smaller.
Remember, you need to show independence and Identical distribution using data when trying to show either the LLN or CTL assumptions are met.
Again, the futility of providing references to people who don;t understand what they say, and will just move the goal posts.
“Why, why, why do you want to always use the CTL as proof of anything?”
Your claim was that only Gaussian distributions have errors that cancel. You don’t really define what you mean by that, but insist I provide a reference for my claim that Gaussian has nothing to do with errors cancelling. I say the CLT which specifically says that non-Gaussian distributions will have errors that cancel when you take a sample is a reference to why distributions do not have to be Gaussian to cancel.
So the response is to move the goal posts.
“Are the samples you use INDEPENDENT?”
Yes. My hypothetical samples from a non-Gaussian distribution are INDEPENDENT. Even if they are not, it doesn’t not mean that no cancellation occurs.
“Daily Tmax & Tmin are correlated at better than 0.90. They are NOT Independent!”
That has nothing to do with the claim. I was the one pointing out to you that Tmax and Tmin are not a random sample from the distribution of temperatures during the day, when you were trying to use the CLT to provide ridiculously large uncertainty intervals.
Regardless, the fact that there is a correlation between tmax and tmin is irrelevant if what you are trying to do is find the average of the two.
“Have you plotted all the “samples” to determine if they have identical distribution?”
What samples? If you take a random sample from a fixed population, by definition they are identically distributed, because each has the distribution of the population. Whjat has this to do with whether the distribution is Gaussian or not?
Continued.
“2nd, you realize that the CTL only deals with estimating the mean, right?”
Or the sum. But it’s the mean we are interested in. If you aren’t talking about the mean when you ask about errors cancelling, what are you claiming?
“Read this closely from the wiki page.”
You mean the part I quoted to you?
““””””For large enough n, the distribution of X_bar_n gets arbitrarily close to the normal distribution with mean μ and variance σ^2/n.
What does this tell you?”
It tells me that as sample size increases the sampling distribution of the mean tends to a normal distribution with increasingly small standard deviation. The last part implies that cancellation of errors is occurring.
“That you may infer from the CTL statistic of μ that the population mean is also μ.”
Gibberish. What do you mean by the CLT statistic? The mean of a sample is more likely to be closer to the actual population as sample size increases, but it will never be guaranteed to be equal to the population mean unless the sample size is infinite.
“However, the CTL statistic of “s^2” (σ^2/n) does not infer that the population variance is “s^2.”
Gibberish squared. There is nothing in the CLT that is intended to tell you what the population variance is. The CLT tells you that if you know what the population variance is, or more conveniently the standard deviation, then you can say what the standard deviation / variance of the sample distribution is. If you don’t know the population standard deviation tyou have to infer it from the standard deviation of the sample.
“In fact the inference is that the population variance is
σ^2 = “s^2 • n”!”
Wrong in at least two ways. First s^2 is the variance of the sample, not the SEM^2. Second, you are getting the logic backwards. You start with the standard deviation and work out the SEM.
“Basically, the CTL is used to obtain statistics that can be used to infer the population descriptors of μ and σ.”
You really don’t understand how to use the CLT, do you?
”
“The population parameters do not change.”
Hopefully not.
“As “n” increases the variance of the samples gets smaller and smaller.”
You mean the variance of the sampling distribution. Not the variance of the sample. Sample variance should tend towards population variance.
“That DOES NOT mean the population variance also gets smaller.”
Duh!. You do have this ability to make the most obvious truisms sound like it’s some major revelation. The population is the population. It doesn’t matter what size sample you take of it, it remains unchanged.
“The last part implies that cancellation of errors is occurring.”
It does *NOT* imply that at all! It only means you are approaching the population mean. It says *NOTHING* about the uncertainty of that mean.
Errors do not determine the mean, the mean is determined from the stated values, not the uncertainty values.
If you had *every* member of the population you could calculate the population average without any samples. That does *NOT* imply that the population mean has no uncertainty. The uncertainty of the mean is determined by the propagation of the uncertainties associated with the population members.
The CLT says NOTHING about the uncertainty of the mean – period, exclamation point.
“It does *NOT* imply that at all! It only means you are approaching the population mean. ”
How do you get closer to the population mean without errors cancelling?
The error of any individual value is it’s distance to the population mean. The error of a sample is the distance of the sample mean to the population mean. If a sample of 100 is likely to be closer to the mean than a sample of 10, then that can only be because some of the errors cancelled each other.
“Errors do not determine the mean, the mean is determined from the stated values, not the uncertainty values. ”
You keep confusing things. We can either be talking about random samples from a population, or in your preferred case, random measurement errors around the true value of something. In either case random errors will cancel when you take a sample, whether that’s random samples from a distribution or random measurements of the same thing, or a combination of the two. In either case the CLT applies irrespective of the population / measurement error distribution. Cancellation of errors does not imply a Gaussian distribution.
And around and around and around we go.
Why do you think this is measurement error? It is not by any stretch of the imagination!
Do you not understand that this is a standard deviation interval of the sampling distribution that defines where the true mean may lay? As you increase the samples the interval most assuredly converges on the population mean.
It has nothing to do with decreasing the “measurement error”. I know this has been told to you many times before.
Remember, that
σ_population = σ_sample • √n
You don’t gain anything as to the population mean or the population standard deviation from increasing samples. The measurement uncertainty remains in the measured data, not the sampling distribution.
If this is all you got, you are way overdone!
“And around and around and around we go.”
Yes, because every time I try to explain something, you try to turn the argument around. This whole discussion was about the claim that you could only get cancellation of errors with a Gaussian distribution. You’ve now turned it into a discussion about your lack of understanding about the CLT and just about every thing else.
Just specify what your claim actually is. Define your terms. Stop making stuff up. Otherwise this discussion will keep going round and I’ll remain happy to see you continuing to blow yourselves up with your own petards.
“Why do you think this is measurement error?”
I specifically said we could be talking about either. You never specify which distribution you are talking about or which errors, but it works either with a non Gaussian population, or non-Gaussian measurement errors. The CLT can be used for either.
“Do you not understand that this is a standard deviation interval of the sampling distribution that defines where the true mean may lay?”
Strictly speaking it defines the distribution of the sample average. Remember the probability of the true mean lying within a given interval is either 1 or 0. Unless we are getting Bayesian.
“As you increase the samples the interval most assuredly converges on the population mean.”
As you increase the sample size the interval tends to converge on the population mean.
“It has nothing to do with decreasing the “measurement error”.”
Unless the population is the distribution of all possible measurement errors – i.e. measurement uncertainty.
“I know this has been told to you many times before.”
Only by people who don;t understand what they are talking about.
“Remember, that
σ_population = σ_sample • √n”
What is σ_sample in this upside down equation? It should be the standard error of the mean, but you keep confusing it with the standard deviation of the sample.
“You don’t gain anything as to the population mean or the population standard deviation from increasing samples.”
Again, what do you mean by increasing samples. You keep using this ambiguous language. You get a better, less uncertain, estimate for the population mean by increasing sample size. But you keep confusing this with the concept of having a large number of different samples.
“The measurement uncertainty remains in the measured data, not the sampling distribution.”
But the measurement uncertainty is part of the sampling distribution.
“This whole discussion was about the claim that you could only get cancellation of errors with a Gaussian distribution.”
Can you whine any louder? You’ve already been told that Gaussian is just a substitute for trying to list out all the symmetrical distributions!
And not all symmetrical distributions even meet the criteria for cancellation.
If you are trying to win the argument that there are other symmetrical distributions than Gaussian then YOU WIN! So what?
Exactly what does that have to do with anything?
Uncertainty intervals HAVE NO DISTRIBUTION. Only stated values have distributions. Uncertainty defines an interval in which the true value can lie – PERIOD. There is nothing that says it is more likely that the true value lies closer to the mean! That is assuming that uncertainty is *not* an unknown! That you know the probability associated with each and every possible value in the interval – and you don’t!
Take the uniform distribution such as from rolling a six-sided dice. It is symmetrical around the mean but every value has the same probability. So what is the uncertainty interval? +/- 2.5? Is it more likely that you will get a 3 or 4 than a 6 since the 3 and 4 are closer to the mean? Do the uncertainties cancel?
“Just specify what your claim actually is.”
More whining. Where do I send the tiny violin and crying towels?
“The CLT can be used for either.”
The CLT works for finding the mean of the stated values of a population. It says NOTHING about uncertainty. You *always* circle back around to assuming all measurement uncertainty is SYMMETRICAL and cancels! ALWAYS!
“Remember the probability of the true mean lying within a given interval is either 1 or 0. Unless we are getting Bayesian.”
So what? You simply don’t know what the true value *IS*. Period. That’s why you can never get to 100% accuracy with measurements!
“As you increase the sample size the interval tends to converge on the population mean.”
But that population mean can be as UNCERTAIN AS ALL GET OUT! The population mean is only based on the stated values. If those stated values are inaccurate then the MEAN WILL BE INACCURATE. How close you get to the mean does *NOT* define the uncertainty of the mean!
Once again we find you you circling back to the assumption that all measurement uncertainty cancels and the stated values define the uncertainty of the mean. EVERY SINGLE TIME!
“Unless the population is the distribution of all possible measurement errors – i.e. measurement uncertainty.”
And here we are again! All measurement uncertainty cancels and the stated values become the measurement uncertainty. No matter how many times you deny you make this assumption it just stands out in EVERY THING YOU POST!
“But the measurement uncertainty is part of the sampling distribution.”
NO, it isn’t. How do you find the mean of an unknown? The measurement uncertainty is an INTERVAL. How do you find the mean of multiple intervals? What is the mean of +/- 2.5 and +/- 6?
You can find the direct addition of the intervals – but that isn’t a mean. You can find the root-sum-square of the intervals but that isn’t a mean either.
And here we are again! All measurement uncertainty cancels and the stated values become the measurement uncertainty. No matter how many times you deny you make this assumption it just stands out in EVERY THING YOU POST!
“You’ve already been told that Gaussian is just a substitute for trying to list out all the symmetrical distributions! ”
So all this time you’ve been accusing me of assuming that all distributions were Gaussian, you were lying? Every time I pointed out that I didn’t believe all distributions were Gaussian and you told me I did, you were lying.
Honestly!? How do you hope to be taking seriously if you a) just make up your definitions, and then b) yell at people for not understanding your made up definitions?
I sugested several months ago that the confusion was you didn’t understand what a Gaussian distribution was, and confused it for any symmetrical distribution. Yet you’ve just repeated in the months following that I believe that all distributions are Gaussian.
“How do you get closer to the population mean without errors cancelling?”
Assume you have the ENTIRE POPULATION. An infinite number of measurements of the form “stated value +/- uncertainty”.
What is the mean calculated from? The mean or the uncertainty?
How does calculating the mean of the population using the stated values do *anything* to the uncertainty part of the measurement? The uncertainty part has nothing to do with the mean.
All you have is the mean of the population. The uncertainty of each measurement must *still* be propagated onto the mean in order to find the uncertainty of the mean!
The uncertainty of that mean is *NOT* the average uncertainty!
In fact, do the calculation. If you have an infinite number of measurements then what is the total uncertainty?
u(q) = sqrt[ infinity * u(x)^2]
What is the uncertainty? What is the average uncertainty?
u(q)_avg = sqrt[ infinity * u(x)^2 / infinity^2 ] What in Pete’s name is that?
“The error of any individual value is it’s distance to the population mean.”
How many times does it have to be repeated for you to finally memorize it? Uncertainty is *NOT* error. Even the GUM says this. You have yet to internalize that simple truth and it lies at the heart of you total misunderstanding of what metrology is all about.
You keep on denying it but it shows up in every single thing you post – you assume all measurement uncertainty is random and Gaussian.
I keep telling you that uncertainty doesn’t have a distribution. It is an interval within which the true value can lie. There is *NOTHING* that says the true value is probably closer to the stated value than not UNLESS you assume the uncertainty is Gaussian and random!
It is *only* when you assume that the uncertainty is random, Gaussian, and cancels so that you can use the stated values to determine uncertainty that you can assume that measurements are closer to the true value than not. And even this only applies when you are measuring the same thing multiple times using the same device under conditions of repeatability.
When you are measuring different things one time each there is no “true value”. It’s like trying to combine weight measurements of cats with dogs. What is the “true value” you are going to find? It doesn’t make any sense. It’s like combining weight measurements of cucumbers and pumpkins. Again – it doesn’t make any sense. Combining temperature measurements from different locations with different variances is no different. You are combining different things and trying to find a “true value”. It doesn’t make any sense. And anomalies don’t help! Anomalies carry the same problem as the absolute temperatures – different variances. Winter temps have wider variances than summer temps. So do the anomalies.
It’s what makes the GAT unfit for purpose. You would be better off just assigning a plus sign or minus sign to the daily mid-range value if it is higher or lower than the average. Then at the end of the month just add up all the signs and see if you have more pluses or more minuses. Then go around the globe and add up all the local pluses and minuses and see what you get. Stop with trying to find a GAT out to the hundredths digit. The uncertainty associated with the GAT is so large you simply don’t know what it is.
Excellent.
Anomalies are the addition/subtraction of two random variables. The variances of the monthly average and the baseline average should be ADDED.
Ha! But first, you need to calculate them!
“Find this book and download it.”
Not again. We’ve already been through this example months ago. It doesn’t matter how many times you find books that you think show that measurement uncertainty increases with sample size, it always comes back to you simply not understanding the maths.
““n” disappears in the following equation because it is a defined number with no uncertainty just as the book shows for “π””
And here’s where it happens. “n” does not disappear. It doesn’t matter if you are using the general “partial differential” equations or the rules for division derived from it, you always end up dividing the uncertainty by “n” to get the uncertainty of the average.
π doesn’t disappear from that equation either, clumsy wording not withstanding. π doesn’t appear as a term on the RHS because it’s uncertainty is zero. But it’s there on the LHS, hiding in V. Take π out of the equation for V, and the uncertainty of V would be different.
This is where your misunderstanding leads:
“Topeka Forbes January 1953 Average Temperature is:
33.9 ± 6.7° F”
You are claiming that the uncertainty of the monthly average of January measurements, can somehow be almost 7 times larger than the uncertainty of any individual day. That makes no sense. The only way for the average to have an error of 6.7, is for every day to have an average error of 6.7, but you’ve already said that the uncertainty for an individual day is 1.
You need references.
References for what? Which particular observation did you think you couldn’t work out for yourself?
That V = HπR^2?
That you have to multiply the RHS of the equation by V to get the uncertainty of V?
You provided the reference yourself.
That in general if you divide a quantity by an exact value you have to divide the uncertainty by that value to get the derived uncertainty? I’ve continuously provided the exact formula from Taylor. I’ll attach it again in case you didn’t spot it two comments below.
That you can also derive the same result by using the general equation? See GUM Equation 10.
That it makes no sense for the uncertainty of an average to be 7 times bigger than any individual measurement? Well, I doubt I can find a reference for that as it’s so obvious.
I will only explain this one time where you incorrect. At least you showed a reference that can be discussed. Thank you.
You need to stop cherry picking formulas while not understanding what they mean.
The rule you picked is a special rule used when ONE measurement is used multiple times. Remember, multiplying by a number is basically adding, i.e., if B=3, then δx_total = 3•δx = δx + δx + δx! I don’t think this is really what you want.
C = πd, d = 2r or as in the example in the book, t = (1/200) • T
In other words, THE SAME MEASUREMENT IS USED MULTIPLE TIMES IN A CALCULATION. THEREFORE, THE ERROR IS ALSO ADDITIVE BY THE NUMBER OF TIMES THE MEASUREMENT IS USED.
Lastly, this was shown prior to his use of quadrature. So this is only useful to determine the absolute maximum uncertainty in a functional relationship.
If you had read just a little further in Taylor, you would have seen the exact same formula as used in Possolo/Meija when Taylor begins addressing quadrature.
Now let’s look at an average.
q = x1/n + x2/n + … + xn/n
Now, the fractional uncertainty in “q” => δq/q,
and, the uncertainty x1/n => (δx1/x1) + (δn/n),
and. xn/n => (δxn/xn) + (δn/n),
based upon the rule of products and quotients.
Using the fact that n is a defined number with no uncertainty,
then we see,
(δn/n) = 0/n = 0
Therefore we calculate using the rule of products/quotients in quadrature,
δq/q = sqrt[{δx1/x1 + 0}^2 + … + {δxn/n + 0}^2]
or,
δq = q • sqrt[(δx1/x1)^2 + … + (δxn/xn)^2]
This is the same as Possolo/Meija shows. One must be willing to accept that a defined number has no uncertainty and does not CONTRIBUTE to the total uncertainty, EVER.
Please don’t try to convince me that you can multiply a single value of uncertainty such as ±1° by 1/30 to obtain an overall uncertainty. You first need to multiply ±1 by 30 ( days in a month) and then divide by 30 to get an average. Guess what you will get?
You are wasting your time. I’ve been over this and over this with bellman and he *never* gets it. He truly believes the average uncertainty is the uncertainty of the average. He’ll never believe otherwise. It’s part of the climate alarmists religious dogma. You *can* reduce uncertainty by averaging!
–back to painting–
If you want me to get something – maybe try explaining your case rather than just repeating meaningless lies, such as “He truly believes the average uncertainty is the uncertainty of the average.”
I honestly have no idea why you think that. Take the example of 30 days each with a random measurement of ±1°F. The average uncertainty would be 1 * 30 / 30 = 1. I do not think ±1 would be the uncertainty of the average. I think the uncertainty of the average (assuming independence and no systematic errors) would be 1 / √30, about ±0.18°F. If think the average uncertainty would be the worst case, where all the uncertainty was systematic.
You can complain all you want about not being able to convince me that the true uncertainty of the average should be 1 * √30 = ± 5.5°F. But if all you are going to do is repeat the same lies, like you’ve got them on speed dial, don’t be surprised if you continue to waste your time.
“ I think the uncertainty of the average (assuming independence and no systematic errors) would be 1 / √30, about ±0.18°F.”
NO! That would be the average uncertainty. 0.18 * 30 is the uncertainty of the average = +/- 5.4!
When you divide by n you are finding an average! Plain and simple. It doesn’t matter if you are dividing the total uncertainty by the number of members to get an average uncertainty or if you are dividing the sum of the stated values by n in order to find the average value of the members of the population.
It is why an average is worthless. An average uncertainty means each element has that uncertainty. We know that can’t be true or you would have no cancelation and every element would have the same ±u_c(y).
The other thing that is easy to forget is that what is actually being analyzed by statistics is a frequency distribution and not just absolute values. It is why a Gaussian distribution is important. The mean has the highest frequency of occurrence. A “+1” doesn’t just cancel a “-1” that occurs ten times. Cancelation only occurs if ten “+1” offset ten “-1”. The frequencies are what determines the distribution.
This is why a skewed distribution doesn’t allow cancelation around the mean. A right skewed distribution may have 20 “-1s” but only 7 “+1s”. It may have 15 “-2s” and 4 “+2s”. Heck, the mean may not have the largest number of occurrences! What is the true value in that case?
It is why averaging measurements of different things so impossible to analyze. Take Tavg. Say 80 and 60. If the distributions surrounding each temperature are not Gaussian how in the world could distributions ever offset in each other? Could the frequency of two 79’s offset the frequency of two 59’s? It is why one must assume Gaussian distributions where all uncertainty cancels and you have two temps with no error!
The standard deviation of 80 and 60 is ±14. Why is that? Using the formula for a Gaussian distribution this is what is necessary to have the mean (70) have the highest probability of occuring and still have the two values fall on the Gaussian curve. I know bellman doesn’t believe this but it is true.
What is worse is that Tmax and Tmin have vastly different distributions with vastly different frequencies.
It is one reason why analyzing Tmax and Tmin is necessary.
I’ll see if I can work this out in excel.
“This is why a skewed distribution doesn’t allow cancelation around the mean.”
Except it does. The CLT works with skewed distributions., It’s just a question balance. A skewed distribution might have more values to the left of its mean, but the values on the right will be bigger, and that means any sample will tend to the mean of the distribution. Imagine a distribution with 5 -1’s and just one +5. It’s mean is zero, any random value is 5 times as likely to be a negative than a positive, but when you get a positive it’s 5 times bigger. Collect enough values and the average is likely to be close to 0.
Why do you think the sample distribution and CLT statistics override the statistical parameters of the original distribution.
The CLT is useful to obtain “statistics” that allow inferences to be made about a population. That is all it does. The sample distribution DOES NOT replace the original distributions. Nor does it replace the mean and variance of the population.
Give it up. Tn1900 outlines a procedure that meets all the requirements.
“””””The {Ei} capture three sources of uncertainty: natural variability of temperature from day to day, variability attributable to differences in the time of day when the thermometer was read, and the components of uncertainty associated with the calibration of the thermometer and with reading the scale inscribed on the thermometer.”””””
These are all that is needed to capture the main sources of uncertainty.
“Why do you think the sample distribution and CLT statistics override the statistical parameters of the original distribution.”
Not sure what point you are trying to make. The original distribution remains unchanged, but the sampling distribution is not the same. That doesn’t mean they override the population, they are two different things.
“The CLT is useful to obtain “statistics” that allow inferences to be made about a population.”
The inference being how much confidence you have in the sample mean as representing the population mean.
“That is all it does.”
Yes, but that “all” is fundamental.
“The sample distribution DOES NOT replace the original distributions. Nor does it replace the mean and variance of the population.”
Of course it doesn’t. It doesn’t tie your bootlaces or wipe your nose. We could go on listing all the things the CLT does not do all night. I fail to see the relevance.
Fundamentally the CLT assumptions are not met by the method used to assess an average temperature. Tavg is made up of two correlated numbers from differing distributions. Therefore, any calculations made from them are based on correlated values, that is, they are not independent. They are not from identical distributions, consequently, any calculations based on them can not be considered to be IID.
Read this carefully from the GUM.
2.2.3 The formal definition of the term “uncertainty of measurement” developed for use in this Guide and in
the VIM [6] (VIM:1993, definition 3.9) is as follows:
uncertainty (of measurement)
parameter, associated with the result of a measurement, that characterizes the dispersion of the values that could reasonably be attributed to the measurand
NOTE 1 The parameter may be, for example, a standard deviation (or a given multiple of it), or the half-width of an interval having a stated level of confidence.
NOTE 2 Uncertainty of measurement comprises, in general, many components. Some of these components may be evaluated from the statistical distribution of the results of series of measurements and can be characterized by experimental standard deviations. The other components, which also can be characterized by standard deviations, are evaluated from assumed probability distributions based on experience or other information.
Note 2 above describes perfectly the steps from TN1900 and from examples in Possolo/Meija’s book.
Again, from the GUM
B.2.17
experimental standard deviation
for a series of n measurements of the same measurand, the quantity s(qk) characterizing the dispersion of the results and given by the formula:
s(q_k) = sqrt( Σ(q_i q_bar)^2/ (n-1)
qk being the result of the kth measurement and q being the arithmetic mean of the n results considered
NOTE 1 Considering the series of n values as a sample of a distribution, q is an unbiased estimate of the mean μq, and s2(qk) is an unbiased estimate of the variance σ2, of that distribution.
NOTE 2 The expression s(q_k) / √n is an estimate of the standard deviation of the distribution of q and is called the experimental standard deviation of the mean.
NOTE 3 “Experimental standard deviation of the mean” is sometimes incorrectly called standard error of the mean.
NOTE 4 Adapted from VIM:1993, definition 3.8.
Sections 4.2.2 and 4.2.3 provide the basis for TN1900.
The phrase from 4.2.2, “The individual observations qk differ in value because of random variations in the influence quantities” says it all. “random variations in the influence quanties”. When the measurand is “monthly Tmax”, this fits perfectly, like it or not.
Again, from the GUM:
B.2.10
influence quantity
quantity that is not the measurand but that affects the result of the measurement
EXAMPLE 1 Temperature of a micrometer used to measure length.
EXAMPLE 2 Frequency in the measurement of the amplitude of an alternating electric potential difference.
EXAMPLE 3 Bilirubin concentration in the measurement of haemoglobin concentration in a sample of human blood
plasma.
[VIM:1993, definition 2.7]
Guide Comment: The definition of influence quantity is understood to include values associated with
measurement standards, reference materials, and reference data upon which the result of a measurement may depend, as well as phenomena such as short-term measuring instrument fluctuations and quantities such as ambient temperature, barometric pressure and humidity.
See that phrase, “ambient temperature”! Well guess what Tmax and Tmin are?
“Fundamentally the CLT assumptions are not met by the method used to assess an average temperature.”
Yes, that’s what I was trying to explain when you were trying to estimate the uncertainty. Max and Min are not random samples from the daily distribution of temperatures. The CLT is about random samples. It’s just that simple. The point though is that not being a random sample max and min are a better estimate of the average temperature than two random temperatures would be.
“Tavg is made up of two correlated numbers from differing distributions.”
You want the two variables to be correlated. If they weren’t they would not be an indication of the average. You hope that a hot day will have hotter max and mins than a cold day.
“Note 2 above describes perfectly the steps from TN1900 and from examples in Possolo/Meija’s book.”
Yes. If you can consider a mean as a measurand, and each random variable taken from it a measurement then you can describe it as that. It’s just you were adamant a little while ago that means were not measurands and weren’t subject to measurement theory.
“See that phrase, “ambient temperature”! Well guess what Tmax and Tmin are?”
That’s not how I read it. Tmax isn’t an influence on Tmax, it is the measurement. Ambient temperature is an influence quantity when it influences the measurement – e.g. by changing the length of an object being measured.
Influence quantities on Tmax would be clouds, wind direction, air pressure etc.
“NO! That would be the average uncertainty. ”
How can 0.18 be the average uncertainty when the premise was that each individual uncertainty was 1? If every uncertainty is 1 then by definition the average uncertainty is 1.
I assume you do have a point, it’s just that you can’t express yourself correctly. Just as continually making claims about Gaussian distributions when you actually mean symmetrical ones, I assume “average uncertainty” has some meaning to you that is different to what the words mean. Maybe if you took a deep breath and thought about what you want to say, rather than typing the same identical phrases over and over, we could get somewhere and stop having these unending discussions.
“When you divide by n you are finding an average!”
An average of what?
If you divide a measurement in inches by 12 to get the result in feet, are you averaging the inches? It might be in some literal sense what you are doing, but it’s much easier to think of it as a scaling. That’s really all you are doing when you divide the uncertainty of the sum by the number of elements. The average is 1/nth the size of the sum, so naturally the uncertainty of the average is 1/nth the uncertainty of the sum. You are not in any meaningful sense redistributing the uncertainty of the sum equally amongst all the measurements.
“It doesn’t matter if you are dividing the total uncertainty by the number of members to get an average uncertainty”
And again, that is not what you are doing. It’s the same problem with your choice of language. The total uncertainty is not the same as the uncertainty of the total.
And this is why providing references is pointless when people are so determined to min-understand what they say.
“The rule you picked is a special rule used when ONE measurement is used multiple times.”
It is not. It’s specifically about multiplying one measurement by an exact value. Specific examples given are multiplying the diameter by π, and dividing the height of a stack of papers by the number of sheets. Not about using the same measurement multiple times (though is could be used for that purpose.)
“Remember, multiplying by a number is basically adding, i.e., if B=3, then δx_total = 3•δx = δx + δx + δx! I don’t think this is really what you want.”
Not if you’ve progressed beyond junior school maths. Multiply by π is not adding 3.14… times, multiplying by 1/200 is not adding 1/200th time.
“Lastly, this was shown prior to his use of quadrature.”
Indeed, but as Taylor notes, it’s irrelevant in this case. Irrelevant because you are only adding zero to a term. √(x^2 + 0^2) = √(x^2) = x.
“If you had read just a little further in Taylor, you would have seen the exact same formula as used in Possolo/Meija when Taylor begins addressing quadrature.”
That is not the formula being used in Possolo is equation 10 from the GUM. You can derive all the rules used here from it – but as we’ve seen before that assumes you understand the calculus.
“Now let’s look at an average.”
“Therefore we calculate using the rule of products/quotients in quadrature,
δq/q = sqrt[{δx1/x1 + 0}^2 + … + {δxn/n + 0}^2]”
No, no no. You are making the same mistake Tim made. Mixing up adding and division. You equation would be correct if you were multiplying all the terms rather than adding them.
There are two different rules for propagating uncertainty. One using absolute uncertainties, the other relative uncertainties. You have to do each separately and convert as appropriate.
Work out the uncertainty of the sum using the rule for addition, then work out the uncertainty of that sum divided by n using the rules for division (or just use the special rule). Finally convert the relative uncertainty back into an absolute uncertainty.
It’s not difficult, and it’s painful to watch you two tie yourselves in knots trying to avoid the simple result that uncertainty of random errors will decrease with sample size not increase. You can approach it multiple ways and you always get the same result, whether you use these rules, or Equation 10, or the Central Limit Theorem. Even Kip Hansen explained why you have to divide the uncertainty of the sum by the number of elements when taking an average.
“δq = q • sqrt[(δx1/x1)^2 + … + (δxn/xn)^2]
This is the same as Possolo/Meija shows.”
The example you quoted from Possolo is not the uncertainty of an average, it’s the uncertainty of the volume of a cylinder. There is no addition, just multiplication.
Really, you can;t work these things out just by looking at something you think might be similar. Look at the actual equations. Apply them correctly. You will get the same result.
“One must be willing to accept that a defined number has no uncertainty and does not CONTRIBUTE to the total uncertainty, EVER.”
Then explain why the defined number appears in the Taylor special case.
“Please don’t try to convince me that you can multiply a single value of uncertainty such as ±1° by 1/30 to obtain an overall uncertainty.”
I won’t. You are completely un-convinceable. You have to be prepared to accept the possibility you might be wrong in order to learn anything.
“You first need to multiply ±1 by 30 ( days in a month) and then divide by 30 to get an average. Guess what you will get?”
You get ±1. A lot less than the ±6.7 you were claiming. But you are now ignoring the rules of Quadrature, just as Kip does. ±1 is what you get if your measurement errors are completely dependent, say if as at the start of your comment you are only making one measurement and adding it together 30 times, or if all your errors were caused by a systematic error.
If there is some random uncertainty in the daily measurements, the uncertainty of the exact average of the 30 days will be less, due to random cancellation.
“It is not. It’s specifically about multiplying one measurement by an exact value”
After two years you *STILL* don’t get it.
On Page 78 under “Principal Definitions and Equations of Chapter 3”
Measured quantity time an exact number:
If B is known exactly and q = Bx
then
ẟq = |B|ẟx
ore equivalently ẟq/q = ẟx/x
The relative uncertainty for x is *NOT* (1/B)(ẟx/x), it is just ẟx/x
The relative uncertainties for q and x are the same. B doesn’t factor into the uncertainty at all.
Taylor even says that on Page 54 – “Because ẟB = 0, this implies that
ẟq/q = ^x/x.
We’ve been over this and over this ad infinitum.
The relative uncertainty of an average is just like Taylor says:
ẟq_avg/q_avg = ẟx/x NOT (1/n)(ẟx/x)
When you want to know ẟq_avg the ẟq_avg = (q_avg) * (ẟx/x)
THIS IS THE AVERAGE UNCERTAINTY. It is *NOT* the uncertainty of the average.
When will you learn this?
“After two years you *STILL* don’t get it. ”
Get what? That you’re an idiot or a troll, or probably both? I think I get that. I don’t point out your mistakes because I think you will suddenly realize you are wrong – I know that will never happen. I do it for my own interest, and in the hope that someone reading these comments won’t be fooled.
“Measured quantity time an exact number”
Which is exactly what I said. It does not mean it only applies to adding the same measurement multiple times, as Jim was saying. It means multiplying a measurement by an exact value. The clue is in the heading.
“The relative uncertainty for x is *NOT* (1/B)(ẟx/x), it is just ẟx/x”
How observant of you.
“The relative uncertainties for q and x are the same.”
Again, well observed. It’s almost as if it’s correct that
ẟq/q = ẟx/x.
Now all you have to do is figure out the consequence of the two being in the same proportion.
“B doesn’t factor into the uncertainty at all.”
Unless, I know this might seem crazy, but hear me out, what if q = Bx? What do you think the consequence for ẟq is if q is B times bigger than x, but has to be in the same ratio to q as ẟx is to x?
“We’ve been over this and over this ad infinitum.”
Yet you still fail to see the evidence of your own eyes, even when Taylor spells it out for you in the special case. You even typed it yourself
ẟq = |B|ẟx
Yet you still insist that B doesn’t factor into the uncertainty of q.
“When you want to know ẟq_avg the ẟq_avg = (q_avg) * (ẟx/x)”
And what is q_avg equal to? Knowing that, can you simplify the RHS so it includes B?
“THIS IS THE AVERAGE UNCERTAINTY.”
It’s the “average” of ẟx, ẟx is the uncertainty of the sum. The uncertainty of the sum is not the sum of the uncertainties. Hence you are wrong.
“It is *NOT* the uncertainty of the average. “
Did you mean to type that, especially in bold? You are saying ẟq_avg, is not the uncertainty of the average? Then what do you think q_avg is? You said ẟq_avg/q_avg is the relative uncertainty of the average. That would imply q_avg is the average, and ẟq_avg is the absolute uncertainty of the average. But now you insist is *NOT* that.
“When will you learn this?”
You realise there’s a logical flaw whenever you say this. If what you are saying is wrong then why would I want to learn it?
“Unless, I know this might seem crazy, but hear me out, what if q = Bx? What do you think the consequence for ẟq is if q is B times bigger than x, but has to be in the same ratio to q as ẟx is to x?”
You didn’t even bother to go look at Taylor, did you? Go look at Page 78. I gave you exactly what it says.
FOR q = Bx the uncertainty is ”
—————————————-
ẟq = |B|ẟx
or equivalently ẟq/q = ẟx/x
—————————————-
Again, for the umpteenth time:
If you have 100 sheets of paper where the undertainty of each sheet is ẟx, the total uncertainty of the stack is |B|ẟx.
That is ẟsheet1 + ẟsheet2 + … + ẟsheetB
It is a sum of all of the uncertainties.
It is *NOT* ẟsheet1/n + ẟsheet2/n + … + ẟsheetB/n
This equation is [ẟsheet1 + ẟsheet2 + … + ẟsheetB] /n
That is the AVERAGE UNCERTAINTY, not the uncertainty of the average.
You keep quoting exactly what I’m saying and then claiming I’m not reading it.
“If you have 100 sheets of paper where the undertainty of each sheet is ẟx, the total uncertainty of the stack is |B|ẟx.”
Correct, but only if you are just going to measure one sheet and multiply that measured value by 100 to get the height of the stack of 100 sheets. Why on earth you would do that I don’t know.
The better option is the one Taylor describes. Measure the stack of 100 sheets and then divide the height by 100 to get the thickness of a single sheet, then divide the uncertainty of the measurement of the stack by 100 to get the uncertainty of your calculation for the thickness of a single sheet. That’s what Taylor describes, but for some reason you can’t accept it as you only think multiplying is the same as repeated addition.
“That is ẟsheet1 + ẟsheet2 + … + ẟsheetB”
But that’s only true if you make just one measurement and add it to itself 100 times. Or multiply by 100. If you measure each sheet separately then you have 100 independent measurements and you can add the uncertainties in quadrature.
“This equation is [ẟsheet1 + ẟsheet2 + … + ẟsheetB] /n
That is the AVERAGE UNCERTAINTY, not the uncertainty of the average.”
Yes, that would be the average uncertainty. But that’s not the case if you add in quadrature.
You can’t have it both ways. You can keep saying I believe that errors cancel, and at the same time claim I always want to find the average uncertainty. If errors don’t cancel (i.e. they are all dependent) then the average uncertainty is the uncertainty of the average. If they do cancel the uncertainty of the average will be less than the average uncertainty.
“Correct, but only if you are just going to measure one sheet and multiply that measured value by 100 to get the height of the stack of 100 sheets. Why on earth you would do that I don’t know.”
Are you physically incapable of reading? Taylor’s whole example was about measuring the entire stack and then dividing by 100 to find each individual uncertainty. NO AVERAGING. My guess is that you can’t even state off the top of your head the the assumptions Taylor specifically states in the example!
It just gets more and more obvious over the past two years that you simply can’t relate to the physical real world in any way, shape, or form. Suppose you have a pallet of cement bricks you are gong to stack to form a retaining wall. Are you going to stack them all up and try to measure the whole stack? Or are you going to measure 1 brick and multiply by the number of bricks? What is the total uncertainty you would expect to obtain from measuring just one and multiplying?
“The better option is the one Taylor describes. Measure the stack of 100 sheets and then divide the height by 100 to get the thickness of a single sheet, then divide the uncertainty of the measurement of the stack by 100 to get the uncertainty of your calculation for the thickness of a single sheet. “
See above! What if you have bricks instead of paper? Do you *ever* try to relate anything to the real world?
“But that’s only true if you make just one measurement and add it to itself 100 times. Or multiply by 100. If you measure each sheet separately then you have 100 independent measurements and you can add the uncertainties in quadrature.”
What if you have a stack of bricks? A stack of antenna mast sections? Can you relate in any way, shape, or form to these real world examples? Can you even imagine why you would want to know the uncertainty of each?
“Yes, that would be the average uncertainty. But that’s not the case if you add in quadrature.”
Your poor math skills are showing again!
sqrt[ u(x1)^2/n^2 + u(x2)^2/n^2 + …. + u(xn)^2/n^2] =
sqrt{ [u(x1)^2 + u(x2)^2 + … + u(xn)^2] /n2 } =
(1/n) * sqrt[ u(x1)^2 + u(x2)^2 + … + u(xn)^2]
You are *still* finding an average! It just depends if you are adding the uncertainties directly or in quadrature as to the form the average takes.
(RSS/n) is an average! It assigns the exact same uncertainty to each individual element regardless of what the actual uncertainty of the element is.
(Sum/n) is an average! It assigns the exact same uncertainty to each individual element regardless of what the actual uncertainty of the element is.
You are finding an AVERAGE UNCERTAINTY in each case! The issue is that the average uncertainty is *NOT* the uncertainty of the average, especially when you are measuring multiple things one time each using different measuring devices.
Write this out 1000 times: Average uncertainty is not the uncertainty of the average. It probably still won’t sink in but at least you will have tried.
[hint: in the equation (RSS/n) exactly what does RSS describe?]
“Are you physically incapable of reading? Taylor’s whole example was about measuring the entire stack and then dividing by 100 to find each individual uncertainty.”
I was replying to Jim’s example.
Your bad faith quoting what I said out of context is very tedious.
And I said nothing about averaging in that example. It’s just an illustration of why, if you divide a measurement by an exact value you also divide the uncertainty by that exact value.
“Your bad faith quoting what I said out of context is very tedious.”
More whining!
You are saying that B can’t equal (1/n) as in finding an average?
Dividing a measurement, I.E. A STATED VALUE, is *NOT* the same thing as dividing the uncertainty by that same value.
Again, you are trying to reduce uncertainty by finding an average uncertainty value. You can’t reduce uncertainty by averaging. Average uncertainty is *NOT* the uncertainty of the average!
If I use 10 boards, all of different lengths and measured using different tape measures, to build a beam spanning a basement, my uncertainty in how long that beam will actually be is *NOT* the average uncertainty. It is the total uncertainty as determined by direct addition or RSS of *all* the uncertainties of the boards.
Why is this so hard for you to understand?
“More whining!”
Welcome to Gorman-speak, where Gaussian distributions don;t have to be Gaussian, where a sum is the same as an average, and where pointing out when you’ve been lied about is whining.
“You are saying that B can’t equal (1/n) as in finding an average?”
Nope, I’m saying the exact opposite. That B can be 1/n, or any exact number.
“Dividing a measurement, I.E. A STATED VALUE, is *NOT* the same thing as dividing the uncertainty by that same value. ”
Indeed it’s not. You do however want to divide the uncertainty by the same value as you divide the measurement to get the correct uncertainty.
“Again, you are trying to reduce uncertainty by finding an average uncertainty value.”
Get another lie, this one has become threadbare.
“If I use 10 boards, all of different lengths and measured using different tape measures, to build a beam spanning a basement, my uncertainty in how long that beam will actually be is *NOT* the average uncertainty.”
You are not averaging anything there. You don;t want to know the uncertainty of the average, you want to know the uncertainty of the sum. The fact even after all these years you still can’t tell the difference is why I tend to get a little irked when you insist on denigrating my “real world” skills.
“Why is this so hard for you to understand?”
The hard part is why you think this has any relevance to the discussion.
You are a troll. You will get no more from me unless it deals with discussing TN1900.
“Welcome to Gorman-speak, where Gaussian distributions don;t have to be Gaussian, where a sum is the same as an average, and where pointing out when you’ve been lied about is whining.”
More whining. All you are doing is avoiding the real issue. Not all distributions are symmetrical where measurement uncertainty cancels. You simply can’t accept that so all you can do is whine.
“Indeed it’s not. You do however want to divide the uncertainty by the same value as you divide the measurement to get the correct uncertainty.”
Only if you are wanting to find the average uncertainty instead of the uncertainty of the average.
“Get another lie, this one has become threadbare.”
(a + b + c … + z) / 26 *IS* an average no matter how much you want to deny it. It doesn’t matter if a, b, c, etc are stated values or uncertainty intervals. When you divide by the number of members in the data set you are finding an average value.
The average uncertainty is *NOT* the uncertainty of the average.
You still can’t accept that simple fact, can you?
“You are not averaging anything there. You don;t want to know the uncertainty of the average, you want to know the uncertainty of the sum. The fact even after all these years you still can’t tell the difference is why I tend to get a little irked when you insist on denigrating my “real world” skills.”
Your “uncertainty of the average” IS how close you are to the average, NOT how uncertain the value of the average is!
How close you are to the population mean is useless if the population mean is inaccurate!
How do you determine how inaccurate the population mean might be? By finding the average uncertainty of the members in the population? Or by propagating the uncertainty of the members to the population average?
If *every* member in the population is off by 2 then how far off will the population mean be? You can calculate the mean out to however many digits you want, just state how uncertain that value will be! Can you?
I know this example has been given to you before but, as usual, you ignored it.
Population Stated values = 2, 4, 6,8,10, 12 ==> Avg = 7
Systematic bias of +2 = 4, 6,8,10,12,14 ==> Avg = 9
Systematic bias of -2 = 0,2,4,6,8,10 == Avg = 5
You can calculate the average of the stated values EXACTLY, your uncertainty of the mean is ZERO, i.e. how close you are to the population mean.
BUT, when you consider the uncertainty of the members the value of the mean is 7 +/- 2!
You want to drive how close you are to the population mean, I.E. the standard error of the mean, to zero while ignoring the uncertainty of the data set members. This is why you ALWAYS circle back to assuming the measurement uncertainty always cancels – so the standard error of the mean can be used to define the uncertainty of the mean. You always deny this but you do it EVERY SINGLE TIME.
THE STANDARD ERROR OF THE MEAN IS NOT THE UNCERTAINTY OF THE MEAN!!
Until you can get this simple fact of metrology into your head there is simply no use in discussing this with you. I am missing out on money making time trying to explain it to you.
You just continue living in your alternate reality where all measurement uncertainty cancels. I’ll go live in the real world.
“I am missing out on money making time trying to explain it to you.”
To use your favorite childish insult, stop whining. Nobody is forcing you to write these interminable repetitive tracts.
If you want to avoid wasting your time you could try engaging with what I actually say, rather than what you want to believe I say.
“Not all distributions are symmetrical where measurement uncertainty cancels. You simply can’t accept that so all you can do is whine.”
I fully accept that not all distributions are symmetrical. But you still seem to think that it’s necessary for a distribution to be symmetrical for errors to cancel. That’s wrong, as the CLT proves. Just about any distribution will tend to the mean of the distribution the larger the sample size.
As always you are vague about what distribution you are talking about. If you are talking about measurement uncertainty, then I assume you mean the distribution of measurement errors. But as you also insist that measurement uncertainty doesn’t have a probability distribution, maybe you mean something else.
Assuming you do mean the distribution of errors, then as I’ve explained before, what matters isn’t the symmetry of the distribution, it’s the mean. I the mean is zero, then with an infinite number of measurements all the errors will cancel. If it isn’t zero then you have a systematic error and the an infinite number of measurements will tend to that error.
“(a + b + c … + z) / 26 *IS* an average no matter how much you want to deny it.”
I don’t deny it. What I deny is that √(a² + b² + c² … + z²) / 26 is an average. It’s certainly not an average of the 26 values.
“The average uncertainty is *NOT* the uncertainty of the average.
You still can’t accept that simple fact, can you?”
Apart from the fact I keep telling you they are not the same thing. It’s that what you mean by not accepting it.
“Your “uncertainty of the average” IS how close you are to the average, NOT how uncertain the value of the average is!”
But you don’t know how close you are to the average, that’s why it’s uncertain. What uncertainty, e.g. a confidence interval does is give you an indication of how close you are likely to be.
“How close you are to the population mean is useless if the population mean is inaccurate!”
I can guess what you are trying to say, but as written this is nonsense. The population mean is the thing you are measuring, it has no inaccuracy. Your measurements of the mean might be inaccurate, but it isn’t the population that is wrong, it’s your measurements.
“By finding the average uncertainty of the members in the population?”
Again, assuming you mean the uncertainty of the measurements, not of the members, obviously you don’t do this. The assumption is that errors will cancel, the average uncertainty is assuming they don’t. The only time average uncertainty makes sense is if you assume the only uncertainty is caused by a systematic error.
“Or by propagating the uncertainty of the members to the population average?”
You can do that, and that’s what we’ve been arguing for the past few years. But that is only going to give you the measurement uncertainty. The, usually, much bigger source of uncertainty is that from sampling.
“If *every* member in the population is off by 2 then how far off will the population mean be?”
Again, assuming you mean every measurement, then you have a systematic error and the measurement uncertainty of the mean will be off by 2.
“I know this example has been given to you before but, as usual, you ignored it.”
Either that, or you forgot my response. I’ve told you on many occasions that systematic errors are not reduced by averaging. That’s pretty much the definition of a systematic error.
“This is why you ALWAYS circle back to assuming the measurement uncertainty always cancels – so the standard error of the mean can be used to define the uncertainty of the mean. You always deny this but you do it EVERY SINGLE TIME.”
Apart from all the times when we’ve discussed systematic errors, along with systematic biases in the sampling.
Nobody thinks that the standard error of the mean is the only factor in a real world sampling. But you keep ignoring the fact that when you do have random errors, they will get cancelled. And you keep bringing up systematic errors to distract from your own mistakes.
All of this started with you saying that if you had 100 temperatures, each with a random uncertainty of ±0.5°C, then the uncertainty of the average would be ±5°C. As far as I can tell you still believe that, as you still keep insisting you don’t divide the uncertainty of the sum by the number of values.
Yet, even if the 0.5 uncertainties were nothing but systematic errors, the average would still only have an uncertainty of ±0.5°C. Moreover, your argument was that the uncertainty of the sum would be ±5°C, which only makes sense if you were assuming that there was no systematic error.
Trying to point out why your maths is wrong, under your own assumptions, does not mean that I believe there are no complicating factors, such as systematic errors, it’s trying to explain why your maths is wrong.
“What if you have bricks instead of paper?”
What if your arms were made of cheese? The example we were discussing was paper not bricks. Paper exists in the real world just as much as bricks do.
The maths is the same regardless of whether you are measuring bricks or paper, it’s just the practicalities that change. The example of a stack of paper is good because it’s very difficult to measure a single sheet of paper without expensive equipment. A stack of 100 bricks isn’t such a good example as it’s more difficult to measure the stack and easier to measure individual bricks. But regardless, if you wanted an accurate measurement for an individual brick, stacking a number of them and dividing the height by number of bricks will give you a more accurate measurement that just measuring one brick, assuming your measuring device had the same accuracy.
In contrast measuring just one brick and multiplying it by the number of bricks to get the height of the stack will be less accurate as any error in your one measurement will be multiplied by the number of bricks. If you measure it with ±5mm uncertainty, then the estimate of a stack of 100 bricks will have an uncertainty of ±500mm, (± 0.5m).
“Your poor math skills are showing again!”
For someone living a glasshouse,m you sure like to throe a lot of stones.
“(1/n) * sqrt[ u(x1)^2 + u(x2)^2 + … + u(xn)^2]
You are *still* finding an average!”
An average of what? If you had 50 6′ boards and 50 8′ boards, would you regard that formula as giving you the average length of the board? Hint, this would give you an average of about 0.7′.
“(RSS/n) is an average! It assigns the exact same uncertainty to each individual element regardless of what the actual uncertainty of the element is.”
You already know the individual uncertainties, that’s how you calculated the RSS. In what world does averaging result in each actual element having on average a much smaller uncertainty? In what way does the uncertainty of the average assign the same value to each element? It’s the uncertainty of the combined average, nothing to do with each element.
“Write this out 1000 times: Average uncertainty is not the uncertainty of the average.“
Write this out three times – “I agree”.
“Since you insist that an average is a functional relationship”
That’s only the case where you are talking about an exact average. I.e. you have 30 different values and you want to know what their average is. More usually you are taking 30 values as a random sample from a population and that is not a functional relationship. A different random sample will give you a different average.
Whether you consider the average temperature for January 1953 to be an exact average of those 31 days, or a random sample from all possible 31 daily values, is an interesting question. It’s the question of why TN1900 uses the random variation of the daily maximums as a random sample and ignores any measurement uncertainty.
Why do you think the variance of the averaged data is important? I have tried to emphasize that yet no one including you address that fact. The variance of an average is needed to define the shape of a of a normal or Gaussian distribution.
That is why the method in NIST TN1900 is so important. It provides a method that follows the GUM and defines the appropriate interval of where mean may lay.
You want to divide measurement uncertainty by n^2 so you get an average error in the hundredths or thousandths decimal place, go right ahead, it just makes the combined measurement uncertainty less and less important when compared to the expanded uncertainty calculated from the actual data.
I for one will be using the NIST recommended procedure. If you want to argue about their recommendation I suggest you start a dialog with them.
“Why do you think the variance of the averaged data is important?”
Which variance are you talking about? It’s all important, but it’s difficult to try to explain to you why when you keep twisting everything. Are you talking about the variance of the population, or the variance of the sampling distribution?
You need the former to estimate the later. The later is important as it indicates the uncertainty of the average. (Though really it’s the standard deviation not the variance that is used).
“That is why the method in NIST TN1900 is so important.”
You mean the method you think is wrong, and are only using to “hoist others on their own petard”?
You still don’t seem to get that the method used in Example 2 of TN1900 is the method I’ve been (in different contexts) trying to explain to you. The one you claim is wrong. The one which involves dividing the standard deviation of the measurements by the square root of the sample size.
“You want to divide measurement uncertainty by n^2”
No I do not. I want, under the right circumstances, to divide it by √n. I assume you understand the difference between the square root and the square.
“so you get an average error in the hundredths or thousandths decimal place”
No. I want to do it because it’s the correct way. And you are very unlikely to get uncertainties in the thousandths of places, unless you have very precise measurements to start with. Averaging multiple measurement uncertainties will only get you so far, as the precision only increases with the square root of the sample size, and the smaller it gets the more effect any small systematic error will have. Bevington I think describes this well.
“it just makes the combined measurement uncertainty less and less important when compared to the expanded uncertainty calculated from the actual data.”
What are you on about now. The expanded uncertainty is just the combined standard uncertainty with a coverage factor. The smaller the standard uncertainty the smaller the expanded uncertainty.
“I for one will be using the NIST recommended procedure.”
Try not to hoist yourself on your own petard.
So you agree, TN1900 is a correct way to find u_c(y).
My problem with TN1900, is not its method, but the assumption that measurement uncertainty is negligible. However, since you insist measurement uncertainty is so small as to allow u_c(y) to allow averages with 2 and 3 decimal points, then your only alternative is to use experimental uncertainty as recommended by both TN2900 and the GUM.
As stated in TN1900 which references the GUM 4.2.3 where:
σ^2(q_bar) = σ^2 / n and
s^2(q_bar) = s^2(q_k) / n, and
s(q_bar) = s(q_k) / √n
Then s(q_bar) is expanded by a coverage factor to achieve a confidence intervals.
It appears to calculate an expanded combined uncertainty that subsumes any of your estimates and includes:
“””””The {Ei} capture three sources of uncertainty: natural variability of temperature from day to day, variability attributable to differences in the time of day when the thermometer was read, and the components of uncertainty associated with the calibration of the thermometer and with reading the scale inscribed on the thermometer.”””””
You aren’t going to like the resulting uncertainty intervals that show anomalies as being calculated are meaningless.
“So you agree, TN1900 is a correct way to find u_c(y).”
Up to a point. For a start they don’t say it’s the correct way. You can always find different and possibly better ways of analyzing any data.
My main issue is they don’t really define what they want to measure, and what the uncertainty represents. Are you interested in the actual monthly average, and how certain you are about it, or a more abstract conceptual average, which might have been different if the temperatures had been different. The approach in the sample is the later, each day is treated like a random temperature around a supposed daily average and the of the example uncertainty reflects that. I don’t think this is wrong, and it’s the correct way to handle questions such as, was this month significantly warmer or colder than the previous one. But if you are only interested in what the actual temperature was then it would make more sense to just propagate the measurement uncertainty.
The problem with the example is they only look at a month with a large proportion of it’s days missing. It’s not clear is the SEM used is meant to reflect the uncertainty of the missing days. The problem would be more obvious if they had all 31 days.
But in general, as an illustration that you can use the standard error of the mean to estimate the uncertainty of a mean it’s fine.
“My problem with TN1900, is not its method, but the assumption that measurement uncertainty is negligible.”
I don’t think it does that. What they say is that calibration issues are assumed to be be negligible. Random uncertainty caused by reading the instrument (and I assume that includes rounding to the nearest 0.25°C) will still be present in each days error. But it will be negligible simply compared to the range of errors caused natural variability. But when you look at the standard deviation, that can only be the result of all errors. You can’t pretend the measurement errors are not part of the total error.
“However, since you insist measurement uncertainty is so small as to allow u_c(y) to allow averages with 2 and 3 decimal points!”
I don’t claim that, or at least I don’t think the size of the measurement uncertainty is the reason for any specific number of decimal places. I agree with the standard practice of calculating the uncertainty to a reasonable number of places and reporting the result to the same number of decimal places. (I also think it’s better to include too many than too few digits, especially if the result will be used in other calculations.) But the size of the uncertainty has much more to do with the sampling errors than the measurement errors.
“As stated in TN1900 which references the GUM 4.2.3 where”
And I still don’t understand why you are so against dividing standard deviation by the root of sample size, yet say it’s the correct method here.
“It appears to calculate an expanded combined uncertainty that subsumes any of your estimates”
I’m, not sure what you mean by my estimates. I’ve made no attempt to estimate any temperature uncertainty. I mainly just point out why your methods are wrong.
Again, given the concept of looking at natural daily variability as a random error, then I don’t think the estimate they give is unreasonable. But that’s the estimate for one month (with a lot of missing data) at one station.
“You aren’t going to like the resulting uncertainty intervals that show anomalies as being calculated are meaningless.”
How do you come to the conclusion that this result shows all anomalies are meaningless?
If you have a problem with a NIST recommendation I suggest you do a better job of describing the problems that you have and discuss them with NIST.
I can assure you that what you are currently spouting will not get you very far with them. They will want both math and evidence to support your claims of their Technical Note being incorrect.
Why don’t you ask Tim to do that? He’s the one that says he and you have a problem with that example to trick “alarmists” into hoisting themselves with their own petards.
As I said, I don’t have a problem with the method, just an observation about what is being considered uncertainty in the instance.
“Are you talking about the variance of the population, or the variance of the sampling distribution”
It shouldn’t matter. The samples should have the same distribution as the population. If they don’t then somewhere the assumption of iid is being violated. If the samples are not iid then you can get spurious trends.
If you don’t have iid then your precious CLT won’t work correctly.
“The later is important as it indicates the uncertainty of the average. “
This is really a mis-naming of what it is. It is *not* the uncertainty of the average, it is the standard deviation of the sample means. It is a measure of how closely you are estimating the population mean. It is *NOT* finding the uncertainty of the mean.
I know “uncertainty of the mean” is common parlance in statistics but it is as misleading as all get out. It is more correctly called the Standard Deviation of the Sample Means. Use of that term would eliminate a lot of confusion – confusion which you display in extreme.
Uncertainty of the mean is the propagated uncertainty of the measurements making up the data set. It’s why you can have a very precisely calculated mean that is very close to the population mean while being inaccurate as all get out!
Again, if you have the entire population, with each member given as “stated value +/- uncertainty”, the uncertainty of the mean is *NOT* zero. It is just the population mean – period. It is the average of the stated values. It is the propagation of the “uncertainty” portion of the members that determine the uncertainty of the mean.
You need to unlearn your use of the term “uncertainty of the mean” and start using the “standard deviation of the sample means”.
“The one which involves dividing the standard deviation of the measurements by the square root of the sample size.”
Why do you NEVER state the assumptions Possolo uses in TN1900? You *ONLY* do this when you can assume that all systematic bias is zero and the uncertainty is random, symmetrical, and cancels. Possolo specifically states these assumptions in his example. This allows him to assume that all measurements are of the same thing taken by the same device and the variation of the stated values determines the uncertainty of the mean.
It is the very same set of assumptions you always make even though you deny it vociferously. All measurement uncertainty for you cancels and only the stated values are used for analysis. In this case the standard deviation of the sample means is considered to be the uncertainty of the mean. But you *NEVER* justify those assumptions. You won’t even state them explicitly because you know it would invalidate your analysis.
“It shouldn’t matter. The samples should have the same distribution as the population.”
I asked about the sampling distribution. Not the distribution of a sample.
“SHOW A REFERENCE.”
“EVERY TIME you assume that all measurement uncertainty cancels you are assuming that all distributions are Gaussian.”
Your need to justify all these lies to yourself are quite telling.
1) I do not assume that all measurement uncertainties cancel. I assume that there is some cancellation because that’s what you would expect with random errors. But that random errors ever completely cancel. That’s the whole point of the sum of uncertainties propagating as sqrt(N) * uncertainty. There’s some cancellation, so they don’t grow with N, but they still grow at a slower rate. And when you take the average this becomes uncertainty / sqrt(N), which means the uncertainty reduces due to cancellations, but never completely.
2) And how many more times does this have to be explained.? But the cancelling of errors does not depend in any way on the distribution being Gaussian. There are times when knowing or assuming a distribution is Gaussian in order to simplify the maths. But for any case random errors, whatever the distribution, tend to cancel.
“See! You are doing it again!”
What I was “doing again” was responding to your claim that
It’s an obvious point, but if you take multiple values from a distribution, then the values will tend to have the same distribution as the parent distribution. Hence my point that is the population is Gaussian the multiple measurements you take will also be Gaussian.
Maybe you mean the measurement errors will not be Gaussian, but that again would depend on the distribution of your measurement uncertainties. You really need to take a breath and explain what exactly you mean in these exercises, rather than just ranting and jumping on that shift key.
“Assuming that measurements of different things give you a Gaussian distribution.”
If the original distribution is Gaussian. You missed that import bit.
“If you measure one horse out of the multiplicity of horse species you will NOT* get a Gaussian distribution.”
Of course not. I’ll just have one value. But you specifically said you were measuring different things, not one thing.
“Even the daily temperature profile is not Gaussian or symmetrical. ”
As I keep pointing out to you.
“Taylor, Bevington, and Possolo *all* say that.”
Context please.
“None of their books, notes, or papers show how to handle measurement uncertainty for a skewed distribution using just the average value of the measurements as a “true value”. ”
Again, you need to be clearer about what you are trying to do here. Is it the measurements that have a skewed distribution or the population?
“*YOU* are the only one that is adamant about assuming that all measurements of different things is Gaussian and the average is a “true value”. ”
As in I’m adamant that you do not have to assume all measurements of different things are Gaussian.
When I say the average is the “true value” it’s in the context of saying that if you want to know what the average, then that average is the true values you are trying to measure. Not that your sample or any specific average you obtain is the true value.
A drop of 2C is much more dangerous than a rise of 2C. We can adapt to either, but I would rather adapt to the rise.
His post is fine – it further ridicules the idea that an extra 1.5°C by the end of the century will cause the end of the world.
Imho, 1.5C is just a good start!
Even the IPCC’s own scientists have said that any temp increase will be mostly in the poles and hardly anything at the equator – and other commentators have added that it’s the nightly lows that will be affected the most, not the daily highs that most alarmists cry about.
PCman999 makes probably the most important comment in the thread here – only a little warmer, and only where/when a little warmer might feel good.
“Office temperature designated by OSHA has a 5°C comfort range — 68°F to 77°F. That’s 11°F. Want to use that range?”
That’s 20 – 25°C.
indoor comfort with low humidity
you are misusing the OSHA data
Steven: I suggest you check your math….. 77
minus 68 does not equal 11
bellman ==> Yes, right on….the Earth needs to warm up a bit more — it still doesn’t even quite meet the NASA standard for average global temperature for an Earth-like planet. (15-16°C)
Do you have a source for that definition? It seems odd that NASA are saying the Earth isn’t an Earth like planet.
Bellman ==> NASA generally states two temperatures, 15°C and on occasion, 16°C, depending on which NASA page you are looking at. “21°C, says William Borucki of NASA’s Ames Research Center here, who is the principal investigator of NASA’s Kepler space telescope, once used that,”for a “a very nice temperature”.
The Earth, according to the GAST believers, is running about 14.85°C, depending on the day and the amount of fiddling. In any case, it is still a little short of 15°C, and over 1°C from 16°C.
This wiki page references NASA’s source for the 15°C and you can find many more.
Or you can read my essay.
“NASA generally states two temperatures, 15°C and on occasion, 16°C, depending on which NASA page you are looking at.”
Still looking for a link to any of these pages. I can’t find any reference on any of the links you do provide that says that anything below 15°C is considered to not be earth-like.
Your own essay only says
And else where simply say that 15°C is the ideal temperature. That’s very different from setting a minimum requirement.
Again, it’s seems nonsense to suggest that Earth-like doesn’t apply to the Earth, when that’s the very definition of Earth-like. It would be like arguing that Belgium is too small to be considered about the size of Belgium.
I suggest you check your math. 77-68=?
The difference between Fahrenheit and Celsius.
Bellman…. the last time I took arithmetic: 77 minus 68 = 9… 5°C = 9°F the difference between °C and °F has noting to do with it
77°F = 25°C
68°F = 20°C
The range is 5°C, just as Kip Hansen said at the start.
But I do see that Kip Hansen quoted a range of 11°F, which is wrong. You really need to complain to him, rather than me. I’ve only been using Celsius.
Office temperature designated by OSHA has a 5°C comfort range — 68°F to 77°F. That’s 11°F. Want to use that range?”
no.
indoor comfort at low humidity has nothing to do with climate change
pragmatic try outside temperature
please https://bfi.uchicago.edu/wp-content/uploads/UCH-110116_IndianManufacturingResearchSummary_v04.pdf
An ordinary red line mercury thermometer is what almost everyone uses to find out the temperature at home. Put 142 of them in a row and you have AW’s new chart.
Simple and easy to understand.
Small changes in temperature look small on the chart.
Temperature changes likely to be too small to be felt at home or outdoors are barely visible.
The C. or F. degree absolute temperature charts are honest charts that do not mislead people.
The K, degree absolute temperature chart would mislead people because it looks like a straight line.
All three (C. F. and K. degree) absolute temperature charts are at the link below:
Honest Climate Science and Energy Blog: Global warming and CO2 levels with honest charts
That leftists HATE these charts is further evidence they are great.
pragmatic for
AGAIN various approaches have been MEASURED!!
http://euclid.psych.yorku.ca/www/psy6135/papers/ClevelandMcGill1984.pdf
example. show people both charts and ask them how much the temperature has changed
absolute charts fail utterly.
next up what does ANSI say
Kip,
“Want to use that range?“
No. You are persistently missing the point. The global average is a calculated indicator. It can’t be compared with what humans experience; no-one experiences it. The question is, what does it indicate.
In the last glaciation, GAT went down by about 11°F. That is actually the range you suggest. But of course it had far more effect than we would find if the temperature changed by that amount one day.
The GAT is an average over time and space, so is very stable. It takes a lot to move it, and so if it does move, it means a lot has happened. Even just averaging over time has the same stabilising effect. NYC has an average temperature of 55.8°F. Atlanta has an average of 63.6°F. The difference of 7.8°Fis well within your scale. But in terms of human perception alone, those are very different climates. You can’t grow peanuts in NY.
“No. You are persistently missing the point. The global average is a calculated indicator. It can’t be compared with what humans experience; no-one experiences it. The question is, what does it indicate.”
This is like saying average miles/gallon in your car should be measured in hundredths. It takes a lot to change your average mpg so you should be very interested in that change in the hundredths digit.
No one cares about that increment in mpg. It’s going to be what it is and unless the change is significant enough to impact your driving it isn’t important, at least to most people.
If no one experiences it then does it exist? If a tree falls in the forest does it make a sound? (hint: what is “sound”)
Nick writes “The global average is a calculated indicator. It can’t be compared with what humans experience; no-one experiences it.”
OK, so do the graph for a local region. Its going to look quite similar for many regions and now the graph does have meaning and people will directly experience the change.
Nick writes “What counts is what fluctuations signify. “
When about half the fluctuations come from the TOBS adjustment, you know you’re on shaky grounds wrt immanent catastrophe prediction
There is no TOBS adjustment. USHCN was US only, and became obsolete nine years ago.
I calculate the global average using GHCN unadjusted, and get almost identical results.
Nick writes “USHCN was US only”
You mean where the people live and “feel” climate change?
Lets be sure of what’s being claimed here, are you saying there are no TOBS adjustments in the various data sets used to calculate the GAT?
Do you have that comparison on your website?
@Nick. Nevermind, I found the info on your website.
Before 1970 the adjustments “cool the past”, by up to 0.05°C. However, on a land basis, that is up to 0.2°C.
Luckily, researchers have already done lots of studies on what visual cues work and what sucks, so you don’t have to start from scratch. Most notable is perhaps William S. Cleveland and Robert McGill’s paper Graphical Perception: Theory, Experimentation, and Application to the Development of Graphical Methods [pdf] from the September 1984 edition of the Journal of the American Statistical Association. I won’t rehash the whole paper, but the findings of most interest here is a ranked list of how well people decode visual cues.
In his text Visualizing Data, William Cleveland demonstrates how the aspect ratio of a line chart can affect an analyst’s perception of trends in the data. Cleveland proposes an optimization technique for computing the aspect ratio such that the average absolute orientation of line segments in the chart is equal to 45 degrees. This technique, called banking to 45 degrees, is designed to maximize the discriminability of the orientations of the line segments in the chart. In this paper, we revisit this classic result and describe two new extensions. First, we propose alternate optimization criteria designed to further improve the visual perception of line segment orientations. Second, we develop multi-scale banking, a technique that combines spectral analysis with banking to 45 degrees. Our technique automatically identifies trends at various frequency scales and then generates a banked chart for each of these scales. We demonstrate the utility of our techniques in a range of visualization tools and analysis examples.
That sounds like Ph.D.-style claptrap
sounds like insecure name calling
“…….We demonstrate the utility of our techniques in a range of visualization tools and analysis examples”
Or we could just create a graph with the correct x,y scale.
the correct scale is what they studied.
hint: its not a zeroed scale
Too much study and education can be an obstacle to learning.
“Today’s scientists have substituted mathematics for experiments, and they wander off through equation after equation, and eventually build a structure which has no relation to reality.” – N. Tesla
Wow! Nice quote!
Models as data? what a joke.
By “today’s scientists” I think he means people like Einstein. He was very much against the idea of relativity and atomic theory.
That is interesting, although it seems very relevant to today, especially with any ‘research’ to do with climate or Covid. Here is Richard Feynman – “We live in an unscientific age in which almost all the buffeting of communications and television-words, books, and so on-are unscientific. As a result, there is a considerable amount of intellectual tyranny in the name of science.”
And Einstein said “Blind belief in authority is the greatest enemy of truth”
Here’s the full article
https://teslauniverse.com/nikola-tesla/articles/radio-power-will-revolutionize-world
Boring. tl, dnr.
Kip, take a minute and google “cleveland graphics slope”
the ability to convey information with a chart has been studied empirically.
bank to 45 is the rule amongst graphics professionals.
osha is NOT an authority here bad appeal to te wrong authority
2 strikes in 1 comment.
Mosher ==> Cleveland’s basic advice on scale is:
Make important differences large enough to perceive
That implies that barely significant differences need to be minimized — or at least shown to a scale that allows the readers understand the relative importance.
Thus, my graph fits the bill rather well.
If the temperature difference is unnoticeable or insignificant to humans in daily settings, then the graph should show that.
Mosher ==> The Cleveland advice makes it very clear that scale depends on purpose.
If your purpose is solely scientific data analysis, say in a scientific paper, then follow their advice.
But for communicating information to the general public, using Cleveland’s “bank to 45” is exactly what Huff points out is a propagandist’s dream. Every tiny change is anything, up or down, can be made to look dramatic.
Certainly not fit for truth telling.
again,Kip, you can refer to me as steve or mr mosher.
the PURPOSE of the data is to show the CHANGE
to make that readable immediately/
so 1 use anomalies
your version lies because it hides the incline and assumes
that indoor temperature, which can be controlled is important for things like farming and outside work. and animal migration
your choice DESTROYS the slope information and hides the incline.
kips nature trick. great your plagarizing Mann now.
if you want to argue with clevland cite some science
Mosher ==> You anomaly only version hugely exaggerates the increase, which, in terms of life on Earth, or Earth Climate in general, is rather small and insignificant.
Read Huff for your reference for graphs for public consumption.
The mountains of Arkansas look huge until you visit Denver. It’s all a matter of perspective. Creating a false perspective doesn’t lead to understanding, it leads to misunderstanding.
So do you insist that people are only allowed to view the mountains of Colorado from Arkansas, lest they be alarmed?
Kip, your 5 C recommendation is the difference between glacial and interglacial eras. And 1 C captures the range of the global temperature from the MWP to the LIA. So I don’t think these changes are small and insignificant.
bdgwx ==> We have very little idea what the “thermometer” temperatures were in the MWP or in the Little Ice Age in degrees. And as you know, I am not a fan of the “averages” used to produce such things as “Global” anything.
The know mostly about the MWP from historic accounts, but not thermometer measurement. Same for the LIA. And most certainly, not temperatures as Global Averages in degrees.
We know approximately NOTHING about thermometer measurements (degrees) about GAST during Glacial Periods and Interglacials in the past.
We can know that temperatures were lower during Glacials and warmed up from Glacials to Interglacials.
We do NOT know what those temperatures were in any measure of degrees.
We do know. [Kaufman et al. 2020].
bdgwx ==> Interesting, but guesses is guesses — not measurement.
Kaufman et al. 2020 didn’t guess. They took actual measurements of temperature proxies and aggregated them into a global average temperature.
Kip Hansen, I applaud this idea.
A rationale for the scale based on human comfort. It makes sense.
But while that’s useful for health questions, there are other questions too.
Effects on wildlife, agriculture, weather (humidity), weather (windspeed)…
The scale shown ought to be relevant to the question you are asking.
Your graph is. But the question youa re answering always needs to be stated.
MCourtney ==> There is not, and cannot be, a single answer. or a single question.
There is absolutely no evidence presented by the IPCC (or anyone else) that a 1°C change in “global temperature’ (which we do not and probably cannot know) is important or significant to life on Earth. At best, observations swing both ways — the warmer present is better for almost everything, bad for some in some special instances.
The global AVERAGE temperature hides what is going on. There is no way to use the average to determine if Tmax is going up, down, or sideways and the same thing applies to Tmin.
I’ve seen study after study on ‘global warming” going to kill the food supply because of the assumption that it is Tmax that is going to go up by 3C or even more.
Yet the GAT doesn’t tell you that! In fact, most ag studies show that growing seasons are lengthening. That’s due to Tmin going up, not Tmax.
“At best, observations swing both ways — the warmer present is better for almost everything”
First you have to know if the present is actually warming!
Local temperature data tell you what you need to know. No one lives in the average global climate.
Or you can follow my two predictions if your local data are unavailable: (Nobel Prizes pending)
(1) The climate will get warmer, unless it gets colder, and
(2) Winters will be cold, and summers will be warm
Global climate statistics would be useful when they include TMAX and TMIN trends, warming by latitude and warming by season or month of the year. But those details are top secret. No one must know that colder nations are having warmer winters since the 1970s — those facts would not scare anyone. Climate change scaremongering is worthless if it does not scare people.
All that Canadian and Russian/Siberian tundra turning into farmland. It would be tough for a Texan wheat farmer but imagine the farmer in Saskatchewan. Yet they vote opposite those interests. In both cases, Texas and Saskatchewan, “other factors” are more important when they consider the role of government on their personal situations.
the global average hides nothing!!
Really? What is the variance associated with the distribution that results in that average?
Mosher ==> The “Global Average” graph depends on how it is shown and to what scale.
If shown on the scale of Earth temperatures experienced on the average day, it is trivial. If the scale is Annual Global High and Low, it is still trivial.
Using the Cleveland “bank to 45” recommendation guarantees a 45° slant for even trivial changes and trends, and is meant to make them look significant.
Huff – How to Lie with Statistics..
The global average temperature “hides nothing” EXCEPT:
More warming in the six coldest months of the year, including the Arctic, than in the six warmest months of the year
More warming at the higher, colder latitudes of the Northern Hemisphere
No warming of Antarctica
More warming at night (TMIN), than in the afternoon (TMAX)
Do you still want to continue lying by claiming a single global average temperature, that not one person lives in, hides nothing?
A single average temperature hides EXACTLY what leftist climate scaremongers like you WANT to hide. Because the average temperature change details I listed above would REDUCE the unjustified fear of the future climate that gullible fools like you have been conned to believe.
So the general public will NEVER get historical temperature details beyond a simple global average temperature.
An always wrong prediction of the future climate works to scare people. … Hearing about warmer winter nights in Siberia would not scare anyone.
Scaring people is the ONLY goal of the climate change religion. Scaring people about an imaginary boogeyman to control the private sector and increase government powers, while reducing personal freedoms..
And you, Mr, Masher, are on the WRONG side of the climate change propaganda. Shame on you.
We use global average temperature and global average solar radiation and global average albedo to estimate energy budgets and the GHE. Of course not measured to two decimal places.
+1 degree C.is a nothingburger
+1.49 degrees C. is a nothingburger too
Over +1.5 degrees C. and we are in BIG trouble
Over +2.0 degrees C. and we all die
That is a summary of modern climate science.
It is in all the newspapers.
By the way, no one knows the global average temperature in 1880 or 1850. The claimed averages could have a margin of error of +/- 1 degree C.
This post is serious,
not satire.
You pretty much nailed it!
+1 degree C.is a nothingburger
+1.49 degrees C. is a nothingburger too
Over +1.5 degrees C. and we are in BIG trouble
Over +2.0 degrees C. and we all die
That is a summary of modern climate science.
It is in all the newspapers.
this is a classic strawman. 2C is not a kill zone demarcation
you cannot debunk arguments unless you can restate them accurately to the satisfaction of those who actually believe the arguments.
its in the newspapers!!!!!!!!!!!!!!!!!!!!!!!!!!!!!!!!!
bad sourcing freshman mistake.
here
https://www.ipcc.ch/site/assets/uploads/sites/2/2022/06/SR15_Chapter_3_LR.pdf
I’ve read the linked pdf, which seems to say that higher/lower extremes are more important than a static higher mean for the scenarios we’re thinking about. The authors seem unwilling to commit to a catastrophic conclusion.
Select quotes:
“The strongest warming of hot extremes is projected to occur in central and eastern North America, central and southern Europe, the Mediterranean region”
If someone wanted to write a definition of where money lives, the quoted sentence would be a good start
“Limiting global warming to 1.5°C would limit risks of increases in heavy precipitation events on a global scale and in several regions compared to conditions at 2°C global warming”
Are precipitation events bad? Rain hurts outdoor pick-up soccer, but helps green growing things.
“ A smaller sea level rise could mean that up to 10.4 million fewer people (based on the 2010 global population and assuming no adaptation) would be exposed to the impacts of sea level rise globally in 2100“
As soon as I see year 2100, I stop worrying. I understand the change would compound yearly, but if flood risk were to crush beachfront property values, I’d be a buyer not a seller. Even given the land might be gone in 70 years, I know I will certainly be gone in 70 years, so whatever.
I could keep going with quotes and comments. You get the idea. Earth is so big, I don’t much that fear my smart, healthy, educated American kids will find a nice place on it. I’d rather walk outside and find it warmer than colder, and I live in a very warm region. I wish people would stop coming here, they’re going to use up the water!
“The strongest warming of hot extremes is projected to occur in central and eastern North America….”
except that those hot extremes have been falling for 80 years or so.
See EPA heat wave index ….
It’s called sarcasm, Mr, Masher.
Written to amuse people and exaggerate a point.
You have no sense of humor
Although many of your comments here are hilarious.
A typical leftist.
And, it’s not possible to describe or deduce any of the Earth’s varied climates or where they are from a single global average temperature. And, there isn’t a single Earth climate.
Mosher’s link to recent environmentalist text agrees that there isn’t a single Earth climate.
I think you might agree with more than you realize.
he scale shown ought to be relevant to the question you are asking.
the question is How much has the temperature increased
how much has the climate changed.
human comfort?
inside or outside?
dressed or naked?
calm or windy?
why not “crop comfort” or workingoutside comfort
These are subjective choices, not science. An increase of 0.5C is unlikely to result in a change in any of the defined climate zones. Consequently, one must answer the question of whether it is appropriate to emphasize that small of a change.
Here is an image of large climate definitions. Where do you see a 1C causing changes?
Here is the image.
Jim ==> That is, of course, (and I’m sure you know) a vastly over-simplified version of climate zones.
The one usually used for most purposes is the Köppen-Geiger climate zone map:
Mosher ==> Now you’re babbling. The GAST anomaly does not show “how much the climate had changed”
Even local annual anomalies do not show how much local climates have changed…the only show how much the questionably-useable statistical average “annual temperature” had changed — which may have produced ZERO climatically important changes.
The change matters only to those who demand we define climate change as any change in average surface temperature on scales of years — annual average temperatures.
Such an idea is entirely unscientific.
Climate is based on the entire temperature profile. That is lost when using averages to calculate anomalies. Therefore anomalies can’t tell you anything about climate, be they local, regional, or global.
GAST is a metric, but what it is a metric for is not obvious at all.
here.
https://priceonomics.com/how-william-cleveland-turned-data-visualization/
osha is the wrong authority to appeal to.
please ask before posting about stuff you dont understand
Wow, three Moshisms and counting
of course you ignore the bad appeal to authority
where did you learn to argue?
folks who have studied empirically how BEST to convey information would never say to scale a graph to destroy the trend information
its TONY’s nature trick
I disagree with this temp range, as the data is only just 1C above or below the chosen datum, so expand that to 3C total and it will look better and be more meaningful.
office temperatures? thats stupid
why not office co2?
how about office humidity?
“But famously, we don’t experience global average temperature”
like hundreds of millions of others I lived every temperature on the scale this year
it’s the human-relevant scale
but yes a local livability scale would be vastly superior
but you won’t like the proportion of the Earth that actually wants lower temperatures
People don’t get rich and move North very often.
Nick ==> So, you say we should use a scale with a vertical scale of at least 14°F (7 or so C) — the difference between your offfered Ice Age figure and the present? That’s about the scale I used (5°C). I would be glad to produce the graph with a wider scale (7°C) It will look even a little less alarming at that scale.
No,
I’m saying you should draw a graph in order to inform, not make some juvenile point. You should use the range of the observed GAST. That tells people what happened. If you are graphing from 1850 to now, you don’t need to make provision for some glaciation.
Nick ==> If your only purpose is to show how the artificial metric, Global Average Surface Temperature, changed, then that’s fine.
But if you want to inform the general public what that might mean for them in their real lives, and for their children and grandchildren, then you have to put it in some form, with some scale, that will be meaningful to them.
Thus — Read Huff. Or read Cleveland and read his quotes on Huff.
“But if you want to inform the general public what that might mean for them in their real lives”
How does a red rectangle do that?
Rud Istvan: “We were taught to scale meaningfully.”
Bingo!
Rud Istvan: “AW did not pull the same obvious trick you just did.”
Is -20 F or 120 F a meaningful global average temperature?
I ask because 120 F is 92 standard deviations above the max and -20 F is 115 standard deviations below the min. Have you ever created a chart with economic data with the y-axis scaled at such drastic extremes? Can you provide an example of where you did this?
The range of -20F to +120F is a reasonable range for global temperatures, from which the global average is calculated.
Can you tell me the last time the global average temperature was close to -20 F or +120 F?
Can you post a link to other examples where published graphs use a y-axis range of 115σ below the min and 92σ above the max?
The point isn’t that the global average temperature was ever close to those values, however humans regularly live in places where the temperature reaches those values at height of summer or winter
Matt Kiro said: “The point isn’t that the global average temperature was ever close to those values,”
Then don’t base the y-axis on something that has never come close to happening.
Matt Kiro said: ” however humans regularly live in places where the temperature reaches those values at height of summer or winter”
Which would be a fair point if the graph were of the temperature at a specific spot on Earth that did exhibit that kind of temperature range. But it’s not. It’s a graph of the global average temperature.
bdgwx ==> How about the scale of temperatures In Death Valley, California or any of the weather stations in the American West High Desert? Would that satisfy you?
That’s a high of 134 °F (56.7 °C), on July 10, 1913 down to a low of 15 °F (−9 °C) on January 2, 1913.
https://en.wikipedia.org/wiki/Death_Valley#Climate
KP said: “How about the scale of temperatures In Death Valley, California or any of the weather stations in the American West High Desert? Would that satisfy you?”
If you were graphing the temperature at Death Valley then absolutely. I’d even expand the y-axis by 1σ or perhaps even 2σ above and below the range.
If you were graphing the global average temperature then absolutely not.
bdgwx ==> We (Anthony and myself, anyway) are not just graphing GAST. We are trying to make a graphic representation of the changes in GAST that will properly communicate to the general public those changes in a way they can understand and which will properly commincate the true practical magnitude of that change.
Again, read Huff or read Cleveland on Huff and the importance of the purpose of a graph (or any representation of a statistic/metric) in how it should be scaled.
Despite having an issue with your justification I don’t actually have an issue with your choice or y-axis bounds. Like I said 5 C at least frames the GAT in the context of what was typical over the last 1 million years.
I have 3 major issues with Anthony Watt’s graph though.
It’s not even right. You can’t just add 52.7 F to every data point. It doesn’t work that way.It looks like the GAT is oscillating between 0 F and 59 F rapidly.It uses unreasonable y-axis bounds that are not even remotely typical or anything that like what humans experience.
Thanks MK.
He didn’t claim that global avg temps were close to -20 or +120F. Just that the average falls between those extremes. Which the last time I checked is pretty much true.
ClimatePerson said: “He didn’t claim that global avg temps were close to -20 or +120F.”
Actually the graph shows the GAT between 0 F and 59 F so it could be reasonably argued that it is at least close to -20 F. Let’s ignore that fact for a moment though. If the global average temperature isn’t close to -20 F or +120 F then why chose those as the lower and upper bounds for the y-axis?
ClimatePerson said: “Which the last time I checked is pretty much true.”
It’s also true that the global average temperature lies between -459 F and 212 F. That doesn’t make it a good choice for the bounds of the y-axis though.
My point is that “he didn’t claim that the global avg temp were close to -20 or +120F”. 57.2F pretty falls in the middle of that range. Mr. Watts choice of upper and lower bounds for the y-axis make sense to me, because they represent a range of temps that are actual extremes that the globe experiences. We don’t experience -459F and 212F in our daily existence so it would not be appropriate to choose such a range. It would be meaningless. In contrast, Mr. Stokes choice of upper and lower limits of national debt do not represent a reasonable range because our national debt is many factors less than what his y-axis depicts. You are free to prepare your own graph with any y-axis you wish.
ClimatePerson said: “Mr. Watts choice of upper and lower bounds for the y-axis make sense to me, because they represent a range of temps that are actual extremes that the globe experiences.”
No they aren’t. The global average temperature does not come anywhere close to -20 F or +120 F.
ClimatePerson said: “We don’t experience -459F and 212F in our daily existence so it would not be appropriate to choose such a range.”
What we experience is irrelevant. It’s not a graph of the temperature in your backward. It is a graph of the global average temperature. Nobody “experiences” the global average temperature.
ClimatePerson said: “Mr. Stokes choice of upper and lower limits of national debt do not represent a reasonable range because our national debt is many factors less than what his y-axis depicts.”
Bingo! It is similar to what I did with Greenland temperature proxy. By surreptitiously expanding the y-axis you can hide details like the fact that the Earth goes through glacial cycles.
Your attention to the GAT is misplaced. You are being used to propagate propaganda. If no place on earth experiences the GAT anomaly on an ongoing basis, then it can’t possibly be useful for indicating what people actually experience.
As electricity becomes less reliable and more and more expensive, people WILL start asking what is going on. They are going to ask for proof that their local “climate” has been experiencing untenable temperatures. The GAT anomaly is not going satisfy that need. Climate scientists should be preparing that information right now to prevent angry societies from exacting retribution. That is where your attention should be focused.
“In contrast, Mr. Stokes choice of upper and lower limits of national debt do not represent a reasonable range because our national debt is many factors less than what his y-axis depicts”
I agree. The range should be linked to the range over which the quantity varies, True for GAT also.
Nick ==> Perfectly true for a science paper but totally false for a graph for pubic consumption. Tiny tiny changes can be made to look HUGE for a quantity that varies very little over time.
Thus fooling the public into thinking that the change is BIG not TINY.
ref: Huff, “How to Lie with Statistics” (free .pdf)
This book is quoted extensively in Cleveland, btw.
This is a very elitist view. Let them eat crap.
The public has a right to be straight-forwardly informed. They can handle it.
Nick ==> Read Huff or Cleveland on Huff.
You just want the public to be informed of YOUR opinion on what you want to public to know. Ans ONLY your opinion.
The problem is that the GAT anomaly has little to no meaning for living.
A better metric would be what the major climate zones have experienced.
The best measure of change is using degree-days. Heating degree days, cooling degree days, growing degree days. Things like First Frost Dates or Last Frost Dates. These are pertinent to what people actually experience and plan for. They provide an indicator of what costs will be for heating, cooling, clothing, and food.
bdgwx ==> Several other readers have been asking some pooh-poohers to suggest what they consider a proper scale to communicate to the general public how big of a change the 1°C change (from the cold end of the LIA around 1850-1890) to now actually is.
What scale do you suggest we should use to show how big that change is so that my mother-in-law will understand it in practical terms? Or a sixth-grader in Kansas?
KP said: “What scale do you suggest we should use to show how big that change is so that my mother-in-law will understand it in practical terms? Or a sixth-grader in Kansas?”
The range of the global average temperature that is typical. Your 5 C suggestion is fine since it captures most of the range of the global average temperature over the last million years.
bdgwx ==> Well, that was a long time coming…..
KP said: “Well, that was a long time coming…”
It took me less than 2 hours to respond.
His response apparently just zoomed right over your head!
scale.
if there is a trend in the data, scale so that the trend is 45 degrees
this is a well known STANDARD in graphical presentations
That doesn’t make it a tenable thing to do. There are many “standards” and “traditions” that do not pertain to everything, all the time.
Your argument that a “standard” should take precedence over accurately portraying what people actually experience is simply part of the confirmation bias that pervades climate science.
Mosher ==> By your misguided rule, if my net worth (of say $500k changes over ten year by $2.21, I should graph it to show that $2.21 with a scale that goes up or down by 45°?
That’s how propaganda is made, sir.
That is not now truth is communicated.
Nope. That makes the lay person think that it is a big change. They will not look at the data, just the pretty picture.
your degree in economics should be revoked if you didnt study
cleveland
im a stupid english major but as a operations research VP
i knew enough to read the science
https://priceonomics.com/how-william-cleveland-turned-data-visualization/
Whoa, six!
Mosher ==> Re-read your Cleveland — he quotes Huff extensively and repeatedly, and explains why Huff says one thing and he recommends something different; The key the the purpose of the graph — different for a single issue science paper (say on the change in the ppb of cadmium in drinking water) than for a newspaper article trying to explain to the general public what, if anything, that means for them.
I have a finance MBA and wrote a for-profit economics newsletter for 43 years. Stern School of Business at New York University.
We were taught to scale meaningfully for good news, BUT never put bad news on a chart. Better to use text, or a table.
Some business professors were retired NYC businessmen rather than career academics. They seemed to spend too much time teaching us how financial statements and annual reports could be used to deceive people. None were named Madoff.
I’m guessing you read the excellent book, ‘How to lie with Statistics’ by Darrell Huff?
And in relation to this topic I recall Chapter 5 – The Gee-Whiz Graph.
Napoleon invades Russia graph. Wonderful. Unless you were there. The troops would have loved a little AGW.
Actually Napoleon was hoping for frozen rivers and hard ground to make progress, but he got caught out with a sudden and brief thaw. That bogged him down and it doesn’t help the narrative because where were the coal fired power stations that caused the thaw?
Read that book in the 1960s when in high school.
It was written in 1954
Rud,
That was taught in the good old days.
Nowadays, folks are inventing new ways to “mine” data, to score ideological points
Rud Istvan said: ” We were taught to scale meaningfully.”
I’m still waiting for an example of where the y-axis of economic data was scaled by -115 and 92 standards of deviation below and above the min and max respectively like the way Anthony did it. Can you provide such an example?
Yes. No other sources give the same scale as Nick
The key is to have a zero scale or close to it, and that’s what the temp rise should have too
I’m not worried about it. The government has a lot of assets it could sell off (that is, return to the private, productive, profit-making sector), before it had to auction off Yosemite.
don’t let Biden see that- or he’ll use it in his next election campaign /sarc
Negative 1000 trillion US debt Nic?
Why not start your scale at negative 1000 Kelvin?
What were data points doing down there? Negative debt would be surplus. I thought “maybe taxes collected bot not spent yet” but no, the scale was wrong. Possibly it was lazy-hurried copy-paste.
Actually I made the graph myself. Negative just means that people owe the government more than it owes them.
The government “owes” us money?
Since when? This sounds a lot like Marxism.
Really? I thought it was Trumpism.
TDS much?
Yes, why not? It is no less likely than -20F? The last glaciation was 45F.
This reminds me of an experience with my ex-wife while we were in college. She had to graph the results of her research for her Master’s thesis. The data was presented as 2 straight lines but they were very close together. Her advisor suggested she use semi-log paper to separate them. I kept telling her she had a straight line, no need for semi-log just change the scale. The thesis ended up with semilog.
I’m not an expert on graphs, but the y-axis on the national debt graph Mr. Stokes provided is clearly unrealistic. At least the y-axis on the graph Mr. Watts provided falls within temps that the globe actually experiences.
“falls within temps that the globe actually experiences”
No, the globe does not. Local places do, but the global average has been within a very narrow range, and when it departs from that range, big effects occur. At the last glaciation, the global average was about 45F, about 12F down from now. But the world was a very different place.
What big changes? Has there been any regional changes in rainfall such as a massive desert becoming lush forest and grassland like the Sahara 14 000 BSUV?
Your assertion has not been proven. We do know that half a degree of warming occurred in the temperature record before human emissions could have been responsible – in what is a dubious calculation of GTA. We can not tell from proxies if there where any 100 year periods of larger changes in the past 10000 years. It’s STUPID to assert that it never happened before human emissions became large enough to raise global CO2 levels, and yet it gets taught as The Science.
Agree: Proxies
Disagree: Small changes
Ask someone who sleeps on a sidewalk whether a few degrees matters.
The accuracy and locality of proxies seems a smaller problem than the general lack of data
Kevin ==> Quite right — but all of these choices depend heavily on exact circumstances, not only of the temperature but the circumstances of those (both humans and the rest of the plants and animals) experiencing it.
Florida winters are sharply defined by the local low overnight temperatures — really only important whether they are above freezing or below freezing (within a degree or two) 40°F is the same as 38°F or 42 or 45°F. But right above and below 32°F makes a real difference.
Average annual temperature makes very little difference to a farmer — and many do not care much about winter lows — they expect them. They care about length of their growing season and when they can get their tractors on the fields in the spring.
There is a great deal of nonsense going around about “global” and “national” and “regional” “average temperatures” which may mean nothing whatever to people, plants, animals living there.
“Average annual temperature makes very little difference to a farmer”
Averages tell you nothing about the climate. Different climates can have the same average temperature. Anomalies don’t help at all.
“They care about length of their growing season and when they can get their tractors on the fields in the spring.”
Yep.
As pointed out in my second comment. It’s pretty small compared to the variation in temperature during a period of the day when the temperature would be considered constant.
I know that I can feel the difference around 18°C, and probably would around 37°C on a very humid day, of a degree change. I would still rather support donation of a polar fleece to every homeless person before blowing up a coal power station.
What local people experience is what is important. If you are attempting to blame a globally well-mixed gas, i.e., CO2, then it should be affecting local conditions globally along with a global change. When GAT is continually the only change being promoted, you end up with headlines all around the globe proclaiming that local temperature growth is exceeding the GAT. That means the GAT IS NOT considered an average but instead is thought of as a baseline. That is exactly what climate alarmists expect to happen so that money flows to entrepreneurs’ pockets.
You could also do a plot of national debt in units of millicents. It would only look meaningful when compared to something like GDP change, in the same units.
The anomalies on a plot from 0 K to 300 K would be something that you could have a dig at, but not a justifiable scale like temperature changes that occur over a day.
My local station recorded a highest half hour reading of 22.9°C at 3.30 pm, yesterday. There was also a recording of 22.5°C at 7.00 pm. In between, it dropped to a lowest reading of 21.4° C at 5.30 pm with quite a few changes in half an hour of about a degree C, or 2 degree F. To top it off, the official maximum was 24.0°C. Basically, there was a spike in between half hour readings of a degree.
So even on a scale of 3°C of the noise in temperature measurements during the hottest part of the day, the half a degree increase since 1978 in UAH looks insignificant.
The Bidet Maladministration has started using debt chart !
The graph in the article goes from -20 to 120F, roughly -30 to 50°C. In any typical year I’ll experience -20 to 35°C so that scale seems appropriate to me.
When in God’s name has the federal government, any federal government been 100’s of trillions in the black???
Even with the current levels of insane spending, when will the US reach a quadrillion dollars of debt?
An appropriate scale would have been -1 to 50 trillion dollars (10^12 in North American usage).
This whole discussion shows that Dr. Joseph Goebbels was a genius.
Why don’t we use the Kelvin scale so we can reference global warming against Nature’s definition of temperature? Chart is attached.
Anthony,
Your article disproves the climate hysteria. It is a game changer
You deserve a Nobel Prize
As usual: deliberately obtuse🤣
It’s a matter of scale perception, as if you didn’t already know. When the global warming is shown relative to the temperatures we normally experience, it’s not so scary. Makes the power grab by globalists such as yourself more difficult.
The last glaciation had an average temperature of about 45F. Doesn’t sound so bad, relative to temperatures we normally experience. But it made a big difference.
Clown !!
45F vs 57.2F
… and you go manic over a change of 1F or so.
Your mind is malfunctioning, yet again !
No. AS you see from AW’s graph, we have gone from 56.5F to 59F. No-one is going manic over that. But the warming will continue.
Remarkably, around 1900, Arrhenius gave the global temperature as 15C (59F).
“But the warming will continue.” How long will it continue to warm and by how much, Nick?
What impact will that warming over the timeframe specified have on Earth’s flora and fauna? On Man’s industrial societies? Will it be net beneficial?
I hope that you’re not expecting an answer
Good questions. I bet you don’t get an answer.
They are questions that skeptics will never accept the answers to because they always have the “it’s not happened yet” to fall back on. But if you read the reference supplied by Finalnail it is pretty comprehensive and does offer likely answers (given all available data) going forward.
See Climate Change 2021: The Physical Science Basis, Summary for policymakers. Section B covers all these questions.
That’s a purely dark vision- don’t take it too seriously.
A quick recap to avoid people having to scroll up and down the page.
Nick Stokes (NS), original bald assertion :
“But the warming will continue.”
Dave Fair (DF), questions in response :
i) “How long will it continue to warm and by how much, Nick?”
ii) “What impact will that warming over the timeframe specified have on Earth’s flora and fauna?”
iii) “[ What impact ] On Man’s industrial societies?”
iv) “Will it be net beneficial?”
TheFinalNail (TFN), reacting to DF’s questions :
“They’re all answered in section B of the SPM.”
– – – – –
Section B of the [ AR6 WG-I ] SPM starts with :
1) Please explain how the SPM in general, and section B in particular, answers any questions about how the Earth’s climate system “will” evolve in the future.
– – – – –
In my copy of the SPM searching for the strings “flora”, “fauna”, “plant” and “animal” each resulted in “Phrase not found” errors.
2) Please copy any part of the SPM, not just section B, that details what “will” happen to “the Earth’s flora and fauna” as a result of “continued warming” to the end of the 21st century.
– – – – –
Attached is a screenshot of Table SPM.1 (section B.1.1, page 14).
3) Please explain how this shows precisely how much warming “will” happen in the near future.
– – – – –
PS : At the end of the “Box SPM.1.1” paragraph (on page 12) :
The “effects” on human societies form part of the inputs to the SSPs, not part of the outputs.
The IPCC admits that they don’t even attempt to quantify just how likely various assertions about what “will” happen in the future may be.
Here is the chart that matches AW’s article:
Figure SPM.1 | History of global temperature change
Bam!
Oh, please, TFN. UN IPCC CliSciFi models? Not even the modelers believe them anymore.
Nick claims he is psychic. The Final Nail lets the IPCC be psychic for him.
The final nail writes “See Climate Change 2021: The Physical Science Basis, Summary for policymakers. Section B covers all these questions.”
How exactly does it address the question of whether there will be a net benefit?
There are no benefits listed whatsoever.
There has been global greening but that’s not mentioned. There is projected to be increased rainfall but the focus is on flooding. Every change is put in the context of “bad” and yet people and agriculture are doing better and better.
“How long will it continue to warm and by how much, Nick?”
It will warm until we can’t stand it any more. Then we’ll seriously try to stop it, but that will take a long time.
Great crystal ball you have there.
Now do the lottery numbers for next week.
“It will warm until we can’t stand it any more. Then we’ll seriously try to stop it, but that will take a long time.”
No more ice ages? That’s nice to know for the survival of the human race!
Many people will love it. I think the effort to end fossil fuels will continue “until we can’t stand it any more”.
Nick, you aren’t even trying anymore. Why?
I have never once seen Nick claim that there is a climate crisis or a climate emergency.
Because he’s got nothing.
I think it will warm until the people who hold the power are threatened with loosing it unless they do something. I read a great quote once. “Politicians know what to do about climate change, they just don’t know how to do it and get re-elected.”
”I think it will warm until the people who hold the power are threatened with loosing it unless they do something.”
Religion.
There’s no evidence CO2 is causing any discernable warming and there is no evidence that human beings have any control over the behavior of the Earth’s weather and climate.
It’s unsubstantiated assumptions all the way down. THIS is alarmist climate science in a nutshell.
”It will warm until we can’t stand it any more. Then we’ll seriously try to stop it, but that will take a long time.”
Religion.
I dunno. I think worldwide drumming and dancing while throwing virgins into volcanoes has merit.
That will work about as good as trying to reduce CO2.
Some of us have spent yrs reducing the number of virgins available for sacrifice …
so its our fault the world is in a calamitous state !!!
“until we” Lots of older folks would happily stay in NYC if they did not need snow shovels.
Nick ==> Good heavens What science says: “It will warm until we can’t stand it any more.”
The IPCC certainly doesn’t.
How ridiculous! No Evidence! A fact-free assertion.
“Will it be net beneficial?” for whom?
Ask yourself what even a 2C increase in both Tmax and Tmin will do to heating and cooling degree days. What will it do for growing degree days. Those are the measurements that people live and die with, not a global anomaly.
Nick
Specifically, what is the proof that ‘the warming will continue?”
Surely it depends on your scale of time.
If it is sunrise, it is likely that warming will continue for some hours.
If it is spring, it is likely that warming will continue to mid summer.
If it is a time like the Little Ice Age, it is likely that warming will continue until the next ice age begins.
On longer time scales, there are many points in time that can be chosen to show it warmed after them.
But, there are also about as many points when it cooled after them.
What was the point of your comment? Geoff S
“But the warming will continue.”
Nick says with such confidence.
He’s loyal to the faith.
Only psychic people make predictions. It’s a skill, not a religion.
But the warming will continue.
Are you sure?
Whether the warming continues, how much it warms (or doesn’t), how long it warms (or doesn’t), etc. has nothing to do with human activity, so all we can “do about it” is adapt to the changes. Just like always.
I’m very sure….
”I’m very sure….”
Religion.
Have you just learnt a new word today?
”Have you just learnt a new word today?”
Yes. Twonk. Do you like it?
Love it. Describes you beautifully.
That’s not evidence, Simon. It’s pure speculation.
All we get from alarmist climate science.is pure speculation.
Alarmist Climate Science has created one heck of an ecosystem out of pure speculation. And mindless, knee-jerk reactions to pure speculation about CO2 is the result. But it pays good for those in the know.
I hope it continues here in New England, a land that is cold and damp most of the year- with a foot of snow due to arrive tonight. I have a note in my Peterson’s Field Guide to Wildflowers dated early March, 1973 where I noted all the species I saw that day.
Nick has just claimed that he has psychic powers.
No need to name call
The last glaciation had very little change in the tropics. The change away from the tropics was much greater. Kind of highlights how averages can be misleading. Summer average maximums must have been 40°F lower in some areas heavily populated now, but frozen over then.
The increase from 1880 to 2020, 140 years, has been about 2F, which is hardly noticeable by the average person.
So, mankind will be forced, by some powerful nut cases, Biden included, to spend at least $150 trillion to reduce that increase to 1F?
How much longer can this CO2 hoax go on?
I have lived near Woodstock, Vermont, for 35 years
Willis prepared a graph of the Vermont low temps from 1980 to 2020, 40 years.
It shows, the lows increased 3F over 40 years
Spencer’s sidebar graph also shows an exaggerated scale.
He should show an additional graph with a -20F to plus 100F scale, which would cover most of the planet
Low of -137 F to +135 F. high would do it since 1890.
“the lows increased 3F over 40 years”
Hardly enough!
The NASA way is an attempt to scare people. Antony’s is more realistic since it places the data in a context that suggests how scared they should be, which is not at all. It is all about perspective. I guess Nick feels threatened by the one that shows little threat.
AW’s graph implies that there is an expectation that the global average temperature could be down to -20 F or up to 120 F. Do you think those are realistic?
The average temperature for where I live is 51 F. (Max low -37 F max high 98 F) So I don’t experience the 57.2 F that is stated for earth.
This demonstrates the folly of even saying there is an average world temperature.
AW’s graph is of the global average temperature; not the temperature where you live. Anyway, I’ll let you have that conversation with AW regarding the folly of him saying there is an average world temperature.
There is no thing as a global average temperature, which is a statistical fiction and not a real physical value.
I’m going to let you pick that fight with Anthony Watts.
“There is no thing as a global average temperature”
In fact, it is rarely published – AW basically had to make it up. What is published, and is meaningful, is the global average temperature anomaly.
An anomaly is useless without knowing the variance that goes with it. Why is the variance of the average global temperature anomaly never mentioned. An anomaly is useless without knowing the measurement uncertainty that goes with it. Why is the measurement uncertainty of the average global temperature never mentioned?
Which, in use, is simply a way to hide the fact that the average faux-world temperatures reflected in the various UN IPCC CliSciFi models vary by 3℃. The physics of a 12℃ world is vastly different than the physics of a 15℃ world. Even then, the anomaly differences make pretty spaghetti diagrams showing how much the different models vary in their production of fanciful “projections.”
No, you have that quite wrong. The graph shows the extreme temperatures that might be experienced by an individual at some random location on earth.
It’s not a graph of temperatures at some random location on Earth though. It is a graph of the global average temperature. So the question is…have humans experienced global average temperatures that are close to -20 F or +120 F?
Where on the graph do you see temps approaching -20 or +120F?
Lop the graph off at +60 and you will still have the same picture showing almost an imperceptible variation in the top of the data. same for the bottom.
Stop being a troll.
bdgwx ==> Ah, come on. You already know that NO ONE does or even could experience a global average temperature. You are being silly — like my five-year-old grandson….he says things like that to make people laugh knowing they are absurd.
Humans do experience temperatures, where they stand, that range from -20 to +120 though.
“Ah, come on. You already know that NO ONE does or even could experience a global average temperature.”
Isn’t that the whole problem? This article wants to conflate global annual temperatures, which no one actually experiences, with the entire range of temperatures that any person might experience at a single moment in time.
Global averages don’t work like that. A change of a couple of degrees at a single location might be barely noticeable to an individual at a single location, but could mean catastrophe on a global scale when the global average changes. See the 1690s in Europe for example.
Bellman writes “Global averages don’t work like that. A change of a couple of degrees at a single location might be barely noticeable to an individual at a single location, but could mean catastrophe on a global scale when the global average changes. See the 1690s in Europe for example.”
Can you please explain why local changes are OK but when all the local changes are averaged, it becomes a catastrophe?
It’s a bit ironic you point to the LIA as being an example of catastrophe. And Europe is neither regional nor global so no points there.
KP said: “Ah, come on. You already know that NO ONE does or even could experience a global average temperature.”
Of course I know that. I’m the one trying to explain it. And I’m glad you agree. Can you help me explain it to Anthony Watts?
KP said: “Humans do experience temperatures, where they stand, that range from -20 to +120 though.”
Which would be a fair point if Anthony Watts had published a graph of the temperature where he lives. But he didn’t. He published a graph of the global average temperature [1].
[1] Technically he didn’t accomplish that; at least not correctly since he just added 57.2 F to each anomaly which is wrong because the anomaly baseline isn’t 57.2 F for every month. Every month has a different baseline.
That is not AW’s purpose and you know it. It is an explanation of what should be shown to people so they can make a KNOWLEDGABLE decision. When anomalies are far less that what people experience daily, monthly, and seasonally, they should not be exaggerated to give the perception that something else is occurring. That is propaganda!
It’s 142 red line thermometers in a row, with each thermometer showing the average absolute temperature for one years. What could better communicate temperature to the average person than an old fashioned red line mercury thermometer?
Answer: Nothing communicates climate change better than this type of absolute temperature chart. I have an alternative version of the chart that is easier to read and includes the CO2 level, at the link below. It is definitely better but both charts convey the same message. THERE IS NO CLIMATE EMERGENCY.
Th an omaly charts that have a rage of 1.5 to 2.0 degrees C
continued ,,,
I have an alternative version of the chart that is easier to read, and includes the CO2 level, at the link below.
Honest Climate Science and Energy Blog: Global warming and CO2 levels with honest charts
“My” chart is better, but both charts convey the same message. THERE IS NO CLIMATE EMERGENCY.
Th anomaly charts, that have a range of 1.5 to 2.0 degrees C., visually exaggerate small changes in temperature, so they are DISHONEST charts, including the UAH chart and the USCRN chart on the home page.
In the long run, the historical temperature data are not that important, other than showing the average temperature is always changing. We’ve always known that. People also know when the climate is pleasant (warm), and when it is unpleasant (cold) without any thermometers or average temperature statistics,
Historical temperatures are not that important because predictions of the future climate are barely related to any past temperature trend. Not even resembling the cherry picked 1975 to 2015 warming trend.
Predictions of the future temperature are based on a theory of CAGW, first defined in the 1979 Charney Report, that can be simply described as AGW x 2 to AGW x 4.
In plain English, a future global warming rate is predicted that is unrelated to any temperature trend in the past 150 years. And since 1979, that CAGW prediction has been wrong.
But the predictions of climate doom continue. And they would continue even if historical temperatures were perfectly accurate, and always presented on easy to read absolute temperature charts.
Climate scaremongering is unrelated to climate reality.
And if there was no leftist climate scaremongering, there would be leftist scaremongering about some other boogeyman, whether real or fake.
Leftism needs four tactics to gain power and control:
(1) One or more boogeymen
(2) Censorship
(4) Brainwashing in schools
(3) Dependence on government handouts
Add four more tactics to get to totalitarianism:
(5) Election fraud
(6) Persecution of political opponents and political prisoners
(7) Dividing people into hostile groups (i.e.; Blacks vs Whites)
(8) Ruin everything that works in the economy so that people demand that their governments “do something new ”
If you consider all eight tactics, you will realize they are all in progress now. And the primary boogeyman, now that the Covid epidemic is over, is CO2.
Temperature values here in the graphs really should be given in Absolute Temperature Values. That scale starts at 0… like all scales used in scientific measurements. That would reflect the very LOW % the temperature changes here represents.
_____________
Absolute Temp Values reminds me of the S-B 4th Order Negative Feedback (LWIR Radiative Cooling) after warming up any object…or after warming an Atmosphere…or a Planet.
In the Stefan-Boltzmann Law Equation Temperature Values are “Absolute Values”…. that law reveals that the theorized 3+° warming from a CO2 Doubling… will Naturally INCREASE LWIR radiation from the Atmosphere bc/o that Warming.
(BTW, the 3+° warming is in fact below 2° from “Doubling CO2” per… just about every serious scientist studying “Climate Sensitivity”).
(BTW, we will never actually achieve a “DOUBLING of CO2… in the 1st place per Spencer).
That increased re-radiation from warming the atmosphere will be on the order of 16 W/m^2 (directly from the S-B Equation)… or several times greater than the ~3.8 W/m^2 LWIR “CO2 + Hydrological” Back-radiation that caused the initial “greenhouse” warming (with the “several-fold” Hydrological Amplification of the meager DIRECT CO2 Effect…still Unproven AND Unobserved).
That defines a limit condition created by a Natural Negative Feedback phenomenon… where a forcing creates warming… BUT THAT SAME WARMING creates natural radiative cooling of a greater amplitude than the radiative warming from the original forcing.
The IPCC quit discussing the Stefan-Boltzmann Negative Feedback… a long time ago… as it relates to increasing Outgoing LWIR that always results from warming… any thing…like an Atmosphere or a Planet.
DocSiders: “The IPCC quit discussing the Stefan-Boltzmann Negative Feedback… a long time ago”
It is mentioned by name (“Planck response”) 25 times in chapter 7 alone of the newest AR6 WGI report.
+1. The warmer you make something the more it radiates, by T^4.
There seems to always be the assumption in climate science that the back radiation “heat” stays permanently in the system.
Yes, CO2 might impede radiative loss but as the earth warms the radiative loss starts off at a higher level so you get more initial radiative loss than before it warmed. The decay may not reach quite the minimum level as before which is why Tmin is going up but the increase in Tmin won’t be equal to the initial temperature rise during the day.
The GAT can’t tell you this because it loses all of the information on temperature variance.
Griff has suddenly departed, however.
No loss, he’d just drop some article link about the “climate crisis” and then run for cover, never replying. That was his M.O. to avoid debate and factual correction.
I reckon that the exercise of setting up a personal login facility in order to comment here was beyond Griff’s technical skills.
See, just copying & pasting blocks of text from Guardian articles (as Griff used to do) didn’t take much proficiency.
Plus, the Guardian had hired a monkey who identified as a climate scientist to absorb Griff’s duties here into its multi-tasking repertoire.
Plausible, but Steven Mosher still posts.
Ouch!
And still usually runs away
He stopped commenting in other places too which is a relief as he was a poor supporter of the stupid climate crisis nonsense.
Dear Anthony,
There is a problem with all this in that the many individual Australian datasets reported on at http://www.bomwatch.com.au and the many more (some 400 or so) that I have examined, there is no trend or change that is not explained by site and instrument changes.
Preceded by a methods case-study based on Parafield near Adelaide (https://www.bomwatch.com.au/data-quality/part-1-methods-case-study-parafield-south-australia-2/), I have recently published a series of reports on data homogenization, thus-far focused on ACORN-SAT sites (Australian Climate Observations Reference Network – Surface Air Temperature) in northwest Western Australia.
I am working-up several more sites and it is clear from multiple perspectives that trend embedded in Australia’s national temperature trajectory is due strictly to the methods used by BoM scientists to homogenise data from which it is calculated.
It is also apparent that as all global temperature datasets use variations of the same methods they are all likely to result in approximately the same trends.
Biases in methods used by the BoM are, (i) they adjust changepoints that make no difference to the data, or fail to adjust those that do; and (ii), they use comparative methods – comparisons of target-site data with data for correlated neighboring sites, that are not themselves homogeneous.
It is a simple recipe that allows the BoM to produce the trends required by policymakers and activists, so they can reinforce their narrative. However, on a station-by-station bias, the trends don’t exist.
Yours sincerely,
Dr Bill Johnston
(scientist@bomwatch.com.au)
How much of the increase in Anthoy’s chart is from the homogenisation process?
Certainly more than the 0.5F in the Menne paper.
Some GISS adjustments are well over 1.5C, just look at any of their Charts which show both Raw and Final values.
I addition to the prior adjustments. re-adjustments, infilling and homogenization. NASA-GISS has announced that starting April 1, 2023, they will begin pasteurizing their temperature numbers.
Republicans in Congress have suggested an alternative to reduce spending: Estimate the average temperature, to save the huge expense of all those measurements, that get corrupted by repeated adjustments of the data … until it is “right”. Cheaper to just pull a number out of a hat.
This post is serious, not satire.
Richard ==> Give us a link please?
“It is also apparent that as all global temperature datasets use variations of the same methods they are all likely to result in approximately the same trends.”
Worth noting.
This must be right. If when you plot the individual stations there is no trend in them, then any trends which are in the calculated results from homogenizing and averaging readings can’t be trusted.
10 yard penalty for encouraging a comment from Mr. Stroker
The best climate and energy website just got better.
But .. I featured a NASA-GISS absolute temperature chart on the home page of my old Honest Global Warming Chart blog, from 2014 to January 24, 2023.
That honest chart so upset most leftists that they immediately got angry and decided to stop reading.
On January 25, 2023, when I replaced three old blogs with one new blog called Honest Climate Science and Energy, I deliberately left off the absolute temperature chart on the home page, since so many people went berserk when seeing it in the past. I will post it on the blog every few weeks. This is what my chart looks like:
Honest Climate Science and Energy Blog: Global warming and CO2 levels in one honest chart
Leftists are dishonest about almost everything about climate and energy:
Anomaly charts that make one degree C, look huge
Climate predictions that are always wrong, since 1979
Scaring children with always wrong predictions of climate doom
Making false claims that can be contradicted by their own government data
Demonizing CO2, the staff of life for our planet.
Failing to recognize there was no global warming in the past eight years
Blaming almost everything on climate change, from cancers to warts
Claiming bird and bat shredders and solar panel deserts can power electric grids
I may have missed a few, but most important to me:
Failing to recognize that the current climate appears to be the best climate in the past 5,000 years, since the Holocene Climate Optimum ended.
As if to prove my point:
I began reading the comments and noticed that leftist (I assume) Nick the Stroker saw the absolute temperature chart, which will just be a tiny chart on the home page from now on, and went berserk.
One correction: There were other warm periods (aka other “Climate Optimums”) that occurred after the Holocene Climate OPTIMUM, all of which were also warmer than, and therefore by definition better than, the current warm period (aka Optimum).
I don’t believe an average of local climate reconstructions shows enough warming to be sure those periods were warmer than the past 10 years.
Averages of local proxies, to simulate a global average temperature, tend to reduce temperature variations.
The result is a “global average” of less than +1 degree C, warming, usually closer to +0.5 degree C. … which seems too small to be sure those\ periods were warmer than in the past ten years.
The Holocene Optimum reconstructions, when averaged, are at least +1 degree or 2 degrees C. warmer than the past 10 years, so I assume that period was very likely to have been warmer than in the past ten years. Sea level reconstruction studies suggest the Holocene was warner too.
I absolutely love this idea, Anthony. I love it so much that I decided all temperature records should be presented this way, so I’ve reworked the Vostok temperature record into an absolute temperature series using the same axis scaling you’ve used:
It’s so wild to me that when you see this you realize that ice ages don’t exist! Look at that – barely any temperature change at all.
Nick and AlanJ make a valid point and failing to acknowledge that does nothing for the skeptic cause. The 0-120 scale is somewhat deceptive and does not provide the proper context. The anomaly graph isn’t any less deceptive. The proper context is to plot the average global temperature in relation to habitability for humans and other species.
I would suggest the following conceptually: The scale should be approximately 40F to 80F. There should be a horizontal blue line across the graph at 45F labeled as “ice age”, “snowball earth”, etc. There should be another horizontal green line across the graph at 70F labeled “dinosaur times”, “whole world is Hawaii”, or some such.
There should be some accompanying discussion indicating that to cross the blue line means the end of life as we know it, mass extinction of most species, etc. It should also be mentioned that heading in this direction is dangerous and has positive feedbacks, i.e. increased albedo (snow cover) leads to more cooling. Heading towards the green line may require some adaptation, but in this direction the feedbacks are negative, i.e. more cloud cover also increases albedo and provides a cooling effect, so the temperature tends to asymptote.
Concepts to communicate to the public:
If we have produced sufficient warming of the planet to avert the next glacial inception, we will have attained a greater technological achievement than landing a man on the moon. I remain unconvinced.
Alan ==> We would not expect much change at VOSTOK during an Ice Age. The important changes are VOSTOK temperatures showing up in areas closer and closer to the equator.
“aimlessly”?
Salute!
Somehow we must force the activists to use real temperatures and tides versus all the “anomaly” crapola.
If they wish to make a point by magnifying a few decades or even centuries, great.
But I am no stranger to charts and graphs and correlations and…. I had to portray any referenced scale and time and …..
These anomaliy graphics need to show period and then a big picture graphic depicting last few hundred years or even a thousand years.
Gums sends…
Tony Heller gets a bit one note on the “adjustments” GISS did to achieve the global temperature graph. In short, what was not adjusted was made up to fill in missing data.
I did a deep dive on the general issues Heller raises. He is mostly right, but his presentations can sometimes be a bit off center. See essay ‘When Data Isn’t’ in ebook Blowing Smoke for my then take.
Thanks.
I recall two years ago, when I wanted graphs like this, I found only a symbolic one.
Go to Richard Lindzen. Back when he was still an MIT prof, he posted stuff illustrating these things various ways.
The GISS “surface data” have also been adjusted beyond recognition. Super El Nino of 2015-16 was only a tiny fraction of a degree warmer than SEN of 1997-98. GISS has erased hhe pronounced spike that year, while also disappearing the Warming Pause following it until 2014.
Yes, the GISS fraudsters demoted 1998. This then allowed them to claim the following years were the “hottest year ever!”. Something like 10 years betweeen 1998 and 2015 were declared the “hottest year ever! by the temperature fraudsters at NASA Climate and NOAA.
But if you look at the UAH satellite chart you will see that none of the years between 1998 and 2016 can be described as the “hottest year ever!” because none of them are hotter than 1998.
The UAH satellite chart:
NASA Climate and NOAA are lying to the American people.
Don’t forget the fraudsters at RSS, HadCRUT and JMA. They also agree with GISS. Only UAH must be believed! Everyone else is a fraudster, out to promote the big bad…. whatever it is!
Temperature fraudsters agree with each other. What a surprise.
Tom… but then along came 2016 and I reckon that will be broken in the next 5 years. How sure are you that it will stop warming? Serious question.
”Tom… but then along came 2016 and I reckon that will be broken in the next 5 years.”
Religion.
Only an idiot would bet against a new record happening in the next few years. Hi Mike….
“How sure are you that it will stop warming? Serious question.”
Well, I can’t be sure, Simon. I’m just going by the historic record, and as far as I can see, the historic record shows that the temperatures warm for a few decades and then they cool for a few decades and they do so within a narrow channel of about 2.0C from warm to cool and back again.
Global cooling is now taking place even though more CO2 is going into the atmosphere, and admittedly this has only been for a short time, so the jury is still out, but it is cooling when climate alarmists claim it should be warming due to increased CO2.
If temperatures were to exceed the 1934 highpoint (0.5C warmer than 2016) in the near future, then I would have to re-assess my position. From the looks of things, that doesn’t seem likely to me.
1934 high point? Are you talking about the old US graph. I meant globally.
Temperature impacts locally. Temperature is a problem at the extremes. Historically its been the extreme lows that are the most problematic. Nobody dies from a global average.
The 1997 NOAA global temperature was declared to be 62.45F actual (+0.42f Anomaly).
Proof
https://www.ncei.noaa.gov/access/monitoring/monthly-report/global/199713
And 1998 was at least 0.5F hotter.
Proof
https://www.ncei.noaa.gov/access/monitoring/monthly-report/global/199813
Why are you plotting it in Fahrenheit and not Kelvin??? All radiation physics requires Kelvin.
Well “Jane”… it is pretty simple, really.
1. This is about graphs for public consumption.
2. Nobody uses Kelvin scale except science, and even then, not often (Almost never) when discussing climate science.
3. The public doesn’t understand Kelvin scale. Since this is about educating the public, Kelvin scale would be counter-productive.
4. The article isn’t about “radiation physics.” Put bluntly, nobody gives a shit in this context, especially me.
The chart does look a bit odd with the bars’ low end on 0 not the axis’ -20. Maybe just a line would be better?
But the important thing is that you have created a sensible graph.
5. When you have a vertical range, it matters not in the least what units you use. Use -30C to +50C, or 244K to 322K, the shape of the graph will be EXACTLY the same.
Your graph simply expands the vertical range from the extremely compressed range of the “doom” graph to the actual range of human experience.
Of course, the doomsters also play games with the horizontal range – that is an even better way to make a scary graph. (I could take the last two weeks of weather here in Tucson and create a REALLY terrifying graph. We had two inches of snow on the ground in my back yard last weekend – this weekend, I’m in shorts and short sleeves with the A/C running in my office. Even on your vertical range, I’d have a line going almost straight up. My mesquite tree will catch fire sometime around Tuesday…)
It’s great…really bites the watermelons…rivals the classic thermometer view (following) also from WUWT a few years back. Sorry not sure who contributed it.
DMac == I like that one!
Yeah, at my house in sunny Alberta this AM, -19 C. I know where that is on the thermometer, and I didn’t bother asking anyone what “anomaly” that was….supporting Anthony’s scale choice for practical temperatures….
“Anthony” The big problem with those kinds of plots is the average member of the public immediately turns that variation into a percentage change (of about 4%), even though the ‘zero’ of the Fahrenheit scale has no physical meaning. The vast majority of the public on this planet, including many at WUWT, uses Celsius which makes the perceived percentage variation even worse.
P.S. It is ALL about radiation physics. It has been for the last 13.8 Giga years. School children are supposed to have done the Kelvin scale by 9th grade.
Good morning Jane. Here in California I can assure you the school children have not heard of “Kelvin”. In addition, most of our school children probably have never seen a thermometer let alone know how to read it. We’ll need to reach the kids where they are by telling them climate change makes better rap music, that’s settled science.
Some kids might have heard of Kelvin.
https://gachax.com/path-to-nowhere/character/kelvin/
Ah, but you can bet the little darlings have learned about the wide range of “genders” they can arbitrarily choose by the seco0nd grade!
Jane ==> And while climate of Earth is “all about radiation physics” at its very root scientifically (ask Will Happer, Richard Lindzen or Willie Soon), Climate Change may not be.
We know very little about what makes the planet’s climate change — some of it is solar radiation and change in that — much of it is the unknowns and much more of it is chaotic (Chaos Theory issues) which most understand even less.
I was at school/ college when the UK changed, in 1962, from Fahrenheit to Celsius so can cope with both. I don’t know about the ROW but anyone in the UK born after about 1960 won’t know Fahrenheit and the majority won’t be able to point to the freezing point of water.
Could Celsius not be added so the young, those most influenced by this nonsense have something familiar to work with?
I fear it’s not that simple. Fahrenheit still gets used a lot, especially when newspapers want to talk about how hot it is during summer.
I remember as a child in the 60s being puzzled when we would go swimming and would be told the pool temperature was 98 degrees or so. I assumed that was Celsius and spent some time assuming it was quite possible to swim in near boiling water.
But in the UK Fahrenheit is not used and any reader of the comments in the Daily Mail when temperatures are given in Fahrenheit will know that that doesn’t go down well. Giving them on Réaumur would be about as good.
Countries using Fahrenheit
United States, Belize, Palau, the Bahamas and the Cayman Islands and Canada uses both I think.
If you want to influence people you have to give them something they are familiar with
Here is a presentation in K
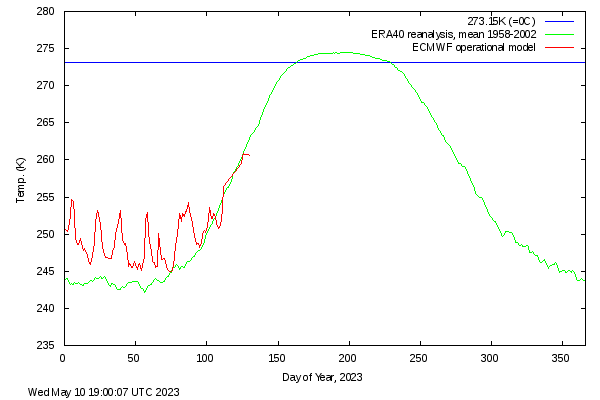
I have a Kelvin absolute temperature chart (second chart at the link below) which is not useful because it looks like a straight line. And that is a deception.
Honest Climate Science and Energy Blog: Global warming and CO2 levels in one honest chart
No the straight line is not a deception. The graphs in TENTHS of a degree, when most of the instrument temperature record was recorded in FULL DEGREE increments, is a deception.
People understand the freezing point and boiling point of water, and temperatures 20’C below them.
Absolute zero is an abstract concept to 99.9% of the population
So given error bars we don’t know what the temperature was in 1850, eh? So IPCC’s 1.5degsC above 1850 catastrophism is cxap, then? But Dublin’s Prof Kelly has already said that. Keep very calm
Given the accumulated measurement uncertainty associated with multiple single measurements of different things we don’t know the actual temperature today let alone in 1850.
There is no reasonably accurate global average before 1979
Too much infilling
Poor coverage of the Southern Hemisphere, especially before WW2
1800s are just a very rough guess of the average Northern Hemisphere temperature, not fit for science.
None of the “instrument temperature record” is fit for the purpose of measuring “climate” and never will be. It was never intended for that purpose and is unfit for it; between scant coverage, instrument, enclosure and location changes, and increasing urbanization of station sites, the error bars are much bigger than the supposed amount of “change.”
A single value for temperature rather than an anomaly to show a trend is also next to useless.
The Greenland plateau has warmed the most of any region in the past 70 years. And the warming has been significant with January temperature up almost 10C; from -30C to now nudge -20C in just 70 years. That is serious warming over such a short time frame and probably detectable by most humans over a lifetime if they happened to live there.
NASA’s 2017 to 2021 temperature change shows dramatic warming in the Arctic:
https://www.nasa.gov/press-release/nasa-noaa-to-announce-2022-global-temperatures-climate-conditions
What is does not highlight is that the greatest warming is occurring in winter.
The only way a place that does not get sunlight can get warmer is by advection. That inevitably involves increased snowfall and the snowfall data highlights that fact:
https://climate.rutgers.edu/snowcover/chart_seasonal.php?ui_set=nhland&ui_season=4
The Northern Hemisphere has to warm up a lot more before the snowfall overtakes the snowmelt around 2200. The NH will eventually cool down as permanent ice cover expands south.
There is nothing new in what is being observed apart from the fact that some clowns think it is caused by CO2 rather than the sun.
“A single value for temperature rather than an anomaly to show a trend is also next to useless.”
We get single values for both. Both useless.
I suppose you would notice that change – if you time how long before ice forms on your eyebrows. Otherwise, there’s not much difference between DAMN cold and damn cold.
This is the essence of global warming when you look under the hood.
The ocean surface cannot sustain a temperature above 30C. That is a hard cap set by atmospheric dynamics. But there will be a lot more ocean surface in the NH getting to 30C. Regions like the Mediterranean will experience monsoon conditions – already happening. The US east coast will experience increasing rain depressions as cyclones spin further northward. But the big change will be a lot more fall and winter snowfall.
There are only two regions currently gaining ice extent – Greenland and Iceland because they are surrounded by water. The permafrost is still advancing northward but that will change by 2200.
The temperature homogenisers in Australia are having to work overtime to keep a warming trend going because peak sunlight is declining over Australia. Antarctica and the Southern Ocean are already cooling and the South Pacific is near trendless. The Nino34 region has a slight cooling trend over the satellite era.
“The only way a place that does not get sunlight can get warmer is by advection.”
Arctic warming, which is only in the colder months of the year, can be caused by ocean tide changes, continuous dark soot falling on the snow and ice, other albedo changes from melting sea ice and CO2 emissions, except in winter months when there is a temperature inversion.
Your paragraph is confusing. How does ice melt in the colder months of the year?
Arctic warming causes expanded:
Ocean tides heat transport from warmer areas, and ocean tide changes
Dark soot constantly falling on the ice and snow, mainly in the six warmest months of the year
(albedo change)
Sea ice melting, mainly in the six warmest months of the year
(albedo change)
CO2 increase reducing upwelling infrared radiation. — The CO2 increase will actually cause Arctic cooling when there is an Arctic temperature inversion, Which is most common in the Fall and Winter
Unknown causes of Arctic winter warming.
All these possible causes of Arctic temperature change add up to significant warming in the six colder months and roughly no change in the six warmer months.
The grey uncertainty shading on Figure One is a mathematical dodge that is unable to be connected to reality. It uses statistics on some numbers that are not measured, but are made up to fill in missing data.
Nobody can prove that the temperature in 1880 had a 95% confidence level of +/- 0.1 degree C. That is larger than the ability to read a thermometer then. For SST it is greater than the adjustment applied for differences between bucket samples and samples from ship engine intakes.You cannot combine samples from different populations like land and sea that have different physical responses, for uncertainty calculations. One use of uncertainty statistics is to point identify separate populations that need separate uncertainty estimates.
The author(s) of Figure One has violated the fundamental concepts of statistical methodology in which a sample has to represent the larger population from which it is drawn. Read the text books.
Fundamentally, one cannot apply real world uncertainty statistics to values created by people but not observed on measuring instruments.That would be deliberate scientific fraud. Geoff S
It’s not obvious that you can even combine observed temperatures on measuring instruments. The variance of temperature data distributions are different in winter than in summer and are different for each hemisphere. When you combine these distributions you wind up with skewed final distributions where the “mean” tells you almost nothing. These variances carry over into the anomalies so the use of anomalies doesn’t help one iota, you still wind up combining distributions with different variances.
Not sure if I understand what you mean by “combine”. But I do know that if I take a temperature measurement at my house, and another one 10 miles away, averaging them would not give you anything meaningful, since each measurement in this case is an intensive property of the site. And averaging intensive properties is a no-no.
This has to do with whether you are taking multiple measurements of the same thing and then combining the measurements into a data set VERSUS taking single measurements of different things and then combining those single measurements into a data set.
In the first scenario, if all of the measurement uncertainty is totally random then the average of the measurements approaches the “true value” of the thing being measured.
In the second scenario, you have different measurands and their average does *not* approach a true value. Think of an example where you have 100 6′ boards and 100 8′ boards. Their average is 7′. But you have no boards of 7′! The average simply can’t be a “true value”.
When you are measuring different temperatures (Tmax and Tmin) you are measuring different things. When you use them to calculate a median value there isn’t any way it can be a “true value”. You can certainly calculate the median value but it is not even an “average” since the two values come from different distributions (sinusoidal vs exponential decay) and when you combine them you get a skewed distribution where the average does not equal the median.
In addition you are exactly correct, temperature is an intensive value. Enthalpy is what should be used. We’ve had the ability to calculate enthalpy for at least two decades but climate science refuses to join 21st century.
Especially as the SH was woefully underrepresented. (Jones, J Mclean)
The Southern Hemisphere was represented enough for us to get an idea of the temperature profile since the end of the Little Ice Age, and that profile shows it was just as warm in the Early Twentieth Century as it is today. Both the SH and the NH show this temperature profile when viewing raw, unmodified surface temperature charts.
That means CO2 is not the control knob of the Earth’s atmosphere since there is much more CO2 in the air today than there was in the Early Twentieth Century yet it is no warmer today than it was then.
That’s why NASA Climate and NOAA fraudulently modified the surface temperature record to make it appear that the temperatures have been getting hotter and hotter and hotter for decade after decade and the present day is the hottest time in human history, all due to accumulations of CO2 in the atmosphere.
Below is a comparison of two charts with very different temperature profiles. One is the U.S. regional temperature chart (on the left) and the other one is a bastardized Hockey Stick global chart.
All the unmodified regional temperature charts from around the world, including in the Southern Hemisphere, have a temperature profile similar to the U.S. regional chart which shows that the Early Twentieth Century was just as warm as it is today (1998 and 2016 are statistically tied for the warmest years in the satellite era-1979 to the present).
None of the unmodified regional charts from around the world have a temperature profile like the bastardized Hockey Stick chart.
So, going by the evidence, which temperature profile is the correct one for the Earth? The one that shows up in all the charts from around the world, or the one created in a computer that looks nothing like the temperature profile of the regional charts?
When I look at these anomalies I can only shake my head.
What is the average temperature in Saudi Arabia? In equatorial Africa? If humans have survived there for millenia then exactly what is scary about a few degrees higher in South Dakota?
Make that eons, not just millennia!
If they can’t actually measure the current temperature correctly, how can they “model the future? — Well its impossible isn’t it..
This is a very important topic. Some adds.
“Anomalies are useful ONLY for things like comparing temperature trends”
They aren’t really even useful for this purpose. The minute you calculate the median daily temperature you lose the variance of the underlying temperature profile. When you combine those medians to create monthly baselines you further hide the variance of the temperature profiles. By the time you are done you really don’t know what the actual trend of anything is.
Winter temps have higher variance than summer temps. When you combine summer anomalies in the NH with winter anomalies in the SH, e.g. for the month of August, you are not combining like populations. The result you get tells you little about what is actually happening.
This doesn’t even address the measurement uncertainties which compound since you are measuring thousands of different things using thousands of different devices.
I agree on the limited value of anomalies.
Once you are determining uncertainties, you have entered into grubby detail that offers little understanding. Examining the uncertainty of anomalies is looking at noise. Completely useless exercise.
The important trends are quite evident once you get past a single temperature anomaly that hides reality. The most striking trend is the warming of the land in the NH in winter. That relies on warmer northern ocean surface, which is responding to increasing solar intensity in May and June.
” Examining the uncertainty of anomalies is looking at noise. Completely useless exercise.”
I disagree. When you properly propagate the measurement uncertainties the measurement uncertainty of the anomalies is wider than the anomaly itself. In other words you simply don’t know what the actual value of the anomaly is. When you combine the anomalies into a data set you are truly unable to actually determine what the trend is. If the measurement uncertainty of the anomaly is +/- 1C then how do you determine a trend line dependent on differences in the hundredths digit? You simply don’t know where in that +/-1C interval where the anomaly actually lies.
The uncertainty of the anomaly is much more than just “noise”.
Without hockey stick graphs, the trendologists have pretty much nothing. Bankrupt.
Not to mention that measuring “devices” at different “stations” IN THE SAME TOWN provide different “readings,” often FULL DEGREES APART, while they feed us a “global” temperature “anomaly” down to TENTHS OF A DEGREE.
It’s a joke and the so-called “data” isn’t remotely fit for the purpose of measuring “climate” changes.
Rud, the average Man cannot perceive the truth on any subject when governmental lairs maintain all the data and produce every official report.
The U.S. Founding Fathers created a system of checks and balances such that separate Legislative, Executive and Judicial branches were set into opposition of each other. As feared by the Founders, development of factions (political parties) short-circuited such checks and balances. Now, for example, if you are a Democrat Party partisan in a Federal Deep State agency you will rubber stamp anything desired by a Democrat Party-controlled Legislature, no matter the clear language of enacted legislation. Similarly, a Democrat Party Supreme Court Justice will interpret the Constitution in ways favorable to Democrat Party controlled Legislature and Executive branch Deep State.
Continued 5/4 SCOTUS split decisions are an indication of a politicized Supreme Court and an inditement of the legal profession in general. It is incomprehensive that decisions of great societal import can be decided by one or two appointed judges and enforced on the entire country. Only recently have such decisions been sent to the various States and their peoples’ to make such momentous decisions as dictated by our Constitution.
Dave,
What you’ve described in your second paragraph has been the development over the past century of a fourth branch of the Federal government that is not accountable to the electorate. As such, it actively supports whichever political party, currently the Democrats, that most favors the expansion of government power. It can only be brought to heel if a future administration can designate all Federal employees who are capable of effecting policy or rule making as ‘at will employees’ who can be hired and fired by the President.
The “second paragraph” is an attempt to explain that all three branches have concentrated on ways to “balance” the accumulating Central power among themselves and completely ignored the “checks” aspect that the founders intended.
You are describing the “bureaucracy”, i.e., the “deep state”. I learned this back in the 70’s in a political science class.
What is the main goal of a bureaucracy? TO GROW! As they expand, more employees are added, and the management class grows and guess why this happens? More pay for supervising more employees. All the incentives are for more employees and more and more problems to solve.
The National legislature has abandoned the citizens and have learned to participate in growth of government! Unless this is stopped, we will end up with pure socialism and a government that works like the one described in Orwell’s book, 1984.
Earth temperature is 9°C colder than 14°C due to earth’s land not being flat.
14°C is based on sea level earth. Every square meter on earth is not at 2 meter height. But GISS avoids absolute temperature so nobody ever asks how they get this number. Fear of seeing how limited coverage of the earth exist in their record. Scrutinizing there whole narrative of human induced global warming. Below is temperatures associated with 15°C.
19 latitude columns
8 longitude rows
From North pole to south pole.
-18 + 23 = 5 + 23 = 28 (correct)
0 + 15 = 15 + 15 = 30 (Incorrect)
-18 + 32 = 14 + 14 = 28 (incorrect)
5.3°C x 16.5 latitudes = 87.45°C 957w-m² (correct) + visible light 403w-m² 1360w-m²
14°C x 16.5 latitudes = 231°C 3658.51w-m² (incorrect) + visible light 403m² 4061w-m²
I don’t see that this is anything to do with anomalies vs “real” temperatures. You can get just the same effect with anomalies, just by expanding the y axis.
You can get the same visual result more credibly by just expanding the Y axis by mid latitude weather deltas averaged across 12 different months to just show actual monthly variation. Lindzen did something similar for Boston March/April over a decade ago. No need to go multiple tens of degrees.
I was using the same scale as in this article.
Why don’t you try posting a graph like this at The Guardian, or WAPO, or NYT?
Because – a) it’s not my job. And b) because it’s not a meaningful way of presenting data.
and c) – it wouldn’t look scary at all.
It’s not your ‘job’ to post here either, yet here you are.
Could you point that out to those who think I’m being paid handsomely to post here.
Thus making a graph that the peasants can easily see is no cause for alarm. Thus drying up all of that sweet, sweet taxpayer money. And forcing Bellman, Stokes, Mosher, etc. to find some other con game to run.
Would love to know how to get all this taxpayer money, just by making some observations here.
Just drop a line to –
Mr. G. Soros
C/- Covering Climate Now
https://coveringclimatenow.org/partners/partner-list/
“Thus making a graph that the peasants can easily see is no cause for alarm”
I am reminded of Lewis Carroll’s Bellman:
He had bought a large map representing the sea,
Without the least vestige of land:
And the crew were much pleased when they found it to be
A map they could all understand.
“What’s the good of Mercator’s North Poles and Equators,
Tropics, Zones, and Meridian Lines?”
So the Bellman would cry: and the crew would reply
“They are merely conventional signs!
“Other maps are such shapes, with their islands and capes!
But we’ve got our brave Captain to thank
(So the crew would protest) “that he’s bought us the best—
A perfect and absolute blank!”
There is some merit in trying to convey information.
Yes, it’s that passage that was one of the main inspiration for using Bellman as a pseudonym.
There seems to be a real assumption here that if you can’t see any warming, than the warming can’t see you.
You don’t realize it but you just proved AW’s entire point!
What? The point that it doesn’t matter if you use anomalies or “real” temperatures, what matters is using a sensible scale? That point?
Here’s the graph of CET on the same scale, using real temperatures. Converted to the antique F scale. Does the Little Ice Age at the end of the 17th century look so scary now?
So the bottom line is –
no matter how these temperature graphs are constructed or presented, they offer no real-world, usable information to people living day-to-day anywhere on this planet.
Any averaging of temperature over any period or any area is pointless and straight out wrong if not compensated for area pressure, wind direction, wind strength and type of surface it has travelled over, hunidity and elevation above sea level.
All these parameters affect temperature and yet have not been shown to have been used anywhere. The wind above all is a significant factor as well as pressure which has a direct relationship with temperature
What you are describing is that *enthalpy* should be used, not temperature. Temperature is a very poor proxy for enthalpy.
The entire climate science industry needs to join the 21st century and move to using degree-day integrals of the entire temperature profile. It’s what agriculture and HVAC professionals use today. Climate science is 20 years behind the times.
Very true. If you compare the temperature of Hong Kong and Mexico City on any given day or year without accounting for elevation let alone the other parameters it is meaningless.
That is also why a “global” statistic is worthless. Local and regional temperature changes are the pertinent things we should be looking at. And, Tavg is a joke. Tmax and Tmin should be examined separately.
I used the term “statistic” on purpose. That is what sampling should give you if proper assumptions are followed. You can make inferences about the population parameters from the samples. There are very specific assumptions that must be met in order to do this. Climate science meets none of these.
Sampling NH and SH as if they are the same is wrong. Not only are the temperatures vastly different because of summer and winter but the variances are different also. Likewise, as you point out, different locations have different distributions of temperature because of landscape. That is like sampling Clydesdales and Shetland ponies and saying the averages converted into anomalies tells you something about either either population.
Or combining coastal stations subject to ocean winds (like Boston) with stations in the Great Plains. Vastly different variances in temperature – but “average” anomalies won’t tell you that.
Excellent idea, Anthony. Hopefully, it will open a few eyes.
While I realise that this is a US-produced web site, most of the world uses centigrade for temperature measurements and Anthony’s blog is definitely a World-wide viewed site.
Using centigrade would make the graphs look less alarming (as 1.8F = 1C) and should be of benefit when attempting to calm other’s perception of any future c(lim)atastrophy.
John ==> Here’s Anthony’s money chart with degrees C added on the right side;
Really scary. It implies global temperatures could some day rise to 50°C or fall to -30°C.
Did you not wonder why AW indicates a range of 0 F to 59 F for the global average temperature? Do you think the global average temperature went all the way down to 0 F each and every year from 1880 to 2022?
That is not the purpose. Maybe you don’t, but most of the population converts information like this into percentages. Are they getting 1/3rd or 1/8th of a pizza? Is their gas mileage 10% better or about the same? Are we getting more snow or rain in terms of percent and not inches that averaged? Is a tip worth 10% or 20%? Is inflation 10% or is it 24 cents in today’s dollars?
You are obviously an academic who focuses on the minutia provided by data shown in inflated decimal points. Sooner or later people will no longer believe the propaganda. Woe to those who promoted it and profited from it.
14°C is based on sea level earth. Every square meter on earth is not at 2 meter height. But GISS avoids absolute temperature so nobody ever asks how they get this number. Fear of seeing how limited coverage of the earth exist in their record. Scrutinizing there whole narrative of human induced global warming. Below is temperatures associated with 15°C.
19 latitude columns
8 longitude rows
From North pole to south pole.
-18 + 23 = 5 + 23 = 28 (correct)
0 + 15 = 15 + 15 = 30 (Incorrect)
-18 + 32 = 14 + 14 = 28 (incorrect)
5.3°C x 16.5 latitudes = 87.45°C 957w-m² (correct) + visible light 403w-m² 1360w-m²
14°C x 16.5 latitudes = 231°C 3658.51w-m² (incorrect) + visible light 403m² 4061w-m²
Why is the lower limit of the Y Axis -20°F ?
Why is the upper limit of the Y Axis 120°F ?
Why is the “Global Warming in the Scale of Human Temerpature Experience” shaded starting at 0°F?
Surely “Human Temperature Experience” should be from the lowest to highest recorded atmospheric termperatures.
i.e from -126°F (Vostok) to +136°F (Libyan Desert) and the shading should begin at that -126°F, not at 0°F
Stu ==> The whole point of Anthony’s re-scaled chart is to show that at a human discernible scale, the warming is hardly noticeable.
See images above with the warming scaled against US OSHA’s recommended range for office temperature, a real life range experienced by millions of Americans, five days a week.
The UK and EU all have similar, though slightly different accepted ranges.
Oh heck, here it is again:
Cool
Do you think there may be a difference between global temperatures and office temperatures? Would it worry you if global temperatures fall by 2.5°C, even though that’s comfortable in an office?
Would it worry you if the average temperature in South Dakota goes up by 2.5C?
I asked first. Would you worry if global temperatures were to cool by 2.5°C?
I wouldn’t worry one bit. What do you think the average temp in Alaska is for locations close to the Arctic circle compared to the average temp today in SD? Lots of people live in climates that are 2.5C colder than SD.
But if the global “average” temperature falls to 2.5 then a huge chunk of the globe is in real trouble… Alaska particularly so.
Why is a huge chunk of the globe in real trouble?
Where are the chunks?
Much of South America and Africa would see their annual average temp fall from 25C-28C to 23C-26C. That’s bad?
Huge chunks of the globe already have people living in -5C-5C annual average temp. A drop of 2.5C would make those areas uninhabitable? Why aren’t they uninhabitable today?
bellman: “ cool by 2.5°C?”
Simon: ” falls to 2.5″
Do you have a reading problem? Or are you just a troll?
“I wouldn’t worry one bit.”
Fair enough. You personally wouldn’t be worried about returning to Maunder Minimum type conditions. But it’s a constant worry for many on this site.
Why do so many trumpeting about climate change simply refuse to understand that humans can adapt?
Those with summer vacation homes in northern MN may have a problem using it or selling it. So what?
Why are people leaving CA and NY for TX and FL? Adaptation doesn’t *have* to be just for climate change but it shows that adaptation *is* possible!
“Why do so many trumpeting about climate change simply refuse to understand that humans can adapt?”
I think people can adapt. What makes you think I don’t? The question is, should we do things that require adapting, is so what and how. I’m sure we can adapt to a new ice age, but I’m not sure I’d look forward to it.
Why do people move from hot to cool zones? Why do they move from cool to hot zones? Don’t both require adapting? Should they not move at all but always stay where they were born so they wouldn’t have to adapt?
“Why do people move from hot to cool zones? Why do they move from cool to hot zones?”
Lot’s of reasons. Economic, political, to avoid persecution, or just because they prefer a different climate.
“Don’t both require adapting?”
Of course. Not sure what point you are making, as usual.
“Should they not move at all but always stay where they were born so they wouldn’t have to adapt?”
Unfortunately that seems to be the way the world is heading, with more and more walls and fences. I’d much prefer it if there was unlimited freedom of movement – but the more people move to avoid cooling or warming the more difficult that becomes.
You are the one that said “should we do things that require adapting”.
You appear to have some cognitive dissonance going on.
Meaning, is it better to avoid making changes that require adapting, or better to leave things as they are and not require adaptation? It’s not meant to be a trick question. It can apply to many different things and may have different answers in each case.
bdgwx ==> We do not know what the GAST was in 1690 — we can’t even guess to within a few degrees. We do know that Europe and North America had much colder winters, and coll, not hot, summers. Certainly not in single digit degrees Celsius. We only know relatively….
I think you mean me rather than bdgwx.
“We do not know what the GAST was in 1690“
Indeed not. But there are many here who just assume CET is a good proxy for global temperatures at the time. At the least it would seem unlikely that global anomalies were lower than CET. the main question is to what extent the cold was confined to northern latitudes or how much it was a global phenomenon.
But, whatever. The question still remains, would you or anyone else here, be worried about the possibility of global temperatures dropping by 2.5°C?
I would! Warm climate IS BETTER. That’s the big lie -the notion that “warming” is “bad.”
Anthony ==> I have often used just the spread of acceptable temperature from OSHA for Office Temperatures.
The above is Global Temperature Anomalies since 1880, with the vertical scale set to a spread of 5°C – the range recommended by U.S. OSHA for office temperature comfort.
So-called disastrous global warming fits very comfortably in the mid-range of OSHA recommended temperature setting for offices in the United States.
See mine https://wattsupwiththat.com/2023/02/03/reprise-why-i-dont-deny-confessions-of-a-climate-skeptic-part-1/
It wasn’t long ago that you told us that one cannot average temperature. Yet, here you are posting a graph of the global average temperature which is based on monthly station averages which are based on Tmin and Tmax observations that are themselves averages. There is a whole smorgasbord of averages going on in your graph there. What gives?
It’s called “hoisting the climate scientists on their own petard”.
Brilliant! OSHA approved global temperature range!
It would be more meaningful to show the global monthly temperature with a scale just below the lowest monthly value and just above the highest monthly value like the attached.
This gives the sense of what is being experienced. Attached is land only. Arguable if most people are experiencing ocean temperatures as well. Including ocean will reduce the range and increase the average.
It does show that the minimums are increasing more than the maximums. In fact the maximums have levelled off in the past decade.
Throw in a 13-month moving average to give it a trend. Just recognising that most of the warming is due to higher minimums reduces any sense of alarm.
You may have missed the discussions of Average and Global
Kudos Anthony, this is so important, I have wanted something like this for so long.
Anthony,
I calculated your y-axis scale at 115 standard deviations below the min and 92 standard deviations above the max.
Do you think that choice is meaningful?
Have humans ever experienced a global average temperature of -20 F?
Have humans ever experienced a global average temperature of 120 F?
Most humans have experienced either -20F or +120F, and many have experienced both in the same year. Humans do not “experience” average temperatures, much less “global average temperature”.
Perhaps you can tell AW that humans don’t “experience” the global average temperature and that setting the y-axis based on human “experience” is a bad idea?
No, it shows how meaningless the variations in GAT are wrt human experience. People often discuss angels on a pinhead or the dimensions of elephant eggs.
You just said that humans don’t “experience” the GAT. Now you’re saying that the variations are meaningless wrt to what humans experience. Which is it? Do humans “experience” the GAT or not?
“There are 3 kinds of lies: lies, damned lies and statistics”, Mark Twain
And you get all of them in alarmist climate science.
For the first thirty or so years of my life the local temperatures were given by the Australian BOM in degrees F then in 1972 they switched to degrees C.
It’s odd but sometimes I still quietly use the internet to convert their forecasts from C to F to get a better idea of how hot or cold it is really going to get.
I just double the C and add 30 to get close enough. The next day’s guesses are never more accurate than that anyway.
The temperatures we use every day, Fahrenheit or Celsius, are also anomaly temperatures. The true temperatures are absolute (Rankine and Kelvin). If you compared our customary temperatures to absolute temperatures, you’d get the same effect as what you posted. It’s all relative.
Regarding “in the last 40 years, we’ve had a series of El Niño weather events that have warmed the Earth; for example, 1983, 1998 and in 2016.”: Although the 1998 and 2016 El Ninos are the greatest ones since the one of 1878 (years stated being when the global temperature spikes of these mainly happened), there is the matter that El Ninos have been happening all along. A recent WUWT article says that according to NOAA, we have never since 1950 gone more than 4 years in a row without an El Nino. Going to images.google.com and typing in ENSO index graph shows plenty of graphs going back to 1950, with significant El Ninos as far back as in the 1950s. And, it’s well known there were two significant ones causing global temperature spikes during WWII.
If one wants to blame a natural phenomenon for rapid global warming from the mid 1970s to shortly after 2000, there are multidecadal oscillations. I calculated that a natural cycle existed that held up for two periods with period of 64 years, with peak to peak amplitude of .208 degree C and peak years of 1877, 1941 and 2005 (in HadCRUT3, back when I did this calculation in 2009.) (El Ninos seemed to have been a little more of a thing around these peak years, although there is the Atlantic Multidecadal Oscillation. AMO affects north-south heat balance, and AMO’s north-warming phase is a global warming phase because the Arctic has high regional positive feedback.) So, multidecadal oscillations are a likely cause of about .2 degree C of the global warming from the mid 1970s to shortly after 2000, and also causing a global warming slowdown from shortly after 2000 through now, and that I expect to continue through the 2020s and probably into the 2030s. And after that, I expect a few decades of global temperature rising fast enough to temporarily stop its shortfall of predictions by the median of the CMIP3 and CMIP5 models for RCPs 4.5 and 6.0, I figure about .3 maybe .4 degree C short, and in the remainder of this century I expect the falling behind to resume and I expect the shortfall to increase a little more, perhaps .45 – .5 degree C.
“Regarding “in the last 40 years, we’ve had a series of El Niño weather events that have warmed the Earth; for example, 1983, 1998 and in 2016.”: Although the 1998 and 2016 El Ninos are the greatest ones since the one of 1878 (years stated being when the global temperature spikes of these mainly happened), there is the matter that El Ninos have been happening all along. A recent WUWT article says that according to NOAA, we have never since 1950 gone more than 4 years in a row without an El Nino. Going to images.google.com and typing in ENSO index graph shows plenty of graphs going back to 1950, with significant El Ninos as far back as in the 1950s. And, it’s well known there were two significant ones causing global temperature spikes during WWII.”
Yes, El Nino is not the control knob of the Earth’s atmosphere. The temperatures cooled by about 2.0C from the 1950’s to the 1970’s, all the while, El Ninos were coming and going, while not preventing the temperatures from cooling over the decades.
No, something else is the control knob. It’s not El Nino or CO2.
Hansen 1999, showing the cooling:
You claimed 2 degrees C of cooling from the 1950s to the 1970s, and showed a graph with 5-year-smoothed temperature only decreasing about .75 degree C, and that’s from a short term peak to a short term dip. Meanwhile, the 1999 and older versions of NASA GISS temperature determinations don’t account for station moves from downtowns to airports during the middle of the 20th century and also US temperature trends have deviated from global temperature trends, although there is slight actual global cooling from the early 1940s to the mid 1970s.
I’ve gone over all of this with TA already especially the fact this particular graph does not take into account the time-of-observation change bias, station relocation bias, station commissioning/decommissioning bias, instrument package change bias, etc. I’ve linked to the NASA documentation and publications. I don’t think TA wants to hear it.