Does the start date of Willis Eschenbach’s comparison graph, his Figure 5 (my Figure 1 below), in his recent post at WattsUpWithThat titled “How The El Nino Is Changing”, impact the trends toward La Niña conditions? Answer: Yes. A 9-year earlier start date flattens the trends.
INTRODUCTION
Initial Note: The title of Willis’s recent post at WUWT caught my interest, because it was ENSO related. As you may recall, back when I was blogging regularly, for many years, I wrote many dozens of posts that were cross-posted at WUWT about the El Niño Southern Oscillation, and the coupled ocean-atmosphere processes that drive El Niño and La Niña events, and the aftereffects of those events. In Willis’s post, I was hoping to find analyses and documentation of ENSO coupled ocean-atmosphere processes to show how those were changing. But what did I find? A comparison graph of ENSO indices with linear trends and a curious start date.
So, with that in mind, let’s take a look at that comparison graph, Willis’s Figure 5, which I’ve included as my Figure 1, below. His caption for that comparison graph reads,“Figure 5. LOWESS smooths of four El Nino indices, along with their straight-line trends. El Niño conditions are more positive, La Nina conditions are more negative.”

Figure 1
First: When I was blogging regularly, I had been examining, preparing, and posting graphs of ENSO indices for many years so the first thing that stood out to me was the start year, just before the 1980 hashmark. That caught the attention of at least one other person commenting on the post at WUWT, because most ENSO indices include many decades of data prior to 1980. See the comment by Richard M here and my comment here. Willis’s response to those comments about the start year was that he wanted to include the newest ENSO index, the Multivariate ENSO Index (MEI), and that its data began in 1979.
Second: Notice in Willis’s graph that color-coded index for the curve and trend for the Southern Oscillation Index data is incorrectly identified as the “Southern Ocean Index”. Also note a second typo. NOAA has a NINO3.4 Index, not a NINO34 Index.
Third: Willis has inverted the off-equatorial Southern Oscillation Index (SOI) data. Normally, Southern Oscillation Index (SOI) data is presented without being inverted so that El Niño spikes are downward and La Niña spikes are upward, which is the opposite of how they appear with the other indices. Of course, he inverted the SOI data so that he could include that off-equatorial ENSO index in his comparison graph.
Fourth: Following his Figure 5, Willis states in the text of his post:
“You can see the peaks representing the big El Ninos around 1997-98 and 2015-16. Recall that according to my thermoregulatory hypothesis, the Pacific should be trending towards a more La Nina condition which is more negative.
“And all four indices, in varying amounts, show this exact outcome—in response to the slow gradual warming since 1980, we have more La Nina conditions cooling the planet.”
I had never heard of Willis’s “thermoregulatory hypothesis” prior to reading his recent post (linked above). Therefore, it will be up to you readers to comment on whether the flattening of the trend lines when the data for the ENSO indices starts in 1970, as shown in the graphs below, has any impact on his “thermoregulatory hypothesis”. I also have a question for you readers about the above quoted paragraphs from Willis’s post. Why did he identify the strong 1997/98 and 2015/16 El Niños, but not the strong El Niño of 1982/83, or the strong one of 1987/88 (portion of the 1986/87/88 El Niño), or the strong 1991/92 El Niño? Those other three El Niño events all exceeded NOAA’s +1.5 deg C threshold for a strong El Niño.
Fifth, regarding the start year of Willis’s graph, I stated in a comment on that WUWT thread that the 1980 (1979) start year was curious, considering that it was a few years prior to the strong 1982/83 El Niño. Further on that thread, I suggested to Willis that he exclude the data for the Multivariate ENSO Index (MEI) and he start a set of reference graphs in 1970 to include the La Niña dominant early-to-mid 1970s in an effort to see what happened to the trends. I advised him that I would present them, if he chose not to. He chose not to, as far as I know, so I did. They follow.
So, let’s start the presentation.
A FEW NOTES ABOUT THE FOLLOWING GRAPHS
The following three pairs of time series graphs are provided to show the easily discernable flattening of the trend lines when the start date for the ENSO index graphs is changed from 1979 (used by Willis Eschenbach in his post at WUWT) to 1970. In the graphs starting in 1970, the strong 1972/73 El Niño and the three La Niña events (one moderate, two strong) in the early-to-mid 1970s really stand out in the graphs of the ONI and NINO3.4 data…not so much in the SOI data.
Why did I use 1970 as the start year? The early to mid 1970s are dominated by La Niña events, as are the most recent years. In other words, with the 1970 start year, the graph starts and ends in periods dominated by La Niña events, making it difficult for anyone to accuse me of cherry picking the start year.
I didn’t use any smoothing on the data in the graphs. That would reduce the magnitude of the ENSO variations and make the trends appear greater by comparison. Additionally, as I presented the data for each index individually, there was no need to standardize the data. As a result, the graphs are of data as provided by the suppliers, which are linked in the following discussions.
OCEANIC NINO INDEX (ONI) GRAPHS
Figures 2a and 2b present the unsmoothed monthly Oceanic Nino Index (ONI) data (data here), with 2a starting in January 1979 and 2b with the data starting in January 1970. With the 1979 start (Figure 2a), there is a noticeable trend from positive values to negative, but with the 1970 start (Figure 2b) the trend line flattens greatly.

Figure 2a

Figure 2b
NOAA NINO3.4 INDEX GRAPHS
Figures 3a and 3b present the unsmoothed monthly NOAA NINO3.4 Index data (data here), 3a with the data starting in January 1979 and 3b with the data starting in January 1970. With the 1979 start (Figure 3a), there is a very minor trend from positive values to negative, but with the 1970 start (Figure 3b) the trend changes sign to a very minor trend from negative to positive.

Figure 3a

Figure 3b
SOUTHERN OSCILLATION INDEX (SOI) GRAPHS
A reminder: The noisy, off-equatorial, sea-level-pressure-based Southern Oscillation Index (SOI) data shows El Niño events as downward spikes and La Niña events as upward ones…the opposite of the sea surface temperature-based ENSO indices. Figures 4a and 4b present the unsmoothed monthly Southern Oscillation Index (SOI) data (data here), 4a with the data starting in January 1979 and 4b with the data starting in January 1970. With the 1979 start (Figure 4a), there is a noticeable trend from negative (El Niño) values to positive (La Niña) ones, but with the 1970 start (Figure 4b) the trend flattens very noticeably.

Figure 4a

Figure 4b
A FINAL GRAPH: UNSMOOTHED MULTIVARIATE ENSO INDEX (MEI) DATA SHOWS SOMETHING VERY CURIOUS
Figure 5 presents the unsmoothed monthly Multivariate ENSO Index (MEI) starting in January 1979 (data here). A couple of things stand out: Note how the strong El Niño of 2015/16 has a lesser peak value than strong 1982/83 and 1997/98 El Niños, while with the sea-surface-temperature-only-based ENSO indices (ONI and NINO3.4 Index) show the 2015/16 El Niño peaks at a higher value than the other two. Note also how the La Niña events toward the end of the MEI data have much greater negative values than the ONI and NINO3.4 data, while toward the beginning, the La Niñas have lesser negative values.

Figure 5
The MEI data appears very skewed toward a negative trend compared to the sea-surface-temperature-only-based ENSO indices; therefore, the next time some alarmist says that strong El Niños are growing stronger due to global warming show them a graph of the MEI data.
CLOSING
In closing, here’s a very brief introduction to El Niño events from one of my recent short stories. It was also included in a 2019 post here at WUWT:
Most news stories about El Niños call them unusual warming events in the eastern tropical Pacific Ocean, off the west coast of South America. They’re the cause of the huge upward spikes we see in the global surface temperature graphs.”
They are much more than just warming events, and, further, regardless of what the numbskull science reporters say, there’s nothing unusual about them.” … “Magnificent would be a better word. Here are the facts. El Niño events occur every two to seven years. El Niños are the most-amazing, and the most powerful, weather events ever devised by Mother Nature. How powerful? El Niños are often kick-started by series of tropical storms in the western tropical Pacific.
Further from that post:
El Niño and La Niña events act together as a chaotic, naturally occurring, sunlight-fueled, recharge-discharge oscillator, with El Niño events acting as the discharge phase and La Niña events acting as the recharge phase...
I hope you enjoyed this post. Have fun.
Regards,
Bob
Originally posted at Bob Tisdale — Climate Observations
Useful to have Bob’s confirmation that there were more La Ninas relative to El Ninos during the 60s and 70s cooling spell and then again more recently.
That tends to support my suggestion that the balance between the two phenomena is solar related.
Wavier jet stream tracks involve more clouds so that less solar energy gets into the oceans and El Ninos weaken relative to La Ninas.
To get wavier jet stream tracks it is necessary to alter the gradient of tropopause height between equator and poles.
To alter that gradient requires a change in the balance of the stratospheric ozone creation/destruction process above the equator as compared to above the poles.
It appears that solar variations involving changes in the mix of particles and wavelengths from the sun do have a differential effect on stratospheric ozone amounts above equator and poles.
The relevant finding back around 2004 was that contrary to expectations the quieter sun was associated with an increase in ozone above 45km over the poles whilst there was a decrease below 45km over the equator.
“Wavier jet stream tracks involve more clouds so that less solar energy gets into the oceans and El Ninos weaken relative to La Ninas.”
A wavier jet stream is negative NAO/AO which means slower trade winds and more El Nino. The mid 1970’s saw very strong solar wind states driving a positive NAO/AO regime, causing multi-year La Nina and a colder AMO, and colder SST’s outside the tropics increase low cloud cover.
Stephen Wilde wrote, “Useful to have Bob’s confirmation that there were more La Ninas relative to El Ninos during the 60s and 70s cooling spell and then again more recently.”
Curiously, Stephen, the graphs in this post start in 1970 and 1979, not the 1960s.
Regards,
Bob
You said in the text that the early to mid 70s were a time of more dominant La Ninas.
The early to mid 70s were during the 60s and 70s cooling spell.
Just doing some late cleaning up things on this thread after 3 days of responding to comments:
Stephen Wilde replied, “You said in the text that the early to mid 70s were a time of more dominant La Ninas.”, and in a later comment, “The early to mid 70s were during the 60s and 70s cooling spell.”
All you have to do, Stephen, is to look at the Oceanic NINO Index table to see that the 1960s were dominated by El Nino events, not La Nina events.
Climate Prediction Center – ONI (noaa.gov)
And that contradicts your initial comment on this thread, which read in part, “Useful to have Bob’s confirmation that there were more La Ninas relative to El Ninos during the 60s and 70s cooling spell…”
Please stop twisting my words to suit you conjectures, Stephen.
the two processes are utterly arbitrary human inventions.
hence the use of an index as a “metric” as opposed to real units with physical dimensionality
Consciousness is an utterly arbitrary human invention but we can appreciate it.
Noting connections in weather patterns related to sea surface temperatures in a given area is hardly an arbitrary invention. People in California or Australia realize the reality of ENSO influence on weather.
And even a senior meteorologist in Pakistan opined that La Nina had an influence on this year’s heavy monsoon season and attendant flooding.
“are utterly arbitrary human inventions.”
As is AGW.. what is your pointless point ?
“utterly arbitrary human inventions.”
Having worked as a mouthpiece for BEST..
… Mosh would know exactly what “utterly arbitrary human inventions.” were.
BEST is riddled with them.
It occurred to me that El Ninos are actually global, ocean/atmosphere cooling events. Hot water, that had been stored in the Pacific warm pool, sloshes back across the Pacific and is exposed to the atmosphere. The heat escapes the ocean and warms the atmosphere, which then radiates the excess heat to deep space. The overall ocean/atmosphere system contains less heat after an El Nino that it did before. The atmosphere (where we live) warms, but then quickly cools again. It seems like warming to use because the heat is passing through the atmosphere on its way to outer space, but the system is actually cooling.
The ~11-year solar cycle controls trade wind strength, hence ENSO.
https://www.sciencedaily.com/releases/2019/03/190328150946.htm
John Tillman, the processes that cause El Nino events are well-documented with data from the Tropical Atmosphere Ocean (TAO) buoys. Please advise through what mechanism the sunspots control westerly wind bursts in the western tropical Pacific, which cause the warm subsurface waters from the West Pacific Warm Pool to be carried eastward along the Pacific Equatorial Undercurrent by warm Kelvin waves, where those warm subsurface waters rise to the surface and warm the surface in what is known as an El Nino.
Regards,
Bob
Totally wrong. The equatorial undercurrent carries cold water and is reduced during El Ninos. In 1997/98 it almost vanished.
https://www.researchgate.net/publication/226062759_The_equatorial_undercurrent_meridional_overturning_circulation_and_their_roles_in_mass_and_heat_exchanges_during_El_Nio_events_in_the_tropical_Pacific
A quote from that article: “The Equatorial Undercurrent (EUC) in the Pacific Ocean (Cromwell et al., 1954) flows eastward along the equator with a thickness of~200 m and a width of about 400 km. It is generally centered at 50 to 200 m depth and slopes upward to the east along the equatorial thermocline (Kessler et al., 1998), with a zonal mass transport of 30-40 Sv (1 Sv=1 ×10 6 m 3 s -1 ; Johnson et al., 2002;Izumo, 2005;Halpern et al., 2015). As the strongest subsurface current in the equatorial current system, the EUC transports warm, high-salinity, nutrientrich, and CO 2 -rich water eastward, maintaining the zonal balance of water mass and heat in the equatorial Pacific Ocean
It’s at 16-19 deg C. Colder than the surface.
Btw, that is not a quote from the article.
lgl, (ahem). Your remark SUPPORTS Bob Tisdale. He said that the North Pacific Equatorial Undercurrent’s cooling effect was suppressed.
As also say these researchers:
Abstract
***
Westerly wind bursts (in December 1996 and March and June 1997) were found to play a decisive role in the onset of the 1997–98 El Niño. They contributed to the early warming in the eastern Pacific because the downwelling Kelvin waves that they excited diminished subsurface cooling there.
***
5. The 1997–98 El Niño
***
a. Interannual anomalies in the surface-layer heat budget
… in the eastern Pacific the second downwelling Kelvin wave add[ed] to the effect of the previous one on the SST evolution. Cooling by local vertical processes [was] quickly completely suppressed (Fig. 13d).
*** With the SST in the eastern Pacific beginning to rise above its normal values (Fig. 12a), the atmospheric fluxes also beg[an] to act as a negative feedback … .
Associated with these conditions (suppressed subsurface cooling in the east, strong positive zonal advection in the western and central Pacific), the warm anomalies amplif[ied] until June. The suppression of the subsurface cooling [was] the main cause of the temperature rise in the eastern Pacific.
***
(Source: https://journals.ametsoc.org/view/journals/phoc/31/7/1520-0485_2001_031_1649_amsoom_2.0.co_2.xml )
Edited for clarity and style. jm
Where in that article is the support for
“warm subsurface waters from the West Pacific Warm Pool to be carried eastward along the Pacific Equatorial Undercurrent by warm Kelvin waves, where those warm subsurface waters rise to the surface and warm the surface in what is known as an El Nino.” ?
lgl, you can find the data that supports my understandings of ENSO at the KNMI Climate Explorer.
To help other persons understand the complex coupled ocean-atmosphere processes associated ENSO, I have present Hovmoller diagrams and subsurface temperature anomaly cross-sections from the NOAA GODAS site:
The Recent Westerly Wind Burst in the Western Equatorial Pacific Could Help to Strengthen the 2015/16 El Niño | Bob Tisdale – Climate Observations (wordpress.com)
My posts on ENSO basics are here:
El Nino-La Nina Processes | Bob Tisdale – Climate Observations (wordpress.com)
Also see my ENSO updates here:
ENSO Update | Bob Tisdale – Climate Observations (wordpress.com)
Regards,
Bob
Wrong again. You are showing a moving anomaly, not water moving. It’s a vertical displacement of the thermocline. Like any wave, the motion is mostly local and vertical, not long distance horisontal. Just like a surface wave crossing the Pacific is not moving any water across the Pacific.
Apparently, lgl, you’ve never heard of the Pacific equatorial undercurrent, which travels from west to east along the equator.
Good bye, lgl. It appears you’re arguing for the sake of arguing,
Hehe, I just linked to detailed analysis of the EUC. Read up.
Further lgl, all you had to do was Google westerly wind bursts and Kelvin waves to find the below linked paper:
Westerly Wind Bursts and Their Relationship with Intraseasonal Variations and ENSO. Part I: Statistics in: Monthly Weather Review Volume 135 Issue 10 (2007) (ametsoc.org)
It includes the following statement and later cites numerous other paper:
“Westerly wind bursts (WWBs), synoptic-scale disturbances that occur near the equator, are considered to have a large impact on El Niño. Previous studies have indicated that these disturbances can exert an influence on large-scale variation, namely the development of El Niño, through directly exciting oceanic Kelvin waves that propagate eastward in the Pacific along the equator…”
No, lgl, I’m not wrong.
Regards,
Bob
So what. A Kelvin wave is still a wave. Not moving water from west to east. The displacement of the thermocline means less upwelling cold water. That, and less wind, is what’s ‘warming’ the surface, not warm water from the western pacific.
Maybe the following gif animation of sea level anomaly maps will help you grasp what I’ve written previously, lgl. It’s an animation linked to my free ebook titled Who Turned on the Heat.
animation-4-2.gif (480×360) (wordpress.com)
Maybe you should try making a wave in your bathtub and see how much water is moved from one end to the other.
Further to the point, lgl, the following is a graph of the GODAS depth averaged temperature anomalies for the NINO3.4 region. Considering the direction of Pacific equatorial undercurrent and the temperature difference between the east and west tropical Pacific to depth, the only place the water could come from that raises the subsurface temperatures (to depths of 100 meters) by more than 2.5 deg C is the west Pacific warm pool.
Regarding upwelling of subsurface waters from below the equatorial Pacific, you should study the topic of equatorial upwelling.
Also, lgl, the following illustration includes cross sections of equatorial Pacific subsurface temperatures (to depths of 300 meters) a year before the peak of the 1997/98 El Nino and near its peak.

I’m done trying to get you to grasp what commonly known, and openly discussed by NOAA, lgl
As I said, lgl, NOAA openly discusses equatorial Kelvin waves I the Pacific. Example, the following quote:
“If those winds go slack or reverse direction in the western Pacific, the warm pool of water around Indonesia is released and begins a slow slosh back toward South America. The slosh is called a Kelvin wave. If the Kelvin wave has a strong impact on the surface waters in the central and eastern Pacific, then it can help change the atmospheric circulation and trigger a cascade of climatic side effects that reverberate across the globe.”
The quote is from the NOAA ENSO Blog post here:
https://www.climate.gov/news-features/featured-images/slow-slosh-warm-water-across-pacific-hints-el-ni%C3%B1o-brewing
Nice illustration of the effects of the super-greenhouse moving eastwards and reduced upwelling of cold water in the east.
Just cleaning up some things on this thread after 3 days of replying to comments:
lgl says, “Nice illustration of the effects of the super-greenhouse moving eastwards and reduced upwelling of cold water in the east.“
Apparently, lgl, you only glance at illustrations and, in your mind, those illustrations conjure up nonsensical conjecture. And what else is obvious to everyone reading this thread is that, based on your comments on this thread, the Pacific equatorial under current, the West Pacific Warm Pool, equatorial Kelvin waves, equatorial Pacific upwelling, and the concept of anomalies are all new to you.
Yup, Janice Moore was correct in her comment when she referred to you as a troll.
Thanks for the laughs on this thread, lgl. No one here is laughing with you; they’re laughing at you.
During higher solar radiation, the trade winds weaken and Walker circulation shifts eastward. There’s also the effect of UV variation on air pressure.
Observational data support the solar cycle connection:
Correlation between solar activity and El Niño Southern Oscillation (ENSO)
https://aip.scitation.org/doi/abs/10.1063/1.4930679?journalCode=apc#:~:text=ENSO%20occurs%20at%20irregular%20interval,periodical%20Sunspot%20number%20(R).
In El Niño, trade winds weaken first, thanks to the solar cycle:
https://www.issibern.ch/teams/interplanetarydisturb/wp-content/uploads/2015/01/Asikainen_03_2014.pdf
Hi John, just clearing up a few things after 3 days of responding to comments elsewhere on this thread.
You wrote, “In El Niño, trade winds weaken first, thanks to the solar cycle…”
The trade winds weaken in response to an El Nino due to the decreased temperature difference between the eastern and western tropical Pacific. That is blatantly obvious with the TAO Project data. If memory serves, the trade winds actual reversed for a time, becoming westerlies, during the 1997/98 El Nino. I’ll see if I can find a graph of map I produced for a post somewhere along the line that confirms that.
Regards,
Bob
Hi again, John. I searched my blog and my books and couldn’t find a graph to support my earlier statement that the trade winds reversed during the 1997/98 El Nino. I know I discussed it, but apparently never produced a graph to confirm it, until now.
So I created a graph at the KNMI Climate Explorer, using the u component (zonal) wind data from the TAO project. Negative values are easterlies (“normal” direction of trade winds) and positive values are westerlies (reversals of trade wind direction). The data is for the western equatorial Pacific (5S-5N, 137E – 180). It wasn’t only the 1997/98 El Nino where the trade winds reversed and became westerlies in the western equatorial Pacific. But the 1997/98 El Nino sure does stands out. Note: That graph is not of anomalies.
Regards,
Bob
Hi once more, John.
Regarding the solar cycle and ENSO, the following graph compares NINO3.4 SSSTa and scaled TSI anomalies. El Nino events do not care when they form during the solar cycle. Sometimes they form near the peak, sometimes at the bottom, sometimes as the solar cycle is evolving, others while it is decaying. Anytime they want, independent of the solar cycle.
I believe I’m done.
Regards,
Bob
PS John, The same holds true for La Nina events. They occur during solar cycle peaks and troughs, etc.
Adios.
People always see cycles in chaotic data. The mind likes patterns.
Cycles are very common. Sometimes they’re nice, well behaved, periodic cycles. That makes them predictable.
Sometimes the cycles aren’t reliably periodic and are called quasiperiodic. As such they aren’t predictable without other techniques. For example, you can’t predict sunspots based on their period, but you can predict them using other techniques.
Sometimes people throw an FFT at chaotic data and imagine that they have found cycles. Of course, if you change the sampling window, their cycles disappear. 🙂
I’ve never really gotten into them but I think wavelet analysis will somewhat alleviate this be isolating the cycles in time. The problem with wavelets (as I understand it) is that relationship between amplitude and time is that if one goes up the other goes down. So you have to use a compromise in your window size.
Perhaps a wavelet analysis is more appropriate for a quasi-periodic cycle.
There’s a simple test. A cycle recurs. If I have five hundred years of data, I can’t say there is a four hundred year cycle just on the basis of an FFT. There has to be some other evidence that the cycle actually recurs.
Having said the above, the signal processing routines in your cell phone look like they violate that rule. The reason they work is that the signal’s characteristics are very well known.
Yes indeed, the rate of sea level rise looks cyclic over the last 200 years and so does the temperature record since 1850.
Regarding the topic of El Niña patterns, it’s curious that the IPCC models can’t predict the occurrence El Niña and La Niña phenomena, but they can predict temperature and rain fall 100 years out.
“The mind likes patterns.”
It’s worse than that ; the mind seeks to assign meaning where there is none. 🙂
That there is a solar cycle is a fact. The data aren’t chaotic. It’s simply an observation of sunspots and measurements of variation in the spectral mix of solar radiation and strength of magnetic field, hence UV light and cosmic rays hitting Earth.
Then correlate these cycles with ENSO. The explanation for the correlation also relies on observations and well understood atmospheric and oceanic physics.
The correlation of the solar cycle with ENSO is strong. From 2021:
https://www.sciencedaily.com/releases/2021/04/210405075853.htm
No surprise, given the physics.
Thomas, your comment is correct in part. With very strong El Nino events, you have to consider something else, too. Additionally, after the processes of the El Nino take warm subsurface water from the West Pacific Warm Pool and place that warm water on the surface of the Eastern Tropical Pacific (where it is normally cooler than in the west), not all of the heat is released to the atmosphere. During the trailing La Nina or La Ninas, the leftover warm surface water is pushed westward by the trade winds, warming it again under the tropical sun. After reaching the Western Tropical Pacific, it is driven poleward and into the Indian Ocean, where it contributes to long-term global warming.
Regards,
Bob
They cause cloud changes that makes them warming events. See Roy Spencer.
To see how trend might depend on start date, I think it is useful to plot trend against all possible start dates. Here is a plot of ONI trends to present (Nov 2022), starting at the date marked on the x axis. So yes, the trend does drop from starting 1970 to starting 1979.
Only if you look at measured data. The models produce relentlessly rising trends until all the water boils off.
Thanks, RickWill. Your comment and graph made me smile at the absurdity of climate models.
Regards,
Bob
Thanks, Nick.
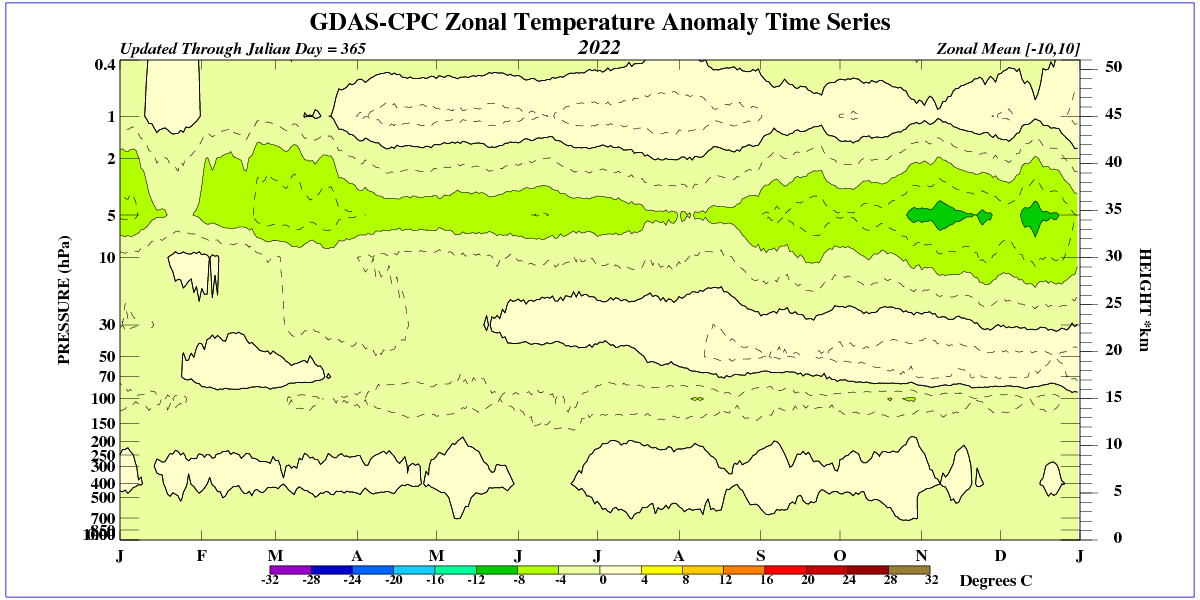
Galactic radiation is the most sensitive indicator of solar wind strength. The graph shows that solar wind strength increased in July and August 2022, coinciding with an increase in easterly winds in the equatorial Pacific. In September and October, the solar wind weakened, so Index Nino 3.4 remained unchanged.


Since November, the strength of the solar wind has been increasing and Index Nino 3.4 has been decreasing.
Why is this happening?
The solar wind hits high latitudes and affects changes in the energy of the winter stratospheric polar vortex (wind speed in the polar vortex). This in turn generates stronger latitudinal winds along the equator.
Of course, the monsoon’s response to changes in the strength of the solar wind comes with a delay.
If anyone has another hypothesis as to why La Nina lasts so long, please present it.
Ireneusz Palmowski says, “If anyone has another hypothesis as to why La Nina lasts so long, please present it.”
Fact, not hypothesis: The trade winds and surface temperature gradient (warmer in the western tropical Pacific than in the east) are coupled and they provide each other positive feedback during a La Nina. That is, a greater temperature gradient causes the trade winds to strengthen, and stronger trade winds cause a greater temperature difference between the western and eastern tropical Pacific. There are physical limits of course and other factors that can end the La Nina.
Regards,
Bob
In addition to the temperature of the Humboldt Current, La Niña is currently being influenced by the pattern of the northern polar vortex and the decrease in the temperature of the California Current.

Ireneusz Palmowski, thanks for the sea surface temperature anomaly map, and current map on the thread, but….
There are phenomena called coastally trapped Kelvin waves. After a Kelvin wave (warm Kelvin wave carries the warm water east for the fuel for an El Nino, and similarly a cool Kelvin wave caries cool water east for the La Nina) travels from west to east across the equatorial Pacific, it can slam into the American coast and travel as far north and south, getting”trapped” there. So the Kelvin wave that initiated the La Nina may also have contributed to the low SSTa along the California and Humbolt currents
See the discussion about coastally trapped Kelvin waves here at WUWT from 8 years ago lined below. It starts after Animation 2 there:
Axel Timmermann and Kevin Trenberth Highlight the Importance of Natural Variability in Global Warming… – Watts Up With That?
Regards,
Bob
Well, however, the forecast of the polar vortex in the lower stratosphere indicates that the warm lows from the Pacific will “escape” over the Chukchi Sea.
https://earth.nullschool.net/#2022/12/20/0600Z/wind/isobaric/70hPa/orthographic=-120.68,67.49,446
C;mon boys & girls, let’s face it – it a pretty wonky oscillator – you’d hardly let it determine what year or decade it is let alone entrust your life to it
Sooooo, does that mean that as an oscillator, it’s either on its last legs and about to fall over or does that mean it’s only just starting up?
The fact that we can only go back 50 years is not inspiring any great confidence either way…..
But humans and their doings have been around for a stack longer than that – did they not notice it, did it not bother them? What record have they left to suggest anything.
One might venture “no” – because of that short record.
Especially as there are much bigger (similarly shaky) oscillators up and
wonking – ones that are bigger in both time and space. e.g. Ice Ages
Humans certainly have left a record – multiple records in fact and we refer to those as ‘deserts.
So, how do the presence or absence of deserts affect those oscillators?
“How” is maybe an attempt to run before we walk can BUT, the presence of deserts in conjunction with non-desert places certainly would be things that would set off an oscillator.
Because those are the prerequisites for any and all systems that are want to oscillate i.e. You need two ‘contrary’ things or places that the oscialltor can lurch abck and forth.
If everywhere was desert, everywhere would be dry and hot and there’s be nowhere for that ‘heat’ to go to.
Similarly, if everywhere was green/verdant and wet, there’d be nowhere for the cold and damp to move to.
Thus, Constant Everywhere precludes oscillators
Now, hopefully you see where I’m going.
We actually do appear to have an oscillator on our hands and we there must have hot/dry places and also cold/wet places.
Whether that’s 2 matchboxes on your desk or an ocean vs a continent. Principle is the same (Stirling Engine anyone?)
Or Central Africa vs The Sahara or Europe vs the North Atlantic
So, if the oscillator we have is changing its behaviour, as the relentless quest for cycles, trivia and minutia leads us to believe – why is the oscillator changing?
iow: Is the hot/dry place changing or is the cool/wet place changing
For the oscillator here, the hot/dry is Australia and the cool/wet is the Pacific
Seriously and looking at the graphs and their timescales also the immensity of the Pacific, can anyone really picture The Pacific going anywhere in a hurry?
Conclusion?
A definite driver of instability is a combination of two facts:
Combining these two means that warm pools have a limited persistence. They move about but usually following the sun north to south or south to north.
There is some evidence that salinity is the initiating switch for ENSO phases but I have not been able to verify that because the salinity data from the tropical buoys is too sparse.
This paper discusses some observations:
https://www.nature.com/articles/srep06821/
Interesting.
I recall reading that the climate models do not take account for the variation of latent heat of evaporation with temperature. Approx 5%, I think, within the earth’s temperature range. That seems like an awful lot to me.
I’ll bet dimes for Dollars that the models don’t take similar salinity-affected changes into account.
“can anyone really picture The Pacific going anywhere in a hurry?”


Not as of 2020.
Ireneusz Palmowski, I always enjoyed the animated versions of the cross sections of the equatorial Pacific temperature anomalies.
Also, over the next six to nine months, keep an eye on the GODAS Pentad Anomaly Webpage:
https://www.cpc.ncep.noaa.gov/products/GODAS/pentad.shtml
Specifically, scroll down to Time-Longitude Section Plots and select Surface zonal wind stress anomaly…for the past 12 months. A recent red anomaly in the western equatorial Pacific will indicate a Westerly Wind Burst, which, if strong enough, will initiate the El Nino and carry the warm water eastward. The BOM may also have similar Hovmollers. I don’t recall.
I used to include those Hovmoller diagrams in my ENSO updates here at WUWT and at my blog. See figure 1 in the post here:
https://bobtisdale.wordpress.com/2015/08/10/august-2015-enso-update-another-westerly-wind-burst-in-late-july-should-help-el-nino-evolve/
Regards,
Bob
SOI has been steadily positive since 2021, and is now rising again.

https://www.longpaddock.qld.gov.au/soi/
….wonky oscillator….Pacific in the middle, Bering Strait on right ?….
La Nina – El Nino — ??
All I know is its bloody cold for Summer.. Could do with some real global warming….
>>>>>>>>>>>>>>>>>>>>
December 14 – 2022.
Melbourne recorded its coldest summer day in 16 years and a temperature record was broken in Victoria as the southern states shiver through another freezing morning.
The maximum temperature of 15.8C in Melbourne was the lowest on record for summer since 2006, while the mercury dipped to -5.4C on Mt Hotham for the state’s coldest ever summer day.
Persistent southerly winds and a sweeping low pressure system meant four capital cities had minimum temperatures of below 10C, including Canberra, where residents had to contend with temperatures as low as 1C early on Thursday morning.
Frost featured throughout the ACT, as well as the Victorian high country and parts of Tasmania’s Central Plateau.
Probably not ideal for grape growers.
Can’t help you I’m afraid, SteveG. Right now in the UK we also have no global warming to spare.
see all those charts
 ?ssl=1
plotting indexs verus time?
then fitting a linear line
they are all WRONG
there is zero rationale to assume the underlying data generating process is linear in time
a linear fit is nonsense!!!
you dont know what your doing
Steven Mosher writes, “you dont know what your doing”
Thanks for the laugh, Steven. That “sentence” clearly indicates you don’t know what you’re doing.
You obviously have little grasp of English punctuation, yet you want the readers on this thread to believe you comment is relevant.
If you had read the post instead of only looking at the pretty pictures with the wiggly lines, you would have grasped that my graphs of data with linear trend lines, were in response to a comparison graph by Willis of multiple data with linear trend lines.
I also checked the thread of the post by Willis linked above, and you failed to provide the same comment about his graph. Isn’t that odd.
Regards,
Bob
It depends! If one is dealing with a periodic function, such as the seasonal variation in atmospheric concentration of CO2 or the seasonal variation in temperature at a particular weather station, in the absence of clear evidence of acceleration, a linear fit may be quite appropriate for the long-term behavior of the measured parameter. It allows interpolation and limited extrapolation. That is the whole point of alarmists trying to scare everyone with trends. It is a convenient summary statistic, even if not explanatory.
“process is linear in time”
So you are saying that absolutely ZERO climate scientists know what they are doing.
AGW exists on idiotic, fabricated, linear trends. !
Note: The version of the Multivariate ENSO Index (MEI) presented in the post above is the current version, Version 2. The original version, which NOAA identifies as mei.old in the http address, begins in 1950. Its data is also available online:
https://psl.noaa.gov/enso/mei.old/table.html
NOAA discusses the MEI.OLD here:
https://psl.noaa.gov/enso/mei.old/mei.html
The data online for MEI.OLD ends in November 2018. The graph below illustrates the version beginning in January 1970. There appears to be a discontinuity, in the form of an upward shift, in 1976.
That’s it for this comment.
Regards,
Bob
NOTE: If you examine the graph for the NINO3.4 data (Figure 3A below) closely, you’ll note that El Nino events do not appear to be gaining much, if any, strength for the period of 1979 to 2022 (the period used by Willis), but that the La Nina events appear to be growing weaker over that time period.
Regards,
Bob
“I had never heard of Willis’s “thermoregulatory hypothesis” prior to reading his recent post (linked above).”
This just goes to show that one-trick pony Bob Tisdale doesn’t pay attention here at WUWT and lives in his own little self-centered bubble.
His reactions to others’ ideas show that Bob Tisdale is not capable of being a team player.
coolclimateinfo writes, “This just goes to show that one-trick pony Bob Tisdale doesn’t pay attention here at WUWT and lives in his own little self-centered bubble.”
I read most posts here at WUWT and comment on them often. I just avoid the ones written by Willis. Wilis has admitted in comments here at WUWT that he doesn’t read my posts or books, so my avoiding his posts is me simply responding in kind.
“one-trick pony?” Thanks for the laugh, coolclimateinfo. The link below will take you to all of my posts here at WUWT. As you can see, there are a multitude of topics that I’ve covered.
https://wattsupwiththat.com/author/bobtisdale/
You continued, “His reactions to others’ ideas show that Bob Tisdale is not capable of being a team player.”
Thanks for another laugh, coolclimateinfo. Are you new here? Since when does WUWT have a team? Or to view it another way, Anthony Watts still welcomes the posts from my blog being cross posted here. The fact that you, coolclimateinfo, don’t appreciate them is irrelevant.
Thanks for wasting my time, coolclimateinfo.
Regards,
Bob
coolclimateinfo, you quoted the first sentence of a paragraph from my post, but you failed to include and reply to the questions in the remainder of that paragraph. Here’s the entire paragraph for you again:
I had never heard of Willis’s “thermoregulatory hypothesis” prior to reading his recent post (linked above). Therefore, it will be up to you readers to comment on whether the flattening of the trend lines when the data for the ENSO indices starts in 1970, as shown in the graphs below, has any impact on his “thermoregulatory hypothesis”. I also have a question for you readers about the above quoted paragraphs from Willis’s post. Why did he identify the strong 1997/98 and 2015/16 El Niños, but not the strong El Niño of 1982/83, or the strong one of 1987/88 (portion of the 1986/87/88 El Niño), or the strong 1991/92 El Niño? Those other three El Niño events all exceeded NOAA’s +1.5 deg C threshold for a strong El Niño.
You appear to be a fan of Willis Eschenbach, cooclimateinfo. Please answer those questions. That way everyone reading this thread will be able see if you are capable of helping them to understand Willis’s hypothesis, or if you’re defending his hypothesis even though you, coolclimateinfo, don’t understand it.
Also, I used the search feature of my browser to find a comment by you, coolclimateinfo, on the thread of Willis’s above-linked post. I couldn’t find one. It’s curious that you, one of Willis’s fans, failed to comment on one of his posts where he presented a graph that he claimed confirmed his hypothesis. Enough said.
Regards,
Bob
“Since when does WUWT have a team?”
No man is a island.
BTW, I didn’t fail at anything in my comment Bob.
FYI, sometimes I am a fan of Willis, and sometimes I’m not 😉
If you didn’t know about Willis’ hypothesis until just recently you’re out of touch Bob.
My answer to your demands is I don’t know, why should he have included those?
It doesn’t matter that he started his plots when MEI v2 data began, what he said was adequate, “Because it requires modern data, it can only be calculated post-1979.”
What the downtrend in MEI v2 means is fewer clouds, consistent with observations, consistent with Willis’ hypothesis, due to tropical cooling below his threshold.
Willis did claim something I don’t agree with, which I have highlighted:
“So … if we accept my hypothesis that the El Nino/La Nina alteration is an emergent phenomenon that acts to cool the planet, an obvious question arises—if the earth is gradually warming, will the Pacific shift towards more El Nino conditions, more La Nina conditions, or remain unchanged?
Clearly, if my hypothesis is correct, it will shift towards more cooling La Nina conditions.” – Willis E.
Since 1980 the climate, ie 30y SST, has followed the 30y integrated MEI only upward, with SST warming during predominantly El Nino conditions, so if the earth continue to warm more, it will do so from more El Nino conditions as it did before, not La Nina.
If Willis’ understanding of the ENSO is partially rooted in Bob Tisdale’s articles and if Bob Tisdale has missed something important as to what triggers or sustains these changes, then both are misguided in some respects, making both one-trick ponies in a sense, both missing the real guiding force, both engaged in two-dimensional thinking.
This means you both can be right about what you are saying but wrong about why.
The problem arises that your current thinking on ENSO can only explain why any changes happened by using a passively-driven discharge/recharge model, but that thought system can’t readily explain the bigger changes from net El Nino to net La Nina or vice versa, ie, what causes the hairpin changes in the 30y iMEI-SST.
What is a consistent single explanation for both the short & long term ENSO changes?
Until you both understand the thing you don’t understand you are operating in a bubble.
coolclimateinfo, you replied, “It doesn’t matter that he started his plots when MEI v2 data began, what he said was adequate, “Because it requires modern data, it can only be calculated post-1979.”
You’re overlooking a simple fact, coolclimateinfo, about Willi’s use of the MEI.v2 for anything: If you’re not aware, coolclimateinfo, the Multivariate ENSO Index is in part a reanalysis. On the MEI.v2 methods page, they state: “In MEI.v2, the fields of SST, SLP, and surface zonal and meridional winds are obtained from the high-quality JRA-55 global reanalysis (Kobayashi et al. 2015).”
That quote is from the NOAA/PSL MEI webpage here, under Methods:
https://psl.noaa.gov/enso/mei/
Ten years ago, Willis thought a reanalysis wasn’t data. Remember? See the first of his two posts at WUWT here:
https://wattsupwiththat.com/2011/11/07/why-reanalysis-data-isnt/
And the second one here:
https://wattsupwiththat.com/2013/05/10/why-reanalysis-data-isnt-2/
Some people might find it odd that Willis now finds a partial reanalysis like the MEI.v2 to be acceptable, because that MEI.v2, which includes a reanalysis, supports his agenda, while in the past he said a reanalysis wasn’t data.
That’s quite a flip-flop for Willis: from saying that a reanalysis is not data, to using a dataset that’s part reanalysis in a post to support his agenda, in only ten years.
Regards,
Bob
coolclimateinfo said, “Since 1980 the climate, ie 30y SST, has followed the 30y integrated MEI only upward, with SST warming during predominantly El Nino conditions, so if the earth continue to warm more, it will do so from more El Nino conditions as it did before, not La Nina.”
First off, see Willis’s post linked in my earlier comment about reanalysis. Second, you said, “with SST warming during predominantly El Nino conditions…”. But you didn’t say where: The West Pacific Warm Pool? Globally? You need to be clear, coolclimateinfo. Your comment leaves more questions than it answers.
Regards,
Bob
coolclimateinfo. Your comment leaves more questions than it answers.
Bob,
CCI is clearly a troll (probably, one of Willis’s many WUWT “fanboys” — I say “boys” because not one female I have EVER seen on WUWT, since 2013, remains a “fan” of that angry megalomaniac). You have answered his or her half-truths and mischaracterizations and inexcusable rudeness with grace and on-point facts and reasoning.
Best laugh: AS IF not reading Willis’s posts makes one “out of touch.”
CCI’s whole game, here, is to put you on the defense by NOT answering questions
and
to make this about YOU, not about your arguments (because the data reveals that Willis has clearly lost the argument, so, all that is left is personal attacks to “defend” that troubled man).
The interesting question is why? Why would anyone take the time to defend Willis using such gutter-style debate? Unless they pity Willis’s inability and embarrassing, blind, hubris, and feel sorry for him… .
With high admiration for your excellent data analysis and for not dignifying most of CCI’s knavery with a response,
Janice
Janice why do you use these ad hominem attacks against other skeptics? Don’t you see that it dissipates our already pitifully weak response to the dominant culture?
The common ground that matters to our survival is “There is no climate emergency”.
Rich Davis says in reply to Janice Moore, “The common ground that matters to our survival is ‘There is no climate emergency’.”
The so-called “climate emergency” was not the topic being discussed, Rich Davis. Once again, Rich Davis, you’re out of touch.
As farmerbraun said above in response to one of your earlier comments, LOL. Not with you, Rich Davis, at you.
Adios.
coolclimateinfo stated, “What is a consistent single explanation for both the short & long term ENSO changes?”
My work, coolclimateinfo, has solely been to educate people about (1) the multiple coupled ocean/atmosphere processes that cause El Nino and La Nina events to evolve, peak, and end; (2) the impact of those events around the globe and how they are caused; and (3) the long-term aftereffects of El Nino and La Nina events.
I have no interest ENSO research anymore. That lack of interest included a “consistent single explanation for both the short & long term ENSO changes…”. If you haven’t noticed, I haven’t published an ENSO update here or at my blog in 6 years or a post about El Nino/La Nina processes in almost 3 years. In other words, I came out of retirement for this post.
You appear to be interested in a “consistent single explanation for both the short & long term ENSO changes…”, so you should search for the answer, coolclimateinfo.
Regards,
Bob
PS, coolclimateinfo: My understandings of ENSO are supported by data.
Adios,
Bob
PPS Coolclimateinfo: For this post, I prepared yet another graph of HADISST-based NINO3.4 SSTa with a 120-month running-average filter, but I elected not to present it. I’ve presented similar graphs in the past posts. Thought you might be interested. See below:
Yes, for many years, I’ve known that the dominance of El Nino versus La Nina events changes over multidecadal timeframes. But I never was interested in why they did. There may be papers with answers, though. I seem to recall reading an abstract somewhere.
Regards,
Bob
Bob Tisdale:
“My understandings of ENSO are supported by data”.
No, Bob, you have NO understanding as to what causes a cool La Nina or a warm El Nino, and without that understanding you have used your data to dream up an ENSO scenario. that misleads everyone. There are no oscillations or cycles, just random occurrences.
As I had informed you in the previous post by Willis, ALL La Nnas and El Ninos are the result of changing levels of SO2 aerosols in the atmosphere, or either Volcanic or Industrial origin. If their levels increase, average anomalous global temperatures decrease, often causing a La Nina, and if their levels decrease, average anomalous temperatures increase, usually causing an El Nino that warms up the Pacific ENSO regions..
This can be observed in an analysis of enlarged WoodForTrees.org interactive plots of .average anomalous land/ocean Global temperatures, using the less “adjusted” Hadcrut4 or 5 data sets.
Each temperature increase can be correlated with decreased levels of SO2 in the atmosphere (4 causes identified) and each temperature decrease correlates with more SO2 (2 causes identified) . .
Your response was to say “SO2 never enters into the picture”
In actuality, SO2 IS the picture.(and CO2 has no observable effect)
BurlHenry writes, “As I had informed you in the previous post by Willis, ALL La Nnas and El Ninos are the result of changing levels of SO2 aerosols in the atmosphere…”
Thanks, BurlHenry, and for presenting your complete lack of understanding of the subject.
Regards,
Bob
Bob Tisdale:
My understanding of the subject is based upon a set of FACTS, which you were either apparently unaware of, or deliberately choose to ignore..
In either event, your faulty explanations as to the cause of the onset of El Ninos has seriously affected our understanding of Climate Change
It’s all about SO2 aerosols!
Burl, just cleaning up some things after three and a half days of responding to other comments on this thread.
Burl, with respect to your comment that precedes this:
Bottom line, BurlHenry, what you’re claiming is the many decades of sensor-measured, data-based investigations by researchers around the globe into the coupled ocean-atmosphere processes that drive ENSO events (upon which my understandings are based) are wrong. Some visitors here that are reading this thread will find your claims against data-based realities to be extremely amusing.
Has anyone called you a troll yet, Burl? You’ve behaved like one here on this thread and on the thread of Willis’s Eschenbach’s El Nino post, which is the subject of this post. Willis even complained to you about your comments on that thread…and on the threads of his other posts here at WUWT. Remember?
You make bizarre claims about SO2 aerosols, Burl, then fail to support them with data. In that respect, your comments come across as unsupported BS, which will eventually earn you troll status here at WUWT, Burl.
If you want your claims to be believable, Burl, consider this: Because El Nino and La Nina events take place in the tropical Pacific, your SO2 aerosol data must also be for the tropical Pacific: (20S to 20N, 120E to 80W). Find some satellite-based SO2 data for the atmosphere above the tropical Pacific and prepare a blog post that explains how SO2 aerosols there create all of the coupled ocean-atmosphere processes that drive ENSO events and submit it for publication here at WUWT.
Adios, Burl.
Bob Tisdale:
I have data to prove that what I am saying is correct. That does not make me a troll.
Bob Tisdale:
You say that I make bizarre claims about SO2 aerosols, then lie and say I do not support them with data.
The data is contained in my papers on Google Scholar, or on Research Gate. Read them if you need data.
For example, the paper “The Definitive cause of Little Ice Age Temperatures”, an analysis of the Central England Instrumental Temperatures Data set (1659-present) finds that every temperature decrease was caused by a volcanic eruption somewhere around the world.
Thus,volcanic SO2 aerosols circulate around the globe, affecting temperatures everywhere.They affect the tropical Pacific no matter where the eruption took place
Those coupled ocean-air processes do not drive ENSO events, they occur because the climate has warmed up because of fewer SO2 aerosol emissions.
And ENSO events do NOT cause global warming. The whole world .is simultaneously being warmed up by the reduced SO2 aerosol emissions. .
You’re again making nonsensical claims like a troll, Burl. The timeframe of the discussions in this post is 1979 to 2022 and you recommend I read your paper about the little ice age????? LOL, at you, not with you. The discussion is about ENSO and your paper is about England???? LOL again, at you, not with you.
In your comment above, Burl, you attempted (and failed) at misdirection. In response to my recommending you present SO2 aerosol data for the tropical Pacific, you make the nonsensical claim, “They affect the tropical Pacific no matter where the eruption took place.”
I’m one of the show-me people, Burl. Yet you refuse to do that, just like a troll. Thus, I made the effort so that everyone reading this thread can see that there’s little-to-no correlation between volcanic aerosols over the tropical Pacific and El Nino and La Nina events. Here’s a graph that compares the NINO3.4 index to the GACP Aerosol Optical Depth data for the tropical Pacific. The GACP Aerosol Optical Depth data are available through the KNMI Climate Explorer, where the user selects the desired coordinates. I selected the tropical Pacific, Burl, where El Nino and La Nina events take place.
The timing of cooling volcanic aerosols seems to loosely agree with only two of the ten El Nino events and none of the La Nina events.
No doubt about it. You’re a troll, Burl, a troll who wastes the time of everyone reading this thread.
More important to me, you waste my time.
coolclimateinfo, you wrote, “If Willis’ understanding of the ENSO is partially rooted in Bob Tisdale’s articles and if Bob Tisdale has missed something important…”
As I noted earlier, Willis has admitted that he doesn’t read my posts or my books, so your “if” statement is flawed.
Additionally, it’s very weird that in a reply to me, you are referring to me in the third person. Did you cut and paste this portion of your comment from somewhere else?”
Regards,
Bob
You’re really making an ass of yourself Bob. It’s a sad look.
A normal person could disagree with Willis without making it so personal.
This is the sort of vitriol that should be reserved for the likes of Michael Mann.
LOL!!
Bob Tisdale responded to Willis’s errors using DATA and impeccable analysis.
Your accusations of Tisdale’s “making it so personal” and “vitriol” are completely unsupported by ANY evidence.
Merely stating the fact that he no longer reads Willis’s articles is not to be “so personal” nor is it (or ANYTHING Tisdale wrote) “vitriol.”
You have embarrassed yourself here, Davis.
Your strong emotions led you into making false statements.
Those who read your remarks are now wondering why you felt so strongly…..
I really don’t understand why apparently a significant group of you have lost the plot here.
It wasn’t strong emotion on my part. I don’t disagree with Bob that Willis jumped the shark with the starting date, which I think he convinced himself could be justified by it being the beginning of one of his datasets. When we have devoted a lot of time to something we get attached to our conclusions and impatient to find supporting evidence.
What I am talking about is the incessant snark tone coming from Bob, directed at Willis. It’s incongruous. There was no obvious instigation. Apparently it is an old animosity. That is also a bad look, implying a mean-spirited person who holds a grudge endlessly.
For the three other people who still think that the Christmas season has any relevance, a blessed Christmas to all.
Rich Davis said, “You’re really making an ass of yourself Bob. It’s a sad look.
“A normal person could disagree with Willis without making it so personal.”
Curiously, the comment by me that you’re responding to, the one in which you claim I’m “making an ass” of myself, Rich Davis, is a reply to coolclimateinfo, and it contains nothing “personal” about Willis and no “vitriol” toward him.
To save you time, Rich Davis, here’s a link to the comment by me to which you responded:
https://wattsupwiththat.com/2022/12/14/response-to-willis-eschenbachs-wuwt-post-how-the-el-nino-is-changing/#comment-3651565
Regards,
Bob
There’s that bad look again Bob.
I was of course talking about your entire sad performance on this post and also to your earlier unhinged comments on Willis’ original post.
I have no idea what your beef is with Willis. I know that he can be just as pig-headed and unreasonable at times as you’re behaving.
For me, if a person is skeptical of the Climastrology religion that is an existential threat to Western Civilization, I would like to see them as an ally, even if I have other disagreements with them.
You do a disservice to climate realism by pursuing a personal vendetta.
Rich Davis said, “There’s that bad look again Bob.”
“bad look again” in my reply to you?
To everyone reading this thread, Rich Davis, it will be obvious that you object to my factual, to-the-point writing style.
Regards,
Bob
No Bob, far from being to-the-point, in both cases you avoided addressing the substance. That’s too bad.
You’re clearly airing a personal beef with Willis for reasons you don’t illuminate and refuse to even acknowledge what you’re doing, much less consider the suggestion that it’s counterproductive.
Bob,
I wanted to be sure that I remembered the events correctly so as not to be unfair to you, so I went back to the original Willis posting and reviewed the comments again this morning.
I think that any other fair-minded observer would also come to the conclusion that I did. You attacked and goaded Willis and then you continued to escalate as Willis lost patience with you.
At the time you were admonished by Pat Franks and Allan Macrae specifically for your harsh uncalled-for tone, and that is what I referred to as vitriol.
Then I saw you revisiting the debacle, not with any retrospective regret about rancor, but by denigrating Willis’ thermoregulatory hypothesis, claiming to have never heard of it, and throwing it into scare quotes and creating a syllabus of Willis’ errors.
To what end, Bob?
I for one would suggest that you swallow your pride and apologize to Willis in private and put the unnecessary unpleasantness behind you.
Rich Davis, you’re still at it? Oy vey.
You want me to apologize to Willis Eschenbach for my comments on his post that included:
(1) the worst description of ENSO ever published, so bad it was clearly misinformation, and…
(2) the graph (Figure 1 above) that was the basis for this post at WUWT, and…
(3) his use in that graph of the Multivariate ENSO index (MEI), which is partly based on the output of a reanalysis…when, in two posts here at WUWT about 10 years ago, Willis clearly noted in the titles and content of those two posts that the outputs of a reanalysis weren’t data…in other words, it might appear to some here at WUWT that Willis flipflopped on the use of a reanalysis when it suited his needs?
Note: See the comment from this thread linked below about the MEI and its inclusion of a reanalysis:
https://wattsupwiththat.com/2022/12/14/response-to-willis-eschenbachs-wuwt-post-how-the-el-nino-is-changing/#comment-3651666
You want me to apologize to Willis? Not gonna happen. He should apologize to the visitors of WUWT for that post.
Good bye, Rich Davis. I’ve had enough.
Science is about “teams.”
Mariarity ==> Wel, yes, all “The Science” comes from Teams — the CliSci Consensus Team, the Goverment’s-Covid-The-Science Team, the We-Are-The-Polar-Bear-Experts Team……
Thanks, Kip.
Regards,
Bob
LOL. Not being a “team player” has absolutely nothing to do with this argument (Bob’s data analysis versus Willis’s).
What team was Einstein on?
The Maxwell is right and Newton wrong team. The Lorentz transformations team.
Initially a small team but now big.
I read an article that said the Southern Hemisphere (SH) stratosphere has cooled by about 0.2 Celcius this year as a result of the vast quantity of water vapour thrown skywards by the Hunga Tonga submarine eruption in January 2022. Could this be the reason people in Australia are having a cold summer?
https://www.severe-weather.eu/global-weather/cold-anomaly-stratosphere-polar-vortex-volcanic-cooling-winter-influence-fa/
No, the thickening of the stratosphere increases the temperature of the stratosphere and cools the surface. The decrease in temperature in the upper stratosphere is caused by a decrease in ozone production due to a decrease in UV radiation.
An increase in stratospheric opacity results in an increase in stratospheric temperature and a decrease in surface temperature.
Bob,
Can you comment on how these indexes are calculated. They do seem somewhat complicated.
The ONI is calculated from the average sea surface temperature in the Niño 3.4 region for each month, using in-ocean measurements from several sources, including autonomous floats, moored buoys, and ship cruises. The observations are blended into a single monthly average and then averaged with values from the previous and following months. This running three-month average is compared to a 30-year average. The observed difference from the average temperature in that region—whether warmer or cooler—is the ONI value for that 3-month “season.” The ONI is more straight forward than sea level pressures for the SOI.
Sea level pressure (SLP) readings at the stations are each standardized to adjust for seasonal differences. The difference between these two standardized SLPs is then itself standardized. Standardization re-scales a set of numbers in two steps. In the first step, the average of the numbers is computed, and that average is then subtracted from each number. Then, in the second step, the numbers are further re-scaled so that their range typically ends up only between about -2.5 and 2.5. If their range is much larger than this, then the numbers are compressed; if originally smaller, they are stretched. This second step of re-scaling is done by first computing the standard deviation of the numbers. The numbers coming out of the first step above are divided by this standard deviation, and this is what causes the numbers to end up varying only between about -2.5 and 2.5.
I had been following Bob Tisdale’s various updates on ENSO for many years. I learnt how to prepare a Boiler Plate template for ENSO, which I have been using to report the same on my website at http://www.gujaratweather.com/wordpress/ .
My last post about the current Double Dip La Nina event was updated on 5th October 2022. The link is http://www.gujaratweather.com/wordpress/?page_id=26987 .
El Nino or La Nina criteria and other details are explained therein.
Thanks for the info. I forgot to add the NOAA reference for my original comment above, http://www.climate.gov/news-features/blogs/enso/why-are-there-so-many-enso-indexes-instead-just-one. Check out the footnotes.
Renee, I apologize for the time it took to reply to your comment.
The ONI and NINO3.4 indices are based on sea surface temperature measurements, as you know. The sea surface temperature data comes from the ICOADS dataset:
https://icoads.noaa.gov/
NOAA infills data from missing ocean grids for the ERSST.v5 data, which there was a lot of in decades past. That’s why the NINO3.4 and ONI data only go back to 1950. Before then, there is very little source data for the NINO3.4 region.
Starting in the early 1980s, NOAA PMEL began mooring meteorological and oceanic measurement buoys (70 in total) in an array across the tropical Pacific to better study El Nino and La Nina events as they were taking place…as part of the Tropical Ocean Atmosphere (TAO) project.
Both the ONI and NINO3.4 indices are based on the NOAA ERSST.v5 sea surface temperature dataset. ERRSST.v5 (fifth version of the same dataset) is unaffectionately known around WUWT as “pause buster” due to the adjustments NOAA made. See the WUWT June 2015 post linked below, prepared by me and Anthony Watts:
https://wattsupwiththat.com/2015/06/04/noaancdcs-new-pause-buster-paper-a-laughable-attempt-to-create-warming-by-adjusting-past-data/
Where the NINO3.4 data are based on anomalies for affixed 30-year period, ONI has a sliding set of base years for anomalies that’s updated every five years. NOAA explains that curiosity here:
https://origin.cpc.ncep.noaa.gov/products/analysis_monitoring/ensostuff/ONI_change.shtml
Because of the sliding base years for anomalies, weak El Nino an La Nina events can come and go from the official events color-coded on the ONI webpage:
https://origin.cpc.ncep.noaa.gov/products/analysis_monitoring/ensostuff/ONI_v5.php
I noted that in the WUWT post here:
https://wattsupwiththat.com/2015/06/24/weak-el-ninos-and-la-ninas-come-and-go-from-noaas-oceanic-nino-index-oni-with-each-sst-dataset-revision/
Then there’s the NOAA Multivariate ENSO Index (MEI) dataset, which is a combination of sea surface temperature data from the NINO3.4 region and a reanalysis, which is basically the output of a computer model. As discussed in an earlier comment, I was curious as to why Willis was using a dataset that was part reanalysis, when he vented against reanalysis datasets in two posts about 10 years ago. See the comment here:
https://wattsupwiththat.com/2022/12/14/response-to-willis-eschenbachs-wuwt-post-how-the-el-nino-is-changing/#comment-3651666
That leaves us with the Southern Oscillation Index (SOI), which is measured as the sea-level-pressure difference in sea level pressure from two off-equatorial locations. I note that they’re off the equator because El Nino and La Nina events are focused on the eastern equatorial Pacific. The SOI is used often by Australia’s Bureau of Meteorology (BOM) for weather forecast there, because ENSO events have major impacts on Australia’s weather. NOAA has a reasonably easy-to-understand overview here:
https://www.ncei.noaa.gov/access/monitoring/enso/soi#calculation-of-soi
FYI, the sea surface temperature dataset I used most often for blog posts and my books is satellite enhanced. NOAA has an AVHRR satellite measuring sea surface temperatures (among other things). Because of the high-resolution satellite-based measurements, in November 1981, NOAA began producing a satellite-enhanced sea surface temperature dataset called the Reynolds Optimum Interpolation (OI.v2), which is now in its second version, thus the .v2. Reynolds OI.v2 SST was the dataset I used for my monthly sea surface temperature updates, and for many posts that needed sea surface temperature data. The Reynolds OI.v2 SST data are available through the KNMI Climate Explorer, which I used to prepare my posts. KNMI Climate Explorer link below:
http://climexp.knmi.nl/start.cgi
The KNMI Climate Explorer is a great tool and has a multitude of datasets, and climate model outputs (the climate models that are used in the IPCC reports for prognostications about the future), to choose from, if you’re interested in doing your own research.
Sheesh. Sorry if I got a little long-winded, Renee. It’s rare that someone asks me in a nice way to comment.
I hope I’ve given you what you were looking for.
Regards,
Bob
To the assortment of CAGW believers out there: See how this works on this side of the fence? Debate ensues on key issues. If the person with the original graph, however, is Dr Michael Mann, every effort possible is made to deep-six any debate completely out of sight in the eyes of the public, and to employ all means of character assassination against critics of the graph to persuade the public not to even glance at the science points made by critics.
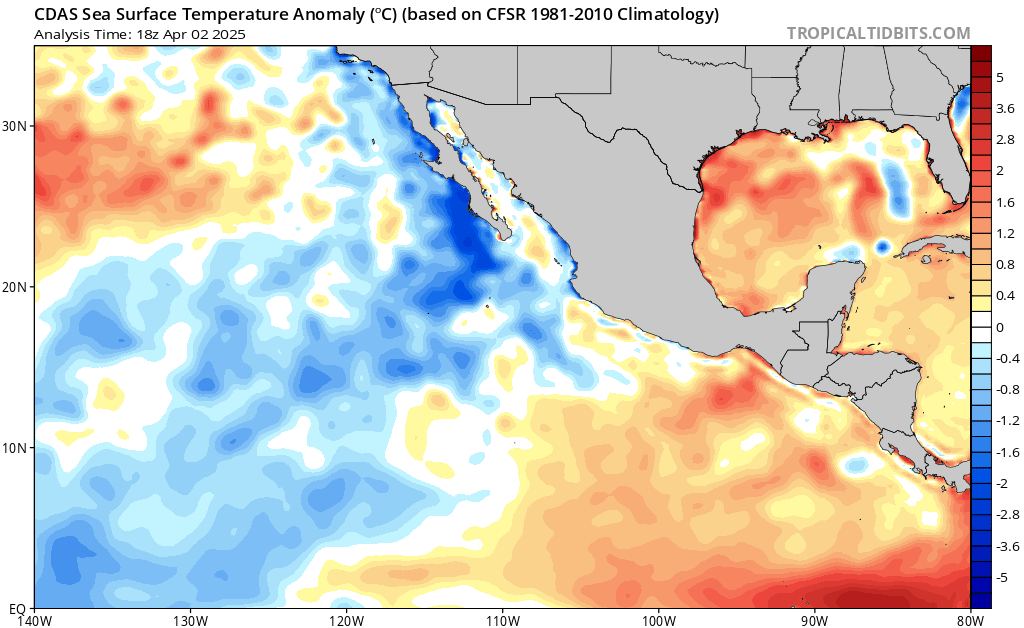
Tisdale ==> All of these graph trends are greatly affected by the last two years which are dominated by La Niña conditions. So, as with all time series graphs, start and end dates have determine the trend.
We are in a period similar to the early 2010s.
As with all things CliSci, we are mostly in a state of “We don’t really know” when trying to guess the significance of the trends or the values of those various indexes, except in very vague sense.
Thanks for this post — someone must correct us (the less-consensus-believing) or we will mislead both ourselves and the public.
Kip, you wrote, “ All of these graph trends are greatly affected by the last two years which are dominated by La Niña conditions…”
Agreed. Just in case I needed them, I had prepared graphs with the ENSO indices starting in 1979, but with the data ending after the 2018/19 El Nino, in December, 2019. In that way, the graphs were beginning and ending with El Ninos. Eliminating the last couple of years, with their La Nina events, flattened the trends, example using the NINO3.4 Index data shown below:
Regards,
Bob
Tisdale ==> Thanks — adjusting the start and end points so that they take in a proper whole cycle flattens the trend to “perfectly flat” in the real world.
Trends are a dangerous tool in the hands of advocacy — one can make them say almost anything.
Keep up the good work, sir.
Kip, more to that, anyone could splice the data for a strong El Nino (1997/98 for example) to the end of the current NINO3.4 Index data. That too would flatten the curve, as the graph would be starting and ending with very strong El Nino events. And after strong triple-dip La Ninas there may be enough of a supply in the west Pacific warm pool to support that happening.
Regards,
Bob
Solar activity is increasing and index Nino 3.4 is falling.


The key question is, “why drives these oscillations.” Incoming solar radiation does, not LWIR back radiation. I’ve been posting on this and other boards that is you explain the warming of the oceans, you explain climate change. I made the claim that fewer clouds over the oceans result in their warming. Data exists to prove that. I am not a climate scientist, I just have common sense. Well, today this is being published. An actual climate scientist found what someone with an ounce of common sense would have known years ago. When an amateur like me can accurately describe what cause of the climate change and real climate scientist completely ignore the real explanation, Climate Science isn’t a science. When amateurs can do a better job than the experts, they aren’t experts, they are activists.
Earth’s radiation budget at the top of atmosphere (TOA) is predominantly controlled by internal changes in cloud cover. A declining albedo – linked to declining cloud cover – corresponds to an increase in the shortwave radiation absorbed by the Earth and thus a positive climate forcing.(Link)
CO2isLife:
Now, explain WHY there are fewer clouds over the ocean
The Earth’s atmosphere absorbs up to half of the sun’s radiation, including infrared radiation, because the dense layer of the atmosphere that is the troposphere is not transparent to solar radiation.
As an occasional thinker, not a measurer, about this important topic, there are still some topics that need clarification before it is wise to pontificate on curve fitting or linear regressions over some time or another.
The first uncertainty is whether these measured events are an oscillation, in the sense that having observed some peaks and troughs, we can reasonably anticipate that there will be more. Next uncertainty, if there is an oscillation, is it regular and predictable, or not, both with the limited time of measurements to data and for thousand-year periods. If it is an oscillation, is it simple (in need of only a few variables to construct it) or compound, where many factors contribute, even factors we have not yet thought of. Nature can be wickedly complex.
Next, when a factor is rising to a peak, what precisely is the driver that causes a reversal to what might be a reversion to the mean? And the converse, when it is falling into a trough, what prevents it from forever falling and sends it back towards the norm? Is the norm linear over time, or not?
If the norm is not linear over time, have we considered adequate causative mechanisms? For a simple example, is there a crustal hot sopt under the west pacific warm pool, whose fluctuations over times of monthly to multi-yearly cycles are involved in starting and stopping the ENSO?
When you study governor systems, starting with simp[le ones like those balls on springs atop steam engines that feed back a control to the throttle, one of the critical design ideas is to have what is called by some a “set point”. If you want your steam enging to rotate a shaft at 500 revs per minute, the have to have a device that tells the machine when it is at the set point of 500 rpm. This is usually an adjustment that causes a feedback force like from a spring to restore the throttle setting to a previous position. The set point. What is the set point in the ENSO system if this analogy applies? If the analogy does not apply, what stops ENSO from going out of control?
On a different tack, there are many known objections to using the mathematical option that might be called the easy Excel trend, the linear least squares fit. I use it myself to help the eye absorb data, but it is invalid if you are viewing a small time period in a larger time period oscillation like a sine wave. If the sine has a wavelength of 1,000 years, you fool yourself with 100 years of data.
Finally, as I have ranted many times before, the data mean a great deal more if their numbers carry an estimate of their uncertainty. I mean the full uncertainty, with a dab of addition for factors that might influence the pattern but have not been adequately measured. Avoid an uncertainty calculation that treats each part of the ENSO variation as part of the same population, allowing stats methods like making uncertainty smaller by dividing by square roots of variances. That type of difference was recently argued in articles by Kip Hansen and earlier by myself with Tom Berger. If we apply envelopes for broad uncertainties to the graphs supporting this article by Bob Tisdale, we might find that much of the wobble is merely noise within a broad envelope. I do not know if it is, because there are no uncertainty estimates quoted – or if they are, they are not easily apparent.
We have to be careful with sceptical arguments. There is no place for cartoon-level pictures said to explain complex problems, but I am not accusing the authors or commenters here of descending that low. I am merely trying to show that the main Feynman Principles are required for good science, with note taken of wisdoms like the easiest person to fool is yourself. So, here I end my foolish little story.
Geoff S
One thing I have not seen in either the posting or the comments is any assessment of the statistical significance of any of the linear trends. Admittedly, a p-value requires assumptions, typically of independence and identical distribution, which may not be exactly true, but it is still a useful indicator of how serious an effect appears to be happening over the given time period. My eyeball suspicion is that a lot of the trend lines shown are not significantly non-zero.
Bob, or Willis, do you ever produce p-values of linear trends?
Rich.
A trend that depends on the choice of end points is not a trend.
There is to the eye a possible 60 year quasi cycle in the temperature data, which could generate false trends using less than cycle length analysis.
What about the role played by deep ocean currents? Maybe the cold water upwelling is the cause not the effect. Both on temperature and sea height.
Sailing a small boat through an area of upwelling can be a real eye opener, seeing the ocean boiling out overtop of itself, like water flooding over solid land.
“We are not the first scientists to study how solar variability may drive changes to the Earth system,” Leamon said. “But we are the first to apply the 22-year solar clock. The result — five consecutive terminators lining up with a switch in the El Nino oscillation — is not likely to be a coincidence.”
In fact, the researchers did a number of statistical analyses to determine the likelihood that the correlation was just a fluke. They found there was only a 1 in 5,000 chance or less (depending on the statistical test) that all five terminator events included in the study would randomly coincide with the flip in ocean temperatures. Now that a sixth terminator event — and the corresponding start of a new solar cycle in 2020 — has also coincided with an La Nina event, the chance of a random occurrence is even more remote, the authors said.”
https://www.sciencedaily.com/releases/2021/04/210405075853.htm
John Tillman thank you for the information.
“Comparing more than five decades of solar evolution and activity proxies. From top to bottom: (a) the total (black) and hemispheric sunspot numbers (north—red, and blue—south); (b) the latitude-time variation of sunspot locations; (c) the Oulu cosmic-ray flux; (d) the Penticton F10.7 cm radio flux; (e) a data-motivated schematic depiction of the Sun’s 22 years magnetic activity cycle; and (f) the variability of the Oceanic Niño Index (ONI) over the same epoch. The black dashed lines mark the cycle terminators.

“Based on the mSEA of the past 60 years, an enduring warm pool in the central and western Pacific at solar minimum (ONI has been consistently positive since early 2018, even though it never got so warm to become a fully fledged strong El Niño event) was not unexpected, and we expect a rapid transition into La Niña conditions later in 2020 following the sunspot cycle 24 terminator. Given the warm waters, we project a particularly active Atlantic hurricane season in 2021, and maybe even 2020, depending on exactly when the terminator and ENSO transition occurs this year.”
https://agupubs.onlinelibrary.wiley.com/doi/10.1029/2020EA001223“
You’re most welcome.
To me it’s obvious that air pressure changes caused by La Niña and El Niño conditions alone don’t bring forth the alternate state. Los Niños aren’t always followed by Las Niñas, not even always Super Los Niños, although 1997-98 SEN was. SEN 2015-16 wasn’t.
I don’t know if there’s an agreed upon standard for La Nada vs. weak La Niña or El Niño, but I go with ONI -1 to +1. A change in equatorial WestPac SST of 0.5 degree C seems slight to me.
I’d need to see data supporting the SO2 hypothesis, but the solar cycle correlation is strong and the physical explanation convincing to me.
Thanks for your detailed comments.
Meant EastPac.
I’d welcome a post presenting your views on ENSO causation, with or without reference to Bob and Willis’ posts.
John Tillman:
See my earlier post to Bob Tisdale on Dec 15, 2:1`9 pm
Saw it, Burl. Thanks. It’s why I mentioned SO2, though I’m of the sun school. Can’t rule out at least some SO2 influence. We’re having triple diip Las Niñas after a huge SoPac eruption.
Post hoc fallacy coincidence?
¿Quién sabe?
John Tillman:
The sun, of course, is the main driver of our climate. However, the amount of sunshine that reaches the Earth’s surface is dependent upon the amount of SO2 aerosols that are in the atmosphere, so SO2 is the actual Control Knob of our climate. The sun is a constant, SO2 is the regulator.
When it is reduced, El Ninos form. As I had mentioned recently, 70% of the El Ninos since 1850 were man-made..
The triple dip of Las Ninas has nothing to do with the Tonga eruption. They started before the eruption, and are caused by increased levels of Industrial SO2 aerosols from primarily China and India. See attachment.
Although the underwater Tonga was a VEI5, its injection of SO2 aerosols into the stratosphere was the same as if it were a VEI4
And, NO
Yes, its aerosols were reduced by its eruption being partially submarine.
Despite man-made SO2, IMO, ENSO is still largely under solar control. The sun is a mildly variable star in its TSI, but spectrally it is far more variable.
UV, while even at its strongest, is a minor part of TSI, is still qualitatively different from less energetic bands. It makes and breaks ozone, for starters.
John Tillman:
What you are overlooking is the simple fact that there is 100% correlation between the random occurrence of an El Nino and a decrease in atmospheric SO2 aerosol levels at the same time..
This would be IMPOSSIBLE if the occurrence of an ENSO were in any way under solar control.
Q.E.D.
Los Niños can occur after big eruptions as well, as in 2020.
The proximate cause of Las Niñas is strengthening of the trade winds, keeping warm water farther west, allowing cold water to upwell off tropical South America.
The ultimate cause is chiefly the solar cycle.
John Tillman:
The current La Nina began in July of 2020, well before the Tonga VEI5 eruption of Jan 16, 2022.
And, NO, the proximate cause of a La Nina is always increased levels of volcanic SO2 aerosols in the atmosphere.
As mentioned in my previous response, it is impossible for the solar cycle to be responsible for El Ninos, (or La Ninas, since both.correlate with changing SO2 aerosol levels in the atmosphere).
Why are you so insistent that the solar cycle is chiefly responsible? I have the data which proves otherwise.
.
.
Please cite these data. The data I see not only don’t support your hypothesis but show it false. The January 2020 VEI 4 eruption in the Philippines was followed by strong El Niño conditions.
The data confirm the solar hypothesis.
John Tillman:
I told you earlier that it is impossible for E Ninos and La Ninas to be caused by solar variations. They occur at random intervals, often years apart. I find that El Ninos are always associated with decreased levels of SO2 aerosols in the atmosphere, which causes warming.
You need to show that the sun’s intensity has suddenly increased at those precise intervals for there to be a solar effect. Or has decreased precisely when a La Nina occurs.
The data that I cite comes from “El Nina and La Nina years and intensities”, from the Climate Prediction Center. Found most easily by Googling the title Scroll all the way down...
Sunspot Area Butterfly Diagram.

As the Sun’s magnetic activity (solar wind force) increases after the previous magnetic activity cycle ends, La Nina develops.
Ireneusz Palomwski
Forget the sun!.
The ONLY time that a La Nina develops is when there are increased SO2 aerosols in the atmosphere, primarily from a random VEI4, or larger, volcanic eruption.
SO2 has increased from coal plants, at least since China’s economy took off after 1979, then India’s. Granted, the West cleaned its air during the same period.
Las Niñas happen with or without VEI4 eruptions. ENSO correlates with the solar cycle.
Strong El Niño 2020 followed a VEI 4 eruption in the Philippines.
John Tillman:
“La Ninas happen with or without VEI4 volcanic eruptions”
They are primarily due to VEI4 volcanic eruptions, but a few were caused by increased Industrial SO2 aerosol emissions.
“Strong El Nino 2020 followed a VEI4 eruption in the Philippines”
There was no El Nino in 2020, only a moderate La Nina that followed the 2019 eruptions of Sinabung, Raikoke, and Ulawun
La Niña developed in August 2020. Earlier that year El Niño conditions prevailed.
Please see UAH satellite observations, in which 2020 was nearly as warm as Super El Niño 2016-15.
John Tillman:
SO2 aerosols are reflective, and cool the atmosphere underneath.
I am beginning to suspect that the UAH sensors sense the reflection as warmth, giving rise to the assertion that volcanic eruptions cause warming.
I’ve been responding to comments for three and a half days. Hopefully, this is the last comment I’ll make on this thread.
I’m proud of myself for not promoting my short stories that are available on Kindle. But I may have made a mistake by not linking my free ebook that details the coupled ocean-air processes that drive El Nino and La Nina events: Who Turned on the Heat?. So here’s a link to a free copy in .pdf form:
https://bobtisdale.files.wordpress.com/2016/05/v2-tisdale-who-turned-on-the-heat-free-edition.pdf
Regards,
Bob
Bob Tisdale.
Thanks for making the PDF available, but, regretfully, your explanations of the causes of ENSO formations are completely wrong.
Rather than being random events, they are all caused by varying levels of SO2 aerosols in the atmosphere, with 100% correlation.
Examination of my papers on Google Scholar. or Research Gate, will show that I am correct. You are welcome to find fault with any of them. Critical examinations of accepted, or proposed ideas, is how science progresses.
Burl, you keep repeating your nonsensical claims. See my reply to your similar comment linked here:
https://wattsupwiththat.com/2022/12/14/response-to-willis-eschenbachs-wuwt-post-how-the-el-nino-is-changing/#comment-3653272
It includes the following graph:

And in that comment, I wrote, The timing of cooling volcanic aerosols seems to loosely agree with only two of the ten El Nino events and none of the La Nina events.
No doubt about it. You’re a troll, Burl, a troll who wastes the time of everyone reading this thread.
More important to me, you waste my time.
Burl, on the threads of future posts, if you continue to make your trollish nonsensical claims, I will respond with the following graph:
And I’ll direct readers to my comment linked below:
https://wattsupwiththat.com/2022/12/14/response-to-willis-eschenbachs-wuwt-post-how-the-el-nino-is-changing/#comment-3653272
Then everyone reading that thread can call you a troll, like I do. Go back to programming computers, Burl, because you can’t back your nonsensical claims about ENSO being controlled by SO2 aerosols with data. The tropical Pacific is not England, Burl, and the little ice age did not occur during 1979 to 2022, which was the timeframe of this post, Burl.
Bob Tisdale:
You are pathetic!
The reason that I directed you to the LIA paper was to show that the SO2 aerosols from volcanic eruptions circulate around the globe, affecting temperatures everywhere (which, for your information, includes the ENSO region).
With respect to your graph, the two matches PROVE what I have been saying. Please show it to everyone that you can.
The other El Ninos were caused by decreased SO2 aerosol emissions for reasons (3 identified) other than the eruption of a volcano, which are discussed in my paper “A Graphical Explanation of Climate Change”
.
For those reading this thread, the following is a link to Burl’s paper that he notes above:
(PDF) A Graphical Explanation of Climate Change (researchgate.net)
Burl’s numerous claims on this thread that Volcanic eruptions cause all El Nino and La Nina events are based on his annotated graph of global HADCRUT temperature anomalies from WoodForTrees, on which he puts red dots on the upward spikes he associates with El Nino events after 1980. And as he notes in his comment above, some El Nino events (2 of 10) are caused by volcanic eruptions, but the other 8 are caused by the absence of them. And according to the word-find feature on my browser, Burl does not mention La Nina once in his paper.
Thanks for the laugh, Burl. An annotated WoodForTrees graph? LOL.
ADIOS, TROLL!
Here’s a quote from your above-linked paper, Burl. You stated, “Warming due to the less polluted air usually results in the formation of a volcanic-induced El Nino, if there have been no other eruptions in the interim.”
You misuse the term “volcanic-induced El Nino”, Burl. It is the term used for an El Nino that forms immediately after a volcanic eruption and as a result of that volcanic eruption, like the El Nino events that formed in the wake El Chichon and Mount Pinatubo. See the graph I provided in earlier comments.
“Warming due to the less polluted air usually results in the formation of a volcanic-induced El Nino, if there have been no other eruptions in the interim.”
LOL, Burl (at you, not with you). You just make shite up as you go along.
Two questions for you, Burl: Do you know what meteorological explanation has been proposed for a “volcanic-induced El Nino”, Burl? And do you understand the consequences of that explanation?
Bob Tisdale,
The thrust of my paper was to show that every time atmospheric SO2 aerosols decrease, average anomalous global temperatures increase.
The majority of the observed increases were caused by decreased SO2 aerosol emissions from idled smelters, foundries, factories, etc. during American business recessions.
Between 1850 and 2007, there were 35 recessions/depressions, and 33 of them resulted in increased global temperatures. Of the 33 increases, 7 of them clearly resulted in the formation of an El Nino The others failed to form an El Nino because they occurred .during a La Nina, or during an El Nino.
At least 7 other El Ninos occurred when there were volcanic droughts (.i.e,more than 3-11 years between eruptions, when there were few or no SO2 aerosols circulating in the atmosphere)
So, there were at least 14 examples of El Nino formation due to decreased atmospheric SO2 aerosol levels, totally excluding those due to volcanic activity, to avoid argument
This completely refutes your hypothetical explanation of El Nino formation, although one contrary example should have sufficed.
Q.E.D.
Two of ten is not 100% in arithmetic as practiced on Planet Earth!
John Tillman:
On Dec. 18, 5:22, you had asked me to cite a data source, which I did.
Did you follow up on this? I would like to understand what is going on.
I did. Thanks.
The data don’t support your claim.
John Tillman replies to BurlHenry, “The data don’t support your claim.”
Thanks, John. That made me smile.
Regards,
Bob
John, Burl kept commenting on the thread of Willis’s El Nino post for at least 9 days. Apparently, he’s searching for someone (anyone) to agree with him.
Because of the amount of time I’ve spent responding to Burl’s nonsense, I’m hesitant to prepare and publish a follow-up post to this one. He’ll just repeat and repeat again the same baseless claims.
Regards,
Bob
Bob Tisdale:
Bob, You are REALLY pathetic.
Using solid data, I proved that decreased SO2 aerosol emissions resulted in increased temperatures, many of them resulting in an El Nino.
You dismiss it all as baseless claims,apparently because you lack the intelligence to be able to understand them..
A real pity
.
Bob Tisdale.
Don’t smile. He was confused. We were talking about conflicting data, not my claim
John Tillman:
Are you saying that the data from the Climate Prediction Center is incorrect?
Its El Nina and La Nina episodes match every plot of average anomalous global temperatures that I have ever seen.
(Recall that you said there was a strong El Nino in 2020 after the Philippine eruption. The Climate Prediction center shows the LAST El Nino was between Aug 2018 and July 2019)
We were talking about conflicting data, not my claim. Again, I would like to know what is going on.
John Tillman, I’ve made a mistake and replied to the troll. If we ignore the troll, he’ll have no one left to preach his nonsense to. We’re the last two. And I’m gone for good on this thread.
Regards,
Bob