Guest “putting 2 and 2 together” by David Middleton
This post is the nucleus of a hypothesis I’ve been trying to develop. It is a “work in progress” and not fully thought out or as organized as I would like it to be. However, I’ve gotten it to the point that I thought I needed to write something up and post it on WUWT to get some feedback.
Two, Number One
A couple of years ago, I authored a post on “ocean deepening,” discussing this article:
Oceans are at their deepest in 250 million years
And they have hardly been deeper in the last 400 million years than now.Lasse Biørnstad
JOURNALIST
PUBLISHED Monday 08. june 2020 – 12:24
“It moves absurdly slowly,” says Krister Karlsen. He is a PhD candidate in Geophysics at the University of Oslo (UiO)’s Centre for Earth Evolution and Dynamics.Karlsen is talking about how the Earth’s tectonic plates move – ever so slowly but surely, every single year. From a human perspective, this happens so slowly that it is almost imperceptible.
[…]
The world map 200 million years ago shows all the continents assembled in the supercontinent of Pangaea, a time when dinosaurs were well on their way to dominating the Earth’s landmasses.
Since then, the continents have been shifting farther and farther apart, and now they may be as far apart as they can be, says Karlsen. Give the Earth a few hundred million years more, and the continents will probably remerge into a new supercontinent. One proposed name for that possible future reunion is Pangaea Proxima, according to New Scientist.
The movements and age of tectonic plates have a great effect on the depth of the world’s oceans. Just over 100 million years ago, the oceans were around 250 metres shallower on average than they are today.
The older the seabed, the deeper it is, according to a new research article by Karlsen and several colleagues at the Centre for Earth’s Evolution and Dynamics.
[…]
Science Norway
Karlsen et al., 2020 is essentially a reconstruction of plate tectonics and the age of the oceanic crust over time.
According to their reconstruction (and others), 100 million years ago, during the middle of the Cretaceous Period, the oceans were about 250 meters shallower than they are today *and* sea level was about 250 meters higher than it is today.

Process that for a moment… The oceans were 250 meters shallower, but the water level was 250 meters higher than it is today. This was due to the geometry and distribution of the ocean basins.
During the Mid-Cretaceous, shallow seas covered many continental interiors…

While the ocean basins were, on average, considerably shallower than they are today.

Two, Number Two
There is an interesting pattern here, the highest sea levels have occurred when the ocean basins were at their shallowest. These were also times when atmospheric CO2 levels and average surface temperatures were generally elevated. The only time when conditions were similar to the Neogene-Quaternary Periods was during the Late Carboniferous (Pennsylvanian) and Early Permian Periods.

This graph didn’t sit well with the CO2-Driven Climate Paradigm crowd, so they decided to “fix” the temperatures by adjusting them to pH values calculated from CO2. We can see that this yields a much better correlation between CO2 and temperature.

Oddly enough, the Royer/Berner temperature curve yields a decidedly non-catastrophic equilibrium climate sensitivity of about 1.3 °C per doubling of CO2:

It’s worth noting that the Royer pH-corrected temperature data indicate unreasonably warm temperatures during Paleozoic glacial periods.
The analysis of Royer et al. (2004) assumes an unrealistically high pH correction. First, it neglects the ice-volume effect, which changes the relation between δ18O and ∆T. Second, this large pH correction implies high temperatures for seawater even during times of extensive glaciations.
Moreover, the analysis of Royer et al. (2004) consists of boot-strapping, by introducing a correction to ∆T that is an implicit function of RCO2. It is then not surprising that a correlation between ∆T and RCO2 is obtained. This would be the case irrespective of the RCO2 model utilized.
A proper analysis, which avoids this bootstrapping and considers a more realistic pH correction, shows that the global temperature sensitivity to CO2 is still relatively small.”
Nir J. Shaviv & Jan Veizer reply to Royer
Forming a hypothesis
Over the past few years, I’ve been trying to develop a hypothesis that links the depths and general geometries of Earth’s ocean basins to average global temperatures and atmospheric CO2. The generally accepted hypothesis holds that weathering rates of silicate rocks governed the atmospheric concentration of CO2 (Berner & Kothavala, 2001). This is the basis of the GEOCARB model of Phanerozoic CO2.
Way back in the Pleistocene (1976-1980), when I was a young geology student, the notion of CO2 as a driver of climate change was largely scoffed at…
Suggestion that changing carbon dioxide content of the atmosphere could be a major factor in climate change dates from 1861, when it was proposed by British physicist John Tyndall.
[…]
Unfortunately we cannot estimate accurately changes of past CO2 content of either atmosphere or oceans, nor is there any firm quantitative basis for estimating the the magnitude of drop in carbon dioxide content necessary to trigger glaciation. Moreover the entire concept of an atmospheric greenhouse effect is controversial, for the rate of ocean-atmosphere equalization is uncertain.
Dott, Robert H. & Roger L. Batten. Evolution of the Earth. McGraw-Hill, Inc. Second Edition 1976. p. 441.
Sometime after 1980, a new paradigm emerged, suggesting that Phanerozoic Eon climate change had largely been driven by CO2 (Royer et al., 2004). The model was that the weathering rates of silicate rocks governed the atmospheric concentration of CO2 (Berner & Kothavala, 2001) and that CO2 was the “control knob” for temperature. However, I’ve noticed problems with this paradigm in the Eocene, Miocene and Pliocene Periods. It may be time for a paradigm shift.
Putting Two and Two Together
Assuming the Royer/Berner temperature is valid (a YUGE assumption), it would appear that either CO2 drives temperature or vice versa… Or something else drives both CO2 and temperature. I recently came across an excellent reconstruction of Phanerozoic sea level. Chris Scotese (of PaleoMap fame) is one of the coauthors. They reconstructed the two primary components of sea level change: plate tectonic eustasy (green curve) and glacial-eustasy (light blue curve) and combined them into a tectono-glacio-eustasy (dark blue curve). Unsurprisingly, sea level changes over the past 540 million years have been mostly driven by plate tectonics.

The Scotese temperature reconstruction from the Geocraft article has a pretty good fit to the van der Meer sea level reconstruction:

While Berner’s GEOCARB exhibits a secular decline in atmospheric CO2 over the Phanerozoic Eon, the Late Carboniferous and Neogene-Quaternary are strikingly similar.

It’s important to note that sea level reconstructions are, by nature, highly uncertain. Notice how widely the three reconstructions vary, particularly during the Paleozoic Era.

Between temperature, CO2, sea level and ocean depth reconstructions, there is no lack of uncertainty. Uncertainty is pervasive in geology and climatology. However, I’m still intent on putting two and two together here.
The first two….
Oceans are at their deepest in 250 million years
[…]The world map 200 million years ago shows all the continents assembled in the supercontinent of Pangaea, a time when dinosaurs were well on their way to dominating the Earth’s landmasses.
Since then, the continents have been shifting farther and farther apart, and now they may be as far apart as they can be, says Karlsen. Give the Earth a few hundred million years more, and the continents will probably remerge into a new supercontinent. One proposed name for that possible future reunion is Pangaea Proxima, according to New Scientist.
The movements and age of tectonic plates have a great effect on the depth of the world’s oceans. Just over 100 million years ago, the oceans were around 250 metres shallower on average than they are today.
The older the seabed, the deeper it is, according to a new research article by Karlsen and several colleagues at the Centre for Earth’s Evolution and Dynamics.
[…]
Science Norway
The second two…
There is an interesting pattern here, the highest sea levels have occurred when the ocean basins were at their shallowest and the continents were relatively closer together. These were also times when atmospheric CO2 levels and average surface temperatures were generally elevated. The only time when conditions were similar to the Quaternary Period was during the Late Carboniferous (Pennsylvanian) and Early Permian Periods.
WUWT
The funny thing is that the highest sea levels have occurred when the ocean basins were at their shallowest and the continents were closest together.
Rates of mid-ocean ridge spreading determine the average age of the ocean floor and therefore, according to the depth/age relationship of cooling oceanic crust (Parsons and Sclater, 1977; Stein and Stein, 1992), control the volume of the ocean basins. Assuming a constant volume of sea-water and conservative estimates of continental hypsometry, the changing volume of the ocean basins directly dictates first-order mean eustatic sea level at > 10 Myr timescales (Conrad, 2013; Miller et al., 2005; Simmons et al., 2020; van der Meer et al., 2017).
van der Meer et all., 2022
While it is an assumption, it is an assumption based on what is understood about the geological histories of plate tectonics and sea level variations. Tectonic eustasy moves sea level up and down by altering the shapes of the ocean basins. Glacial-eustasy moves sea level up and down by moving water back and fourth between the oceans and continental ice sheets and glaciers. Neither process appears to require the net addition or subtraction of seawater over the past 540 million years. It appears that water added by volcanic outgassing and cometary impacts has been roughly balanced by the water subducted into the lower crust and mantle. Glacial-eustasy has rarely been a significant factor during the Phanerozoic Eon.
The deeper the oceans, the more CO2 they can store. According to my Stratigraphy & Sedimentation textbook, Principles of Sedimentology by Friedman and Sanders…
When the pH of seawater decreases, calcium carbonate dissolves. In warm, shallow seas, at a pH of about 8.3, dissolution of aragonite and calcite particles by inorganic processes is almost nonexistent. However, since the classical studies of the Challenger expedition, it has been known that the proportion of calcium-carbonate particles in seafloor sediments decreases as depth of water increases (Table 5-1). Such decrease is particularly rapid at depths between 4000 and 6000 m. Although the reasons for this decrease have been debated, the evidence suggests that calcium carbonate dissolves because the CO2 concentration increases with depth. The control on CO2 appears to be part biological; it results from biological oxidation of organic-carbon compounds. Also, the water masses at greater depth were derived from the polar region; their temperature is lower and the water contains more dissolved CO2. Increased concentration of CO2 is in turn reflected by lower pH, which leads to calcium carbonate dissolution. However, the increase of pressure with depth may also be involved; such increase affects the dissociation of carbonic acid (Eqs. 5-11 and 5-12). The depth at which the calcium-carbonate decreases most rapidly is known as the carbonate-compensation depth, defined as the depth at which the rate of dissolution of solid calcium carbonate equals the rate of supply.
Friedman and Sanders


A very thorough, easy to read, description of the relationship between CO2 and seawater pH… However, the phrase “ocean acidification” is notably absent from the entire 300+ pages. How is this possible?
Even way back then, we knew that past atmospheric CO2 concentrations were often much higher and the oceans had oscillated between calcitic and aragonitic seas during periods of high and low atmospheric CO2 concentrations. The graph below is more or less a cartoon; but it demonstrates that during the Phanerozoic Eon, the only two periods when magnesium-enriched calcite and, less abundantly aragonite, dominated marine geochemistry were from the Mid-Carboniferous to the Late Triassic Periods and the Neogene to Quaternary Periods (~35 MYA to today).
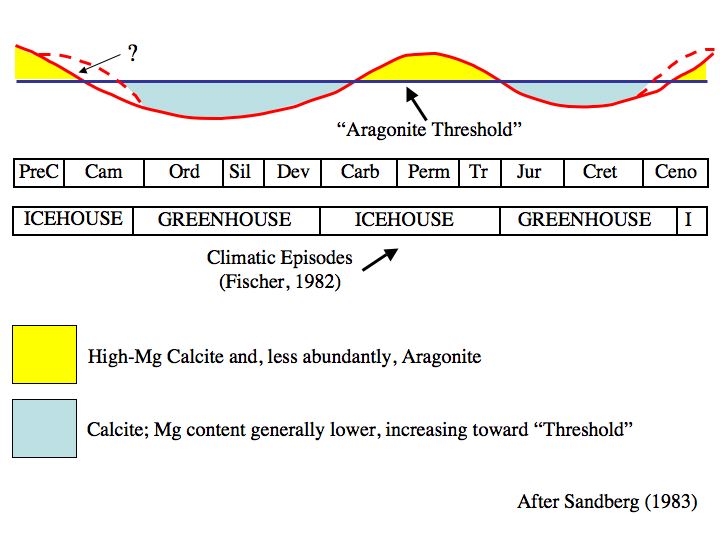
These two time periods also featured deeper ocean basins, ice sheets over one or both polar regions, relatively extensive alpine & valley glaciation, low concentrations of atmospheric CO2 and generally cool to cold climatic conditions.
The CO2 storage capacity of deep oceans (3,000m water depth) is massive. It us so massive that some have suggested injecting it at the seafloor in deepwater.
CAPACITY
Adams and Ken Caldeira, 2008
Oceans occupy more than 70% of the Earth’s surface and have an average depth of about 3.8 km. Considering the saturation concentration of CO2 in seawater, this storage capacity is orders of magnitude greater than the capacity needed to absorb the CO2 produced by burning all of the world’s fossil fuel resources, equivalent to an estimated 5000 to 10,000 GtC.
Now, I’m not advocating doing this. It would be prohibitively expensive and likely to cause actual environmental harm. I’m just noting that the inventor of the phrase, “ocean acidification,” thinks this is worth looking into.
The oceans know what to do with CO2:
CO2 exists in seawater in various forms as part of the carbonate system:
Adams and Ken Caldeira, 2008

The relative proportions of these species are defined by the pH of the solution and by equilibrium relationships. Dissolving additional CO2 increases production of hydrogen ions (decreasing pH), but the change is buffered by conversion of carbonate into bicarbonate. Thus, the principal reactions for CO2 dissolution in seawater are as follows:
Adams and Ken Caldeira, 2008


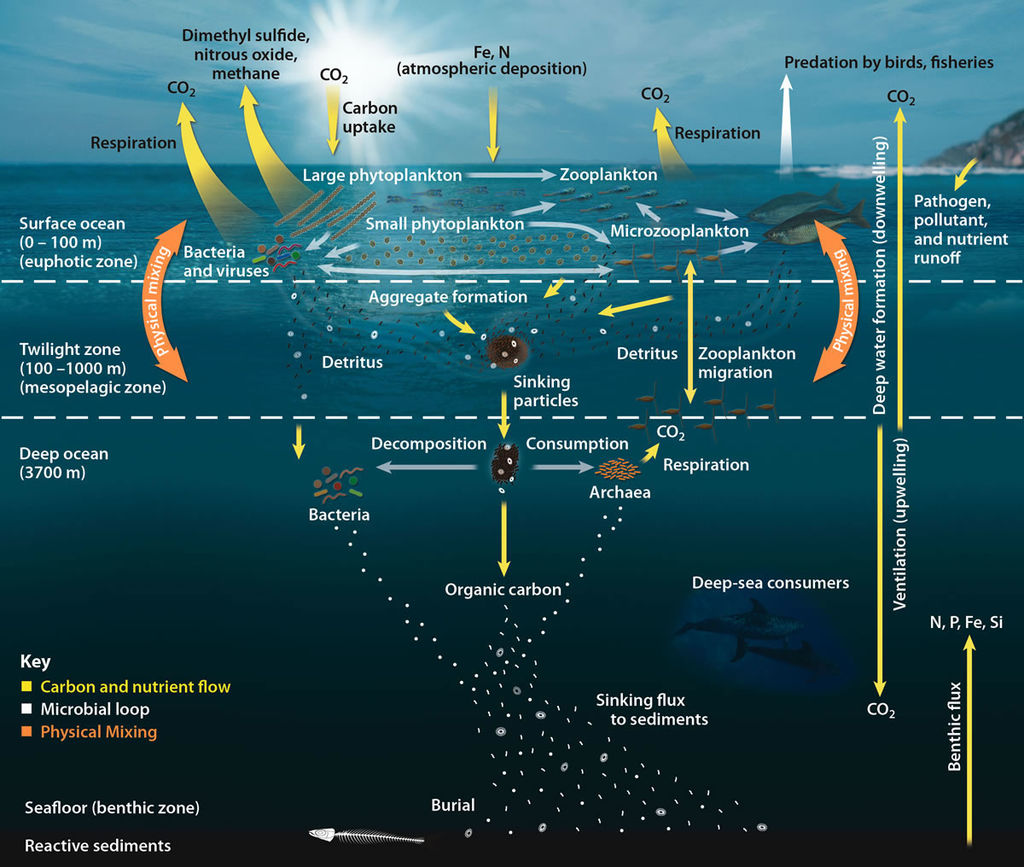
The CO2 that has accumulated in the shallower waters of the oceans will eventually find its way to deeper waters anyway via the biological carbon pump. It will just take much longer than capturing it and injecting it.
I think that changes in the depths of the ocean basins, over geologic time, has moved the carbonate compensation depth (CCD) up and down and that this is Earth’s primary control knob for atmospheric CO2. Periods with shallower ocean basins have generally had shallower CCD’s, higher concentrations of atmospheric CO2 and generally warmer temperatures. I think changes in the depths of the ocean basins can largely explain these things. While there clearly is some relationship between CO2 and temperature, I don’t think it’s the dominant factor in either direction over geologic time. I don’t consider the ~100,000 year Late Pleistocene glacial cycles, when temperature changes clearly drove changes in atmospheric CO2, to be geologic time. These short-term fluctuations aren’t resolved over 10’s of millions of years. Nor do I consider changes over the past 150 years to be geologic time. This is literally “noise.” This hypothesis I’m trying to develop, will try to explain changes over millions to tens of millions of years.
Any suggestions as to how to proceed would be helpful Of course, if the hypothesis has so little merit, that I shouldn’t waste any more time on it, please let me know.
Now I just have to work out the details… Stay tuned for more posts on this topic.
References
Adams, EE, Caldeira, K, 2008. Ocean Storage Of CO2, Elements 4 (5):319-324, DOI: 10.2113/gselements.4.5.319.
Berner, R.A. and Z. Kothavala, 2001. “GEOCARB III: A Revised Model of Atmospheric CO2 over Phanerozoic Time”, American Journal of Science, v.301, pp.182-204, February 2001.
Dott, Robert H. & Roger L. Batten. Evolution of the Earth. McGraw-Hill, Inc. Second Edition 1976. p. 441.
Friedman, G.M. and Sanders, J.E. (1978) “Principles of Sedimentology”. Wiley, New York.
Goswami, A.; Hinnov, L.; Gnanadesikan, A.; Young, T. Realistic Paleobathymetry of the Cenomanian–Turonian (94 Ma) Boundary Global Ocean. Geosciences 2018, 8, 21.
Karlsen, Krister S., Mathew Domeier, Carmen Gaina, Clinton P. Conrad,
A tracer-based algorithm for automatic generation of seafloor age grids from plate tectonic reconstructions, Computers & Geosciences, Volume 140, 2020, 104508, ISSN 0098-3004, https://doi.org/10.1016/j.cageo.2020.104508.
Royer, D. L., R. A. Berner, I. P. Montanez, N. J. Tabor and D. J. Beerling. “CO2 as a primary driver of Phanerozoic climate”. GSA Today, Vol. 14, No. 3. (2004), pp. 4-10
van der Meer, Douwe G., Christopher R. Scotese, Benjamin J.W. Mills, Appy Sluijs, Aart-Peter van den Berg van Saparoea, Ruben M.B. van de Weg. Long-term Phanerozoic global mean sea level: Insights from strontium isotope variations and estimates of continental glaciation. Gondwana Research, Volume 111, 2022, Pages 103-121, ISSN 1342-937X, https://doi.org/10.1016/j.gr.2022.07.014.
May I ask.. relative to WHAT???
Relative to 0 million years ago…
“Today” doesn’t literally mean October 3, 2022.
During the Mid-Cretaceous (~100 million years ago), sea level was ~250m higher and the average depth of the oceans was ~250m shallower… relative to 0 million years ago.
you got no measurements back then
Matthews et Al 2016 as referenced in Karlsen et al., 2020 and stated in David’s post
We also had no measurements for temperature in Yamal back then, yet Mann managed to divine the global temperature from a single tree
Time stops for no man — not even Mosher. If a police officer is investigating an accident, he doesn’t have the luxury of having real-time sensors recording everything as the accident plays out. He has to play Sherlock and deduce from the post-accident evidence what took place and in what order. Geologists do the same thing.
There are many kinds of controlled laboratory experiments that provide a foundation for understanding the physical and chemical processes that create certain kinds of rocks and patterns of deformation. But, all the ‘forensic’ investigations ultimately depend on Hutton’s observation that “The present is the key to the past.”
I suggest that you stick to the area for which you supposedly have documentation of your past formal education.
What I mean is a logical issue. First of all, even if all the ice melted, the sea level would rise about 80m only. To be 250m higher than today, there should have been a lot more water than exists today. I am open to the idea there was more water, and some of it has disappeared in some way. However, that would need to be explained.
The other persective would be simply a “flatter” Earth, I mean the surface, not the whole planet (not talking about “flat Earth” ;). But in this instance it would become extremely hard, if not impossible, to define a sea level. At least compared to what it is today..
Same volume of seawater + ice…The higher sea levels in the Cretaceous we’re due to less accommodation volume in the ocean basins.
I almost went into detail on this topic, but I didn’t want to write a 2,000 word tome… But I will work up a post specifically on this topic.
The whole hypothesis assumes that the circumference of Earth is nearly the same today as it was over 200 million years ago as the blank area outside of Pangaea north, south, east and west either had no land above the water line or barren land without any water in the graphs given above. Yet, there are numerous high water lines on the tops to the bottom of most mountains globally from the time given. How can erosion from water circle mountains if they were not under water, and, then other erosion marks at lower and lower elevations showing the water surface dropped in stages at different times? That aquatic fossils are high up in many mountains globally says those were under water with no evidence of land shifting upwards post the flora and fauna that lived there died. For land masses to move apart, land has to be created between them underneath the “oceans” as the land is pushed away on the opposite side of the land masses with no evidence of an area that land existed there to be moved, subducted, or whatever in the ideology the Earth has been the same size. Our Oceans Floor is the least explored parts of Earth and yet what has been mapped and dated proves the land nearest every continent is the same as the exposed lands and that ridges farther out are younger and younger as they near the Ocean Trenches that every one of them show the Spreading of the Oceans Floors with few evidence of any subductions. It should be noted that dated rock formations of ocean ridges from spreading correlate to mountain water level erosions dropping. But that goes against most everything geologists believe in of Continental Drifting.
Those would be rifts and they are often comparatively shallow.
The deep trenches are in subduction zones.
relative?
thats an anomaly not an absolute measure
and ??
Please say something rational… that means something !
Bitcoin prices are down so he has time on his hands. I remember when he was contact tracing everyone.
That’s just Mr. Mosher sniping at his betters again.
Other related issues to tie in…
Ocean Surface Area
Sea Level Atmospheric Pressure
Total ocean evaporation( ocean cooling rate)
At glacial low sea level; higher pressure, lower surface area, less evaporation, less cooling.
At high sea level; lower pressure, more surface area, more evaporation, more cooling.
These could be the dominate feedbacks at the limits…
Look at dead sea evaporation rates
You’re ahead of me – I was just thinking that shallower oceans mean less area of land masses and whether there is merit in comparing the ratio of land area to sea area, over the same timeframe, as regards CO2 generation. Deeper seas might store more CO2 but with larger land masses more may be being generated (I’m assuming CO2 from ocean organisms would remain roughly similar). Whilst it doesn’t contribute much to the central idea, it could be useful to take a look at?
Distribution of land mass by latitude is surely key. If land is tropical then there is less ocean area producing CO2 and more cooler circumpolar water sequestering it compared with polar land and tropical ocean. Shallow seas may tend to be warmer too.
True but this is likely to stay the same, broadly speaking. What would change, as seas get deeper but retain the same volume, is overall landmass area increasing with more area for natural CO2 production.
It immediately struck me looking at the estimated maps for Panagea at 100m year intervals above. YMMV.
IIRC, the poles were at times warm.
But surely always cooler than the tropics by virtue of the cosine law.
DM, some initial reactions before I ponder more.
Reproduced figure 5.1 is a key. It says there is about 15% more sequestered CaCO3 in the first 1000 meters of seafloor sediment than in the next 3000 meters. That tells me the key to your geological time frame atmospheric CO2 hypothesis is not change in average ocean depth (250 meters in 100 million years on an average depth of 3800m is only ~6%) , but rather change in the amount of shallow (<1000 meters) ocean floor making a much bigger difference.
Now, ‘shallow ocean’ (<1000 meters sequestering more CO2 as calcium carbonate via the euphotic zone biological pump) is generally viewed as continental shelf. Pangea had to have had less before it broke up. Smaller continental pieces always have more edge surface as a mathematical fact, so presumably more shelf.. Dunno if there is any literature on geological time frame changes in total continental shelf (and shallow continental inland seas), but that is where I would focus your next thoughts.
Figure 5-1 from Friedman & Sanders refers to the fraction CaCO3 of in seafloor sediment, not suspended in the water. There is little to no CaCO3 below the CCD (~4000m in Figure 5-19)…
But there’s lots of CO2 (or compounds that used to be CO2)…
https://rwu.pressbooks.pub/webboceanography/chapter/5-5-dissolved-gases-carbon-dioxide-ph-and-ocean-acidification/
IT PROBABLY HAS NOTHING TO DO WITH CO2.
“According to their reconstruction (and others), 100 million years ago, during the middle of the Cretaceous Period, the oceans were about 250 meters shallower than they are today and sea level was about 250 meters higher than it is today.”
For average depth of the oceans to be 250 m less, AND average sea level to be 250 m higher is a logical impossibility UNLESS the water is piled up on land. You have to take the top 250 m of the oceans and put it on land. Given the 70-30 relationship between the oceans and the land, this makes the height of the water nearly a mile high – everywhere! Can only be done if the water is solid. ICE!!
Now given that the water is solid, and does not flow back into the oceans, its weight will depress the land surface. Depressing the land surface means that the ‘earth’ under the ‘land’ has to move sideways, thus raising the ocean bed.
At some stage you will be able to get a balance, where the ocean bed has been lifted Xm, and the land surface has been sunk Ym, so that the ocean is still 250m shallower and the sea level 250 m higher.
Sounds rather like “Snowbell Earth” perhaps?
CO2 is a follower of temperature unless there is enough addition to increase the atmospheric mass.
Attached is the frequency analysis of the Spratt 2016 ocean level reconstruction. The three distinct cycles of precession, obliquity and eccentricity stand out. So very clear that the orbit has been the driver of ocean level in the past 800kyr. CO2 follows the orbit as well.
Lapse rate is also a consideration. During glaciation, the ocean level can fall maybe 120m. The average elevation of land above MSL increases from the present level of around 800m up to 1200m. That means land will be about 4C cooler than the ocean surface in addition to already being 6C cooler on average.
The other significant fact is the atmospheric mass. A 10% increase in atmospheric mass will increase the ocean temperature limit from the current 30C to 33C.
All the current temperature trends can be explained by orbit and the ocean temperature limits of 30C and -1.8C. Solar intensity over Antarctica and Southern Ocean has been declining for about 500 years and that is causing the cooling trend. The reverse is occurring in the NH and that is causing the warming trend. Tropics are stuck around the 30C limit.
Once ice mountains forms, that surface can never exceed 0C no matter what level of sunlight. South Pole currently gets the highest single day average solar intensity and that surface is never warmer than 0C. Any fresh snow is reflective so that reduces the heat input.
The current cycle of glaciation is 500 years in but still to see the ice accumulating.
May I take a broad view of this statement and many other confidently asserted statements like it that we see so often here at WUWT?
You don’t have to have any scientific knowledge to see that if this statement (and many others like it; this is just a single example) were even remotely true, then every self-respecting fossil fuel company boss in the world would be pouring millions into investigating the assertion. They would be absolutely right to do so too, to protect their industry.
You really need to ask yourself why that doesn’t happen. How come the many weird and wonderful “paradigm shifting” insights, that appear so regularly on this website, are ignored even by the stakeholders who would benefit most from them being remotely true?
The answer is pretty obvious. It’s because these claims are hoplessly wrong. Embarrassingly wrong. When this website first started it hosted people like David Archibald and Don Easterbrook who were then confidently forecasting imminent global cooling because of the sun, or the oceans, or… something. It didn’t happen. The long-term warming continued and continues.
What are we saying now in this particular article? That the oceans are rising because the ocean floor is pushing it up? Are you serious? Because the fossil fuel bosses don’t think you are, otherwise they would pay some attention to you. They also think you are cranks. Sorry, but that’s true.
Apart from small, dwindling and, I am sorry to say, increasingly pitiful ‘support groups’ such as those represented on blogs like WUWT, no one thinks that such nonsensical ideas have even a sniff of being right. They don’t even entertain them as possible get-out strategies because they, like most reasonable people (and maybe even you, deep down), know they are nonsense.
You never put facts and morality between a CEO and money. Any informed CEO can see that the NutZero is the biggest money spinner for the fossil fuel industry and every other resource because the solution is far more energy intensive than just using the fossil fuels for the energy source.
I know the Southern Ocean is cooling because the solar intensity is reducing. I know the NH is warming on average because the solar intensity is increasing. I know the tropics are stuck near the limit of 30C.
And I know that CO2 follows the orbit.
I can easily demonstrate every climate model is WRONG.
And yet here is TheFinalNail in a rear guard action to keep the climate emergency alive with fact free BS.
Don Easterbrook wrote my geomorphology textbook…
https://wattsupwiththat.com/2017/09/20/the-value-of-old-textbooks/
Small, and pitiful.
An apt description of the science invented to back the AGW political agenda.
Non-science is not subject to pity.
Perhaps ‘pathetic’ or ‘malicious’ are words that work in that sentence?
“if this statement … were even remotely true, then every
self-respecting fossil fuel company boss in the world would
be pouring millions intoinvestigating the assertion. They
would be absolutely right to do so too, to protect their
industry.”
Maybe they are, in fact, protecting themselves from their biggest
threats- the political, scientifically unfounded “Big Green Machine”,
the powerful WEF, & most of all, the weaponized liberal
governments (US- DOJ, FBI & the Intel community- where the process is the punishment (h/t Mark Steyn))!
“The long-term warming continued and continues.”
What’s your definition of “long-term” in this context?
As Rush Limbaugh often said, liberals only “know” what has happened since they became “aware” of the world around them. That is their ONLY reverence period. tfn, griff, etc. show this to be true.
As I have said before, when I first viewed the magical hoakey shtick, I immediately knew it was BS because I had been taught SOME history in school, you know, about the Middle Ages and the Renaissance, and that WARM PERIOD, and Washington crossing the ICE CLOGGED Delaware river during the LITTLE ICE AGE. These two eras, having been unseen in Mann’s BS graphic and so called scientists claiming it was some sort of PROOF of a direct relationship between mane made CO2 and “global average temperature anomaly”, was ALL I needed to determine, IMHA, it was all POLITICAL.
Shortly thereafter, Gore’s clownish movie was the final proof I would ever need that I had “guessed” right, it was nothing but politics, AND crony capitalism.
At any point in the descent of a rollercoaster coming down the first hill that is higher than its start point, TFN would insist it is still going UP.
LOL!
I love CO2 and so do the plants and animals.
> What are we saying now in this particular article? That the oceans are rising because the ocean floor is pushing it up?
How about you read what he said.
He said the amount of water is not changing. That leaves one variable, the depth to area ratio.
Oceans becoming shallower is almost same as seas covering larger areas while being shallower.
And please, please consider this. When David Archibald writes about his crackpot ideas, that’s not David Middleton. Different dudes. Watts provides a platform, you may argue he provides it too easily, but he just provides platform. It is up to you and I to read and find weak spots.
You found a weak spot in your reading, like massively weak. Sit down and listen.
It always amazes me how the most unreasonable people are the ones who claim that they represent the most reasonable people.
TFN: “That the oceans are rising because the ocean floor is pushing it up?” That is not what the article said. Read better.
When the ocean basins are shallow do they become too shallow to reach the CCD? Otherwise it’s not clear to me how basin depth controls CCD. Forgive me if I just read too quickly.
I’m still working that part out. In general, it appears that over geologic time, deeper ocean basins have had deeper CCD’s. However, a lot of factors affect the CCD:
Ocean Chemistry:
Lysocline: the depth at which a rapid increase in dissolution occurs; it separates the well preserved (above) from the poorly preserved (below) calcareous microfossil assemblages . The typical depth of the lysocline is between 3700-4500m and varies are a result of the carbonate ion concentration in the deep and intermediate water masses. It is shallowest when the CO2 concentration of the water is highest because those waters are the most corrosive to the calcareous microfossils.
Compensation Depth (of aragonite or calcite): the depth at which the amount of calcium carbonate delivered to the seafloor is equal to the amount removed by dissolution. The average depth of the calcite compensation depth (CCD) is 4500 m in the Pacific and 5500 m in the Atlantic and shallows when there is a greater supply of carbonate material to the seafloor. Only above the CCD can carbonate materials be deposited (below the CCD they dissolve and do not reach the sea floor). The deep depth of the CCD results only in dissolution on the lower parts of the slope.
Factors that affect the depth of the lysocline and the compensation depth include:
Calcium carbonate solubility increases with increasing carbon dioxide content, lower temperatures, and increasing pressure. Other factors that can influence the dissolution of calcium carbonate: organic coatings on the grains, size of the grain (smaller grains dissolve faster).
http://www.sepmstrata.org/page.aspx?pageid=358
The scientific world trembles with anticipation.
Jealousy..
… because no-one ever expects any rational scientific thought from you.
Bitter and twisted much? And your contribution to advancing our understanding? Nope, thought not – just zero.
If you don’t think highly of what David has written, I have a suggestion for you: Facts that point out your reason(s) for disagreeing have much more impact that a simple-minded insult.
Your scientific world 😉
Every village has an idiot, and on WUWT it’s you.
Well, one of the idiots…
Why do you suppose the planet has experienced an ice age or near ice age about every 150 million years?
Glaciation is linked to Earth’s orbit, which significantly alters the intensity of sunlight over the surface.
The three dominant orbital cycle show up in any historic reconstruction of sea level, surface temperature and CO2. Attached analysis is for the sea level reconstruction by Spratt 2016.
I personally like Nir Shaviv’s hypothesis…
https://arxiv.org/abs/astro-ph/0209252
I think rates of oceanic crustal formation might also have a similar driver.
Have you seen this article that discusses volcanism and tectonism being dependent on the combination of moon size, moon orbital orientation, proximity to the Sun, and rates of body spin and cooling. https://www.sciencetimes.com/articles/35718/20220122/imbalanced-earth-tug-of-sun-moon-drives-planets-plate-motion.htm
Don’t worry until they can explain India’s headlong rush north into Asia.
A direction contradictory to a one size moon, Earth’s spin and the moon’s orbit.
I had not seen this… Thanks!
The usually unmentioned ‘other’ motions of Earth and Sun in space.
Until we can view these motions and conditions from well outside of our Sun’s collection of orbiting rocks and gases for a few hundred millennia, we can only speculate what happens as our Sun crosses through rockier areas of space within our position in the MWG’s spiral arm.
Estimating Earth’s historical average oceanic depth bothers me…
Earth is a spinning mass, @ 1528 feet per second.
Right now, Earth’s continents obstruct water circulation. Some of them obstruct the lower atmosphere circulation.
When a Pangaea forms, that suggests Earth is an unbalanced spinning ball.
Water circulation is uninhibited over most of Earth’s surface.
I would expect oceanic water to offset the imbalance of Earth’s large aggregation of continents.
Extensive chalk seas in the Upper Cretaceous indicate high sea level with extensive shallow water basins 200 – 300 metres deep. Ice melt is not enough to explain this extent of sea level rise. so shallower ocean basins have less volume. makes perfect sense.
I met Peter Vail in 1980 when he talked to the local exploration society on eustatic sea level changes. he asserted that there were only 2 drivers
1) The volume of ice tied up in the polar icecaps and continental glaciers and
2) The total rock volume of the mid ocean ridge systems
I suppose he could have added in average global sea temperature which affects thermal expansion of water
Also age of oceanic lithosphere is important as you point out with cooling over time oceanic lithosphere becomes more dense and hence less buoyant relative to the asthenosphere , and therefore sinks to accomodate abyssal plains
On thinking more if oceanic ridges contribute to eustatic sea level then Beniof zones would contribute also but in the opposite sense. Are total lengths of Beniof zones and oceanic ridges the same? Possibly, in which case Vail would be wrong in assertion 2). However age of oceanic lithospkere sounds like a good driver of eustatic SL..
I think you are onto something here David but don’t abandon wiggle picking because lease rounds are coming up-or not – , at the whim of a demented political class on both sides of the Atlantic
Karlsen is talking about how the Earth’s tectonic plates move – ever so slowly but surely, every single year. From a human perspective, this happens so slowly that it is almost imperceptible.
more unfalsifiable fairy tales.
thats all geology is.
next up people will argue they use gps to measure milimeters of movement in plates.
ive been here since i was a kid.
aint seeing no plates moving
That’s because they move “ever so slowly but surely,”
But seriously, are you saying plate tectonics is false?
Steven
are you OK?
I was going to ask the same thing! Mosher appears to be wondering about in his own little world removed from reality.
Mid-life crisis? He’ll be buying a bright red convertible next!
Probably a Prius…
Ever sat in the dining room on a cruise ship in a heavy sea? Do it, you’ll see plates moving….
aint seeing no plates moving
Why do GPS maps have to be updated every few years?
And all of the physical markers implanted into Earth’s surface so geologists can measure land movement and direction.
Mosh appears to be trying to induce lack of confidence in Earth science by denying geology’s hard physical repeatable evidence.
Can you see your fingernails growing, or do you just become aware suddenly that they are in need of trimming? (Maybe they only grow while we are sleeping.) 🙂
However, tectonic plates don’t always move by creep. People experiencing earthquakes have personally observed land shifting several feet in a matter of seconds. Just be glad you “aint seeing no plates moving!”
Ever FEEL an earthquake?
“Sometime after 1980, a new paradigm emerged, suggesting that Phanerozoic Eon climate change had largely been driven by CO2 (Royer et al., 2004). The model was that the weathering rates of silicate rocks governed the atmospheric concentration of CO2 (Berner & Kothavala, 2001) and that CO2 was the “control knob” for temperature”
It wasn’t after 1980. Arrhenius had it around 80 years earlier, including the part about weathering of silicate rocks. From “Worlds in the Making” (1908)
“ that CO2 was the “control knob” for temperature””
It was a non-science conjecture, based on pure speculation, back then..
… and nothing has changed.
I’ve a feeling that this mechanism was known about before Arrhenius put pen to paper. The originators of the carbon cycle, Priestley and Lavoisier were also aware of it so it isn’t a new concept. The idea of connecting it to the control of temperatures was a new twist, however.
Every time I see the name Arrhenius, I think of a Roman scholar.
I didn’t claim that it wasn’t an idea. I correctly stated that it wasn’t the paradigm…
“it wasn’t the paradigm”
In 1965, the US President asked a bunch of scientists to report on changes to the atmosphere. They reported, and the President released it to the public; here is his statement:
Here is near the start of their chapter on CO2:
It’s all there, the role of silicate rocks, the GHE. Sure sounds like the paradigm.
Paradigm ≠ “a bunch of scientists”
The scientists who wrote that were Revelle, Broecker, Keeling, Craig and Smagorinsky. When the President asks the top people to submit the state of scientific knowledge, they may not be right, but what they write has to be seen as the current paradigm.
They weren’t claiming that CO2 was the primary driver of past climate changes.
They stated that the rate of weathering wasn’t adequate to accommodate the rate of CO2 emissions growth from fossil fuels.
This is not a paradigm:
“The part that remains in the atmosphere may have an effect on climate”… in the future.
It does “have an effect on climate”… At most 1-2 K per doubling.
Eddie Paskey played a role on Star Trek…
William Shatner played a much bigger role on Star Trek.
It is amazing how people think the earth is a greenhouse.
In 1965, CO2 was not viewed as pollution; that is a new ‘definition.’ In the ’60s and ’70s, the concern was for smog (ozone) and acid rain, phosphates in detergents and rolling banks of foam in rivers, and rivers catching fire, not something that makes plants grow more vigorously and be more tolerant of drought. The concern about the “ability to feed ourselves” was driven by the effects of ground-level ozone, nitrous oxides, and acid (sulfate) rain.
Note that the authors state, “… an increase of atmospheric carbon dioxide could act, …, to raise the temperature of the lower air.”, not that it would. They are offering a hypothetical possibility, being circumspect because they understood that there could be unknown mitigating feedback that would prevent it. Thus, it was not a “paradigm,” just an expressed concern that they acknowledged was controversial.
As usual, you willfully ignore the most important, and most correct, part of what Arrhenius said, which was that IF humans could manage to warm the climate by adding CO2 to the atmosphere (based on this HYPOTHETICAL effect), that they would be IMPROVING the climate.
The moment someone mixes lime into any acid destroys the imaginary speculation.
Rocks buried for hundreds of millions of years decompose into clay.
Not because of carbonic acid, but because of available oxygen, hydrogen, sulfur and strong acids (often caused by hydrothermal solutions).
The predominate dissolved mineral in most seas/oceans is plain salt, NaCl. Other similar salts are also available ‘KCl’, KNO₃’, etc. etc.
Carbonic acid and Carbonates are low on the dissolved list.
Simple oceanic life turns CO₂ into various carbonates.
“Assuming the Royer/Berner temperature is valid (a YUGE assumption), it would appear that either CO2 drives temperature or vice versa… Or something else drives both CO2 and temperature.”
I don’t think atmospheric temperature drives anything, but I think average ocean temperature
drives everything.
One can wonder what warms or cools the atmosphere or the ocean.
Say, space rock [or anything] warms the entire atmosphere 20 C, then this has little effect upon climate climate [or anything]. But if space rock warms entire ocean by 10 C, that drives everything for more than 10,000 years.
Or atmosphere, weather. Ocean, climate.
Temperature fluctuation is probably just a byproduct of the earth’s natural processes – this idea of making it THE central factor may be viewed as ludicrous in years to come!
Sorry to be slightly off topic, but I just had to supply this link to a UN representative talking about manipulating Google searches and “owning the science”: https://www.youtube.com/watch?v=9IwEv_rluhw
Really off-topic, and nothing new. Google doesn’t serve you, it does some odd posing in deciding what you are *really* searching for. But yea, remember that any inconvenient content is highly throttled.
> The older the seabed, the deeper it is, according to a new research article by Karlsen and several colleagues at the Centre for Earth’s Evolution and Dynamics.
How in the Hell did this pass peer review? Visit the Rocky Mountains. Collect seashells.
They’re talking about oceanic crust.
The Rocky mountains were once part of a shallow inland sea about 100 million years ago, or more. The presence of shallow inland seas is, indeed, mentioned in the article although the Rockies are not specifically mentioned.
Overlay a bathymetry map of the Atlantic Ocean on a seafloor age map. Repeat for the Pacific Ocean.
Peer review?
This is not an iron law, it is an observation that summarily holds. Look at the maps as Middleton said.
The dating of the seafloor is not too difficult. The oceanic crust is generally made out of basalt, which is amenable to radiometric dating and records the polarity of Earth’s magnetic field when it crystalized.
Here’s a bathymetry map:
Here’s a map of the age of the seafloor:
So the temperature reconstruction is basically using CO2 levels as the proxy. When the reconstructed temperatures then match reconstructed CO2 levels, this is then touted as ‘proof’ that CO2 controls temperature.
This is a perfect example of actually ‘begging the question’, isn’t it? It’s definitely a perfectly circular argument, anyway.
It’s just more of the classic pseudo-scientists who begin with their conclusion (CO2 drives temperature) and work their way backwards trying to support it.
David
If it is any consolation, I was blogging a decade ago about how unsafe it was to ignore changes in basin shape, volume and capacity during debate about sea level change.
As you know, it is generally unsafe to assume the excuse of “all other things being equal” in geosciences.
I did not try to investigate what happened to basins over geological time because the available data were too uncertain. There are heroic uncertainties to be overcome before quantitative analysis.
However, we all should hypothesise to challenge prevailing wisdoms. That is one way science progresses. Geoff S
Think like a climate scientist, then decide what you want the answer to be. Make a model to produce the desired result and pick out data which agrees to support your “science.”
I haven’t considered the depth as a factor, but the temperature of the ocean itself.
The calcite cycle is part of the general marine chemistry cycle, and it appears to be controlled by hydrothermal flux through the oceanic crust – possibly correlated to sea floor spreading rates. Increased hydrothermal circulation pulls more Ca+2 out and replaces it with Mg+2.
https://personal.ems.psu.edu/~lrk4/pdfs/Kump_AGU_Lowell_Ch14.pdf
The rate at which Earth is cooling (from the inside) seems to be oscillating. When Earth rapidly cools, the atmosphere and oceans are relatively warm, and vice versa when the Earth is cooling slower. The mechanism is the increased activity at ocean ridges that is enough to uplift the entire average ocean floor depth by 150m. This of course comes with increased hydrothermal circulation and new sea floor creation.
Geothermal heat at the ocean bottom has orders of magnitude more heating capacity for the Earth system than sunlight at the surface. You can’t tell me that, enough mantle upwelling to increase the ocean basin depth by 150 m, doesn’t also have an impact on ocean temperature. This too would cause CO2 degas from the oceans.
Heat only travels one way – hot to cold. There are not many locations where the ocean bottom is warmer than the surface.
Oh, I believe there are. This is why ice forms at the top, where the water is obviously at or around 0C, not at the bottom of the ocean.
As usual, just like in the atmosphere, convection trumps radiation and conduction every time.
Ice forms on the surface and it is colder than the water below but it is not transporting heat from the bottom.
The saline water liberated during the surface ice forming transports surface heat downward.
Deep oceans experience very little convection because the bottom is always cooler than the top. The only significant heat transport at depth is driven by the salinity carrying surface heat downward.
I’m not sure how you imagine that more saline water transporting heat downward is not also transporting cold upwards. Anything going down has to displace something, and if it’s warmer than whatever is below it, some colder material must be transported upwards. That is convection, the very thing that you imagine isn’t happening.
Hence the bottom becomes warmer than the surface.
“Hence the bottom becomes warmer than the surface…”
The hopium is strong in this one.
Not much ice forms in equatorial Pacific
Loydo has never heard of currents.
First of all, the Earth core is estimated to be over 5,000 C.
Last of all, 2-4 C water is siphoned into the oceanic crust and spit out at 400 C, mostly at the mid ocean ridges but elsewhere as well.
You will need computer models if you want to impress the establishment.
This seems to be a large magnitude physical explanation, rooted in deep geology. We definitely have been for some decades in a declining interest in even considering hypotheticals, now calling them models in too many fields as if the word bares accurate enough attributes to reality. The Wikipedia graph is way too simple, easy to construct one that looks more like a Rorschach test. That’s also an exaggeration as we have had some success over the decades partitioning these cycles, but carbon has been long known as one of the most complex partly because of its connections with other similarly complex cycles from elements to ecosystems.
I am from one of the last generations that had the pleasure of a fairly broad education in the sciences, especially in oceanography, much of the chemical and the hard rock part of geology still too mysterious. While it’s been a generation since I heard a real seminar on the earth’s carbon cycle, doubt that it is that much better understood given all the newer technologies now able to better measure, especially quantitatively. If you ignore the simulations, papers in many relevant fields seldom seem to have adequate proofs of the magnitude of your problem.
Our discipline definitions are largely arbitrary so if you get out of your ‘realm’ and don’t mind getting properly burned some but learn from it, have at it. Might come across some outlier of unknown importance. Your answer to Istvan with Atlantic/Pacific depth curves may be a decent average, but needs some squiggles in it as also the devil in the details about CO2 dissolution.
A fairly recent (2000) quote (in Journal of Physical Oceanography) about the physical ocean. “….It is well known that determining the true uncertainty of geophysical spectra is fraught with problems…”
Your discussion of “highest sea levels” still isn’t coming across to me. Does it mean less land projecting above water or is it a measure from the center of the earth, or from some other physical point, to the surface of the ocean ?
Sea level is relative to dry land. The depth of an ocean basin is relative to the seafloor.
Think of the ocean basins as bowls surrounding patches of dry land. Where does the water go if you push the bottoms of the bowls up or down?
This is a source of confusion. The volume of above the sea level land and its area can go in different directions. Having deep oceans then shallow oceans doesn’t need a change in the amount of water, just the shape of the surface. See the concern troll above who was also doing that.
It initially confused me… And I’m a geologist. The notion that higher sea levels are associated with shallower ocean basins seems counterintuitive… However, it makes perfect sense from a plate tectonics perspective.
So there was less land above the water; therefore more surface water than the current 70%. Being under water rather than above water had nothing to do, per se, with water depth.
The mantle causes it. Downwelling under continental crust sags the continent and upwelling bulges the oceanic crust at the mid ocean ridges.
I suspect it’s simpler. Diatoms are very oleaginous. Oil spreads on the ocean surface, lowering albedo and reducing evaporation. See Seawifs for some numbers.
I’ll try to post a simplified guess — a Feynman guess — below. No doubt it’ll be binned but if the mods could send it on to the author I’d be grateful. Sewage fed seas warm faster, as do oil/surfactant polluted seas. The best or worst example is the Sea of Marmora.
Periods of rapid silica ocean feeding give major diatom growth, More lipid smoothing, warming.
JF
OCEAN WARMING: A DISREGARDED MECHANISM
The mainstream media, many of the blogs, the radio pundits etc would have us believe that the science of global warming is settled and that all we have to do to save our civilisation is to apply the solutions our wise and infallible leaders have decided on. But what if we did as they said and the planet kept on warming? Well obviously we’d have to sack those ‘experts’ and our entire political class. But what then? Well, we’d have to look for new ideas. Let’s save a bit of time and look for new ideas before it hits the fan, not scrabble around desperately when it’s too late.
I have been advised by a working scientist that my habit of detailing the below points to those publishing in related fields is counterproductive: they are fully occupied with their work and lack the time to consider the implications, so let me detail a possible warming mechanism that as far as I can see has not been considered. For those who know that the science is settled, and we’re all doomed, just think of me as having gone the full Icke.
For twenty years I flew with the RAF. More than half of my flying time was over water, the Atlantic, the Baltic, the Gulf of Mexico, the Persian Gulf, the Mediterranean, the Gulf of Oman etc etc, much of it at 200ft or below. Flying from Cyprus in the early ‘70s was when I first noticed sea surface pollution which I later realised is a common phenomenon. It is a world-wide problem with many seas polluted to a greater or lesser extent with oil or oil/surfactant. Large smoothed areas are readily apparent. The sewage pollution of all our water courses is, of course, general knowledge.
MARINE/ATMOSPHERE BOUNDARY LAYER MODIFICATION: A DISREGARDED CONTRIBUTOR TO ANTHROPOGENIC GLOBAL WARMING?
Executive Summary
The ocean/atmosphere boundary layer covers 75% of the Earth’s surface. This layer can easily be polluted with our civilisation’s oil and surfactant. To a limited extent this comes from major spills, but the majority comprises the myriad tiny drips from internal combustion engines, from every drain and river, and from every washing machine (1). These form a molecule-thin layer which reduces evaporation and lowers albedo. It smooths the surface, suppressing wave formation which in turn reduces the production of salt cloud condensation nuclei from spray and entrained bubbles. The consequent reduced cloud cover further lowers albedo. A warmed surface causes stratification.
Sewage and leaching of farmed soils further alters ocean ecology: well-fed, unstressed plankton populations boom, releasing less dimethyl sulphide and creating fewer cloud condensation nuclei; when oleaginous phytoplankton blooms die they release lipids which have the same effects as mineral oil pollution.
It is reasonable to assume that all these factors tend to increase surface warming, but the extent of that warming or even if it is a problem is unknown.
A SUGGESTED NON-CO2 WARMING MECHANISM
The marine/atmosphere boundary layer covers nearly three quarters of the Earth’s surface. Modern civilisation is modifying it with oil and/or surfactant, and altering its underlying phytoplankton ecosystem with sewage and with nitrate, phosphate, potash and dissolved silica from farming run-off.
First, the oil/surfactant. Benjamin Franklin demonstrated this effect on Clapham Common’s Mount Pond in the early 1770s, and in a classic experiment Lord Rayleigh used it to estimate the size of an oil molecule. It may be that you will confuse an oil or oil/surfactant smooth with what we normally see on soap bubbles or on oil spilt in puddles, lovely rainbow colours. That is caused by the light bouncing around inside the oil and getting cancelled as it criss-crosses. A proper oil film is so thin that light goes straight through it. (Those with an inquiring mind can demonstrate this – blow a soap bubble and watch the iridescence swirls and spins until the soap film gets too this for internal reflection and little kite-shaped areas that look like nothing at all swim around in the bubble skin. Try it, all will become clear.)
So, oil, surfactant and oil/surfactant mixtures smooth ocean surfaces and spread into thin films. Ripples are suppressed which in turn suppresses wave breaking. Which brings us to the technical term ‘albedo’ and begs the question ‘how far does a thin film spread?’. Franklin’s experiment smoothed about half an acre for a teaspoon of oil. Call it five ml to smooth an acre and then calculate how much oil would smooth the Gulf of Mexico, the Sea of Japan, Lake Tanganyika, Lake Superior, the Black Sea, the Sea of Marmora…
The pollution data from the SeaWifs satellite is out of date – by now oil pollution will be much greater — but the measurements indicate how great the problem was and no doubt is. (Note 1 below.) So we have a chance of quantifying the area of ocean surface smoothed by oil and/or surfactant pollution.
The Haber-Bosch nitrogen fixation industry now equals or exceeds fixation by natural processes. Modern machinery has increased the efficiency of phosphate and potassium extraction. The sheer weight of fertiliser now used, and soils weathering without vegetation cover, provide the nutrients that e.g. diatoms and other oleaginous plankton need to bloom. Diatoms, ferocious competitors, suppress the growth of other phytoplankton until their limiting resource, dissolved silica, is exhausted. Unstressed, well-fed phytoplankton release less dimethyl sulphide, a precursor to CCNs, and so cloud cover reduces. Stratification (warmer water tends to sit on top of colder and reduces mixing) eventually restricts the mixing of nutrients from below the light zone and the bloom dies. Storing up to 45% of their dry cell weight as lipids, the effect of a bloom die-off is obvious as the lipids are released into the water column. (See attached image for a possible result.)
Ocean warming is important. If it is caused not only by the CO2 greenhouse effect but also by increased insolation, reduced evaporative cooling and the lowered albedo of smoothed water, we need to know.
Suggested Research.
May I tentatively suggest worthwhile areas of research into the extent of this Anthropogenic Local Warming (ALW)?
A. Evans and Ruf (2) have used the CYGNSS satellites to search for areas of smooths associated with microplastic pollution. Further research suggests that the smoothing they detected has more to do with surfactant pollution than with microplastics, but the source of that pollution is puzzling – thin films are supposed to oxidise rapidly. Their techniques could be used to quantify the world area of smooths. This is the vital first step. Cost £++
Experiments on albedo change caused by smoothing have been carried out, see https://arxiv.org/abs/2111.07021 (3). Cost £++
B. Certain lakes and seas, gulfs etc are warming at anomalous rates. A survey of data relating to warming for lakes such as Michigan, Superior, Tanganyika, Baikal, and the North and Baltic seas, the Black Sea etc might be productive. The Sea of Marmara (which is warming at twice the global rate with huge diatom blooms) will, I believe, prove to be the canary in the coal mine for combined sewage, nutrient run-off and surface pollution effects. If a literature search (the cheapest option) confirms the high rates of warming in certain water bodies then hands-on research would be justified. Cost £+ to £+++ Quantifying a molecules-thick film will be an interesting challenge.
C. Deliberately polluting clean water bodies with oil/surfactant mixtures should be used to quantify the effects. However, the SeaWifs data shows that it might prove difficult to find unpolluted lakes. (See “Up In Smoke” (1)) Cost £++
D. A search through satellite imagery to examine oil spills and cloud structures above them would be cheap and easy. The Deepwater Horizon satellite images show areas which the fond eye of an obsessive with a theory could interpreted as cloud suppression. Archive video of the Shetland Braer disaster will, if I recall correctly, show cloud ablation which may indicate reduced lifetime for oil polluted droplets ripped from the sea surface by high winds. Cost £+
E. A literature search of sea surface temperature and ship loss records from the North Atlantic in WWII would yield historic pollution data. An experiment of large-scale oil spillage on a major ocean has actually been carried out, namely the Battle of the Atlantic. Professor Tom Wigley’s ‘blip’ may have an explanation. (4) Cost £+
None of this would be blue sky research. Something is causing the warming anomalies and it needs to be identified.
Author’s note: I have neither the training nor the background to justify making these points. However, I have seen the phenomena and I feel it is important that observations from my work experience (which is comparatively rare) should be on record with someone who might be able to make use of them. I reassure myself that Feynman tells us that anyone can guess.
JF
1. https://seawifs.gsfc.nasa.gov/OCEAN_PLANET/HTML/peril_oil_pollution.html
2. http://cygnss.engin.umich.edu/wp-content/uploads/sites/534/2021/06/Evans-Ruf_Detection-of-Ocean-Microplastics_TGRS-2021.pdf
3. https://arxiv.org/abs/2111.07021
Yukun Sun, Christopher Ruf, Thomas Bakker, Yulin Pan
4. Professor Tom Wigley, UEA, when correcting the wartime SSTs, found that there was an irreducible temperature excursion which he dubbed ‘the blip’.
Attachment:
FRACTURED SMOOTH FROM 40,000FT EN-ROUTE TO MADEIRA, MARCH 2012.
file:///C:/Users/julia/AppData/Local/Temp/lu182817acu.tmp/lu182817acz_tmp_a52dfce5d8dbeb62.png
Taken from a 737 en-route to Madeira in March 2012. This fractured smooth began abeam Porto and finished a couple of hundred miles short of our destination, the width being beyond the extent of visibility. Areas with almost complete smooths overloaded the primitive camera phone. Fractured areas, as here, showed no wave breaking within the smooths, but in the unsmoothed areas the wave behaviour was typical of Force 4 on the Beaufort scale.
There had previously been an Azores high sitting over this area of the Atlantic for two or three weeks.
The total area affected amounted to thousands of square miles.
The source and identity of the smoothing agent is unclear. Over-fed oleaginous plankton could be implicated as nutrient-rich waters would not suffer from the rapid oxidation that precludes thin film oil from on-land sources reaching such remote offshore locations. Unless, of course, smoothing agents do not oxidise as rapidly as assumed. Seabed seeps are a possibility.
Very interesting.
An abundance of “Over-fed oleaginous plankton” attract over-fed oleaginous feeders of plankton and algae.
Sardines and herring also create oil smoothed surface waters in the ocean and lakes. Attributes also applied to their predators, including the mackerel family.
Fishermen seeking to harvest these fish use the smoothed oil surface and a cucumber-like fragrance to target these oily fish.
That was quick. Ta.
JF
David,
Very nicely done! I think that geologists are going to eventually be the heroes that turn the tide on CAGW and, hence, global collectivism, a thought I’ve had since looking at WE’s work-up on the CENOGRID data. I do wonder, however, re. Fig 5.1 that tabulated the ‘Challenger’ data, how they ever dredged samples from 7,000m depth back in the day.
I’ll check the textbook I copied it from.
Let alone random equidistant samples of equal quality.
It was also my understanding that deep sea water sampling was the most common test procedure before the deep submersibles were deployed.
Though keeping water collected at the pressures and temperature of circa 7,000 meter depths was/is not common practice.
A steam-engine powered dredges…
https://en.wikipedia.org/wiki/Challenger_expedition#:~:text=It%20was%20loaded%20with%20specimen,suspend%20the%20equipment%20into%20the
I’m just a lowly Chemical Engineer, but I have a few thoughts about CO2 and temperature. We know that the solubility of CO2 in water increases with an increase in pressure and a decrease in temperature (that’s why a warm Coke will go flat faster than a cold one). So, if the basins are shallower, then the pressure at the bottom would be lower and I would think the temperature would be higher since there is less “insulation” between the surface and the sea bed.
Simplifying things a bit, the atmospheric CO2 concentration will be in equilibrium with the CO2 concentration at the surface of the water. So, if you have a cold body of water saturated with CO2 and slowly heat it up from above (like the sun does!), the Vapor-Liquid equilibrium will drive CO2 from the water into the air. Assuming both stagnant water and stagnant air, the changes in concentrations are limited by the diffusion rate of the CO2 molecule from the surface of the water into the greater atmosphere.
With the CO2 leaving the top layer of the water, the “layer” (I’m visualizing each “layer” as a few molecules thick) below will have a higher concentration than the layer at the surface, so the equilibrium will drive the CO2 upwards into the top layer. This migration of CO2 continues throughout the entire depth of the ocean, but at a very, very slow rate since the diffusion of CO2 into the air and through the water is pretty slow.
Of course there will be some motion in the atmosphere and in the body of water that will mix things up a bit and likely speed up the CO2 migration to some degree.
I wonder if this also affects the CO2/CaCO3 equilibrium since at depth (higher pressure, lower temperature), the solubility of CO2 is so great that it “prefers” to be dissolved in water than meeting up with Ca.
David,
I think that your working hypothesis could be improved by considering another dimension — the role of orogenies. Orogenies increase the rate of magmatic CO2 production. Stacking crustal rocks up will decrease the areal extent of the land masses, which plays a role as important as the depth of the ocean basins. If the crust is thickened, it increases the area of oceans.
When a mountain range is at its greatest elevation, there will be a significant fraction of the land that is alpine, where physical weathering dominates over chemical weathering. Once a range is reduced to a peneplane, there is reduced physical weathering; almost all the weathering is chemical. Thus, in the first case, consumption of atmospheric CO2 by silicates and carbonates will be minimal, while it will be maximized in the second case because of higher temperatures and increased surface area of fine particles. The evolution of land vegetation was an actual “tipping point” in the cycling of CO2.
Mountain ranges transverse to the prevailing winds will also create an asymmetry in the precipitation because of orographic uplift and subsidence of hot, dry air. Rain water is important in producing carbonic acid, and allowing chemical neutralization reactions to take place.
I think that you are onto something, but the complexities of all the influencing factors over time are daunting.
Land water storage trends, summed over all basins, are positive for GRACE (∼71–82 km3/y) but negative for models (−450 to −12 km3/y), contributing opposing trends to global mean sea level change.
https://www.pnas.org/doi/full/10.1073/pnas.1704665115
I see you were here only a few hours ago, David, so maybe this thread isn’t completely dead. It appears to me that the subject of your focus here is related to another observation. The rivers of the world carry alkalinity to the seas (with a couple of notable exceptions), but the seas are not alkaline. Or at least aren’t very alkaline. They aren’t nearly so alkaline as lakes of interior drainage like the Dead Sea or Great Salt Lake etc.
Long ago people (say Ferrin McIntyre) thought the answer was found in the clay sediments on the ocean floor. Reactions of the alkaline species like bicarbonate with these sediments would return hydrogen ion to the ocean itself and from there return CO2 to the atmosphere. Then with the discovery of the smoking vents along the mid-ocean rises other people thought the alteration of new oceanic crust is the major process returning hydrogen ion to the oceans. The transition from one idea to the other took place slowly from about late 1970s to mid 1980s. A person no longer in contact with the academic world and literature might have missed it all. Frankly I don’t know where the story leads after about the mid 1980s because I transitioned away from the geological sciences and into programming and engineering after the mid 1980s.
However, the shape of the ocean basins is the result of the rate of spreading at the mid-ocean ridges — slow spreading leads to a great deal of deep basin. The greater the vigor of this spreading leads also to thermal vigor at the ridges and to a great deal of virgin oceanic crust to be altered. The fall of detritis to the oceanic floor is a process that carries on irrespective of vigor of spreading.
pH, CO2 in the atmosphere, plate tectonics, ocean levels, volcanic activity, and life in the ocean…what a complicated mess of interacting processes. Good luck.
Geology… “what a complicated mess of interacting processes”… Yep!
Nice thinking outside of the box. And weaving geologic factors into the equation.
That is a lot of speculation and assumptions by the “inventor of the phrase, “ocean acidification,” thinks this is worth looking into.“
This sounds like speculation and assumption.
It is my understanding that the oceanic deep water trenches and troughs are caused by subduction.
Locations where enormous amounts of seawater are subducted with oceanic and continental crust. Ingredients for powering the most explosive volcanoes.
More speculation and surprising proof these characters are assuming facts not in evidence.
A “Pangaea Proxima” can form in much shorter time frames.
History demonstrates that possibility, frequently within two hundred million years.
CO2 exists in seawater in various forms as part of the carbonate system:
Sure.
The relative proportions of these species are defined by the pH of the solution and by equilibrium relationships.
Sure. Also Shirley all sorts of alarm bells are going off because the latter claim is true in- and by itself, but Shirley not true for seawater. For seawater (world oceans really, there will be variations according to temperature and salinity), the carbonate species concentrations are given:
They are 90%, 9%, 0.9% and 0.09% respectively for bicarbonate, carbonate, CO2 and H2CO3.
That 90% concentration of bicarbonate gives the ocean it’s pH. It’s varying according to temperature and salinity but is around 8.1, perhaps 8.2 or somewhere in between.
/
Dissolving additional CO2 increases production of hydrogen ions (decreasing pH), but the change is buffered by conversion of carbonate into bicarbonate.
Yes. For freshwater and artificial seawater (laboratory seawater is not seawater, it is a brine) you will Shirley see a decreased pH in a laboratory cubic meter of brine. Bicarbonate buffer aside, your aquarium will be lifeless.
No. When it comes to our oceans, you can’t produce enough CO2 to move the bicarbonate concentration in 1.35 billion cubic kilometers from 90% (I believe I silly-calculated the concentration to amount to 90-100,000 ton per cubic kilometer).
The reason is that the carbonate species are in a delicate balance: If you add CO2, it will convert to H2CO3, HCO3- and CO3– to maintain those concentrations. If you add HCO3-, you might see instant outgassing to maintain the balance. If you add CO3–, it will also convert back up the slope
CO2– + H+ -> HC3O- +H+ -> H2CO3 -> H2O+CO2
Hence the bicarbonate concentration in said ocean is the same as before your though experiment, and that concentration still gives the ocean it’s pH which doesn’t move nowhere.
/
Thus, the principal reactions for CO2 dissolution in seawater are as follows:
CO2+H2O+CO3– -> 2HCO3-
No. That is kitchen chemistry-mathematics and does not happen. It is to energy-consuming and WTF would a CO2 molecule surrounded by H2O molecules go look up a very rare CO3– molecule when the straight forward actual reaction is…
CO2+H2O -> H2CO3
Which instantly splits to H+ + CO3–, and which happens so quickly that the formula for the most part is written CO2+H2O -> H+ + CO3–?
and that this is Earth’s primary control knob for atmospheric CO2.
Ocean Conveyor Belt/Thermohaline Circulation CO2-rich deepwater upwelling. Less than 1000 years for a circulation to move CO2-rich seawater from deep cold- to surface temperate- is a lot faster than any CCD change.
Anyways, according to Henry and Dalton Old-School, you don’t need more than approximately 0.0056 Kelvin temperature change to shift our oceans CO2 solubility with ~100ppm atmospheric CO2.
So the question is: Has our planet got warmer? Our ocean has gotten 0.0056 degrees Kelvin warmer?
OK then! There science (Dalton, Henry) tells us where we have your CO2 from!
Oddgeir
Note: A couple of edits earned me a spam??