Edwin X Berry, Montana, USA – 2022-08-02
Copyright (c) 2022 by Edwin X Berry. Permission granted to republish with link to Berry (2021).
Introduction
This summary of Berry (2021) shows the main points without the math.
1. How CO2 flows out of the atmosphere.
The Intergovernmental Panel on Climate Change (IPCC) correctly assumes the outflow of CO2 from the atmosphere is proportional to the CO2 level divided by a time constant.
This time constant – that the IPCC calls “turnover time” and we call “e-time” – describes how fast CO2 flows out of the atmosphere.
IPCC (2007, p. 948) defines “turnover time” equal to the first power of the carbon level divided by the outflow of carbon from the reservoir,
“Turnover time (T) is the ratio of the mass M of a reservoir (e.g., a gaseous compound in the atmosphere) and the total rate of removal S from the reservoir: T = M / S. For each removal process, separate turnover times can be defined.”
IPCC (2007, p. 948) says the turnover time (T) for natural CO2 is about four years.
“Carbon dioxide (CO2) is an extreme example. Its turnover time is only about four years because of the rapid exchange between the atmosphere and the ocean and terrestrial biota.”
IPCC’s data for its natural carbon cycle (IPCC, 2013, p. 470-471) show the e-time for atmospheric CO2 is 3.5 years, supporting IPCC’s statement of “about four years.”
Simple physics shows when outflow is proportional to the first power of level, natural and human carbon cycles are independent. So, we can calculate these carbon cycles independently and then add them up to get the total. We need only to calculate the human carbon cycle over time to see how human CO2 changes atmospheric CO2.
2. The first approximation conflicts with IPCC claims.
IPCC’s data show the inflow of human CO2 into the atmosphere is about 5% of the total CO2 inflow and natural CO2 is about 95%.
Since human and natural CO2 molecules are identical, their e-times are identical. Therefore, to the first approximation, the composition of today’s atmospheric CO2 is about 5% human and 95% natural.
Yet, IPCC (2013, p. 467, Executive Summary) says,
“With a very high level of confidence, the increase in CO2 emissions from fossil fuel burning and those arising from land use change are the dominant cause of the observed increase in atmospheric CO2 concentration.”
IPCC (2013, pp. 470-471) assumes the natural CO2 level remained at 280 ppm after 1750 and, therefore, human CO2 caused all the CO2 increase since 1750. This would make human CO2 about 32% of 415 ppm as of 2020.
How can a 5% inflow cause 32% of the CO2 level?
It can’t. Even the IPCC realizes this problem. So, to support its claim that human CO2 causes dangerous climate change, the IPCC incorrectly claims human CO2 stays in the atmosphere longer than natural CO2.
IPCC (2013, p. 469) incorrectly claims:
“The removal of human-emitted CO2 from the atmosphere by natural processes will take a few hundred thousand years (high confidence). … about 15 to 40% of emitted CO2 will remain in the atmosphere longer than 1,000 years. This long time required … to remove anthropogenic CO2 makes climate change caused by elevated CO2 irreversible on human time scale.”
This IPCC claim violates IPCC’s own data-based e-time and ignores that human and natural CO2 molecules are identical, and therefore their e-times are identical.
3. The second approximation proves the IPCC is wrong.
The first approximation considered only the atmosphere. The second approximation uses IPCC’s four-reservoir carbon cycle model. The physics model, using outflow proportional to level and IPCC’s e-times, replicates IPCC’s natural carbon cycle, shown in Figure 1.
Then, this same model calculates a human carbon cycle compatible with IPCC’s natural carbon cycle, using recursive, annual time steps from 1750 to 2020, shown Figure 2.
This compatible human carbon cycle shows human CO2 has added only 33 ppm (8%) while nature has added 100 ppm (92%) to IPCC’s 280 ppm level in 1750, as of 2020.
According to the scientific method, the physics model has proved IPCC’s claim – that human CO2 caused all the CO2 increase above 280 ppm – is false.
Good high-school students can learn how the physics model works.
4. IPCC’s natural carbon cycle
Figure 1 shows IPCC’s natural carbon cycle at equilibrium with atmospheric CO2 at 280 ppm (589 PgC). The boxes show reservoirs and arrows the flows between reservoirs.

Figure 1. Levels and flows for IPCC’s (2013) natural carbon cycle.
Figure 1 shows 1.4% of natural carbon is in the atmosphere and 90% is in the deep ocean. This is an equilibrium fingerprint that human carbon will approach.
5. Physics model applied to human carbon.
Figure 2 shows the physics carbon cycle model with IPCC’s four reservoirs and six outflows, where the arrows are all positive numbers.

Figure 2. The human carbon cycle model uses the same physics as IPCC’s natural carbon cycle but adds the annual inflow of human carbon.
Human carbon has added only one percent to the total carbon in the natural carbon cycle.
Figure 3 shows how the reservoir levels change with time for human carbon.
The purple dashed line shows the cumulative human carbon since 1750. The solid bold line shows the measured atmospheric carbon level above 280 ppmv.
Data alone prove natural CO2 increased the CO2 level above 280 ppm. The cumulative “New Human carbon added” before 1955 is less than measured “atmospheric carbon,” making it impossible for human carbon to have caused all the CO2 increase.

Figure 3. How human carbon levels change with time.
The red dashed line shows human CO2 added to the atmosphere is much less than the “New Human carbon added” because the CO2 e-time of 3.5 years lets CO2 flow out of the atmosphere much faster than it can accumulate.
6. The Bern model uses IPCC’s assumption.
Figure 4 compares the physics model with the Bern model.

Figure 4. Pulse decay by the physics model and the Bern model.
The key difference between the Bern model and the physics model is the Bern model uses IPCC’s invalid assumption that human CO2 causes all the CO2 increase while the physics model uses IPCC’s e-time of 3.5 years.
7. Isotope data show CO2 increase is natural.
Figure 5 shows
- 14C data (black solid line) and its curve fit after 1970 (black dashed line).
- 14C data relative to the δ14C value in 1970 (blue sawtooth line) and its curve fit.
- 12CO2 data in ppmv (red sawtooth line).
δ14C is a measure of the 14/ 12C ratio. The natural level of δ14C is zero.
Human CO2 has no 14C, so its δ14C is -1000. If human CO2 were 32% of the CO2 in the
atmosphere, it would dilute the natural δ14C level from zero to -320.
Data show δ14C has returned to its natural level of zero even as 12C (red line) has increased, showing that natural CO2 has dominated the increase in atmosphere CO2.
The 14C curve fit shows 14CO2 e-time is 10.0 years (Hardy and Salby, 2021; Berry, 2021).
The 12CO2 e-time is smaller than the 14CO2 e-time because the atom is heavier than
the 12C atom. This confirms that the e-time for 12CO2 is less than 10.0 years.

Figure 5. δ14C data (black line) and its curve fit (black dashed line), relative (blue sawtooth line) and its curve fit (black dashed line), and 12CO2 ppmv (red line).
Conclusions
The simple physics model – using IPCC’s outflow proportional to level and e-times –proves natural CO2 controls atmospheric CO2. As of 2020, natural CO2 has added about 100 ppm, and human CO2 only 33 ppm, to IPCC’s CO2 level of 280 ppm in 1750.
References
Berry, E. X, 2021: The impact of human CO2 on atmospheric CO2. Science of Climate Change, December 14, 2021, The impact of human CO2 on atmospheric CO2 – SCC (klimarealistene.com); https://doi.org/10.53234/scc202112/212
Harde, H. and Salby, M. L., 2021: What Controls the Atmosphere CO2 Level? Science of Climate Change, August 2021. https://doi.org/10.53234/scc202111/28. https://scc.klimarealistene.com/produkt/what-controls-the-atmospheric-CO2- level/
IPCC, 2013: Ciais, P., Sabine, et al. 2013: Carbon and Other Biogeochemical Cycles. The Physical Science Basis. Contribution of Working Group I to the Fifth Assessment Report of the IPCC. Cambridge University Press, UK and New York, NY, USA.
IPCC. 2007: Climate Change 2007 – The Physical Science Basis. Contribution of Working Group 1 to the Fourth Assessment Report of the IPCC. Annex 1: Glossary: Lifetime. https://www.ipcc.ch/site/assets/uploads/2018/02/ar4-wg1-annexes-1.pdf
“IPCC (2013, pp. 470-471) assumes the natural CO2 level remained at 280 ppm after 1750 and, therefore, human CO2 caused all the CO2 increase since 1750.”
It’s a very good assumption. Here is the plot of total C in the air over the last thousand years, as measured by Law Dome ice core and Mauna Loa, versus the cumulative total of our emissions (source):
It shows the amount in the air was very stable until industrial emissions began, and then increased proportional to the emissions, with stable factor about 0.5 (the airborne fraction).
LOL, using YOURs and the IPCC’s argument you show that CO2 doesn’t drive large temperature swings up and down during the last 11,000 years at all.
LINK
This has always been a massive problem for the AGW conjecture.
” you show that CO2 doesn’t drive large temperature swings up and down during the last 11,000 years at all”
That is true, and it isn’t a problem at all. The AGW proposition is that adding a whole lot of new carbon to the air will cause warming. It doesn’t say that all past warming was caused by adding new carbon to the air. Which it obviously wasn’t; until we started digging, there was no new source at all. Now there is.
ps your link also shows how stable CO2 was before we got to work on it.
You missed the glaring point here since if CO2 for 11,000 didn’t do diddly squat in generating LARGE warming and cooling swings that lasted for hundreds of years at a time.
Then it doesn’t have a demonstrated power to cause any large temperature swings since it HAPPENED without CO2 for 11,000 years which means SOMETHING else caused it and it is still operating today and has been for hundreds of million years into the past.
CO2 has NEVER been shown to be the main driver of temperature changes because its postulated warm forcing power is too small and way too small at the standard doubling rate from 1750 which is negligible AGW conjecture is utter nonsense when it comes to being a driver of temperature change.
“Then it doesn’t have a demonstrated power to cause any large temperature swings since it HAPPENED without CO2 for 11,000 years”
Of course it doesn’t have a demonstrated power. It is change in CO₂ that causes warming, and as your graph shows, CO₂ didn’t change.
Eating arsenic will kill you. That doesn’t mean that if you stay off arsenic, you’ll be immortal (other things can cause warming). The analogy of your argument is that if you haven’t been killed by arsenic in sixty years, it must be harmless.
Your arsenic argument is absurd which I shouldn’t have to explain here.
The Change in CO2 warm forcing effect at the 400+ ppm level is too small it doesn’t even stop Earth from increasingly shedding its energy into space which is going at a far greater rate than CO2 feeble warming effect rate at the 430 ppm level could produce.
All this while YOU and AGW supporters are ignoring that something else cause all those large temperature swings for the 11,000 years while CO2 took a long vacation as per the chart.
This avoidance of reality is problem of the warmist/alarmists for many years now which is why focusing on just CO2 is a sign of pseudoscience which is WHY I reject the AGW conjecture as it is.
Recall this point Willis made in his Where is the climate emergency post:
LINK
The current 1.8 W/m2 is feeble!
“Your arsenic argument is absurd which I shouldn’t have to explain here.”
OK, I’ll spell it out
Digging up and burning carbon will cause warming
Eating Arsenic will kill you
But temperatures have varied for other reasons
But people have died from other causes
But CO₂ was stable for 11000 years and it was not correlated with warming. It does not have “demonstrated power”.
But arsenic didn’t kill me for sixty years (I didn’t eat any). So no demonstrated harmfulness.
LOL,
Meanwhile once again you ignore the main point which you do over and over in the thread:
You ignored this.
You ignored this.
You ignored this as well which is why you are looking foolish as you are continually avoiding the main point that CO2 isn’t a climate driver at all and never has in the 11,000 years or in millions of years.
You keep ignoring the reality that something else is the DOMINANT driver of weather and climate change that is what YOU and stupid warmist/alarmists ignore all the time.
You ignored Willis Eschenbach’s point on how feeble CO2 is as a warm forcer.
AGW conjecture is stupid and feeble and that Positive feedback poop never shows up outside of 30 years of modeling guesses.
“you ignore the main point”
Well, I could go into all those things at greater length. But what you are ignoring is that this post is about the CO₂ in the air and its origins. It says nothing about temperature.
There is this manmade CO2 growth fraction after sinks.
https://budbromley.blog/2022/08/03/do-the-math-reject-the-wef-global-resetters/
But how can anyone prove beyond theory that CO2 makes it “warmer than otherwise” and by how much? Many experiments have been tried with many rebuttals.
https://www.academia.edu/resource/work/31305328 might be close.
As recently posted by Dr. Roy Spencer at WUWT, the rate of global warming based on satellite-based temperature data is the same now as it was 30 years ago +0.13C/decade (see https://wattsupwiththat.com/2022/03/01/uah-global-temperature-update-for-february-2022-0-00-deg-c/ ).
So despite the progressively larger annual increases in human emissions of CO2 that occurred over those 30 years, there has been ZERO change in the rate of global warming due to these mankind-originated emissions.
Fundamental thermal physics makes atmospheric CO2 incapable of warming earth surfaces, because its absorption/emission wavelength of 15 microns corresponds to a Planck black body radiation temperature of -80C, about the same temperature as dry ice.
To date there has been no provable mechanism illustrating how LWR from CO2 can heat or even slow cooling of anything near the surface.
Still looking..
To date there has been no provable mechanism illustrating how LWR from CO2 can heat or even slow cooling of anything near the surface.
There is lots of evidence that the atmosphere contains a lot of manmade CO2 — about 33% — and that CO2 is a greenhouse gas. There is lots of evidence that increased greenhouse gases inhibit earth’s ability to cool itself by some unknown amount. There is lots of evidence that downwelling infrared radiation is increasing, as evidence of an increasing greenhouse effect (although that would not identify which greenhouse gas is the cause).
You apparently reject 100% of BASIC climate science claimed by the world’s climate scientists, including almost all “skeptic” scientists. So either you are right, and they are all wrong, or they are right, and you are wrong. I’m betting that you are wrong.
You are doing nothing to help those of us who are climate realists trying to refute CAGW. The existence of some amount of AGW does not prove CAGW exists. But the false claim that AGW does not exist, marks one as a science denier.
RGreene. Firstly, a “lot” is highliy subjective but in line with IPCC nonsense terminology.
Secondly, energy is not all heat and so the logic thread you stitched up does not mean surface temps rise.
Many, I am one, reject the claim LW single spectrum 10.5um can be interchanged with full spectrum frequency and translated to temperature. At best, by some, it’s -80C.
Temperature is not additive quantity and that appears to occur in the math when switching with radiation. Can’t only get 6% LW from sun hit surface, but then get amplified by same gas as DW emission back to heat surface again. It’s already warmer than that spectrum intensity has available.
Like a microwave oven not heating the container…energy there (W/m2) but is not manifest as temperature.
Of these 7 climate change theories, CO2 theory #1 is least convincing, just look at the supporting sources…#1 political (Gore, IPCC) rather than specialists in other 6.
https://www.academia.edu/resource/work/14330776
Excellent answer! It addresses most of the key thermodynamic points!
Actually it’s illiterate nonsense!
Greenhouse gases inhibit cooling
More greenhouse gases have a larger effect.
Your nonsense does not change those facts
”Greenhouse gases inhibit cooling”
In theory. In practice, it is a meaningless statement.
Macha, single frequency LW indeed is not the same as full spectrum LW, but still it is energy. If it hits an object and is absorbed (which is for ALL frequencies for a black body), it adds to the total energy of that object.
If that leads to more warming or not, depends of the total balance of energy in and energy out. But you can’t say that a beam of 10.5 micron can’t heat an object above -80 C, as that is certainly not true: you can melt steel at 1200 C with such a beam, thanks to a CO2 laser…
Hmmm….. Just how much does that CO2 laser heat the entire piece of steel? why doesn’t the whole of the piece of the steel melt into a puddle?
Tim, the CO2 lasers that are used to cut steel have a capacity of one to several kW in their beam. The beam is very concentrated in a fraction of a mm2 and at the place where it hits the steel surface all that energy is absorbed and steel is melting at that point. Of course that heat will be distributed to the rest of the steel block with some time delay, but that is not enough to melt the whole block.
If you use a magnifying glass to concentrate sun rays, you can put a paper on fire at the point where the rays are concentrated, but what is around it is hardly increasing in temperature either.
“. But you can’t say that a beam of 10.5 micron can’t heat an object “
You tried to make it sound as if a low-powered CO2 laser could cut steel plate. I’m sorry, it won’t. And it depends on VERY LOCALIZED heating (how tight can you focus a laser beam?) Right down to the microscopic level.
And it takes multi-KW CO2 lasers to cut thick steel. Even then the entire steel plate (i.e. the object) is not really heated very much.
Take a 1 gram piece of steel and you’ll quite easily melt it!
ROFL!!
Indeed, by collision with cold helium atoms, thus maintaining population inversion. The resulting hot helium atoms must be cooled in order to sustain the ability to produce a population inversion in the carbon dioxide molecules.
And your point…in a natural air environment context?
My point is that a laser at 100°C can melt steel at 1200°C with a beam of around 10 micron.
Thus independent of the temperature of the source or the frequency of the beam.
CO2 absorbs and emits CO2 at the same around 10 micron frequency, regardless of its own temperature or of the surroundings, from near ground to high in the stratosphere.
If it captures some photon from the surface at that frequency and emits that again, hitting the surface, that will add to the energy balance of the surface. Regardless of the surface temperature at that moment.
If that results in heating or less cooling depends of the overall energy balance of the surface, but compared to an atmosphere without GHGs, the surface must get warmer, as the sum of sun energy and downwelling LW energy is larger than of sun energy alone.
The only way the surface can get rid of the extra energy is by heating up (even if that results in more convection…).
But it doesn’t melt steel..on its own.
Also emissivity and intensity are important.
Come on Macha, you wrote:
“Many, I am one, reject the claim LW single spectrum 10.5um can be interchanged with full spectrum frequency and translated to temperature. At best, by some, it’s -80°C.”
The laser beam is from CO2 alone and nothing else, whatever the other gases in the laser to enhance the intensity of the beam.
The laser beam is at 10.5 micron. According to some, it is not possible to melt even ice, as that is the peak frequency of a solid object at -80°C. But it does melt steel every day at millions of places on earth.
The simple conclusion is that neither the temperature of the sender (or its surroundings), neither the temperature of the receiver are important to absorb IR energy of any frequency: it is just energy and adds to the energy budget of the receiver…
No matter if that is CO2 within a laser at 100°C or CO2 at 20 km up in the stratosphere at -50°C.
Typical CO2 lasers work by heating a small spot to melting in the presence of oxygen. Their main use is in engraving. It takes a 1000w CO2 laser to cut 1/2″ steel and a 4000w CO2 laser to cut 1″ steel. Those are high powered lasers.
Nope!
All claims to prove it, to date, are specious.
You’ve not refuted the article above nor provided proof of your hilarious claim.
I accept that CO2 is a greenhouse gas and that the increases in CO2 should – all things being equal – cause warming. What we – and the IPCC – do not know is how much. It may be very small (say, if feebacks were smaller (or negative such as clouds). I do not believe (but cannot prove this) that CAGW exists but I believe AGW does but may be very small and not worth worrying about.
You are intelligent
Please comment as much as possible.
Patrick said increased co2 ”should” cause warming. He is correct.
You said does cause warming. You are a believer.
So an untestable hypothesis is evidence of this is it?
“Fundamental thermal physics makes atmospheric CO2 incapable of warming earth surfaces, because its absorption/emission wavelength of 15 microns corresponds to a Planck black body radiation temperature of -80C, about the same temperature as dry ice.”
Anyone who posts this nonsense indicates they have zero knowledge of the fundamental physics involved. The Planck temperature refers to the temperature at which a blackbody has a maximum at a particular wavelength. A gas such as CO2 emits/absorbs at wavelengths which cause vibrational/rotational transitions. Photons emitted at 15microns have no temperature, just wavelength, a blackbody absorber will absorb a 15micron photon whether it is emitted at -80ºC or 40ºC.
Macha,
Several remarks on what you wrote:
Bud Bromley makes the same error as Dr. Berry, we had the same discussion with him… The main difference: Dr. Berry is always polite in his answers, while Bud isn’t…
Even Harde did find 0.7 K warming for each CO2 doubling, if you read his work. Not much, but not zero either.
The effect of CO2 is already saturated in the main absorption bands, therefore any warming effect is by filling the side bands, which is a logarithmic process, thus decreasing, if the CO2 was linearly increasing. But as CO2 levels increase more or less slightly quadratic, the effect is linear… Which is what see happening…
IR of 10 micron can even melt steel at 1200 C, see what a CO2 laser can do:
https://en.wikipedia.org/wiki/Carbon-dioxide_laser
Gases are no black bodies and non-GHGs are even nobodies: they don’t emit or absorb in the IR bands.
Any body that can emit IR in some bands can absorb the same wavelengths, regardless of its own temperature or that of the sender. An IR photon doesn’t contain any temperature information from the sender…
A photon is just a package of energy, completely defined by its wavelength and if absorbed adds to the energy of the receiver, or you are destroying energy…
Further: back radiation is exactly measured with full spectra and amounts to over 300 W/m2. If that doesn’t increase the energy content of the surface, where goes that energy?
https://scienceofdoom.com/2010/07/17/the-amazing-case-of-back-radiation/
Here specific for CO2:
https://escholarship.org/content/qt3428v1r6/qt3428v1r6.pdf
Replied to another..
by collision with cold helium atoms, thus maintaining population inversion. The resulting hot helium atoms must be cooled in order to sustain the ability to produce a population inversion in the carbon dioxide molecules.
And….where are these artificially cooled helium atoms in nature.
The helium and other gases in CO2 lasers are only necessary to maintain the enormous amount of energy that the laser emits. Even without the other gases, CO2 would emit IR at around 10 micron, but a lot less.
My point is that your -80°C peak frequency is only true for solid and liquid materials, not for gases.
Even so, any black body object does absorb all frequencies, regardless of its own temperature or that of the sender. Any photon at 10 micron simply adds to the energy balance of that object.
No not at all. Energy at wrong frequency is transparent.
Macha, you are violating about all physical laws…
A black body can emit radiation at every frequency and equally can receive radiation at every frequency.
https://en.wikipedia.org/wiki/Black_body
IR at 10.5 micron get absorbed by near all materials…
Helium is used in a CO2 laser to maintain the inversion because the emission from the lower layer is a forbidden transition, that is not the case in the atmosphere. Helium is used because it’s very efficient at depopulating that layer. In the atmosphere because the excited level has an allowed transition to the ground state and there are many molecules colliding with the excited molecule at the rate of ~10 per nanosecond.
Really you are that clueless about the IPCC’s business model and that the Author Berry did say the following in the article:
and,
Climate change/global warming is what warmist/alarmists and the IPCC use many times in their scribblings.
You want to ignore it because it makes AGW conjecture look weak and irrelevant.
Ooops.
You and Berry are missing the main IPCC point:
In 1995 the IPCC arbitrarily declared that all natural causes of climate change were “noise”, Therefore, any climate change must be almost entirely blamed on humans. That is junk science. But that is exactly what the IPCC political organization was set up to do. And that is what they do with every report. They assume that global warming is manmade and dangerous, and then predict futire global warming will be manmade and dangerous. A perfect example of circular reasoning.
Did you read my comment since I wasn’t supporting Berry at all it was to answer Nicks statement he made:
Then I duly showed that the IPCC is indeed involved by asserting increasing CO2 emissions causes warming and Berry as the AUTHOR refers to climate change twice in conjunction to CO2 emissions.
Try slowing down and read slower.
Try communicating more precisely
Agreed. Ben Santer and the US State Dept have a lot to answer for with what happened in 1995 when the Science Report was altered retrospectively after Madrid to state that they could decern a human influence.
Nick is bright and well informed, but he’s acting like a classic liberal. Liberals confuse cause and effect, it’s not just about CO2 and temperature. It’s what they do. If it’s because the facts don’t fit their world view (that’s not how I want it to be) or because the facts don’t fit their agenda (We need the grant money and/or wind and solar sales) is irrelevant. The damage is the same.
Low information voters unknowingly slip into the precautionary principle trap, “well that’s what an esteemed scientist and The President (or the IPCC) say, so it must be true. We better not take the chance of destroying the planet”.
We end up with an economy crippling misallocation of limited capital resources being wasted on sunshine and breezes. It’s not complicated.
(he) “is bright and well informed, but he’s acting like a classic liberal.”
That’s a contradiction
So perhaps not bright or well informed?
Richard, I understand your position but there are a lot of very high IQ liberals, don’t doubt it. Just because their stated positions defy logic doesn’t distract from their obvious intellect. What a person claims to believe, and what that person actually believes can be 180 degrees apart. World views and agendas get in the way, But yes, their confusing cause and effect temps one to believe they may simply be “less than wise”.
“to support its claim that human CO2 causes dangerous climate change, the IPCC incorrectly claims human CO2 stays in the atmosphere longer than natural CO2.”
Wrong again.
The primary reason that the IPCC predicts CAGW, rather than AGW, is their claimed water vapor positive feedback, that allegedly multiples the effect of CO2 by 2x to 4x.
There are observations that a warmer troposphere will hold more water vapor — a positive feedback,
But the positive feedback has never caused runaway global warming in the past 4.5 billion years, with CO2 levels up to 10x higher than today.
That means something limits the water vapor positive feedback.
My logical guess is that more water vapor in the troposphere leads to more clouds, blocking more incoming sunlight.
Some process keeps our planet from overheating, and changes in clouds seems like a logical guess.
Correctly claiming that humans have added a lot of CO2 (+50%) to the atmosphere, and assuming that is likely to inhibit Earth’s ability to cool itself by some unknown amount, DOES NOT prove that CAGW exists.
CAGW does not exist and has never existed, so far. However, CAGW has been predicted for over 50 years. Proving that humans do not have the ability to predict the future climate.
Because that is exactly what the agw conjecture is!
It seems that you accept that ice cores have been valuable in providing atmospheric CO2 levels in the past and have shown quite some variation in atmospheric CO2 levels as the earth has gone in and out of ice ages etc. Not sure how it was done, but those studying the ice cores were also able to determine temperature and charting temp vs CO2 shows that they are very much in sync over the long haul.. However, and here’s the cruncher, on closer inspection of the data, it revealed that while both charts seemed to be in sync, there was a slight time shift difference between them of about 600-800 years.. Which occurred first ?? ………… Temperature went up, followed by CO2. NOT the other way around. i.e. a warmed ocean degassed CO2 and further in the cycle, a cooled ocean then again began absorbing CO2… so here’s solid evidence that in the past, as recorded in the ice cores from different places on earth, high CO2 levels were CAUSED by increased temperature, NOT that CO2 caused higher temperatures. ( and arsenic doesn’t get a mention !)
“high CO2 levels were CAUSED by increased temperature, NOT that CO2 caused higher temperatures”
Yes. I’ve been through that many times, on this thread and elsewhere. AGW says that if we dig up and burn fossil carbon, there will be warming. It doesn’t say that past temperature variations were caused by adding C to the atmosphere. And they weren’t; no-one was digging up carbon then.
Glacial temperature fluctuations were caused by orbital effects, and the warming caused fairly small CO2 variations. That is not relevant to the fact that putting masses of new carbon in the air will cause warming.
Nick, thinking that C = CO2 is just liberal, wrong, fuzzy and lazy thinking. They are not the same.
I am still awaiting that refutation of my claim that solar can never fulfill peak electricity demand.
Especially at night
Before you can definitively say that present warming is caused by CO2 you need to determine what caused past warming, and why it isn’t still operating. Until you can do that, you only have a theory, not proof of anything. The charts showing CO2 accumulation in the atmosphere, as compared to the significant variations in global temperature need an explanation of why temperature varies so much and what is causing it. The IPCC has already claimed solar influence is not sufficient to cause the temperature increase since 1870. So what caused it, and why did it stop.
You are conflating natural causes of climate change, where CO2 levels change as a result of temperature changes of the oceans, with manmade causes of climate change, where manmade CO2 emissions inhibit Earth’s ability to cool itself.
They are different processes that can happen at the same time.
You’ve got to learn that before you can effectively fight CAGW propaganda and scaremongering.
“you are continually avoiding the main point that CO2 isn’t a climate driver at all and never has in the 11,000 years or in millions of years.”
Mr Stroker may be ignoring that statement because you obviously don’t know what you are talking about. You keep conflating natural and manmade causes of climate change that are DIFFERENT.
Of course manmade CO2 was not a climate driver BEFI ORE THERE WAS MANMADE CO2. You are stating the obvious. Have you been drinking and posting?
You are suggesting that CO2 is a climate driver during those millions of years or during the 11,000 or 1,800 years’ time frames?
I made clear that if CO2 is sitting around the 280 ppm during the entire 1,800 or 11,000 years before 1750 came around it has to be caused by something else since there are no human emissions and no increase in CO2 in all that time to generate a warming trend.
That finally sink in Richard?
SunsetTommy, have a look at the ability of oil/lipid from oleaginous plankton to smooth and warm the ocean surface. I have seen a smooth, provenance unknown, that covered literally tens of thousands of square miles of the North Atlantic. Natural, nutrient run-off feeding plankton blooms, oil spills, synthetic surfactants?
If CO2 is a trivial driver it would be handy to have an alternative to explain the undoubted post-1910 warming. And the blip.
My inbox is always open (!). BTW, could someone give Willis a nudge.
JF
The Earth is not ruled by Gaia but by Oceana.
And another La Niña is upon us.
That’s good. Lower atmospheric CO2 growth – must be good, yes? – and δ13C ‘flat-lining’ despite the extra fossil fuels with a much lower δ13C dominating the atmospheric decline. Just as well the models can tells us why. /s
“AGW conjecture is stupid and feeble and that Positive feedback poop never shows up outside of 30 years of modeling guesses.”
AGW is a reasonable assumption with good evidence. A warmer troposphere holds more water vapor — there is a positive feedback — you are wrong again.
Your concluding sentence, that I quoted, is an embarrassment for climate realists — you sound like Floyd R. Turbo — an old Johnny Carson comic character.
Where is the “hot spot”, where is the rapidly increasing warming trend?
You seem to suggest that endless escalating positive feedback is possible and maybe developing right now.
You sound like someone falling for that never seem before endless positive feedback loop propaganda since that utter nonsense ignores basic meteorology of the movement of water vapor upward into clouds (this would mean clouds would increase over time increasing albedo) which is a cooling agent via the precipitation cycle.
“AGW is a reasonable assumption with good evidence. A warmer troposphere holds more water vapor — there is a positive feedback — you are wrong again.”
Then why is the IPCC and the CAGW advocates saying that we will see increased desertification from climate change?
More WV also means more rain – less desertification.
He vanished on me when I asked him a couple of questions:
Still waiting for someone to show we are in a climate emergency.
This PF Loop idea seems open ended since if it warms up then we get more water vapor which in turn generate more warming which in turn increase more water vapor in turn more warming till it reaches 212 F…..
The whole thing is STUPID!
It’s why the climate models are so un-physics based. y = mx + b forever. Positive feedback leading ultimately to the boiling point.
The modelers say they have to include factors to prevent the climate models from “blowing up”. Sure looks to me like they blow up anyway!
False analogy.
yeah even a science ignoramus like me can call bullshit on CO2 = arsenic.
Trace levels of arsenic in the diet are actually essential to metabolism.
CO2 is the basic building block of life.
Going by your logic:
Drinking milk doesn’t kill me. Hence producing CO2 will not cause me any harm.
Nick, your statement is false. CO2 increased from 180 ppm at the end of the last interglacial to 280 just before the industrial revolution according to the ice cores. The 50% increase should have massive positive feedbacks according to those believing in high ECS estimates. What we know is that temperatures have cooled. Do you have an explanation.
Some other factor limits positive feedback
That has been true for 4.5 billion years
Or else we would not be alive today to read Berry’s claptrap.
Nelson,
You didn’t really expect a reply, did you?
Perhaps you can explain how 5000 ppm (historical level) did not cause runaway global warming but 420 ppm will? I will wait.
“The Change in CO2 warm forcing effect at the 400+ ppm level is too small … “
CO2 is a weak greenhouse gas above 400ppm, but a strong greenhouse gas for the first 100ppm.
“Too small” is data-free personal speculation.
“something else cause all those large temperature swings for the 11,000 years while CO2 took a long vacation as per the chart.”
There was no manmade CO2 for almost the entire 11,000 year period. Is that what you mean by “taking a vacation”? So of course something else caused the estimated temperature variations — it definitely was not manmade CO2 BECAUSE THERE WASN’T ANY — Insignificant manmade CO2 emissions before 1900 and relatively small CO2 emissions before 1940.
I wrote that bothers you since you missed the key section:
“The Change in CO2 warm forcing effect at the 400+ ppm level is too small”
Since the human emissions are considered the cause of the rise of CO2 in the air starting at the 280 ppm level, I will safely ignore your first 100 ppm argument since no one here is disputing it and not material to the topic since it starts at the 280-ppm level and going upward since around the 1800’s time.
It is indeed a small a warm forcer at the 430-ppm level thus you are mistaken.
YOU just like Nick miss the point since there were near ZERO change of CO2 for the 11,000 years yet still have a lot of large temperature swings warm to cold and back anyway which clearly show that CO2 isn’t causing it as it is just sitting there at the 280 ppm all that time as Nick and myself showed.
I wrote and noticed I am talking about the 280-ppm static level NOT todays CO2 level for the 1,800- and 11,000-years’ time frames:
That is the deductive fallacy of ‘affirming a disjunct’, because the temperature of the planet has change due to a multitude of factors in the past excluding CO2, it does not necessarily follow that CO2 cannot be contributing to current warming.
That’s not science but simple logic.
I didn’t make the claim in that way Chris, I am stating that SOMETHING ELSE caused large temperature swings during the 11,000 years while CO2 was hovering around the 280 ppm level.
Factually true.
Now I never once stated that because CO2 didn’t contribute to the large temperature swings in those 11,000 years to saying because of that reasoning it doesn’t generate current warming.
I never did that.
Factually true.
However, I do state that at the 430-ppm level the postulated warm forcing of CO2 today has become too little to generate warming because the rate of energy leaving the planet is greater than CO2 current warm forcing capability.
Recall that I stated this:
Point taken.
Simple logic does not work on beliefs based on faith.
“That is the deductive fallacy of ‘affirming a disjunct’, because the temperature of the planet has change due to a multitude of factors in the past excluding CO2, it does not necessarily follow that CO2 cannot be contributing to current warming.
That’s not science but simple logic”
That is Argumentum ad Ignorantium, appeal to ignorance, you don’t know so it must be true.
“The Change in CO2 warm forcing effect at the 400+ ppm level is too small”
Too small for what?
The exact effect of CO2 emissions and feedbacks is unknown. You speculate the effect is “too small”, whatever that means. Since the correct answer is “No one knows”, your answer is merely a personal opinion, not a fact.
In the settled science field of climate change, how can the answer be “No one knows”?
“The Change in CO2 warm forcing effect at the 400+ ppm level is too small”
The climate change from more CO2 including positive feedbacks is unknown. Therefore, you are speculating. “Too small” to do what? You jump ro a conclusion when the correct answer is “no one knows”. Observations in the past 70 years suggest rising CO2 is not dangerous in any way. That does not mean rising CO2 does nothing.
At this point this is pure thread bombing.
Changes in ocean ecology would do it. Breaching a previously isolated oil reservoir would do it. Changes in the amount of dissolved silica would do it.
Using the PETM as a thought experiment is a worthwhile exercise.
JF
Nick you need arsenic to live, granted it a small amount. Yet without it you die.
Speculation:
Trace quantities of arsenic are an essential dietary element in rats, hamsters, goats, chickens, and presumably other species. A role in human metabolism is not known. However, arsenic poisoning occurs in multicellular life if quantities are larger than needed.
Enough with the arsenic analogy already.
Nick, when anthropogenic CO2 levels were, according to the IPCC, insufficient to cause a detectable warming pre-1975, there is a very onvious warming from 1910 to 1945. What caused that warming? Is that cause still operating?
JF
Indeed, and there was cooling from 1940 to 1980, just when CO2 levels were increasing. It’s almost as if CO2 had nothing to do with temperature…
“according to the IPCC”
Quote, please. But yes, CO2 was probably a lesser contributor then. As I’ve said many times (with arsenic etc), the fact that adding C to the air causes warming doesn’t mean that nothing else can.
“Is that cause still operating?”
Probably not. It seemed to peter out around 1945.
What was it that petered out? If you don’t know what it was you can’t claim it’s still not operating now.
This is really weak stuff, even for you Nick.
According to Nick, it just switched itself off and handed the warming over to us.
I’ve presented your exact point to many thermageddonists and they never have a valid answer.
NS –>
“other things can cause warming”
And can you show that those “other things” disappeared and are no longer affecting the “global climate”?
Isn’t the CAGW argument, using the arsenic analogy, that other things caused people to die (temperature to change) up to 1850, but any increase in deaths (increase/change in temperature) since 1850 is solely the cause of arsenic (CO2)? Does it not zero out all other causes and attribute any variance to a single cause?
The counter argument here is that, yes, there is some human caused inflow of carbon into cycle, but the cycle still continues with all natural processes and those processes do not care what the source is, they continue and incorporate any human caused input the same as they would a natural input. Every time a volcano erupts and adds a large step input to the atmosphere, does the global average move up by the step and stay higher? No, the cycle processes it through. Why would it treat car exhaust differently? How does it know to exclude it from the natural cycle?
“Does it not zero out all other causes and attribute any variance to a single cause?”
No, it doesn’t. Where did you get that from?
Eating arsenic doesn’t cure all your other health problems. You could still catch, say, a norovirus. But your hospital will focus on the arsenic, even though a virus might cause similar symptoms.
Likewise it has long been foretold that putting CO₂ in the air will cause warming. We did it, and got warming. At first you can’t be sure that it isn’t something else. But if it keeps on…
“The key difference between the Bern model and the physics model is the Bern model uses IPCC’s invalid assumption that human CO2 causes all the CO2 increase while the physics model uses IPCC’s e-time of 3.5 years.”
This statement says that all CO2 increase in the atmosphere is due to human activity. That, coupled with the position that CO2 drives the temperature results in the logical conclusion that it is the position of the IPCC and CAGW crowd that all other potential causes of climate change result in a net zero at most, but potentially negative, temperature impact.
I ask again – how does the carbon cycle know to treat human emissions different from natural emissions?
Additionally, someone suggesting long ago that CO2 might drive up the temperature, doesn’t make them correct just because it got warmer. It got warmer and cooler before the CO2 increased. It has varied since it increased. If CO2 was the driver, how has it not been a steady increase? If there are factors that can match CO2, shouldn’t we understand those just as much?
no Nick, the problem is that the IPCC simultaneously argues temperature for 11,000 years varied widely despite flat CO2, and that the small .14 degree/decade satellite-era trend is driven entirely by CO2
it’s like arguing that no one was ever killed by arsenic before, but we’re sure you’re dying of arsenic poisoning anyway even though it looks more like a mild flu
“CO2 for 11,000 didn’t do diddly squat in generating LARGE warming and cooling”
I assume you meant for the last 11,000 years?
There were no manmade CO2 emissions until the late 1800s, so before then, manmade CO2 emissions and AGW are moot points.
Manmade CO2 is one of many climate change variables. Its exact effect can not be known because that would require knowing the exact effect of every other variable.
It is safe to assume the effect of CO2 emissions has been mild and harmless so far, even if you assume all warming since 1975 was caused by CO2 increases, as a worst case estimate.
My own personal list of climate change variables: (I’m sure other lists will vary)
The following variables are likely to influence Earth’s climate:
1) Earth’s orbital and
orientation variations
2) Changes in ocean circulation
Including ENSO and others
3) Solar activity and irradiance,
including clouds, volcanic and manmade aerosols, plus possible effects of cosmic rays and extraterrestrial dust
4) Greenhouse gas emissions
5) Land use changes
(cities growing, logging, crop irrigation, etc.)
6) Unknown causes of variations of a
complex, non-linear system
7) Unpredictable natural and
manmade catastrophes
8) Climate measurement errors
(unintentional or deliberate)
9) Interactions and feedbacks,
involving two or more variables.
Yawn you are so far off in understanding what I have been talking about.
Then you are not communicating clearly
And that is YOUR fault.
CO2 stays at 280ppm for 11,000 years, yet the temperatures climb and fall during that time period, so CO2 has little effect on the temperature swings during that time period.
Natural CO2 and human-derived CO2 behave the same way in the Earth’s atmosphere.
I thought it was explained very well.
to be fair, with CO2 levels remaining at 280ppm for 11,000 years, then any contribution to temperature swings would have been constant, meaning that temperature swings over that time must have been caused by something else. It doesn’t mean that CO2 doesn’t cause a temp change, it just means that whatever effect CO2 has, it was constant. That being said, the BIG question is, what caused the temp changes, if it wasn’t from CO2.
There are known unknowns and unknown unknowns yet the CAGW “theory” assumes a single partially known is causal in tiny observed temperature changes, despite overwhelming evidence of the previous (and likely current) existence and effects of the known and unknown unknown factors.
It’s all bollocks before we even get into the actual data issues
Can it really be that simple? Yes, it really is.
“There were no manmade CO2 emissions until the late 1800s, so before then, manmade CO2 emissions and AGW are moot points.”
Wow! Your arrow just flew completely over the target, missing everything.
SunsettTommy, CO2 changes are not alone in causing temperature changes. The most obvious example of non-co2 driven climate forcing (to use a sufficiently scary way of putting it) is the Sea of Marmara which is warming much faster than the models can explain. The Black Sea, Baltic, Lake Tanganyika etc etc also warm in a way that this simple model’s assumption that we have not changed the gas flows through the marine/atmospheric boundary layer fails to address.
The 1910-1945 warming cannot be explained by CO2. I suggest this was a result of pollution. WWII and the Battle of the Atlantic even suggest an answer to Professor Tom Wigley’s question ‘why the blip?’
Balance models provide part of the answer, but are insufficient.
JF
“You missed the glaring point here since if CO2 for 11,000 didn’t do diddly squat in generating LARGE warming and cooling swings that lasted for hundreds of years at a time.”
The only point is your head.
What happened in the past 11,000 years before the 1900s is irrelevant for determining the effects of manmade CO2 emissions after 1900. You are comparing 100% natural causes of climate change with a relatively new manmade cause of climate change. Your lack of logic is that CO2 emissions did not drive large climate change in the past 11000 years, so manmade CO2 emissions can not drive large climate changes now. You do not define “large” and diddly squat is not a scientific term. Your logic fails.
Warming seems flat despite CO2 growth. Or would it jusy be colder otherwise?
Struggling to follow or replicate this chart. What is it showing? Certainly isn’t the monthly temperature anomalies for the respective periods.
Fake plot. Here is HAD4 for that period, via WFT. It has an uptrend of 1.45°C/Century from 2001-2022
Lovely, now let’s compare that to a 1920-1941 (just before our emissions were supposed to make any difference to global temps)
Hmmm… can you spot much of a difference?
Andrew, I don’t see where Nick has replied to your posting. Me thinks he can’t.
Yes, I can’t see his reply either.
The mods must have deleted it 😉
“if CO2 for 11,000 didn’t do diddly squat in generating LARGE warming and cooling swings that lasted for hundreds of years at a time.”
There were no large warming and cooling swings in the past 11,000 years. You are delusional. The Holocene Climate Optimum from 5000 to 9000 years ago, for example, may have a been a degree or two C. warmer than the past decade. Or similar — local climate proxies are never precise. Large warming and cooling swings in the past 11,000 years exist only in your imagination,
Unless you consider a degree C, or two to be “large”.
‘Ceteris paribus’ all else unchanged.
FIFY.
CO2 does not cause “warming” directly.
It inhibits Earth’s ability to cool itself by an unknown amount that so far appears to be small and harmless.
“The AGW proposition is that adding a whole lot of new carbon to the air will cause warming”
Relegated to a “proposition” now, is it. ! 🙂
Certainly not backed by any actual real science.
What he and other AGW supporters does is IGNORE the rate of energy leaving the planet is greater than the postulated warm forcing effect of CO2 thus can’t drive any warming trend.
CO2 and other greenhouse gases form a partial barrier between Earth’s surface and the infinite heat sink of space Basic climate science.
Never disputed CO2 slowing some of the OLWR but you didn’t address the part about total energy is leaving the planet at a greater RATE than CO2 is stopping/slowing down or generating warm forcing.
This means that some other causes of warming is operational.
There are lots of causes of climate change
Manmade CO2 emissions is one of many.
More CO2 has the ability to inhibit Earth cooling itself by some unknown amount. Your claim that the amount is zero is your personal speculation, not science.
Slowing down cooling *raises* the temperature of the earth AT NIGHT, not during the day. Meaning we should be seeing more radiation from the earth (S-B you know) toward space and we should be seeing minimum temps going up far more than max temps – which would also raise the GAT.
What is the catastrophic event we will see from minimum temps going up but not max temps?
Ummmm……
Doesn’t more CO2 in the atmosphere also mean more CO2 and water vapor shedding more energy to space?
Somehow it seems to the CAGW crowd that the energy lost to space never changes because of an increase in GHG’s – meaning all that extra CO2 *must* be radiating solely back toward earth!
I don’t think Planck would agree with that assumption!
Baloney
I prefer “conjecture”.
A “proposition” usually has some believable substance to it.
Even Bernie Madoff knew this.
Backed by a lot of science.
Mainly in laboratories, but also in the atmosphere.
So what you are saying is that nature produced all the previous temperature swings, then in 1950 it switched itself off and handed it all over to our CO2 production?
Don’t you realise how stupid this is?
Nothing was switched off. Our CO2 production was added, and came to dominate.
Hmmm…
I went and had a little gander at the HADCRUT trend lines for 1924-1945 ( just before our CO2 emissions were supposed to be having any effect) and 2000-2021 (when our CO2 emissions are supposed to be sending us to hell in a handcart) I’m struggling to see much of a difference. So, if our emissions are currently dominating, how come the trend hasn’t increased? What turned itself off in 1945?
NB Please excuse my efforts to visually match-up the graph scales – I’ve done my best!
DR. Jones made a similar observation 12 years ago,
BBC
A – Do you agree that according to the global temperature record used by the IPCC, the rates of global warming from 1860-1880, 1910-1940 and 1975-1998 were identical?
An initial point to make is that in the responses to these questions I’ve assumed that when you talk about the global temperature record, you mean the record that combines the estimates from land regions with those from the marine regions of the world. CRU produces the land component, with the Met Office Hadley Centre producing the marine component.
Temperature data for the period 1860-1880 are more uncertain, because of sparser coverage, than for later periods in the 20th Century. The 1860-1880 period is also only 21 years in length. As for the two periods 1910-40 and 1975-1998 the warming rates are not statistically significantly different (see numbers below).
I have also included the trend over the period 1975 to 2009, which has a very similar trend to the period 1975-1998.
So, in answer to the question, the warming rates for all 4 periods are similar and not statistically significantly different from each other.
Here are the trends and significances for each period:
Q&A: Professor Phil Jones
And yet it doesn’t dominate.
😂 🤣 😂 🤣 😂 🤣
Nick’s strawman ==> “It doesn’t say that all past warming was caused by adding new carbon to the air. Which it obviously wasn’t; until we started digging, there was no new source at all. Now there is.“
I like the Vostok graph.
They clearly show that every time CO2 was at a peak, global COOLING followed. !
Atmospheric (and ocean) CO2 level changes, although not very large in the ice core proxies, were a result of relatively large changes to ocean temperatures from 100% natural causes.
You are an “editor” here?
You are conflating natural causes of climate change
with manmade causes of climate change.
They can happen at the same time but are different
AGW has nothing to do with natural causes of climate change. That’s why they are called AGW.
You weren’t joking, were you?
Apparently basic knowledge of climate science is not required to be an “Editor” here.
You sure missed a lot of postings starting with post ONE where Nick shows an 1,800 yearlong flat CO2 level at the 280 ppm level which I then responded in the very next post by showing a 11,000 yearlong CO2 flat level while temperature swings were large and regular showing that CO2 couldn’t have caused any of it because it stayed around the 260-280 pmm level for 11,000 years.
I never once claimed that AGW controls or cause NATURAL climate to change I keep pointing out this in several subsequent posts such as this one:
You need to catch up.
I have caught up long ago
You need to learn BASIC CLIMATE SCIENCE.
And logic.
You keep bloviating about the past 11000 years where causes of climate change were 100% natural for close to
99% of the period. Then you claim those years prove something about manmade CO2 in the past 100+ years. That is ridiculous.
You claim manmade CO2 is not the main driver of climate changes. That is your speculation. We only know that manmade CO2 caused from 0% to 100% of the global warming since 1975.
We do not know if CO2 CAUSED OVER 50% OF THE WARMING SINCE 1975, OR NOT. NO ONE KNOWS THE CORRECT PERCENTAGE. Which means that YOU don’t know. But you pretend to know.
Bwahahahahahahaha!!!
Never have I made that claim now you are simply LYING since all I was pointing out during those 11,000 years while CO2 rested around the 280 ppm level there were repeated large temperature swings, it is a fact you can’t dispute, which means CO is doing little in all that time.
You write:
Between 0% to 100%?
Was that speculation or a wild guess…..
Haw haw haw haw haw haw…. you don’t have the answer either.
You write:
Then you don’t really know how much is natural or anthropogenic I never claimed to know how much either I repeatedly stated CO2 is NOT a climate driver which no one here has been able to address at all.
How come no one here has yet to address what I said early on that CO2 at the 430 ppm level doesn’t generate enough warm forcing rate to counter the greater rate of energy leaving the planet?
Over one dozen comments and you are still explaining yourself. Learn to communicate clearly in plain English.
Pure projection.
“I know nothing” – Sgt. Shultz
“CO2 doesn’t drive large temperature swings up and down during the last 11,000 years at all.”
There were no large temperature swings up and down during the past 11,000 years and the changes of CO2 were small. If there were no large temperature swings in those 11,000 years, then we have no information available in those years on CO2 and large temperature swings. You fascination with the past 11,000 years makes absolutely no sense.
I posted the link at post TWO that you clearly never read where it shows those large temperature swings in the 11,000 years 100% supported by fully available data.
Nick, as we all know, we can find correlations in just about any developments when we have a dog in the fight.
Not being an academic numbers man as you are, I’m nonplussed however about the proposition that when Nature twigged to the manmade creation of steam to power industry, Nature up and said to They-self :
“Well, if they’re going to start competing with me for CO2 production, that’s it – I’m done.
Bugger you all, mankind, make your own CO2 from now on.
And don’t go mixing up any of your shit with mine.”
So, the opposite of a good assumption.
The residence times are exactly the same for natural and human emitted CO2, but residence time (about 4 years) and e-time (about 50 years) are different things, which are conflated by Dr. Berry (and even the IPCC…).
The residence time is how much CO2 is exchanged over a year between the different reservoirs (air, oceans, vegetation), that doesn’t change the total amount of CO2 in the atmosphere at all.
The e=fold time is how long it takes to remove an extra amount of CO2 when added above the equilibrium (about 295 ppmv for the current ocean surface temperature)…
Isn’t there a statement somewhere that refers to correlation and causality?
I’ll forgo the obvious temptation to refer to the correlation between the number of kitchen aprons bought and the erosion of the space time continuum.
I’ll also refrain from referring to the life expectancy increase/child mortality decline/poverty decline/increased food etc. since 1750 or so which saw the beginning of the Industrial Revolution.
I’ll even not expand on humanity surviving a hitherto unrecognised global pandemic with the extraordinary survival rate of some 99.8% which wouldn’t have happened without modern, fossil fuel derived drugs and technology.
I can’t expand on the greening of the planet, because it is happening, nor that the IPCC don’t consider ‘extreme weather’ a threat, as it just ain’t happening.
I could go on but it’s seriously depressing discussing anything with someone obsessed with science.
Go into your garden Nick, or go to the beach, and tell me what’s changed from 50 years ago, other than plants are flourishing with the small CO2 increase we have had.
Science is about observation. That means looking at the world around you, not graphs and numbers, they are not science because science is not in the predictions game. No theory, no matter how good, can be demonstrated as sound until the event has passed.
Was it Feynman who said “An hypothesis is a guess, a theory is an educated guess”? (paraphrasing).
Smell the flowers Nick. You’ll learn far more than from fiddling with predictive numbers in an Excel spreadsheet, it’s not real life.
And then there’s this. the relationship between atmospheric CO2 and temperatures, as an illustrative overlay.
Amazing how you can change the look of a chart just by messing around with the y-axis max and min values, isn’t it?
According to Excel, the correlation coefficient for annual UAH LT and ML CO2 is +0.77, which for a sample size of 43 is very strong.
LOL, yes truly amazing, as you have ably illustrated.
“According to Excel” 🤣 🤣 🤣
Who is this bloke “Excel” anyway? Attributions, papers, studies? Please enlighten us.
F’kn Richard head. Buzz off back to skeptikalscience and wallow in your ignorance.
I would say Excel, or similar, was the medium used to make the chart you initially posted. Maybe you just drew it by hand, based on your ‘observations of the world around you’?
Judging by science today, my hand drawing is sufficient.
On what basis?
Riiiighhhhtttt You caught a graph representing UHI influenced surface temperatures, which don’t represent most of the world, nor the oceans.
In other words, what you have shown in your natty little graph is grossly inaccurate BS.
It’s a simple representation of global annual UAH_TLT and ML_CO2 over their common period of observation.
Same as what you posted, only without manipulating the y-axes to minimise the obvious correlation between the two (oh, and using data that isn’t 3-years out of date).
Three years out of date. LOL
Like anything has changed in those three years.
Utterly pathetic, don’t waste my time.
That’s a dishonest chart
It makes 1 degree C. appear to be a huge change when in fact, humans would have trouble noticing +1 degree c.
There are honest charts at the following link.
I call my climate science and energy blog “The Honest Global w Warming Chart Blog”. I celebrated 333,000 page views today:
Honest global warming chart Blog: This blog home page temperature chart is not visible on the smart phone version of this blog + two more honest charts (elonionbloggle.blogspot.com)
“It makes 1 degree C. appear to be a huge change when in fact, humans would have trouble noticing +1 degree c”
They won’t notice it where UAH measures, unless they sit on the wings of a plane.
But they won’t notice a 100 ppm rise in CO2 either. So how do you think the scales should relate?
Are you really saying that all these graphs and other such constructs are really irrelevant junk, Nick?
I concur doctor (as the medicos would say).
I did not expect you to like my charts and that confirms they are useful.
UAH measures in a consistent environment where the greenhouse effect occurs.
Very little infilling is required.
The scientists involved are not financed by the government and appear to be unbiased,
They have never made a huge arbitrary revision such as deleting almost all the global cooling in the 1940 to 1975 period as originally t reported in 1975.
They do not present haphazard pre-1900 measurements as global when in fact they are very rough measurements almost entirely of the Northern Hemisphere.
They do not present bucket and thermometer sea temperature measurements, primarily in Northern Hemisphere sea lanes, as accurate global average sea surface temperatures.
The trend revision between version UAH_TLT5.6 to version 6.0 resulted in a far bigger trend change than any that came from the various surface data version updates.
RSS isn’t funded by the government either and gets starkly different (warmer) results from the same satellite data used by UAH.
UAH still shows statistically significant warming over the course of its data.
They have on several occasions had to make corrections to the errors that they have made.
*Everyone* is noticing the CO2 impacts! It has caused significant greening of the earth. Lot’s of papers on that impact. More and more papers are noticing the almost constant record growth in levels of grain harvests every year. More and more papers from agricultural scientists are noticing the increased growing season length due to higher minimum temperatures.
Freeman Dyson stated the climate models were useless because they were not holistic and didn’t account for the minuses *and* pluses from CO2 growth. Fewer and fewer people are dying from cold and starvation every year – at least partially due to minimum temps going up.
How do the climate models account for this?
As Nick points out above, it is necessary to use a secondary axis when comparing data series with such widely fluctuating values. It is also legitimate, so long as the secondary axis is shown. Hot Scot did this also in his initial post (though he used out of date data and increased the max/min values on the UAH series to flatten it out as far as possible). Unfortunately this somehow escaped your skeptical eye.
Specious correlation.
Might as well be correlations to toilet flushes, or bumble bee flights, sales of brooms, whatever.
Correlation without causation is a fantasy graph.
What effect does the ending Super El Niño have on the correlation of LT temperatures with CO2 concentrations?
My favourite.
👍
And where is the analysis that the CO2 is LOCKED in the ICE and not escaping. To believe this is show that you are not using your brain. It is a known fact that Freon leaks out of hermetically sealed refrigeration systems that have all joints brazed or welded. Same is true for many other gases. Look at the molecular structure of CLEAR Ice and compared it to that of ice collected from these “Ice Cores” They are almost gray, numerous impurities, periods of freezing and thawing as this old ice formed. The Ice in these cores have been subjected to flowing and compression from the kilometers of ice on top of it. This pressure of compressing and flowing is also going to change the structure.
I have tested 1/4 inch thick stainless steel cylinders at ten times the design storage pressure with air to confirm they hold test pressure for 24 hours. Yet this same cylinder will show a loss of pressure at the design pressure after just a few months. I have no doubt that after a few hundred or thousand years these cylinders would probably be near empty. Definitely after a few hundred thousand years.
If CO₂ is escaping, then how would it happen that over huge lengths of core, and over many cores drilled in many places, the CO₂ in bubbles just happened to be 280 ppm.
MISINFORMATION
Citations for graphs showing that.
Many graphs show values ranging from 0 to over 1000. WHY?
Citations?
Richard,
Nick is right in this: you can’t measure 280 ppmv after one or more years of relaxation of the ice in pits after drilling when the surroundings are above 350 ppmv, if there was any connection with the atmosphere at all.
Melt layers are quite seldom: in coastal ice (average -23 C) one such layer in 70 years (Siple Dome), none in Law Dome (-22 C) and none in Vostok or Dome C (-40 C).
As there is no pressure difference between the air bubbles in the ice (about 10% of total volume) after relaxation, there is no driving force to push air with CO2 out of the ice, or reverse…
@ur momisuglyFerdinand Engelbeen
Please Explain to me how snowflakes along with the surrounding air can be compressed into rock hard ice with a pressure of the weight of several kilometers/miles of ice and snow on top of it would remain at “Atmospheric Pressure”?
The pressure would be ~30,000 Psi for just 2 Kilometers/1 mile would also be at ~30,000 PSI and the pressure of the air inside it not increase to at lease 30,000 PSI? Then when the ice core is removed, refrigerated and stored as a 6 or 8 inch diameter ice cylinder that the air would not leak out. The advanced, Graduate Level, physics and engineering courses I took to get a degree in Nuclear Engineering tell me that it is just not possible. Keep in mind every one of those little bubbles giving the ice a milky color will be at 30,000 +++ PSI. Keep in mind that Ice in a glacier. like glass, actually a liquid. That is how it flows down the valleys.
Richard, below a certain depth, there are not even air bubbles left: all CO2, N2, O2 are pressed into clathrates…
Then, I said “after relaxation”. When the ice cores are drilled, they are put in a pit for at least a year at below -20 C. During that year the ice expands and the total volume may double. From that moment on, inside and outside air pressure should not differ that much.
Even if part of the air would leak out, that doesn’t explain that CO2 would get out preferentially, to lower the CO2/air ratio below what is in the atmosphere. To the contrary: the affinity of CO2 to the ice surface is a lot higher than for N2 or O2. When measuring CO2 under vacuum, one would see much higher CO2 levels, not lower if that was a real problem.
Moreover, CO2 levels of ice cores with enormous differences in accumulation (thus differences in depth/pressure for the same average gas age) show the same CO2 levels within +/- 5 ppmv.
Further, ice cores are repeatedly reused when new techniques are available or other gases/isotopes need to be measured. Sometimes with many years in between. They show the same CO2 levels as in the first runs…
Moreover, CO2 levels of ice cores with enormous differences in accumulation (thus differences in depth/pressure for the same average gas age) show the same CO2 levels within +/- 5 ppmv.
Ferdinand,
The CO2 measurements between Antarctic ice cores with different accumulation rates can be up to 20 ppm. Low accumulation sites in reds, orange, and high accumulation sites in blues, greens shown in the attached plot.
Okay, 20 ppmv then…
It seems that especially Siple Dome has a lot of outliers, it is also the one with some reported melt layers (1 in 70 years) and drilling fluid problems (both reported by Neftel).
Anyway, far less variability than the recent 120 ppmv increase accompanied with a enormous drop in δ13C of nowadays 1.8 per mil, compared to a few tenths of a per mil over the past 800,000 years even during glacial-interglacial transitions…
The 120 ppm increase is not comparable to ice core CO2 values unless you apply Fick’s law of diffusion as you well know. Diffusion will also alter the associated δ13C value. The highest CO2 value that I can find documented in ice cores not within the firn diffusion zone is 330 ppm in Law Dome. That suggest only an increase of 50 ppm documented in ice cores above a 280 ppm baseline.
Renee,
The youngest ice of Law Dome was from around 1980, thus indeed not 120 ppmv, but there is a 20 year overlap between the ice core measurements and the direct measurements at the South Pole, which is within the accuracy of both measurements…
In your cylinders the pressure is much higher than outside so the gas would tend to flow to the outside. In the case of air frozen in ice any air remaining will have the same composition as it had when trapped, if it escaped there would be no air to analyze! Because of the pressure differential air would not diffuse into the ice.
Phill
“any air remaining will have the same composition as it had when trapped, “
That assumes that Oxygen just sits there, dormant, for tens of thousands of years, and does not oxidize anything around it, including all of the common contaminants in the air and thus in the snowfall that will be trapped in those bubbles. Oxygen + moisture + a long list of other chemicals = oxides of those chemicals. Many of those chemicals are reactive with O2, Dust from the Sahara Desert provides most of the iron found in the Atlantic Ocean, How many other chemicals are in those bubbles, or in the water vapor that made the snow flakes? Many other chemicals in the air.
More than fifty years ago I got tired of cleaning the silver set my mother gave me [fifty years ago] and placed them in vacuum seal bags. They no longer turn black, but they still need shined. Even the ones in bags I have never opened.
There is also the problem of ignoring the effects of bacteria. Assuming there is none is a mistake.
“Bacteria, like animals, grows and evolves, and it can actually evolve much, much faster. It’s possible for bacteria to evolve to a completely new type of itself within a matter of days. So, scientists probably had a field day when they discovered bacteria specimens in some of the oldest ice that’s known to exist on Earth. They dated the samples all the way back to 8 million years ago. That’s way older than anything else we’ve come across so far!”
Richard,
Dust is a problem in Greenland ice cores, because you have both sea salts (carbonates) and frequent highly acid dusts from nearby Icelandic volcanoes. That can give in-situ CO2 production, even during measurements with the old wet methods.
Antarctic ice has far less dust problems and mostly within the coldest part of glacial periods, when there is hardly any rain or other precipitation to rain out the dust.
The composition of the dust was traced back to places in the south of South America.
That doesn’t hinder the CO2 levels there so much, because the dust is not strongly acidic.
I haven’t seen any findings of the effect from/to O2 for other dust constituents, but as most are already oxidized, I don’t expect much effect.
The effect of bacteria was investigated in different ice cores and highly depends of temperature.
At -40°C (Vostok, Dome C), the only bacteria that survive restrict themselves to DNA damage repair. For the carbon source, they use CO2, with a special cycle and that is used in a fixed ratio to the production of N2O, which provides the necessary energy out of the oxidation of NH3. Even if all N2O was from that mechanism, then not more than 1 ppmv CO2 was used as worst case.
Even so, when reaching the bottom at Lake Vostok (0°C), these bacteria can get alive and multiplicate again.
Very interesting stuff how life can survive even the most harsh environment…
See: https://www.pnas.org/doi/pdf/10.1073/pnas.0400522101
Chapter K for Vostok.
Thanks for the information explaining that an accurate analysis of the factors with a potential to contaminate the measurements are being considered.
My 50 + years in engineering has shown me that many “Scientists”, “Engineers” have not been well trained in the sciences outside of their field of expertise, my self included. We have “Climate Scientists” that calculate the annual predicted “Global” temperature for the next 100 years that can not predict where the jet streams are, are going to be for one week or their effect on the daily global temperature and don’t even incorporate the massive effect that these jet streams have on their mythical prognostications.
And the Global temperature still has not varied as much as the temperature in my house [with heating and AC in operation] over the last 50 years. 70 to 74 while set at 72! Last twenty five years with Heat-pump rated insulation and windows.
Bravo!
assumption ? Is that like a guess ?
👍
Yes, an assumption is just like a guess.
That’s what alarmist climate science is made of: a lot of guesses and nothing more.
Assumptions are guesses!
Explicitly, they are SWAG, scientific wild-ass guess! All the validity of crystal ball gazing or rectal plumbing for answers.
The person who made that graph should be in prison for crimes against the scientific method.
It is not ok to mix low resolution data like ice core data with high resolution data like the Mauna loa data.
The data points from the ice core data are 100 years apart.
The mauna loa data points are 1 month apart.
Anybody who uses this graph is either thring to decieve, or is ignorant.
oops.
trying
“The data points from the ice core data are 100 years apart.”
No, they aren’t. This is Law Dome data, going back just 1000 years. Resolution is about 20 years.
But the main thing is that in the ice core section, there is very little variation.
John, the resolution of two ice cores at Law Dome is even only 8 years and have an overlap (1960-1980) with direct measurements in the atmosphere at the South Pole.
Anyway, all ice cores show similar values over the past 10,000 years, no matter their resolution and the highest resolution ones show an enormous growth after 1850:
Ferdinand,
One should take into account whether CO2 measurements are from the modern atmosphere, Firn diffusion zone, or sealed in ice below the bubble zone. Any data above the bubble zone is in contact or diffused with present day CO2. The bubble zone represents the first impermeable barrier from the current atmosphere.
“As of 2020, natural CO2 has added about 100 ppm, and human CO2 only 33 ppm, to IPCC’s CO2 level of 280 ppm in 1750.”
If correct, then the doubling of the human CO2 emissions of the 33ppm into the long future makes it irrelevant for the warming rate thus their entire AGW modeled edifice crashes into a smoldering ruin.
True inference, but I don’t think the statement is factually correct. Proof below.
I was making a simple observation of his claim, but I have a problem with CO2 levels being essentially flat for thousands of years during the Holocene which at this point in time badly hurts the AGW narrative where increasing CO2 is suddenly a warm forcing driver today but was a ZERO forcing driver for 11.000 years it is a problem no one seems to bother about it doesn’t make any sense at all was CO2 taking a long vacation for thousands of years?
If Earth can have large temperature swings for hundreds of years at a time with near ZERO CO2 change in the atmosphere in all that time, then that same force of change MUST still be here today, yet AGW supporters are IGNORING it which means their approach to this problem is already wrong as they focus on CO2 as their superman molecule doing all the heating which is utterly impossible as the RATE of energy leaving the planet is far greater than the postulated warm forcing of CO2 produces.
Mr. Berry’s claim may indeed be silly but so is the AGW conjecture since CO2 as a molecule has way too small a warm forcing effect to materially affect the heat budget enough to drive climate change and overcome the clearly powerful ability of the forces of NATURE which was able to generate all those large temperature swings of the last 11,000 years without CO’s help.
Where is the freaking “hot spot”?
Sunsettommy:
“then that same source of change MUST still be here today”
YES, and it is simply the amount of reflective SO2 aerosols circulating in our atmosphere of volcanic origin, up until the start of the industrial revolution, when industrial SO2 aerosols,from the burning of fossil fuels also entered our atmosphere, with the same effect, eventually rising to 136 Megatons in 1979.
The less SO2 there is in our atmosphere, the warmer it will get. It began warming in the 1980’s because of “Clean Air” efforts that reduced industrial SO2 aerosol emissions, and current net-zero efforts will drive temperatures even higher!
The included image shows present global SO2 aerosol levels. During the MWP, the image would have been entirely white, except during the few years of a rare volcanic eruption.
“the composition of today’s atmospheric CO2 is about 5% human and 95% natural.”
Those are the words of an imbecile
This is an article by a crackpot
Why would it be on the WUWT website?
Was Charles Rotten bribed?
Is he drunk?
This is alt-science conspiracy theory tin hat non-science
Makes NickTheStroker look like a genius
And that’s not good.
The atmospheric CO2 level is up about +50% since 1850.
The increase was entirely manmade
Manmade CO2 emissions were far more than necessary to increase atmospheric CO2 +50%, from an estimated 280ppm in the 1800s to about 420ppm now. Nature is a net absorber of some of the manmade CO2 emissions. That means nature does not add CO2 to the atmosphere.
I have read that Berry was a real scientist at one point in his life.
HE MUST HAVE HAD A BAD ACID TRIP OR A HEAD INJURY.
HE IS NOW A SCIENCE FRAUD.
You sure are angry maybe you have a reason but so far you haven’t shown that he is wrong at all while Nick at least makes an argument that he is wrong.
A lot of personal attacks of this level hurts you who could do better than this because you first have to SHOW why you believe he is an “__________” and “_________” and so on.
If he is very wrong, it should be easy for you to make a case against it.
The very few people who REJECT all conventional climate science have to prove THEY are right. That is how science works. I do not have to prove a negative.
The alt-science folks like Berry are up against at least 99.5% of all scientists in the world. Possibly 99.9%. And that includes our best “climate skeptic” scientists. I’ve only read one scientist who makes claims like Berry does in 25 years of climate science reading — and that is Berry himself.
You are right that I am angry.
We climate realists are losing the CAGW propaganda war
Now the Climate Howlers are after our electric grids.
And they want to force electric cars on us
Science frauds like Berry do get some fans, and those fans become counterproductive in the effort to refute CAGW scaremongering. They make climate realists into laughingstocks, by rejecting 100% of basic climate science. Not 90%. Not 95%. But 100%.
I agree that Barry isn’t helping with his unproductive claims since it doesn’t matter what produced it is how much of the CO2 warm forcing increase there is and it is small which is good because that in itself isn’t a concern, it is the loopy positive feedback loop proposal that is supposed to drive the CAWG stupidity never mind that it doesn’t exist outside of 30 years old climate models is what warmist/alarmist scientists and the IPCC is pushing.
The Satellite data and Radio sone data isn’t showing it developing and neither is the hot spot showing up this after 30 years of looking.
Wow!
I don’t think even gravity has 99.9% of ALL scientists in the world claiming to know exactly how it works.
But you must obviously be a “settled science” acolyte.
Settled science is not something I favor
Science is never settled
That does not mean climate scientists are 100% wrong !
LOL…..But your crackpot theories are just fine Richard. And let’s face it mate, most climate theories are crackpot, on both sides.
Whilst I enjoy many of your post’s both here and on Manhattan Contrarian, you are at least as bad as the climate alarmists when it comes to atmospheric CO2 content. They simply will not deviate from their position no matter what any scientific evidence tells them, and nor will you.
And you imagine that making up ‘clever’, ‘novel’ insulting names for anyone who dares disagree with you bolsters your scientific credibility. That’s incredibly juvenile.
Children get frustrated and scream and shout, adults work their way through a problem with humility.
Take a look around mate. You are not ‘right’, none of us are ‘right’ , we are all just guessing and science is now a weapon.
That will be the death of science. You are not helping.
Well said HotScot. HotScot? Isn’t that a contradiction of terms? Just kidding, I’m told I’m descended from Scottish kings. Not a boast! Hahaha!
Try wearing The Kilt. You’ll know then what HotScot means.
Nor is my title self chosen. More than one or two ladies coined the term. Many years ago though.
I’m a reformed man. 😉
How many birds can fit under a kilt? Depends on the length of the perch.
Woman: “What’s worn under the kilt?”
Hotscot: “Nothing, madam, it’s all in first-class working order, put your hand up and see for yourself.”
Woman: “Eww, it’s gruesome!”
Hotscot: “{ut your hand up again, it’ll grue some more”
😉
Descended from Scottish kings ? Only if you have a chip on both shoulders 🙂
We are all descended from Scottish and English kings and peasants, it’s simple maths
Thanks for the character attack on me to complain about my character attacks on Berry.
Here are my high level beliefs on climate science, based on 25 years of reading, so no one can make false claims of what I believe in:
I favor more CO2 in the atmosphere to green the planet, providing more food for humans and animals.
If added CO2 causes global warming, it will be less warming than the previous addition of CO2 — the next +100ppm will have less of an effect than the prior +100ppm of CO2. And the prior +100ppm of CO2 was already harmless.
The global warming since the 1970s was mainly in colder climates of the Northern Hemisphere, mainly in the coldest six months of the year, and mainly at night (TMIN). That was good news. Unless you object to warmer winter nights in Siberia
Here in SE Michigan, we love global warming since the 1970s and want a lot more. I assume my plants would prefer a lot more CO2 also.
If there is anything specific I wrote (above) that you object to, please be precise in stating what it was.
Ed Berry’s claims are wrong, but, Richard, your manners are worse. There’s no call for that. I’d much rather have lunch with a completely confused gentleman than with someone who behaves like a jerk to that same gentleman, regardless of who’s the smarter of the two.
Eb Berry deserves ridicule because he has some die-hard believers who need to be shocked out of their alt-science hypnosis. It is not productive to be polite to a science fraud. I treat rapid Climate Howlers the same way. As they call me (us) “science deniers”. Because that strategy works. You ridicule people who makes ridiculous claims because they deserve ridicule. They are usually (obviously) leftists. Berry may be a rare exception
Richard, even if I concede that some people deserve ridicule, that doesn’t mean we should engage in it. To have the right to do something does not mean that it is right to do it.
I recommend tempering justice with mercy. I, for one, am grateful that I do not always get what I deserve. If everyone always got what they deserve, this world would be an even harsher place than it is now.
Dear Richard,
You disagree with the conclusion of my argument without finding any error in my argument. That is not logical.
My whole argument is as follows:
“IPCC’s data show the inflow of human CO2 into the atmosphere is about 5% of the total CO2 inflow and natural CO2 is about 95%.
“Since human and natural CO2 molecules are identical, their e-times are identical.
“Therefore, to the first approximation, the composition of today’s atmospheric CO2 is about 5% human and 95% natural.”
Is there something about my two preceding sentences that require this conclusion that you do not understand?
Ed
IPCC claims about 33% of total CO2 got into the atmosphere by manmade fossil fuel emissions. Those emissions account for more than +140ppm — nature has absorbes some of the extra manmade CO2. Where did those manmade CO2 emissions go,if not into the atmosphere? TO THE MOON?
The IPCC is correct about that subject. You are wrong at 5% — not even close to reality in the neighborhood of 33%. And you are even misinterpreting the IPCC claims. They are talking about total CO2 content in the atmosphere and how it increased from about 280ppm to about 420 ppm. If you can’t get that basic climate science right, then you can not be taken seriously on any subject related to climate science. It’s you against the world. The world is winning.
Deart Ed,
We have been there before, already a few years ago…
The essential error you made is that you forgot that a mass balance has two sides: income and expenses. You did the math of the income, but forgot the expenses…
Indeed humans add only 5% of the income, but have zero contribution to the outlets (as mass, not as % of the original molecules).
In 5%, increase in the atmosphere 2.5%, that means that the natural flows have a negative balance of 2.5% more out than in.
That also means that humans are responsible for (near) 100% of the increase in mass, even if most of the original human CO2 molecules now reside in oceans and vegetation…
Fantasy estimates, as usual.
ATheoK
Fantasy?
For the past years (even including the Covid drop):
Human emissions: 4.5 ppmv/year, based on sales (taxes!) and burning efficiency.
Increase in the atmosphere: 2.25 ppmv/year, based on accurate measurements at Mauna Loa and many other stations.
Both have error bands which are much smaller than the measurements.
So what do we know and what not?
For the mass balance:
atmospheric increase = human emissions + natural ins – natural outs
2.25 ppmv/year = 4.5 ppmv/year + X – Y
X = Y – 2.25
No matter what X and Y are.
If X = 10 ppmv/year, Y = 12.25 ppmv/year
Human emissions then are 30% of the inputs.
Residence time = 29 years
If X = 100 ppmv/year, Y = 102.25 ppmv/year
Human emissions then are 5% of the inputs (IPCC estimate)
Residence time = 4 years
If X = 1000 ppmv/year, Y = 1002.25 ppmv/year
Human emissions then are 0.5% of the inputs
Residence time = 0.4 years
In all cases human emissions are the sole cause of the increase and nature is always more sink than source.
Both the % human input or the residence time are completely irrelevant for the increase…
“In all cases human emissions are the sole cause of the increase and nature is always more sink than source.”
That’s what dogma sounds like
Never heard of a mass balance?
Tell that to your accountant if you spend more money than your income allows, I don’t think that he will agree…
“Nature is a net absorber of some of the manmade CO2 emissions. That means nature does not add CO2 to the atmosphere.”
The process involved is dynamic not static so your statement is nonsense.
If nature is absorbing CO2, then it is not increasing CO2. Do you not understand English?
Chemman is clearly confused, but I think it might be the word “net” which he does not understand.
Indeed it is a dynamic process, but if you add some extra of one of the reactants, the process is disturbed and per Le Chatelier’s principle, the dynamic process tries to restore the balance.
That is by removing part of that extra.
In this case, the removal rate is directly proportional to the extra CO2 pressure above equilibrium (around 295 ppmv). That gives an e-fold time of around 50 years:
“IPCC’s data show the inflow of human CO2 into the atmosphere is about 5% of the total CO2 inflow and natural CO2 is about 95%.
Since human and natural CO2 molecules are identical, their e-times are identical. Therefore, to the first approximation, the composition of today’s atmospheric CO2 is about 5% human and 95% natural.”
“Therefore” is the basic fallacy. Before human emissions, annual inflows and outflows balanced. They had to; there was only a limited amount of carbon in circulation (say about 1500 Gtons) and no source of new carbon. Some of that carbon was reduced by photosynthesis each year, with subsequent respiration and decay. Some was absorbed by the sea each autumn as it cooled, to be released in the summer when the temperature was restored.
Humans provided a source of new carbon. The annual fluctuations are a red herring; they don’t change the arithmetic of the total carbon in circulation, which human emissions permanently increase, having no balancing outflow. It doesn’t matter whether the carbon flux is superimposed on a biological or temperature/solubility cycle. If you add 500 Gtons C cumulatively to the air, some fraction is going to stay there. And it has.
My bad, I thought this post was about Carbon Dioxide.
Now you’re referring to Gtons of Carbon.
(can Carbon float around in the sky?. I learn something new every day.
Or maybe not.)
Carbon atoms are conserved. But in the carbon cycle, they can spend a while as CO₂, carbohydrates, carbonates etc. Therefore the accounting is done using mass of carbon.
Good old accounting. Where would we be without accounting?
Definition: “An examination, reckoning, rendering, or balancing of accounts so as to arrive at the true state of any transaction or course of transactions: as, the court ordered an accounting; the parties came to an accounting.”
In other words, a compromise.
A conclusion would be better, but we can’t get there as a conclusion isn’t scientific.
The standard procedure in chemistry where reactions and other processes (diffusion etc) are taking place is to perform an elemental balance. The same applies to the atmosphere/biosphere so one would carry out O, N, S & C balances, in the case of carbon that can be in the form of CO2 in the atmosphere, bicarbonate in the ocean, carbohydrate in plants. Total carbon would be conserved, not the individual forms.
Wow..do diamonds count?
Ridiculous chemistry argument .
Nick wrote, “Carbon atoms are conserved. But in the carbon cycle, they can spend a while as CO₂, carbohydrates, carbonates etc. Therefore the accounting is done using mass of carbon.”
Why on earth would anyone downvote THAT? What could be more obviously true, to someone who is, himself, a carbon-based lifeform?
Are you just reflexively downvoting Nick’s comments because you disagree with him about other things? How is that constructive??
Hey, fellow carbon-based lifeforms, nearly every atom of carbon in your body was once the “C” in a CO2 molecule. You and I are walking, talking little carbon reservoirs.
Plants are constantly destroying CO2, to harvest the carbon. They use the carbon to make hydrocarbons: like carbohydrates, proteins, cellulose, etc., and they discard the O2 as a waste product.
Animals (like us) do the opposite: we manufacture CO2 by “burning food” (oxidizing hydrocarbons).
Nick is right: Other than a very tiny amount of radioactive 14C (which was once nitrogen), carbon is conserved. It moves around, between “reservoirs,” but it is neither created nor destroyed.
Atmospheric CO2 is but one of many “carbon reservoirs.” When we make CO2 and release it into the atmosphere, whether in our blast furnaces or in our lungs, the CO2 molecules are new, but the carbon atoms in them are not new: They’re “recycled.” They’ve just being moved from some other carbon reservoir into the air.
“can Carbon float around in the sky?”
Lucy in the sky with …?
Nick, I’m shocked, shocked I tell you, that back in the day at CSIRO, you might have been sampling some of that product the Beatles were singing homage to.
(And can we be sure you aren’t still trying to get your inspiration for comments here from the effects of that product? I often suspect so, but hey, whatever pulls your trolley, I say 🙂 )
There’s something called “brown carbon.”
The Stones sang about “Brown Sugar”, but I’m sure they weren’t alluding to the “brown carbon” you mention.
Quite normal use of the element of interest and not all its forms…
In the atmosphere it is CO2.
In the oceans it is 1% CO2, 90% bicarbonates and 9% carbonates.
In plants it is everything (cellulose, sugars,…) except CO2…
Thus instead of calculating everything again and again (as far as possible), just look at the carbon balance, like one looks at the nitrogen balance or the phosphorus balance in agriculture…
Nick relies on a fantasy song !!.. LOL
There is an awful lot of “say about” in climate science.
Say about 50% of climate science is wrong (generous as its undoubtedly much more) in line with the editor of The Lancet declaring up to 50% of medical science being junk.
So which 50% of your climate science is right Nick?
That humans added a lot of CO2 to the atmosphere is right.
Lots of speculation after that.
Shut up Richard. You are a bore on the subject even the alarmist’s disagree with you on.
“Say about” is justified in this case, because the 1500 number is very rough, since it depends on what you count as “in circulation.” My guess is that Nick is probably counting CO2 in the air + biomass carbon (plants & animals) + either some of the carbon in soil or else some of the dissolved carbon dioxide, methane, etc. in water.
A lot of ‘my guess is’ goes on in climate science as well.
“Before human emissions, annual inflows and outflows balanced.”
Really? CO2 has been constant for millions of years?
ROFL!!!
It was constant for thousands of years. Despite the claim that natural emissions are far higher than human.
“It was constant for thousands of years. Despite the claim that natural emissions are far higher than human.” What make you so sure that is true? Oh by the way, all the carbon atoms in your body came from CO2. Without CO2 we all die.
Nick should have said “nearly constant,” and “nearly balanced.” Other than that nit, his statement is correct.
We know that from measurements of air samples in Antarctic ice cores, from which we can measure past CO2 concentrations. During the Holocene CO2 concentrations hovered around 280 ppmv, and varied only slightly, until about two hundred years ago. (We’re not talking about the Pleistocene & earlier.)
Here are Law Dome (Antarctic) ice core data, back to year 1010. Scroll down to “CO2, 75 Year Smoothed,” then keep scrolling. Watch CO2 levels climb to their peak of 284.1 ppmv circa 1170 (MWP), and fall to their lowest level of 275.3 ppmv circa 1615 (LIA):
https://www1.ncdc.noaa.gov/pub/data/paleo/icecore/antarctica/law/law_co2.txt
In this dataset, the decline in temperature from MWP peak to the bottom of the LIA reduced atmospheric CO2 level in Antarctic ice cores by about 9 ppmv, over about 450 years. If you want to be pedantic, that’s not quite “constant.” But it is nearly constant, at least when compared to the 135 ppmv increase in CO2 concentration over the last two hundred years.
Correction:
I wrote, “During the Holocene CO2 concentrations hovered around 280 ppmv”
I should have written, “During the last 5000 years of the Holocene CO2 concentrations hovered around 280 ppmv”
During the early Holocene, CO2 concentrations were a bit lower, as you can see:
Yet again YOU ignore all those large temperature swings in those millions of years while as YOU state,
“Before human emissions, annual inflows and outflows balanced.”
If there is no change then CO2 can’t generate a warming trend which increasing CO2 emissions are needed as per the AGW conjecture to generate continuous warming or it will stop at a new level of temperature and stagnate until CO2, the super molecule emission increases some more.
For millions of years something other than CO2 is causing large temperature swings thus if CO2 was a nobody, then it is a nobody now.
“For millions of years something other than CO2 is causing large temperature swings thus if CO2 was a nobody, then it is a nobody now.”
There is a basic failure of logic here, which I have tried to explain with arsenic etc. AGW says that if CO₂ increases, warming will follow. You point to occasions where CO₂ did not vary and there were temperature swings. That may tell you something about something, but it tells nothing about what would happen if CO₂ increased. Because it didn’t. If you want to disprove CO₂ effect from history, you have to find times where CO₂ increased and temperature didn’t.
But that will be hard, because what we are looking at now is many hundreds of Gtons C being dug up and added to the air. That hasn’t happened before, and you won’t find from history what the result of that might be.
Sigh you keep pushing the main point away because it bothers you so much, it is a FACT that during the 1800 years on YOUR chart CO2 was flat around the 280 ppm level, yet we have many large temperature swings during all that time which clearly means something else is causing the large temperature swings NOT the stable CO2 level you know this is true since there is NO warm forcing increase as there is no increase in CO2 levels in the air for those 1800 years.
That other warming causes aside from CO2 still exists TODAY which you seem to deliberately ignore over and over because that would weaken the CO2 increasing emissions impact on today’s temperature which means you can’t tell me how much of the warming trend is “natural” and how much of it is “anthropogenic”. The postulated DOUBLING of CO2 from 280 ppm doesn’t generate much warming as YOU and many warmist/alarmists continually ignore other warming causes that can also still be ongoing right now which is commonly unaccounted for, and YOU ignore that fact all the time.
I haven’t once disputed that humans are emitting CO2 not once! Haven’t disputed that amount, not once! You never quote it, and you know why because you are bulshitting me with your bogus counter arguments that doesn’t help you at all no one here is disputing humans are emitting CO2 and the cause of most or all of the increase since the 1800’s are by humans.
LOL
There was a large temperature “swing” from 20,000 to 10,000 years ago. Glaciers covering Canada melted. That has nothing to do with the effect of manmade CO2 emissions from SUVs and coal power plants. Based on your lack of logic, it does.
Why are you now making a bogus argument since I never stated that manmade CO2 caused any of the large temperature swings for those 11,000 years or further back in history now you suddenly bring in a NEW time frame 10,000 to 20,000 years ago because you are trying to make a point?
Repeatedly I stated that CO2 stayed around the 280-ppm level for the 11,00 years which means CO2 isn’t the cause of large temperature swings it was caused by something else how come you can’t understand that simple statement?
Give it up Richard not going to play your game here.
(A) You keep implying that CO2 in the age of 100% natural climate change was not a cause of climate change. That may be correct;
(B) Then you imply that manmade CO2 is not important in the past 100 years. WHICH IS SOMEHOW CONNECTED TO (A). That is your personal opinion, not a fact.
(A) and (B) are not connected — it is your thinking that is disconnected.
We know from ice cores that warming and glacial retreat cause atmospheric CO2 levels to rise (though by only about 80-90 ppmv from LGM to HCO).
We also know from physics that higher CO2 levels cause warming (though probably only about 1.5°C per doubling of CO2).
The fact that both are true — warming increases CO2 and CO2 increases warming — makes the combination of the two effects a positive feedback loop (albeit a weak one):
Warmer temperature → higher CO2 level → warmer temperature
Nick,
SOMETHING supported creatures the sizes of dinosaurs. And dinosaurs were apparently widespread around the land surface that existed then.
That “something” was lots of vegetation! The huge herbivores ate it and were, in turn, eaten by the meat eaters.
The *ONLY* way that amount of vegetation could be supported was if CO2 was much higher than it is today!
You are missing the forest not because of the trees but because of your zeal to propagate CAGW religious dogma. It doesn’t matter what exists(ed) in the real world, the dogma is the truth!
Argument from ignorance doesn’t mean jack, Nick. The glacial/interglacial periods show temperature leads CO2.
Theory states 2XCO2 should result in 1 ℃ global temperature change. Speculation about water vapor doubling or tripling that is just that: The lack of a tropospheric Hot Spot goes a long way towards invalidating that speculation.
The largest temperature swings were most likely due to planetary geometry.
So is this now an alternative conjecture to “manmade CO2 is the sole cause of contemporary warming”?
Manmade CO2 is a likely cause of some warming since 1975. The percentage is in the 0% to 100% range. No one knows the correct percentage. It doesn’t matter that the percentage is unknown — the actual global warming since the 1970s was mild and harmless. That we know for sure.
Richard wrote, “The largest temperature swings were most likely due to planetary geometry.”
I agree w/r/t glaciation / deglaciation cycles. They seem to have been triggered by the effects of Milankovitch cycles on northern hemisphere ice sheets, and associated feedbacks.
I don’t agree, however, w/r/t “Dansgaard-Oeschger events” (a/k/a “Greenland interstadials”), in which NH temperatures changed at rates as rapid as several degrees per decade. (Caveat: The most rapid changes are seen in Greenland ice cores, but Greenland’s temperature changes tend, in general, to be at least twice as rapid as globally averaged temperature changes, due to “Arctic amplification.”)
Sunsettommy:
Did you not read my Aug 16 5:09 pm post to you regarding “something other than CO2 causing large temperature swings?
Yes
Sunsettommy:
?? Yes, you did not read it, or Yes, you did read it.
It provides the answer to your question
Yes, I read it.
I see it as one possible answer.
Sunsettommy:
The thesis is falsifiable (empirically testable), and has been tested and validated multiple times.
And for a given problem (climate change, in this instance), there can be only ONE tested and validated answer.
Eliminates the greenhouse gas hoax
Tommy wrote to Nick, “Yet again YOU ignore all those large temperature swings in those millions of years while as YOU state, ‘Before human emissions, annual inflows and outflows balanced.'”
He was talking about CO2, not temperatures, and he was talking about the last few thousand years, not millions.
“It was constant for thousands of years.”
At a level of bare subsistence for plant life..
.. at a balance between no-life and some-life.
Thank goodness that human released carbon expanded the carbon cycle.
We can now grow sufficient crops and the world is greening.
… because PLANTS LUV CO2
“Humans provided a source of new carbon”
Absolute RUBBISH.
Humans release small amounts of accidentally sequester carbon..
It is all OLD carbon, that used to be in the atmosphere when plant life was far more abundant.
Absolutely true and this fact makes leftists go berserk
Buring fossil fuels “recycles” carbon from underground, back into the atmosphere, where it was once CO2.
Good physicists make things simple. You are making things complicated.
If you have a bucket with a hole in the bottom, and you continuously pour 5% wine and 95% water into the bucket to keep the level constant as the mixture flows out through the hole in the bottom, what do you think would be the percent of wine in the wine-water mixture?
How about 5%?
Ed
I’ve got it
You’ve been drinking too much wine?
That’s the lamest response so far on this thread Richard.
(even lamer than some of mine)
I have a participation trophy
from the School of Lame Comedy
Congratulations!
Ed
“Good physicists make things simple. You are making things complicated.”
You haven’t dealt with the very simple mass balance issues raised by Richard Greene, Dave Burton and me. We’ve emitted, on Dave’s figures since 1958, 393 Gtons C. There are now 221 more GTons C in the atmosphere, about half of what we emitted. If that isn’t ours, then where did ours go? Where did the C that is there come from?
Where did the C that is there come from?
Nitrogen + Cosmic Rays?
OOps. Refer to RI’s comment below!
Nitrogen + Cosmic Rays makes only 14C, and when 14C decays it decays back into nitrogen, not into 12C or 13C.
14C is only about one-trillionth of the carbon in the atmosphere.
There are about 922 billion tonnes of carbon in the atmosphere, of which about one tonne is 14C.
I agree that people make this too complicated. So let’s use your simple analogy:
I have a bucket with water pouring in, and an identical amount of water pouring out. Level remains the same.
I now add wine at a lower rate, making a 95/5 water/wine inflow. The level rises because the inflow is now greater than the outflow. The mix remains at 95/5, however.
Later on, the level has risen to 50% higher than it was when inflow and outflow were equal. The mix is still 95/5.
Is the additional 50% now in the bucket ALL due to the additional 5/95 of wine being added, or NOT?
To keep it simple, I’m not allowing for the slight difference in additional outflow because of greater pressure (due to gravity) in either this analogy or the atmosphere (due to partial pressure), because these differences aren’t as great as the additional inflows, so don’t negate the effects, merely reduce them somewhat.
Is that simple enough?
Dr. Ed,
Based on the 13C/12C ratio, the current atmosphere already contains over 10% CO2 originated from fossil fuels. How is that possible with 5% fossil fuel input, if your residence time model was right?
Ed,
“How about 5%?”
I haven’t wanted to get into the business of labelling carbon, because it only confuses things. But there is a clear fallacy here. You want to label Cn natural carbon and Ch human, and say that 10 Gtons/year flux of Ch, merging with a 200 Gton/year flux of Cn, makes a 5% mixture.
Well, it would if there were a constant supply of new Cn. But in fact the 200 Gton/year is just a seasonal exchange with a finite reservoir (sea and biomass). The 200 Gtons that goes back into that reservoir is 5% Ch. So after a bit of mixing, the 200 Gton that comes back into the air next year is no longer Cn, but has significant Ch. So the air is more than 5% Ch. That enriched air goes back into the reservoir, mixes, and the next 200 Gtons that mixes with the 10 Gt Ch is richer again with Ch.
And so it continues, until we get the current situation where a third of the C in the air is Ch.
It is like a bizarro world when Nick Stokes comments here make MUCH MORE SENSE than the article’s AUTHOR.
Were volcanoes not invented then?
Many (subduction) volcanoes just recycle CO2 from sea floor carbonates that are folding from one (African) plate under another (Eurasian) plate. That is the case for several active volcanoes like mount Etna.
Deep magma volcanoes (Iceland, Hawaii) are on hot spots and that should be very old CO2, but in general the amounts are far less.
Measurements at mount Etna, one of the most active in the world show very modest levels and all together about 1% of human emissions…
How many volcanoes and fissures exist in the world, including every one of them on the ocean beds?
Precisely please, humanity is at stake here.
They measured the CO2 emissions around mount Etna, crater and fumaroles during years.
Mount Etna is one of the 5 most active volcanoes in the world.
They had en elegant way to discern between volcanic CO2 and other CO2: the volcano has a fixed SO2/CO2 ratio and by measuring SO2, they could calculate the amount of CO2 from the volcano alone…
https://www.nature.com/articles/351387a0
Estimated for all subareal volcanoes, that represents less than 1% of human emissions.
Even the huge release caused by the Pinatubo eruption in 1991 did give a… drop in the CO2 increase, because the temperature drop had more effect than the extra CO2 release of the Pinatubo…
Undersea volcano CO2 in general doesn’t reach the surface, as under the enormous water pressure almost all CO2 is dissolved in the deep oceans, which are at the temperature by far undersaturated in CO2.
Cue Nick Stokes.
I agree in part and disagree in part.
I agree that the IPCC and Bern model efold times are far too long, hence wrong. WE has several old posts on this relative to Murry Salby’s errors. IIRC, WE estimated something on the order of about 40-50 years.
I disgree that radioactive 14C (figure 5) can be used to show anything meaningful about this efold time issue. It is produced by the subatomic impact of cosmic rays on 14N, converting it to 14C. That rate is presumed roughly steady, so 14C decay can be reliably used to data anything organic from about 500 to 50000 years old.
I disagree that the rise observed by Mauna Loa Keeling curve is more natural in origin than anthropogenic from fossil fuels. There is an easy proof that it is almost all anthropogenic. 12C is lighter by one neutron than 13C. Both isotopes are stable. Because lighter, 12 C is preferentially used in photosynthesis, When it is then sequestered as a fossil fuel (or kerogen precursor in the case of the Green River formation), the ratio of 13C in the atmosphere is enhanced.
The last major fossil fuel formation event known was California’s Monterey shale about 15mya. So the atmospheric ratio of 12C/13C was about stable since, UNTIL fossil fuel consumption became significant, releasing previously sequestered mainly 12C and thus reducing the residual proportion of 13C from the previous steady state ratio. And in fact, the 13C proportion declines in sync with the Keeling curve rise in total CO2. Proving its anthropogenic origin.
You’re disappearing up your own backside with science Rud.
What has really change on our planet in the last 50 years of catastrophic predictions?
It’s got greener as far as I can see.
That’s it.
Admitting you don’t understand science talk does not mean it is wrong.
It just means you are ignorant.
It is no sin to be untutored. But don’t pretend that your ignorance is somehow virtuous.
Er, I don’t understand the religious people who speak in tongues either.
But when they try to put their hand in my pocket to empty my wallet, I have fairly good idea of where they’re coming from.
“It is no sin to be untutored.”
One way of saying its ok to maintain your ignorance, I guess.
Interesting to note that you were TOTALLY INCAPABLE of answering HS’s question. ! 😉
Admitting what? “You don’t understand the science or the talk? Which is wrong? You’ve confused me, not hard to do! I ask that you form your comments coherently please. Admitting ignorance about climate, its causes, its consequences and how to adapt is a VIRTUE!
OK Leslie, describe to me what has meaningfully changed on our planet in the last 50 years please.
And who say’s I’m untutored, and how do you define untutored? Not going to university? In which case many of our untutored scientific forebears would be, by your haughty standards, “ignorant”.
I spent more than a decade as a police officer learning about fact’s and evidence, before successfully practicing both in business for 30 years. There is a difference between facts and evidence I daresay you couldn’t possibly define, but you’ll pretend to represent them as conclusive as a “tutored” scientist.
It’s a refreshing scientific breakthrough to be scientifically “untutored”. At least I’ll challenge convention, what have you ever done to confront it?
Where did I, in my post to Rud, declare I don’t understand science?
Show me both the facts of my statement and present it evidentially.
Go back to your kitchen wench. When you can figure out the science of baking a cake, come back and take on the grown up’s.
Ouch, HotScot, that was bit much! Was that one or two ladies who found your comments appealing?
I’m not Leslie, but in the last 50 years:
Added manmade CO2 to the atmosphere
Planet is slightly warmer
CO2 may be one cause — a reasonable assumption.
Winters in SE Michigan are not as cold as in the 1970s
We love that, and want a lot more.
…
Hot Scott:
You ask what has happened in the last 50 years
The only relevant thing is that, due to global “Clean Air” efforts, Industrial SO2 aerosol emissions have decreased from 136 Megatons to 72 Megatons (2019). This decrease in atmospheric pollution has increased the intensity of the sun’s rays striking the Earth’s surface, causing increased warming.
CO2 has ZERO climatic effect
So what’s your point?
What has changed in the last 50 years?
Burl wrote, “Industrial SO2 aerosol emissions have decreased from 136 Megatons to 72 Megatons (2019).”
Those are an interesting statistics. What’s the source?
The relative proportion of 13C is steadily decreasing over time. Before the industrial revolution, δ13C was approximately -6.5‰; now the value is around -8‰. Plants have less 13C relative to the atmosphere (and therefore have a more negative δ13C value of around -25‰). Most fossil fuels, like oil and coal, which are ancient plant and animal material, have the same δ13C isotopic fingerprint as other plants. The annual trend–the overall decrease in atmospheric δ13C–is explained by the addition of carbon dioxide to the atmosphere that comes from the terrestrial biosphere and/or fossil fuels.
Yeah. I tried to explain this without any math, just logic.
Maths and science are a mystery to 99% of the planet.
50 years wasted by sceptics trying to convince people that don’t understand either, that what they don’t understand, makes sense.
The left used propaganda. Everyone understands propaganda.
But the left are dumb, we are constantly assured by the right.
So here we are, with wind and solar farms, escalating energy bills, and poverty.
Great science everyone on the right. Round of applause.
Only if you stick to principles. There has been enough government sanctioned theft that any pragmatist can enjoy the rewards.
I only see it changing when people in the west are dying of energy poverty and/or when the west understands how far ahead China has got in dominating global politics a power.
Projections of population growth are that by 2100 more than 8 in 10 people alive will live in Asia and Africa. The priority for Asia and Africa is to improve the lives of their peoples Fossil fuels are the easiest way for them to do that. They are not going to buy into the net zero rubbish that the West is currently consumed by.
However, I do wish they’d “buy into” effective rubbish disposal systems rather than dumping everything into the sea.
Fantastic solution. Wait until everyone is dying then say “I told you so”.
We climate realists talk about science
Based on data
Data for the present and past.
A few are somewhat confused ABOUT THE SCIENCE.
The Climate Howlers predict climate doom
No data
There are no data for the future climate.
Always wrong predictions of climate doom have nothing to do with science. They are politics. Or climate astrology.
Climate Realists and Climate Howlers are in different “time zones”. They are in The Twilight Zone.
Yea, but they’re winning. Science has failed.
Politics and junk science have trumped real science. I use “trumped” as often as possible to annoy those pesky leftists.
Politics + Science = Politics.
I reckon we should leave the boffins to keep doing their spreadsheet models about what makes the atmosphere and weather work, because as you say, 99% of the voters will never understand what the boffins are talking about, but get these climate pointy heads the fvck out of electricity, transport etc and let the practical engineers deliver the working solutions for the good of all mankind.
100%!
Renee,
Thank you for adding some actual numbers. My response to Rud is a long way down this thread and which may be of interest to you. In summary, the decline in atmospheric δ13C reflects a δ13C of the incremental CO2 of -13 per mil, much higher than fossil fuels alone at -28 per mil (NOAA estimate). There are many possible source-sink models for this, but none that I am aware of that explain the constancy of the figure, which is based on direct atmospheric measurements and supported by the Law Dome data, or the inter-annual variations.
”…Proving its anthropogenic origin…”
Proving it is biogenic in origin. Not necessarily anthropogenic.
Right…
But…
As the earth is greening, the biosphere as a whole is absorbing more CO2 than it releases, which leaves only one source of low-13C as cause of the atmospheric decline: human emissions…
Confirmed by NASA satellites, but also by the oxygen balance…
Dear Rud,
The source of natural 14C is irrelevant. The rate that 14C is created is relevant. The equilibrium level is where outflow equals inflow. delta 14C is a function of the ratio of 14C to 12C. At equilibrium, delta 14C is zero, as established before 1950.
The bomb tests raised delta 14C to about 700. Thereafter, delta 14C decayed toward zero with an e-time of 16.5 years.
It is simple to use the 12C level and delta 14C to calculate the annual values of 14C since 1970. It is also simple to find from these data that the e-time of 14C is 10.0 years.
The key is that we can find the e-time of 14C when something, like bombs, drives the 14C level far from its equilibrium level. That is how we know the e-time of 14C.
So, your disagreements are irrelevant. The e-time of 14C is 10.0 years.
You owe us an explanation of where all the manmade CO2 emissions of fossil fuels went, if not into the atmosphere. There are no other explanations. Except wrong explanations.
Maybe the 7 billion of us inhaled them?
You may well inhale CO2, but your lungs won’t absorb it, and it will be exhaled again, along with your own 10,000 ppm of CO2.
More like 40,000 ppmv, is my understanding.
But yeah.
Dear Ed,
The decay rate of 14C is quite different from both the residence time and the decay rate of any extra bulk 12C in the atmosphere.
Why? Because what is absorbed by the deep ocean is the current isotopic composition (minus the air-water fractionation), but what returns from upwelling deep ocean waters is the isotopic composition of many centuries ago (minus the water-air fractionation), long before human emissions or bomb tests.
That makes that for 1960, at the peak of the nuclear 14C, some 97.5% of all 12CO2 returned from the deep, but only 45% of all 14C.
Which makes that the decay rate of 14C from the bomb tests was much faster than for some extra 12CO2…
Dear Ferdinand,
First of all, “residence time” does not have the proper definition to apply to this problem. Only turnover time, which I call e-time, provides the proper mathematical definition for this problem.
Second, the only times when it is easy to calculate the e-time for an outflow is when the level is far from its equilibrium value. That occurred for 14C in about 1970. The data show the 14C e-time is 10.0 years.
This means the e-time for 12C is less than 10.0 years. In fact, IPCC data shows the e-time for 12C is 3.5 years.
Third, the reason the delta 14C (or the ratio 14C/12C) approaches its former equilibrium value in the years after 1970, is because of what you just described. Namely, the natural inflow of delta 14C from the oceans and land continue and this inflow forces delta 14C to move to its original value.
Ed
Dear Ed,
Residence time and turnover time are in my opinion exactly the same (~4 years) but largely different from the observed e-fold reduction time for an excess amount of 14C (10-14 years) or 12C (50 years).
The reduction speed for an excess 14C injection should be longer than for 12C, because its heavier molecular weight, but there is a huge difference for what returns from the deep oceans: that was much lower (45%) for 14C than for 12C (97.5%), making that the drop in 14C is much faster than for a 12C excess.
In preface to the rest of this comment…
The atmospheric lifetime of 14C, and the percentage of 14C-depleted “fossil carbon” which is currently remaining in the atmosphere, are completely irrelevant to the fact that the increase in atmospheric CO2 since (at latest) 1958 is entirely anthropogenic, as many of us have already explained.[1][2]
But that doesn’t mean they aren’t interesting for other reasons. So…
Ed wrote, “Thereafter, delta 14C decayed toward zero with an e-time of 16.5 years.”
Agreed. The half-life of the decay was 11.5 years (it halved twice over 23 years, from 1974 to 1997):
That makes the e-folding time 11.5 / ln(2) = 16.59 = about 16½ years.
So far, so good.
But Ed then wrote, “It is simple to use the 12C level and delta 14C to calculate the annual values of 14C since 1970. It is also simple to find from these data that the e-time of 14C is 10.0 years.”
Huh? How did you get that, Ed?
Correct me if I’m wrong, but I assume that the Δ14C figures in that graph (above) are relative to then-current total carbon (99% 12C + 1% 13C). Right?
That means some of the apparent decline in atmospheric 14C from 1974 to 1997 was just dilution, as the total CO2 level in the atmosphere rose. That means that if the amount of carbon in the air had been stable, then the 14C half-life would have been a bit longer, not shorter, than 11.5 years.
Here are the Mauna Loa CO2 figures:
1974 = 330.19 ppmv CO2 (when Δ14C = 400)
1997 = 363.88 ppmv CO2 (when Δ14C = 100)
So the CO2 level rose by 33.69 ppmv from 1974 to 1997.
If total atmospheric CO2 had still been only 330.19 in 1997 then Δ14C would have been 100 × (363.88/330.19) = 110.2 in 1997.
That increases the half-life slightly, to 11.5 × (2/log2(400/110.2)) = 12.4 years, and it similarly increases the calculated e-folding time from 16.59 years to 17.84 years.
Not 10.0 years.
So, what am I missing?
“I disagree that the rise observed by Mauna Loa Keeling curve is more natural in origin than anthropogenic from fossil fuels.”
You are polite, unlike me, and correct, but will still get slammed by science deniers. That’s what they do !
Section 7, proposing the author’s 14C theory, comes after he has offered other proofs. Conclusions were offered in the following section. As I read it, I assumed that section to be ancillary to the rest of the paper. Do you differ on the data or reasoning offered in sections 1-6, other than the e-time calculation?
See above: Dr. Berry didn’t take into account that the 14C return from the deep oceans has a delay of around 1000 years, thus at pre-bomb levels, effectively reducing the rate of 14C much faster than for an excess 12C amount…
Actually, the 13C/12C ratio (usually expressed as δ13C) declines in sync with the reciprocal of atmospheric CO2, as demonstrated by the first plot below (source: Böhm et al (2002). Why? Because the net δ13C content of the additional atmospheric CO2 has been constant when averaged over longer periods (it fluctuates over short periods associated with major ENSO events and volcanic eruptions) and has been circa -13 per mil since 1750 or thereabouts. The isotopic mass balance equations confirm this: a linear relationship between δ13C and 1/CO2 reflects a constant net δ13C of the incremental CO2. This can be shown as per the second plot below and is known as the Keeling plot.
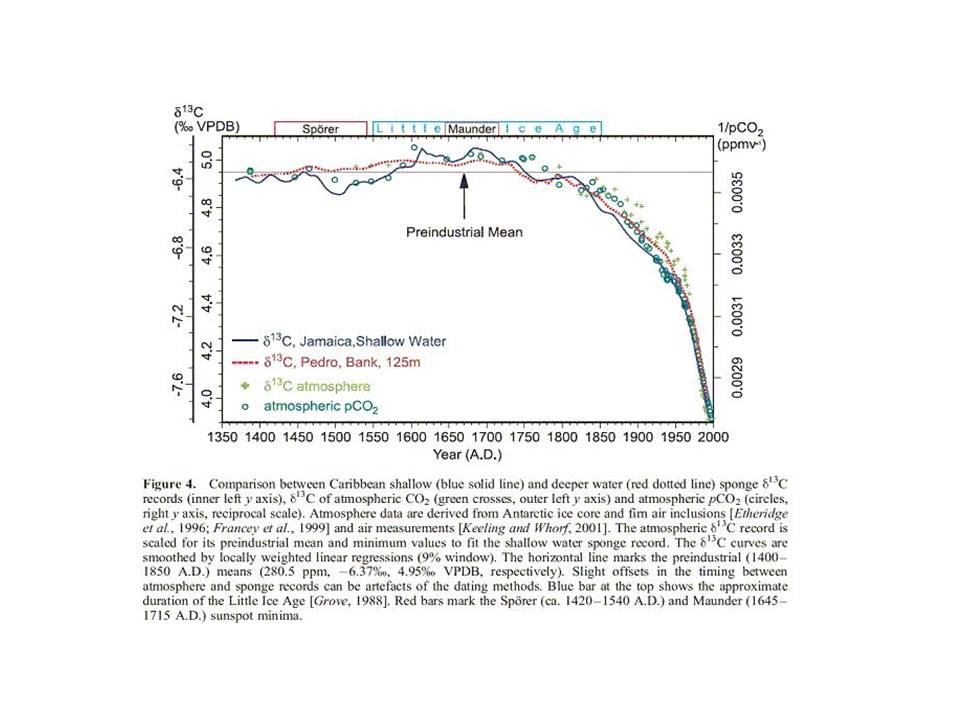
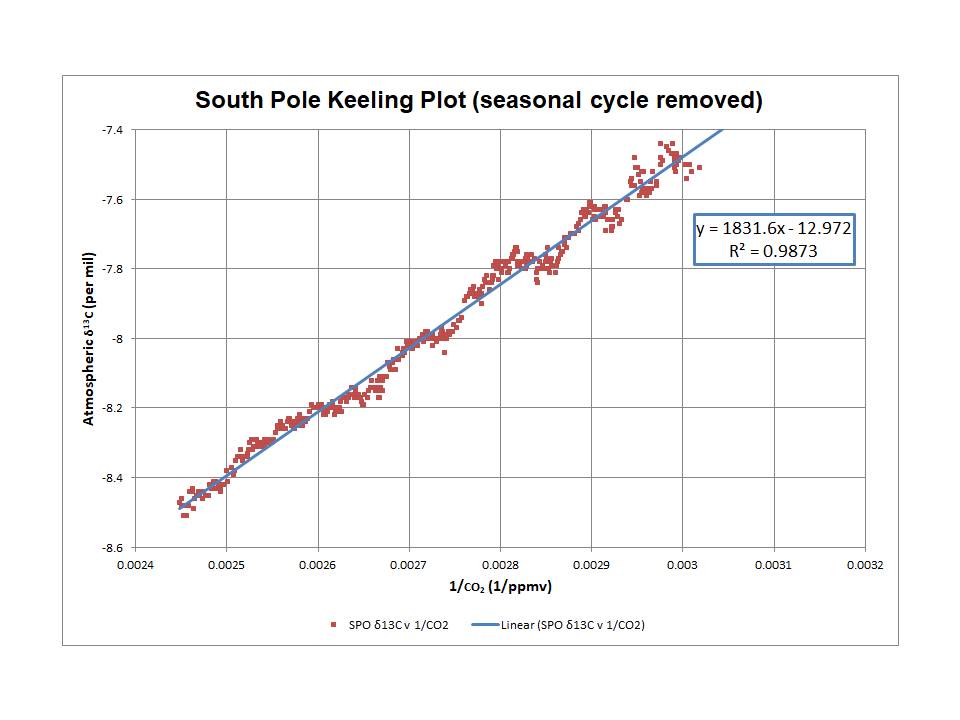
The following plot is an example of a Keeling plot. The South Pole data (measurements) are provided by the Scripps CO2 program and are with the seasonal cycle removed by Scripps. The intercept reflects the average δ13C of the incremental atmospheric CO2.
The issue is that the atmospheric decline reflects a net δ13C value of -13 per mil, whereas fossil fuel burning generates CO2 with a δ13C of around -28 per mil (according to NOAA): much, much lower. As recently as 2017, even Keeling et al (2017) had difficulty matching the longer term trend of atmospheric δ13C decline with their model, despite the observations reflecting a constant -13 per mil for the net δ13C of the incremental CO2.
A second important point is that published models are, as yet, unable to match the inter-annual variations in atmospheric δ13C that appear to correspond to major ENSO events and the Pinatubo eruption, possibly because the models do not adequately allow for oceanic effects: refer to https://agupubs.onlinelibrary.wiley.com/doi/full/10.1002/gbc.20048.
Jim,
Very interesting. Oceans have a higher δ13C around -10 per mil because the ocean does not fractionate 12C from 13C nearly as much as the terrestrial biosphere. Therefore, the ocean flux’s fingerprint is more similar to that of the atmosphere of -8 per mil.
Renee, as the plot of the coralline sponges show, δ13C in ocean surface waters is around +5 per mil in the Caribbean. In general all over the oceans between +1 to +5 per mil, depending of local bio-life, as low-13C organics drop out of the surface into the deep, leaving more high-13C inorganics in the surface.
Deep oceans are around zero per mil.
When CO2 transfers from the ocean waters to the atmosphere, the lighter 12CO2 is moving faster than the heavier 13CO2, which makes that there is a shift of -10 per mil in isotopic composition of CO2 from water to air. A similar shift of -2 per mil occurs where CO2 sinks into the oceans, overall -8 per mil (when the mass balance is in equilibrium).
See equation 8 in:
https://scope.dge.carnegiescience.edu/SCOPE_16/SCOPE_16_1.5.05_Siegenthaler_249-257.pdf
The -8 per mil need to be compared to the ocean surface of +1 to +5 per mil, which resulted in an overall δ13C level of -6.4 +/- 0.2 per mil over the full Holocene in the atmosphere.
I suppose that we may assume that the -6.4 per mil still is the average atmosphere δ13C level from an exchange with the (deep) oceans, even nowadays…
Even with huge temperature/vegetation changes over glacial-interglacial transitions, the difference in δ13C of the atmospheric CO2 was only a few tenths of a per mil…
i Even with huge temperature/vegetation changes over glacial-interglacial transitions, the difference in δ13C of the atmospheric CO2 was only a few tenths of a per mil
Yes, that is correct pertaining to both CO2 and it’s δ13C in ice cores. Both are suppressed or smoothed over tens to hundreds of years during the firn to ice transition.
Renee,
Thank you very much for your comments. I think that a better understanding of the influence of the oceans, especially upwelling, on atmospheric CO2 growth rates and δ13C variations associated with major ENSO events and Pinatubo could be key to explaining the models’ failure to replicate the inter-annual variations in atmospheric δ13C.
So, 0.0000001% of 0.000000000000000001% of nothing equals nothing? Pretty sure Jethro Bodine summarized this complicated equation back in ’67.
Jed understood the value of fossil fuel!
Jethro (Max Baer. Jr.) had a very successful life after the Hillbillies and is estimated to have a current net worth of $50 million
His biography is very surprising.
A smart guy who acted dumb.
Oh, yea. Max Baer was brilliant! He used his time after BHB to do a lot of things most people got no idea of. My mom was a big fan of him.
I’m sorry if this offends some people, but this article is absolute nonsense.
Here’s what we know:
1. We know how much CO2 mankind adds to the atmosphere each year, because the bean-counters keep close track of fossil fuel production & use. Historical “carbon budget” information, about sources, sinks & fluxes of CO2 since 1750 can be found in this spreadsheet (or as .xlsx), and newer data is available from the Integrated Carbon Observation System (ICOS), and from ourworldindata (search the downloaded data file for “world”).
2. Since 1958, we also have good measurement data showing the atmospheric CO2 concentration each year, and hence we know the year-to-year changes in concentration. (Before 1958 we have less precise measurement data, from air samples trapped in ice cores.) Here’s the annualized CO2 trend:
https://sealevel.info/co2.html
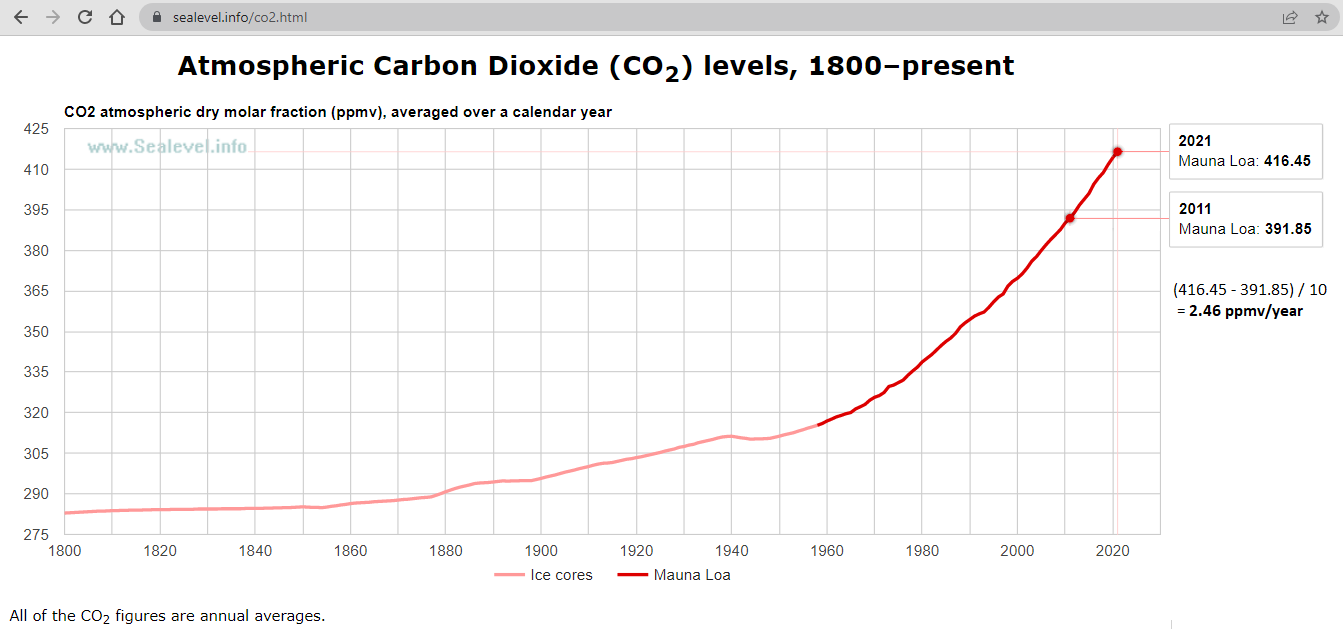
3. We also know the mass of the Earth’s atmosphere, and the relative densities of CO2 and air, from which we can trivially calculate that 1 ppmv of CO2 masses 8.0 Gt.
Thus we do not need to guess how much CO2 man has added to the atmosphere, and the net amount of CO2 which nature has removed from the atmosphere: we have the measurements.
What those data show is that, since 1958:
● mankind has added ≈180 ppmv of CO2 (1440 Gt) to the atmosphere,
● nature has removed net ≈79 ppmv of CO2 (632 Gt) from the atmosphere, and
● the amount of CO2 in the atmosphere has increased by ≈101 ppmv (808 Gt).
That means about 180% of the increase in atmospheric CO2 concentration since 1958 is anthropogenic.
(BTW, the only reason I say “since 1958” is that prior to 1958 we don’t have measurements precise enough to do the calculation with unassailable reliability.)
That’s it. That’s absolute proof that the entire increase in atmospheric CO2 concentration since 1958 is man-made. (More than “entire,” actually.)
Q.E.D.
Note that to deduce that fact we don’t need any models (Bern, Berry, or any other). We don’t need isotope data. We don’t need to know residence times, turnover times, or adjustment times. We don’t need to estimate flows between individual carbon reservoirs. We don’t need to know anything at all about the many individual natural CO2 fluxes. And, since we’re using whole-year averages, we don’t need to know anything about vegetation-driven and temperature-driven seasonal patterns and how they differ with latitude.
Many of those things are certainly interesting, and some of them are important for other reasons, but they are irrelevant to the proof of the fact that all of the increase in atmospheric CO2 concentration since 1958 is due to human emissions.
꧁꧂
If all you care about is what gets the credit for increasing the atmospheric CO2 level over the last 64 years, you can stop reading here. The rest of this comment is irrelevant.
Here’s how the seasonal cycle varies with latitude:

It turns out that the “effective atmospheric lifetime” or “adjustment time” of anthropogenic CO2 added to the atmosphere is about fifty years (corresponding to a half-life of about 35 years). I.e., if anthropogenic CO2 emissions suddenly ceased, it’d take about 35 years for the CO2 level to decline halfway toward 290 ppmv, and about 50 years for the CO2 level to decline 63% of the way toward 290 ppmv.
That is the result that Prof. Richard Lindzen reported during the Q&A (3rd video) of this (excellent!) lecture:
● Part 1:
https://www.youtube.com/watch?v=hRAzbfqydoY
● Part 2:
https://www.youtube.com/watch?v=V-vIhTNqKCw
● The Q&A which followed:
https://www.youtube.com/watch?v=69kmPGDh1Gs (including his discussion of CO2 atmospheric lifetime)
That’s also the approximate result that Dr. Roy Spencer found:
http://www.drroyspencer.com/2019/04/a-simple-model-of-the-atmospheric-co2-budget/
That’s also the approximate result that I got, first with a little program to simulate declining CO2 levels, based on the historical CO2 removal rate as a function of CO2 level, and then with a modified version of the program based on Dr. Spencer’s model; the source code is here:
https://sealevel.info/CO2_Residence_Times/
Ferdinand Engelbeen reported roughly the same result. He did the clearest and most thorough examination of the cause of rising CO2 concentration which I’ve found, here:
http://www.ferdinand-engelbeen.be/klimaat/co2_origin.html
Climate activists frequently claim that anthropogenic CO2 has a residence time of “centuries” or even longer. Such claims are based on integrating the “long tail” of its theoretical decay curve. That’s a very silly thing to do, because the long tail would only become relevant if CO2 levels were below 340 ppmv, in which case we’d be suffering from a much more severe CO2 deficit.
A general comment. People trying to ‘disprove’ any AGW are usually barking up the wrong tree.
100%.
Now we are bringing dogs into the argument?
First it was arsenic.
Now dogs?
The Climate Howlers are always barking about CO2
Like a dog howling when a fire siren goes off.
I greatly appreciate your collecting those links; I needed the reminders.
I will say that his Fig. 4 is indeed a solution to the Figs. 1 & 2 system under the assumption that flow out is proportional to content. That system has time constants of 2.8 years, 6.7 years, 95 years, and infinity when the perturbations are respective eigenvectors. (Fig. 1 shows the infinity-time-constant eigenvector.) If the perturbation is just a slug of CO2 in the atmosphere only, then the response in the atmosphere does indeed take 4 years to decay to 1/e of its initial value.
That is, he did the math right; his Figs.1 & 2 that must be misleading.
Dear Dave,
In your section 3, you write:
“That means about 180% of the increase in atmospheric CO2 concentration since 1958 is anthropogenic”
But you forced that conclusion by claiming:
“nature has removed net ≈79 ppmv of CO2″
which you derived by ASSUMING incorrectly that human CO2 caused all the increase.
So, your conclusion is simply your assumption.
Dave, you should be smart enough to not make such an error.
Also, because you are mixing human and natural CO2 in your analysis, you are getting confused.
You should understand that the proper way to calculate the effect of human CO2 is to calculate the flow of human CO2 independently from natural CO2 but using the same physics and time constants as natural CO2.
If you do this, (or if you can follow the calculations in my 201 paper), you will find human CO2 has caused only about 25% of the CO2 increase above 280 ppm and natural CO2 caused 75%, as of 2020.
That concept is simpler than all your arguments above.
Ed
It is you who is confused
Manmade CO2 emissions account for much more than 100% of the increase of atmospheric CO2 since the 1800s
Therefore, nature must be absorbing some of the manmade emissions. Nature is a net ABSORBER of some CO2 emissions.
Period.
Richard Do we know how natural sources of CO2 have changed since the little ice age? I find it strange that the underlying assumption is that natural sources don’t change.
We don’t have figures of individual CO2 fluxes from the past, but we do have the end result: the CO2 levels in the atmosphere.
These did fluctuate with ocean temperatures between the warm MWP and the colder LIA (probably 0.8 K). The net result was an about 7 ppmv drop of CO2 at the depth of the LIA in the high resolution (~20 years) Law Dome DSS ice core.
If the current temperature is not higher than during the MWP, the increase should have been about 7 ppmv, not 120 ppmv…
Ferdinand wrote, “If the current temperature is not higher than during the MWP, the increase should have been about 7 ppmv, not 120 ppmv…”
True: That’s about 9 ppmv of consequent CO2 concentration change per 1°C temperature change.
A similar conclusion can be deduced from the larger, longer glaciation cycles (graph source):
As you can see, over the course of a deglaciation, polar temperatures are believed to have risen by at most about 15 °C, (to the very warm Eemian peak), and by a few degrees less than that during most other deglaciations. Globally averaged temperatures probably rose about half as much as polar temperatures, which means something like 5 to 8 °C of “global” (average) warming during a deglaciation.
Over those same glaciation / deglaciation cycles, the atmospheric CO2 concentration varied by an average of about 90 ppmv.
The last CO2 minimum was about 190 ppmv, at LGM, about 20K years ago (nearly 230 ppmv lower than our current level).
Look at the ratio between temperature change and consequent CO2 level change: 90 ppmv CO2 level change from a 5 to 8 °C global temperature change, so only about 11 to 18 ppmv of consequent CO2 level change per 1°C temperature change.
What’s more, it took thousands of years to get those full CO2 concentration variations from the glaciation cycle temperature changes.
The modern rise in CO2 concentration obviously dwarfs any CO2 level changes which could result from warming alone.
Since 1780, when CO2 level was about 280 ppmv, the atmospheric CO2 concentration has risen by nearly140 ppmv, while globally averaged temperatures rose by only 1 to 1½ °C.
Even if there had been thousands of years to fully realize the effect on CO2 level from that 1 to 1½ °C of warming (instead of just 240 years from the start, and <100 years from the halfway point), you could still plausibly get at most 9 to 27 ppmv† of CO2 level change from 1 to 1½ °C of warming, not the 140 ppmv increase we’ve actually had.
So warming could not cause such a large CO2 level rise.
† (9 to 18 ppmv/°C) × (1 to 1.5°C) = 9 to 27 ppmv
We don’t have figures of individual CO2 fluxes from the past
Actually, we do. Using carbon isotopes from Law Dome ice, the plot below shows atmospheric CO2 fluxes from (negative values on the y axis) and to (positive values on the y axis) the terrestrial biosphere (land: green line) and the ocean (blue line).
https://essd.copernicus.org/articles/11/473/2019/
Thank you for the link, Renee.
That’s part (a) of a 5-part graph, 3 parts of which are pertinent. Here’s a higher-resolution version of those 3 parts (a, b & e):
The graph is interesting, but:
1. I suspect that when Ferdinand wrote “individual fluxes” he meant a greater granularity than merely terrestrial vs. marine.
2. I’m not confident in the accuracy of their deductions.
2(a). Note that they include no error bars – generally a bad sign. Also,
2(b). The isotopic signatures of individual marine and terrestrial fluxes vary considerably, so trying to deduce their sums from their averages seems likely to be imprecise, at best. Also,
2(c). One of the parts of that graph which I omitted is a temperature reconstruction from Pages 2K, which I think is a dubious source. I don’t know enough to have an opinion about their other data sources, but if “birds of a feather flock together” that’s not a good sign.
2(d). There’s a very widespread tendency in “climate science” to generate “reconstructions” of unknown quantities from highly sketchy or even completely nonexistent data, and then pretend that they’re known quantities Obvious examples are PIOMAS “reconstructions” of Arctic sea ice mass prior to the existence of relevant measurements, and Ocean Heat Content “reconstructions” prior to Argo floats.
We can hope that these are better than those, but the fact that the paper got through peer-review is not evidence of it, because the bar for peer-reviewed “climate science” publication is very, very low:
Q: What’s the difference between these two things?
A: One of them is great big steaming pile of BS. The other is fertilizer.
I wrote, “That means about 180% of the increase in atmospheric CO2 concentration since 1958 is anthropogenic”
Ed replied, “But you forced that conclusion by claiming: “nature has removed net ≈79 ppmv of CO2″ which you derived by ASSUMING incorrectly that human CO2 caused all the increase.”
Wrong. I assumed nothing. The 79 ppmv net removal by nature is calculated:
There are no assumptions in that reasoning (other than the fact that I’m ignoring error bars in this discussion, for simplicity). It is just arithmetic.
🙟🙝
We know that mankind added a total of about 1440 Gt of CO2 to the atmosphere over that period. We call that “anthropogenic emissions.”
I trust you do not dispute that.
But we know that the amount of CO2 in the atmosphere increased by only about 808 Gt (101 ppmv).
I trust you do not dispute that, either.
Therefore “other things” removed a net total of 1440 – 808 = 632 Gt of CO2 from the atmosphere. We call those other things “nature.”
“Nature” removed a net sum of 632 Gt = 79 ppmv of CO2 from the atmosphere over that period.
Q.E.D.
“Nature” removed a net sum of 632 Gt = 79 ppmv of CO2 from the atmosphere over that period.
He doesn’t dispute it, because he doesn’t mention it and he doesn’t mention it because he can’t; because that would reveal how bizarre this whole concoction is.
This is “Anything But CO2” on steroids. “Now it’s not even our CO2”. So where did our’s go? Oh wait, its actually good for us, so yeah, it’s ours afterall. Ffs
Dave, you’re missing a big piece of the puzzle. How have natural CO2 emissions changed over time?
THis was posted at WUWT in the spring
Estimates of the carbon cycle – vital to predicting climate change – are incorrect, Virginia Tech researchers show – Watts Up With That?
Freeman Dyson talk on CO2 is interesting. His point is that wdon’t understand the CO2 cycle.
Freeman Dyson – The balance of carbon in the atmosphere (144/157) – Bing video
You assume that natural CO2 emissions don’t change. I don’t think it’s a good assumption. My take is that the error rates in measuring natural CO2 changes swamp the amount of CO2 released by human activities.
Nelson,
We don’t need to know anything of any individual natural flux in the past or the present, as we know the overall effect: about 12-16 ppmv/K over the past 800,000 years.
That is the ratio between temperature and CO2 in the atmosphere when the temperature changes over glacial and interglacial periods.
Even in the high resolution (about 20 years) of the Law Dome DSS core, the 0.8 K cooling between MWP and LIA is visible as a 7 ppmv CO2 drop. At maximum the increase of CO2 since the LIA can be 13 ppmv, that is all per Henry’s law.
All the rest of the 120 ppmv increase is from human emissions and the difference between emissions and increase in the atmosphere is the net sink by nature.
Nature was a net sink for the last 60+ years… No matter how any individual natural flux changed over time…
What a delightful interview with Prof. Dyson, and what an amazing resource you’ve led me to, Nelson!
Look at this: 157 videos (avg about 3 minutes each), of interviews with the great Freeman Dyson!
https://www.youtube.com/playlist?list=PLVV0r6CmEsFzDA6mtmKQEgWfcIu49J4nN
Here’s #144, to which you linked:
https://www.youtube.com/watch?v=848X64FXGp0&list=PLVV0r6CmEsFzDA6mtmKQEgWfcIu49J4nN&index=144
Also here:
https://www.webofstories.com/play/freeman.dyson/144
And look at this: in addition to Prof. Dyson, they’ve also done the same thing with 103 other remarkable people!
Web of Stories – Life Stories of Remarkable People
104 playlists:
https://www.youtube.com/c/webofstories/playlists
Wow!
P.S. — w/r/t your question, “How have natural CO2 emissions changed over time?” the answer is that net natural emissions of CO2 are currently very negative, and they have become increasingly negative as the atmospheric CO2 concentration has risen. Here are some estimates from AR6:

Dave Burton: You have always been nearly first to dismiss Dr. Berry’s work, but you have a problem when you claim no model is needed with your inferior hypothesis that only uses fossil fuel burn records as a comparison to the growth in atmospheric CO2 over time.
This is especially true when a group of other physicists published here:
Skrable, Chabot, And French Limit Human CO2 Effect To 48 Ppm (edberry.com)
and using different computation methods arrived at the same conclusion Ed Berry did. Care to explain this? In spite of your rhetoric, you have not disproven Berry’s work, and I can’t find any obvious error in Chabot’s paper with others linked above.
We do not have to disprove BERRY”S WORK
He has to prove his own work.
That starts with a logical explanation of where all the CO2 emissions from burning fossil fuels went, if not into the atmosphere. And an alternative explanation of why atmospheric CO2 increased from approximately 280ppm to 420ppm, if not from fossil fuel emissions.
He can not answer those questions.
Therefore his “science” is nonsense.
And this demonstrates that you do not understand the scientific method. An offer of proof that demonstrates Berry is wrong is what is needed. So far, no offers. Just claims without adequate back-up that Berry is wrong. Others can replicate his hypothesis with a different but suitable method.
Berry’s work explains what you claim he needs to do with his model. It is obvious you never bothered to read the paper or try and understand it.
Science does not mean writing that contradicts perhaps 99.9% of climate scientist including the FALSE CLAIM THAT 5% OF THE EXISTING CO2 LEVEL IS FROM MANMADE CO2 EMISSIONS. That is pure nonsense. Nonsense that does not deserve respect. And the author deserves to be ridiculed. Because he is ridiculous.
Chuck wrote, “An offer of proof that demonstrates Berry is wrong is what is needed. So far, no offers.”
Chuck, I’ve already proved that Ed Berry is wrong. Read my long comments here.[1] [2]
Chuck wrote to Richard, “you do not understand the scientific method.”
The Scientific Method is an algorithm, which you can read about here:
https://sealevel.info/papers.html#whitherscience
Nothing that Ed wrote about in this article has anything at all to do with the Scientific Method.
Nice try, Dave, but you failed to address what I asked you to comment on which was the independent calculation by Chabot et al who arrived at the same numbers Berry did.
So if Ed’s work is wrong, where is the error in Chabot, et al.?
Answer the question instead of your usual deflections.
Dave Burton, I would also ad that for you to claim Berry’s work has “nothing to do with the scientific method” also demonstrates your very poor comprehension.
That statement I made had nothing to do with Berry’s work directly, it only addressed to Richard Greene that to follow the scientific method, one needs to prove Berry’s work is wrong, which you haven’t done, nor has anyone else to date.
Chuck wrote, “to follow the scientific method, one needs to prove Berry’s work is wrong”
I think you misunderstand what the Scientific Method is. It’s an algorithm, which is explained here.
(Also, as it happens, I’ve already proved that Ed Berry is wrong. Read my long comments here: [1] [2] )
Chuck wrote, “you failed to address what I asked you to comment on which was the independent calculation by Chabot et al”
That’s a strange complaint for you to make in reply to a comment which linked directly to the discussion that you apparently overlooked. Did you not bother to click the links before replying, Chuck?
The paper itself (published in a radiation safety journal called Health Physics) is paywalled, but there’s an abstract, and references to several (presumably critical) comments on it, on PubMed. With some difficulty I located a preprint; it’s the first link here:
https://sealevel.info/Skrable2022/
What you linked to and asked me to address was this Ed Berry web page, about the Skrable paper (which you’re now calling “Chabot et al”). I did so here. This is what I wrote:
Ferdinand explained it very clearly by analogy with Andorran euros. It’s a very elegant explanation, please study it.
Chuck, the basic error in Skrable e.a. is that they confuse the % remaining human CO2 molecules in the atmosphere with the origin of the increase in total mass of CO2.
The residence time is how much is CO2 is exchanged each year: about 25% is moving from ocean surface through atmosphere to vegetation in spring/summer and back in other seasons. That spreads the original fossil CO2 molecules over the three reservoirs. That also removes a little (2.5%) CO2 out of the atmosphere into vegetation and the oceans.
Do you see the difference: 25% is just moving in and out, 2.5% is effectively removed, while humans add 5%. 2.5% is what remains in the atmosphere, near fully caused by the human emissions.
As most CO2 is just moving in and out, there is one reservoir which makes a difference in the isotopic composition: the deep oceans. What goes in comes out some 1,000 years later, with that in mind, one can calculate the deep ocean-atmosphere CO2 exchange, as the deep ocean flux has a historical δ13C level of around -6.4 per mil and fossil fuels around -24 per mil.
That gives that the deep ocean-atmosphere exchange is around 40 PgC/year, independently confirmed by the 14C decay rate…
Chuck, believe it or not, the gist of the Berry / Harde / Salby confusion is their belief that adding CO2 to the atmosphere does not increase the amount of CO2 in the atmosphere.†
Read that again: that really is what they believe!
The reason it sounds ridiculous and contradictory is that it is ridiculous and contradictory.
(† Or they think that adding a quantity of CO2 to the atmosphere somehow increases the amount of CO2 in the atmosphere by much less than that quantity, which is equally impossible.)
Thanks to anthropogenic emissions of 14C-depleted “fossil carbon,” the atmospheric CO2 concentration has risen from about 280 ppmv (circa 1780) to nearly 420 ppmv CO2 now, a 50% increase. Those fellows think that if that’d really happened it would mean that “fossil” CO2 should now make up 1/3 of the CO2 in the atmosphere.
They’re wrong.
See if you can you figure out why fossil carbon makes up much less than 1/3 of the carbon in the atmosphere.
I haven’t read the Skrable paper, but based on Ed Berry’s web page about it, it seems that he & they think the fact that fossil carbon makes up much less than 1/3 of the carbon in the atmosphere means anthropogenic additions of CO2 didn’t cause the increase in the amount of CO2 in the atmosphere.
That’s remarkably silly, but that really is their argument, believe it or not. Ed Berry’s web page says:
Can you spot their error?
I won’t keep you wondering. The answer is that many of the processes which remove anthropogenic “fossil” CO2 from the air do so by exchanging it, one-for-one, with carbon from other reservoirs (like the ocean), which is not depleted in 14C. So the amount of 14C-depeleted “anthropogenic carbon” in the atmosphere declines much faster than does the effect of adding anthropogenic CO2 to the air. It happens because fossil carbon in the air is being swapped with non-fossil carbon in other reservoirs, like the ocean, and it has nothing to do with the fact adding CO2 to the atmosphere increases the amount of CO2 in the atmosphere by the amount added.
Dave, you write complete nonsense and to say that Berry, Salby, et al believe adding CO2 to the atmosphere does not increase the total amount is not only wrong, it is preposterously ridiculous. It shows that you do not understand Berry’s work or the physics contained within it.
Chuck, one can compare it to the following example:
In Europe we have euro’s from different countries. Each country has its own backsides, while the frontside is common.
Now, let us assume that we have a local bank in the neighborhood that receives and emits lots of euro coins per day.
In average the bank has lots of euro’s from different countries and after a while the mix is rather stable from the different countries, as well as the total amount of all deposits.
Now one day, a new client brings in his own euro’s only from a small country, Andorra, which are quite rare in Europe.
As the new client only adds more Andorran euro’s and never withdraws them, the total amount of euro’s at the bank increases, but the total amount of Andorra coins doesn’t increase as fast, because lots of them are exchanged with euro’s from other countries, without influencing the total amount…
At the same time, the bank sees that there is more money in their deposit and starts to exploit that by giving more loans to others. As they are careful, they don’t spend more than half the extra deposit as loans.
What Berry, Salby, Harde and many others say, is that the amount of Andorra coins is the maximum contribution of the new client to the total increase of money in the bank.
Which is obviously wrong, because the new client disposed twice as much as the increase, which has nothing to do with the “label” of the coins…
That is a very elegant analogy, Ferdinand. Nicely done!
Berry, Salby & Harde would presumably (but wrongly) say that the new client’s €180 deposit in Andorran euros could have, at most, accounted for €48 of the increase in the bank’s cash on hand, because an examination of the bank’s cash on hand shows that they are holding a total of only €48 in Andorran euros (as identified by their 12C:13C:14C Andorran isotopic signature backsides).
The publisher of Skrable, Chabot & French (2022) apparently has a policy of providing free access to articles and papers for eight weeks, but then paywalling them (except that often the first page of the article is still available online). So it took a bit of work to find a preprint of the paper, plus all five the “comments on” the paper which the journal has published. For the latter I contacted the authors of several of those responses, directly, and asked them to send me preprints.
I now have all of them (I think), and I’ve put them in a folder on my website, here:
https://sealevel.info/Skrable2022/
If I missed anything of consequence, please let me know.
The published responses to this regrettable paper are all critical of it. If anyone is inclined to take the paper seriously, I encourage you to read “both sides” before settling on your conclusions.
In fact, that’s a good policy, in general, for any controversial topic: listen to both sides, before settling on conclusions. To that end I have a collection of climate-related resources, here:
https://sealevel.info/learnmore.html
It has:
● accurate introductory climatology information
● in-depth science from BOTH skeptics & alarmists
● links to balanced debates between experts on BOTH sides
● information about climate impacts
● links to the best blogs on BOTH sides (starting with WUWT, of course)
Your comment is so much better than the original article,
that it should be posted as a new WUWT article, IMHO
As long as the Chinese and Indians keep building and using their coal plants, for whatever duration they will use them, it matters little what we in America or Europe do or debate about doing. Nothing American politicians do in terms of handing out money or whatever grand schemes they plot and plan means diddly in regard to temperature, either, as noted by the Wall Street Journal/Bjorn Lomborg last week. So I have little use for the article or the balance of the comments made here.
Not just China and India. By the end of the century more than 8 in 10 people alive will live in Asia and Africa and world population will be almost 11 billion.
The priority for Asia and Africa is to improve the lives of their peoples. The easiest way for them to do that is by using fossil fuels. They are not going to accept net zero by 2050 just because the West says they must.
Who is claiming 11B? We’ll be lucky to reach 10B. 0-15 age group hasn’t moved (ca. 2B) in 20 years.
That said, the “Christian Guilt” that IMHO drives the ongoing self flagellation in the west on the “climate change” issue is remarkably absent in Asia and Africa.
Luckily CO2++ leads to higher crop yields.
Who is claiming 11B? We’ll be lucky to reach 10B. 0-15 age group hasn’t moved (ca. 2B) in 20 years. China’s population has already started the long march downward.
All that said, the “Christian Guilt” that IMHO drives the ongoing self flagellation in the west on the “climate change” issue is remarkably absent in Asia and Africa.
Luckily CO2++ leads to higher crop yields.
This is what happens when kids these days are taught how to use a calculator – but not taught to perform a sanity check on their final number.
The total increase is 101 ppmv.
Mankind has increased it by 180 ppmv.
Nature has reduced it by 79 ppmv.
∴ Mankind increased it by 180 / 101 ≈ 180% of the total increase
(well, 178.2%, if you want to be picky)
(I had no need for a calculator.)
Dear Dave,
Your line: “Nature has reduced it by 79 ppmv.” is not based on data.
You have not done a valid calculation of the natural and human carbon cycles that proves your conclusion is wrong.
Ed
Dear Ed,
Simple subtraction, nothing else…
180 ppmv input by humans (based on sales, that means taxes…)
101 ppmv observed increase in the atmosphere.
Where does the difference go, if not in oceans and vegetation?
The oceans show an increase of DIC (dissolved inorganics):
https://tos.org/oceanography/assets/docs/27-1_bates.pdf
Table 2 and Figure 3
Vegetation shows a lot of growth according to NASA satellites:
https://www.nasa.gov/feature/goddard/2016/carbon-dioxide-fertilization-greening-earth
If both oceans and vegetation are net sinks for CO2, they can’t be the cause of the CO2 increase in the atmosphere, thus there is something fundamentally wrong in your interpretation of the carbon cycles.
The point is that you assume that the residence time of 4 years is also the speed with which the extra (human or other) CO2 as mass is removed, while the residence time only shows how much CO2 is moving through the atmosphere, not how much is REmoved…
Sorry, but you’re not measuring every source and sink of atmospheric CO2, so you *don’t* “have the measurements.”
You have a lot of assumptions and estimates and guesswork.
There are decent estimates of how much fossil fuels were burned which can be converted to CO2 emissions.
To do this arithmetic, you don’t need to measure “every source and sink of atmospheric CO2.” We’re only interested in the summed (net) natural fluxes.
For that you only need:
We have good quality numbers for both of them. (Not perfectly precise, of course, but very good by climatology standards.)
From just the difference between those two things you can calculate the summed (net) natural fluxes.
Of course there are some uncertainties in the anthropogenic fluxes, esp. w/r/t land use change effects, but that doesn’t change the logic.
AGW,
We do have two reasonable accurate amounts: human emissions (taxes!) and the increase in the atmosphere. Both with small error margins.
What nature as a whole has done is simply the difference between these two amounts. No need to know any individual natural flow in or out, or their behavior over the years, even if they increased or decreased or reversed…
but, but, we’re all gonna die (hair on fire hysterics)
We are though……
Eventually. Inevitably. Either Her or her Choice.
Blade Runner:
It’s too bad she won’t live, but then again who does?
who does? – clip
I am not clear why you bring up CO2 on a climate blog but since you have I offer the following comment.
Where has the extra CO2 come from if not from burning fossil fuel?
Ocean surface temperature has hardly changed in the last 50 years – up about 0.3C and has declined since 2016. The temperature trend has been quite consistent for the past century as best as can be gauged from the limited evidence.
Rick, the temperature trend hasn’t been consistent. It was negative for several decades, before shifting to positive in the late 70s.
Activist Scientists Have Now Officially Changed A -0.5°C Global Cooling Trend Into A Warming Trend (notrickszone.com)
Dear Rick,
My paper uses IPCC’s data for its natural carbon cycle to calculate the true “IPCC” human carbon cycle. This true human carbon cycle conflicts with IPCC’s claimed carbon cycle that merely ASSUMES human CO2 emissions caused all the CO2 increase.
This true human carbon cycle shows human carbon cannot cause all the increase because CO2 flows out of the atmosphere much too fast for human CO2 in the atmosphere to have caused all the increase. That is the calculation based on the best data we have.
It is now up to you and other scientists to determine the specific source(s) of the natural carbon that has added about 100 ppm to the atmosphere since 1750.
Suffice it to say, there is NO scientific basis to claim or believe that human CO2 emissions have caused all the CO2 increase above 280 ppm.
Ed
Ed, that sentence is the essence of what did go wrong:
“because CO2 flows out of the atmosphere much too fast for human CO2 in the atmosphere to have caused all the increase.”
CO2 doesn’t flow out of the atmosphere much too fast, it flows just back and forth: lots in spring/summer from oceans into vegetation, just passing by the atmosphere and reverse in fall/winter.
At the end of the year, there was zero net outflow in pre-industrial times.
Nowadays there is a small extra sink: 2.5% of all inputs extra into oceans and vegetation. That is less than what humans emit, therefore CO2 accumulates in the atmosphere.
The amount absorbed is directly proportional to the extra CO2 pressure in the atmosphere above equilibrium (currently around 295 ppmv) and that is completely independent from the natural carbon cycle, thus completely independent of the residence time…
Dear Ferdinand,
This comment is the same as the comment I made to answer another of your questions below. But it also applies to your comment above.
The net flow is merely the difference between inflow and outflow. There are studies in systems engineering dating back to the 1960’s about how to properly model a system of levels and flows, which is what we have in the carbon cycle.
These studies show it is best and simplest to always use the direct outflows from one reservoir to another reservoir. Levels set the outflows and the outflows set new levels.
That is exactly how my carbon cycle model works. There is no need to consider net flows in the model because the direct flows produce net flows, but net flows do not drive anything.
My carbon cycle model may be the only model that accurately replicates IPCC’s natural carbon cycle data. That is because I use proper systems engineering principles in my model.
I think many of those who do not understand my model or who claim it is wrong, simply to not understand systems engineering models.
Anyway, since my model replicates IPCC’s natural carbon cycle data, it is proper to use my model to calculate the human carbon cycle.
To calculate the human carbon cycle, we only need to begin with all reservoirs empty and insert the annual data for human CO2 emissions into the atmosphere reservoir.
The calculation uses the same e-times found in IPCC’s natural carbon cycle, and that is the only proper way to calculate the human carbon cycle.
Ed
If the IPCC really knew what was going on, by now they would be using only one climate simulation model but instead the number of models they have been using has grown to over 100. If they really understood the effect of CO2 on climate they would be quoting a single value for the climate sensitivity of CO2 but instead they publish a large range of guesses. They do not know what the optimum global climate actually is and they have no idea how to achieve it. According to their summary they are not sure of anything since they have to attach arbitrary measures of confidence to everything they say. The IPCC does not know what the optimum global climate actually is and they do not know how to achieve it..
The IPCC knows how to scare people
and demonize CO2
That’s what they do.
Oh dear. All those years and still the same wrong assumptions, misunderstandings and, the most important aspect, throwing the baby out in the bathwater. I haven’t waded through the huge number of comments but without a mention of Henry’s Law why should I?
HENRY’S LAW IS NEARLY IRRELEVANT FOR A ONE DEGREE CHANGE OF THE OCEAN TEMPERATURE IN A CENTURY.
Richard, the one degree change that you claim is irrelevant enlarged the size of the ocean with T>25.5C where CO2 outgassing occurs by almost 50%, and diminished the colder CO2 sinking area, where both effects have controlled the amount of CO2 left in the atmosphere from all sources.
From here [with my emphasis]:
No one here who believes as you do has an adequate explanation for why CO2 follows SST by 5 months with high significance using 12 month average change, see the upper left panel in the following image:
Note that the insignificant r=.28 using Boden etal MME vs ML CO2 is three times less than the significant r=.84 for ML CO2 vs SST. Why is that if MME are the only ‘driver’ of ML CO2 as so many here like to assert?
Why does ML CO2 follow SST by 5 months if not for CO2 outgassing/sinking according to Henry’s Law of Solubility?
I expect nothing but the usual rantings from the usual all-knowing parties here, who will again not explain why these relationships exist or matter.
Bob, we have been there before…
Even at the 50th anniversary of Mauna Loa CO2 measurements, Pieter Tans agreed that there is a direct relationship between temperature and CO2 levels:
https://gml.noaa.gov/co2conference/pdfs/tans.pdf
From slide 11 on.
What you forget is that such variations are short lived and have a small effect on CO2 levels: your own model shows 2.1 ppmv/K. Even sustained over thousands of year, that is not more than 16 ppmv/K. That is peanuts compared to the 120 ppmv increase, while the temperature since the LIA didn’t increase with more than 0.8 K…
Ferdinand you have once again misinterpreted what it means.
Bob wrote, “…why CO2 follows SST by 5 months with high significance using 12 month average change, see the upper left panel”
Your graph is basically of two ENSO indicators. During El Niños, average Pacific sea-surface temperatures spike, and atmospheric CO2 levels rise more quickly. During La Niñas, average Pacific sea-surface temperatures drop, and atmospheric CO2 levels rise more slowly. None of that is at all surprising.
Here’s annualized CO2 level at Mauna Loa:
https://sealevel.info/co2.html

Bob wrote, “Why does ML CO2 follow SST by 5 months if not for CO2 outgassing/sinking according to Henry’s Law of Solubility?”
In some places, at some times, the ocean outgasses CO2, but there’s no net outgassing. Every year, the oceans and terrestrial biosphere remove more CO2 from the air than they emit.
Even in El Niño years, nature is a net absorber of CO2, just more slowly than in La Niña years. That’s because the effect on CO2 fluxes of the temperature dependence of Henry’s Law is relatively small.
1°C of warming of the water reduces solubility of CO2 into the water by only about 3%. That is dwarfed by the effect of the 50% increase in atmospheric CO2 concentration, from anthropogenic additions of “fossil carbon” to the air:
The people who think that the ongoing rise in atmospheric CO2 concentration is due to ocean outgassing are wrong:
https://sealevel.info/atmospheric_co2_increase_is_not_from_ocean_outgassing.html
+100
“Nature” didn’t add the extra – why on Earth should it and what was.is the mechanism?
The extra CO2 came from deforestation (NOT esp the destruction of the actual trees) and from Soil Erosion
i.e The wholesale and MASSIVE removal of organic material from farm and forest soils primarily through the use of ploughs, paddy fields, Nitrogen fertiliser, drainage of wetlands/swamps and over the last 40 years, Glyphosate
And when the Soil Organic Matter evaporated, huge amounts of water were concurrently released, reducing the heat holding capacity of huuuuuge areas of ground
This causing elevated day/summer-time temps, reduced night/winter-time temps.
Also dust storms and flash floods and, around the outfalls/estuaries/deltas of the large rivers that drained those areas, local sea-level rise.
Sorry no, The Dancing Faeries are innocent of all charges.
Oh my God, not again!
I have had a long discussion with Ed Berry on his blog in one if the first drafts of this work to no avail…
It seems that very brilliant people like Berry, Harde, Salby,… don’t understand something that a housewife with a tight budget knows: if you spent more than your income, then you are in trouble…
Indeed humans add about 5% of all incoming CO2, 95% is natural.
But what Berry and many others forget, is that a balance has two sides: income and expenses.
Humans don’t remove any CO2 out of the atmosphere (as long as reforestation is not as large as clearing forests).
Nature removes 97.5% of the incoming CO2 out of the atmosphere, the remainder is 2.5% which (temporarily) stays in the atmosphere.
Thus for the total budget:
Change in the atmosphere = human ins + natural ins – human outs – natural outs.
2.5% = 5% + X – 0% – Y
Natural balance Y = X + 2.5%
Whatever the absolute value of X and Y (thus INdependent of the residence time!).
Result: (near) all CO2 increase of the past 170 years is from the human input and nature was a continuous sink, at least for the past 60+ years.
The residence time is about how much is moving through the atmosphere, not how much is REmoved out of the atmosphere.
The residence time doesn’t count for the direction of the fluxes, which are seasonal, temperature driven, thus bidirectional over a year with (near) zero effect on the total amount of CO2.
It is the extra amount of CO2 that humans added that increases the CO2 pressure in the atmosphere above the equilibrium (about 295 ppmv for current ocean surface temperatures). That pushes extra CO2 into oceans and vegetation, completely independent of the residence time.
The observed e-fold decay rate is around 50 years or a half life time of around 37 years.
Far away of both the residence time or the hundreds of years from the IPCC…
See further: http://www.ferdinand-engelbeen.be/klimaat/co2_origin.html
“Result: (near) all CO2 increase of the past 170 years is from the human input and nature was a continuous sink, at least for the past 60+ years.”
All, not “(near) all”
If nature is a net CO2 absorber, then it is not a net CO2 emitter
And for more than “the past 60+ years”
Richard, don’t be too absolute…
There is a small increase of CO2 of around 13 ppmv due to the 0.8 K increase of the average sea surface temperature since the LIA, per Henry’s law. Not much, but not zero either…
CO2 up from 280ppm to 420 ppm estimated
Up +140 ppm
CO2 emissions estimated to be significantly more
than +140ppm
Nature must have absorbed some of the manmade CO2 emissions, If nature is a net absorber of CO2 emissions, then nature can not be a net emitter of CO2 at the same time.
Any CO2 emissions from slightly warmer oceans is already included in the net effect of nature — which is a REDUCTION of atmospheric CO2.
You are treating the estimated +13ppm from oceans as something separate from the total effect of nature.
Volcanoes release some CO2 too.
BUT THE NET EFFECT OF NATURE IS STILL NEGATIVE.
Ferdinand,
I had an uncle (now long dead; a minister and a descendent from the first Puritan settlers in North America) who often said: “I see, said the blind man as he urinated into a strong wind.”
You can point out every nonsensical claim in this post (as you have dozens, if not hundreds of times in the past with other posts), but it will make no difference. You are urinating into a strong wind.
Dear Ferdinand,
Thank you for your comment.
My 2021 paper is a significant improvement over the discussions we had many years ago, and your comments helped me improve my paper.
However, my 2021 paper does the carbon budget correctly and rebuts your “budget” comment. Like others, you are commenting on your own strawman rather than commenting on my 2021 paper.
Simply read my paper because it shows my full rebuttal to your comment.
Regarding e-fold time, the proper time to use is IPCC’s turnover time, that I call e-time. My paper shows how 14C data prove the 14C e-time is 10.0 years. Hardy and Salby 2021 found the same result using a different method.
This result rebuts all your conclusions that you base on a longer e-time.
Ed
Dear Ed,
I was reacting on this article, which still contains the same fundamental errors as what we were discussing a few years ago…
Again, the turnover time is about how much CO2 passes the atmosphere in any direction, while the e-time is about the gain or loss of the atmospheric CO2 content. Two very different definitions, but I agree, even the IPCC uses both definitions confusingly.
I have written a rebuttal to Harde and Salby 2021 too, the strange point is that they accepted that there is a response of 14C from the oceans which influences the e-time, but didn’t take into account that there is a response of the oceans for 12C too…
The e-time for a bulk CO2 removal is measured and around 50 years to reduce an excess CO2 injection to 1/e of the original excess:
For a linear process the e-fold reduction time can be easily calculated:
e-time = tau = cause / effect
In 1959: 25 ppmv extra CO2 in the atmosphere, sink rate 0.5 ppmv/year, tau = 50 years, half life time 34.7 years
In 1988: 60 ppmv extra, 1.13 ppmv/year, tau = 53 years, half life time 36.8 years
In 2012: 110 ppmv / 2.15 ppmv/year, tau = 51.2 years or a half life time of 35.5 years.
Looks very linear to me, widely within the borders of accuracy of the emission inventories and natural sink capacity variability…
In graph form for the past 60+ years:
Dear Ed, I think that the essence of our dispute is already in the first part:
“Simple physics shows when outflow is proportional to the first power of level, natural and human carbon cycles are independent. So, we can calculate these carbon cycles independently and then add them up to get the total”
First, the net outflow doesn’t depend of the total level (pressure) in the atmosphere, it depends of the level (pressure) difference between CO2 in the atmosphere and the oceans (and in the alveoles of vegetation).
That is also one of the main errors that Harde and Salby made in their 2021 work.
When the CO2 levels in oceans and atmosphere are equal (~295 ppmv for the current ocean surface temperature) the net outflow is zero.
Secondly, while T = M / S, even the IPCC didn’t realize that this is only the case when all CO2 fluxes are unidirectional from input to output. Then:
T = mass / input = mass / throughput = mass / output when everything is in equilibrium.
That is absolutely not the case if an output half way the year suddenly becomes an input and reverse, which is the case for the bulk of all natural fluxes.
For the residence time as defined as T = mass / throughput, that doesn’t matter at all, as throughput is independent of the direction of the flows, but if you want to calculate the net balance via individual CO2 fluxes, you are in trouble, as the pre-industrial balance for each individual transfer was zero over a year.
Let’s have a look at the clearest example for the pre-industrial period:
In NH spring/summer, some 60 PgC is transferred from the atmosphere into NH vegetation. That flux is increasing while the CO2 level in the atmosphere is slightly decreasing… But anyway its contribution to the total outflow is about 23%
In fall/winter, against all odds, the same vegetation releases 60 PgC into the atmosphere, while the CO2 level there is slightly increasing. contribution to the total outflow: -23%, overall contribution after a year: 0%.
The same, but in opposite direction for the ocean surface: in that case 50 PgC released in spring/summer and absorbed in fall/winter. +/- 19% of the outflows, again zero over a year.
The difference of about 10 PgC between these two fluxes is what gives the +/- 5 ppmv over the seasons in the NH.
The SH has less land and more ocean, that gives less seasonal difference.
Anyway, it is simply impossible to deduce the behavior of human CO2, based on the residence time, because the residence time doesn’t reflect the speed of removal of any extra amount/pressure of CO2 out of the atmosphere, as the bulk of the natural CO2 fluxes are seasonal, temperature controlled, bidirectional and have very little connection with the total amount/pressure of CO2 in the atmosphere.
Dear Ferdinand,
Regarding your comment:
“First, the net outflow doesn’t depend on the total level (pressure) in the atmosphere, it depends on the level (pressure) difference between CO2 in the atmosphere and the oceans (and in the alveoles of vegetation).
“That is also one of the main errors that Harde and Salby made in their 2021 work.
“When the CO2 levels in oceans and atmosphere are equal (~295 ppmv for the current ocean surface temperature) the net outflow is zero.”
The net flow is merely the difference between inflow and outflow. There are studies in systems engineering dating back to the 1960’s about how to properly model a system of levels and flows, which is what we have in the carbon cycle.
These studies show it is best and simplest to always use the direct outflows from one reservoir to another reservoir. Levels set the outflows and the outflows set new levels.
That is exactly how my carbon cycle model works. There is no need to consider net flows in the model because the direct flows produce net flows, but net flows do not drive anything.
My carbon cycle model may be the only model that accurately replicates IPCC’s natural carbon cycle data. That is because I use proper systems engineering principles in my model.
I think many of those who do not understand my model or who claim it is wrong, simply to not understand systems engineering models.
Anyway, since my model replicates IPCC’s natural carbon cycle data, it is proper to use my model to calculate the human carbon cycle.
To calculate the human carbon cycle, we only need to begin with all reservoirs empty and insert the annual data for human CO2 emissions into the atmosphere reservoir.
The calculation uses the same e-times found in IPCC’s natural carbon cycle, and that is the only proper way to calculate the human carbon cycle.
Ed
Dear Ed,
I have searched the Internet for something similar to the natural fluxes in terms of engineering workout. I have not found one.
Almost all engineering books and examples are based on one (or more) inputs, one container (river, lake,…) and one (or more) outputs.
All flows are deemed unidirectional from input(s) via the container to the output(s).
In such a case, the output is directly proportional to the static height (or pressure) in the container.
In the case of the atmosphere, the bulk of the fluxes are bidirectional and the outputs are not proportional to the height/pressure in the container, as the spring vegetation shows. The fluxes even revert halfway the year and inputs get outputs and reverse. Thus an outflow is halve a year “positive” and half a year “negative” for about the same CO2 pressure in the atmosphere.
I really haven’t seen such a system worked out in any engineering textbook.
Something that may approach that is a pump storage, that uses electricity to pump water up from a lower to a higher lake and revert that to produce electricity on other hours/days.
In nature we have even opposite fluxes: while one pump stores water in an upper lake, another upper lake drops water via generators in the same lower lake… The net effect being near zero change in the lower lake…
Then someone starts to add some water in the lower lake…
How can you calculate what will happen with the height of the water in the lower lake from that extra water, based on the known fluxes between the lakes? That is simply impossible…
The natural fluxes are quite independent of the total amount of CO2 already in the atmosphere, because the underlying processes are mainly temperature dependent, hardly pressure dependent.
Thus if you use the residence time (which is independent of the direction of the fluxes), you use the wrong parameter, as that says nothing about the pressure dependent outflow for an excess amount CO2 above equilibrium…
I was going to suggest that you are wasting your time refuting this but many people buy into this and need a scientific rebuttal.
Dear Greg,
Will Happer checked my carbon cycle equations and calculations in February and March 2020, well before I finished my December 2021 paper.
He used a different method to numerically calculate the results of my equations. I did my calculations numerically in annual time steps using Excel.
His results matched my results to the second decimal place. So, it is unlikely that the CO2 coalition will disagree with my numerical calculations.
Ed
Dear Ed,
Will Happer may have found no error in your calculations (I didn’t find either), but the problem is that your calculation uses the residence time, which has not the slightest influence on the total amount of CO2 in the atmosphere…
The following may show a similarity to what happens with CO2 in the atmosphere:
It is like having a fountain, where a huge pump presses 1000 liter (1 m3) water per minute from the basin below the fountain over the fountain, that drops again into the basin.
For a 5 m3 basin, filled to the overflow, the residence time in the basin then is 5 m3 / 1 m3/minute = 5 minutes, where input = throughput = output.
Then the maintenance engineer opens a supply valve to refresh the water in the basin with 10 liter (0.1 m3) per minute. The extra water starts to increase the total amount of water, thus the height of the water in the basin.
Because the basin is already filled to the overflow, that starts to remove water in ratio to the height of the level above the overflow (not from the bottom!), until the amount of water removed is equal to the amount supplied.
Does the extra supply change the residence time?
Hardly:
5 m3 / (1 + 0.1) m3/minute = 4.5 minutes. When inputs = throughput = outputs.
Does the residence time influence the output over the overflow?
Not at all: the residence time has nothing to do with the extra input, the extra height in the basin or the output over the overflow.
Even if you double the capacity of the pump and the residence time about halves accordingly:
5 m3 / (2 + 0.1) m3/minute = 2.4 minutes.
That has zero influence on the height of water in the basin or the output via the overflow. The only influence is from the extra water supply.
100% of the increase in the water level of the basin is caused by the small extra supply of 0.1 m3/minute. The residence time has no influence at all on the removal of the extra supply…
Greenhouse gas theory is self refuting. Here is why.
Water vapor is the #1 Greenhouse gas. It does 3/4s of the heating according to GHG theory.
If you can believe the theory.
If the theory is correct water vapor alone will destroy the planet.
In the original discussion they slid by the thought that 1 molecule of water vapor would cause the evaporation of 3 more. It was a con from the get go.
I’m surprised no one involved remembers that. I do. The con was that water vapor is not persistent, it condenses. But integration is integration. You can integrate fluctuations.
I do not believe the codes ‘proving’ the theory have ever been released.
That is not science.
The oceans are out gassing CO2 due to reduced gas solubility in warmer water as they warm up from the LIA.
Yes, but that is only 12-16 ppmv for the 0.8 K warming of the ocean surface since the LIA, not 120 ppmv (which is caused by near 300 ppmv human emissions)…
This post is a repeat of many earlier similar posts claiming rising CO2 isn’t caused by human emissions. Every substantive claim made has been made multiple times in the past. Every substantive claim has been shown to be factually wrong multiple times in the past. This post, and the many like it that have appeared on WUWT is so plainly wrong that it only provides ammunition for green extremists to discount legitimate arguments (like those advanced by people like Bjorn Lonborg, Michael Shellenberger, and many others) against draconian reductions in CO2 emissions that will be both enormously costly, yield little benefit, and cause great human suffering. Yes, human activity is causing atmospheric CO2 to rise. But crash programs to drastically cut those emissions are not wise, but actually foolish and destructive, and especially destructive for the poorest of humanity.
I beg Anthony to stop posting this kind of nonsense, because it only distracts from efforts to adopt sensible public policies, and makes adoption of bad public policies only more likely.
Dear Steve,
You have not shown any part of my 2021 paper is in error. You only speak in generalities. That is not how science works. Until someone can show there is a significant error in my 2021 paper, my paper stands, and it prove your view is unsubstantiated and wrong.
Your desire to stop the publication of works like mine is anti-science. You do not understand and clearly have not read my 2021 paper.
Ed
The issue is that there is nothing at all new in your post. While a few people like Ferdinand are willing to go through it all again, I am not. Look back over the past dozen years at WUWT and see how many times the same mistaken arguments have been presented and refuted. Many times. As to how science works: I have been doing science (and engineering) for 50 years, and I am familiar with how “it works”. One key for science to work is for people to know enough physics and chemistry (not to mention simple logic) to understand when an argument is rubbish. Absent that, discussion of nonsense is just a waste of time.
I refer you to my earlier comment to Ferdinand about blind men and strong winds. Some things are not worth the effort.
I do very much wish Anthony would stop wasting people’s time with repetitive, nonsensical posts about why atmospheric CO2 is rising.
Yes, agreed, the important thing is not arguing about the finer points of CO2 residence etc The issue to focus on is policy.
Whether or not there is a climate emergency, the current policy proposals in the West are impossible to achieve, and will have no effect on the climate even were they to be implemented.
China, India etc are not paying any attention. As COP26 showed. 20-30 years of attempts to persuade everyone that there is a crisis have failed. Whether people like it or not, there is not going to be any meaningful global program to reduce emissions.
Its time for activists to accept that emissions are going to reach 45 billion tons a year by about 2040. There is no way to stop that, so they need to plan for that world rather than keep on with futile efforts to stop it happening.
Its time for skeptics to focus on the idiocy of the current proposals. That’s an argument there is every chance of winning. Even the Guardian has now been persuaded that burning US wood pellets in Drax makes no sense, climate emergency and global heating regardless. The current massive investment in wind also makes no sense, regardless. These are arguments that can be won and which will make a huge difference when won.
CAGW as a belief system will fade slowly over the coming decades. Its immune to rational argument, it has to run its course like other social hysterias. But the fight over energy proposals is happening now, is subject to rational argument, and is where the focus must be placed.
This is a quite appealing theory, but also, I believe to be quite wrong. The rise of atmospheric CO2 levels is easily explained by increasing man-made emissions. I have not spoken with all of the 110 members of the CO2 Coalition about this subject, but all of those who I have communicated with agree with me, including names held in very high regard.
The CO2 Coalition has not published on this matter as yet, as we don’t want to get into a public squabble or internecine warfare between allies. The leadership and many of our top scientists disagree strongly with the science and conclusions presented here. We have attempted to have meaningful scientific discussions over the last several months on this matter. Below are some comments from a couple of our top scientists (who are respected and well-known) who may weigh in on their own, but will remain nameless here:
“A simple CO2 budget model using anthropogenic emissions does an excellent job of explaining the Mauna Loa CO2 variations during 1959-2021.”
AND
“Ed’s analysis is, in my opinion, quite wrong. He continues to confuse:
1) the fraction of the atmospheric CO2 molecules which actually originated from fossil fuel burning (which, as he correctly says, is very small, because they are continually recycled and so ‘diluted’ with the huge amount of ‘natural’ CO2 molecules), with
2)the excess CO2 in the atmosphere due to the human input.
THE TUB OF WATER ANALOGY:
An example I use is a giant tub of water with large inflows and outflows which are equal (this is analogous to the natural state of flows of CO2 through the atmosphere). The water level in the tub will remain the same.
Then, add a small, additional ‘anthropogenic’ inflow. The water level will slowly rise over time, but most of the actual ‘anthropogenic’ water molecules that were added will have gone down the drain, due to the large rate of replacement of the water in the tub.
Nevertheless, the rise in the water level is entirely due to the additional anthropogenic inflow.”
AND
“Absolutely yes. Berry purposefully confuses stocks with flows. The only way “natural CO2″ in the atmosphere could increase over a short time period is if global biomass decreased by an equal amount. Human CO2 emissions are a 100% new addition whereas natural CO2 is in a cycle in and out. Unlike living photosynthetic species, fossil fuel combustion does not have a countervailing absorption of CO2 like plants do when they grow.
Of course over longer time periods such as the glaciation cycles in the Pleistocene, oceanic CO2 is cyclically outgassed and absorbed by the oceans, thus resulting in greater or lesser amounts in the atmosphere. It’s pretty simple once you make a clear delineation between stocks and flows. I compare it to a balance sheet versus a cash flow statement in finance.”
Dear Greg,
Thank you for finally offering some of your reasons you oppose my 2021 paper.
In summary, all of your reasons to disregard my 2021 paper fail and nowhere have you shown there is any significant error in my 2021 paper.
You claim
“The rise of atmospheric CO2 levels is easily explained by increasing man-made emissions.”
You have provided no such argument and I challenge you to do so.
Your argument contradicts Aristotle.
You assume votes determine science truth.
You assume the CO2 Coalition, like God, has the right to authorize and reject scientific papers that favor the group’s biased opinions. That is groupthink and groupthink is a major problem in climate science.
I am fully open to any science argument that attempts to find an error in my paper.
But you refuse to do that. Instead, you dance around making claims in thin air that have no scientific meaning.
None of your “top scientists”” have shown there is any significant error in my paper, so you have no scientific right to say my paper is not valid.
You claim,
“A simple CO2 budget model using anthropogenic emissions does an excellent job of explaining the Mauna Loa CO2 variations during 1959-2021.”
No, it does not.
And you have not described your “simple CO2 budget model” so we cannot discuss it. But if you had described it, I would show you why your model is wrong.
You claim,
“Ed’s analysis is, in my opinion, quite wrong. He continues to confuse:
1) the fraction of the atmospheric CO2 molecules which actually originated from fossil fuel burning (which, as he correctly says, is very small, because they are continually recycled and so ‘diluted’ with the huge amount of ‘natural’ CO2 molecules), with
2)the excess CO2 in the atmosphere due to the human input.
Balderdash.
My 2021 paper makes no such confusion and you have not even tried to identify such a confusion in my paper. Your handwaving arguments produce no evidence to support your claims.
The confusion is on your end, not mine. You and your opinion producers simply do not understand my paper. If you understood it, you would refer to details so we could discuss it.
And finally,
Your “tub of water analogy” so far off of physics that it should embarrass you and your colleagues. Your analogy is pure junk and does not belong in a scientific discussion.
READ MY PAPER. It presents the physics of a correct “tub of water” analogy.
Attack my paper if you wish. But stop attacking your inaccurate strawman representations of my paper.
Ed
As you are aware we have attempted to have as reasoned discussion on this and have provided our identification of errors in your argument. I am not appealing to a consensus argument here, just noting that many of our most respected colleagues disagree strongly with your analysis. This can harm our movement.
Dear Greg.
I respectfully submit that neither you nor your CO2 Coalition have “attempted to have a reasoned discussion” of my 2021 paper.
My last “discussion” with your CO2 Coalition was in February 2021 and ended with PM telling me: “Please take a hike Ed. I am beyond tired of your gobbledegook.”
I also respectfully submit that your “most respected colleagues” who disagree with my paper are wrong.
You have not identified any errors in my argument as you claim, or you would have presented them here.
So, where is the error “your most respected colleagues” find in my paper?
If you want to help your “movement” then ask your “most respected colleagues” to discuss my 2021 paper as scientists should discuss scientific papers.
You can have your discussion either here or on my website.
Sincerely,
Ed
Greg wrote, “I have not spoken with all of the 110 members of the CO2 Coalition about this subject, but all of those who I have communicated with agree with me, including names held in very high regard.”
and he also wrote, “The rise of atmospheric CO2 levels is easily explained by increasing man-made emissions.”
Ed replied, “You have provided no such argument and I challenge you to do so.”
Ed, I am a CO2 Coalition member, and I have done so. I do not speak for anyone except myself, but I am confident that at least 90% of the other CO2 Coalition members would agree what what I (and Ferdinand, Richard, and others), have explained.
We have sufficiently precise data (I’m using 2021 numbers) from which we know, beyond serious dispute, that since 1958.
● Mankind has added about 1440 Gt (180 ppmv) of CO2 to the atmosphere. We know that, because we know, quite closely, how much coal, oil & natural gas has been burned, and how much concrete has been manufactured, and how much CO2 those processes produce.[1a,1b] [2] [3]
● The amount of CO2 in the atmosphere has increased by only about 808 Gt (101 ppmv). That’s from precise measurements taken at Mauna Loa since 1958 (and also confirmed for more recent years with precise measurements taken in other places).
The difference is (1440 – 808) = 632 Gt = 79 ppmv CO2. That’s the net sum of all the non-anthropogenic CO2 fluxes, in both directions: a net removal of 79 ppmv of CO2 from the atmosphere. (“Non-anthropogenic” is what we call “nature.”)
Mankind added 180 ppmv of CO2 to the atmosphere. But the measured increase is only 101 ppmv. So nature removed (180 – 101) = 79 ppmv.
∴ Nature has reduced (not increased!) the amount of CO2 in the atmosphere by a net sum of 79 ppmv since 1958. That means claims that nature is responsible for any part of the increase in atmospheric CO2 concentration since 1958 are wrong.
Q#1: That’s the answer to the question, “What has caused the 101 ppmv measured increase in the amount of CO2 in the atmosphere since 1958?”
A#1: The short answer is: It was caused entirely by human CO2 emissions.
Q#2: A related question is, “What would the CO2 concentration be if there were “net zero” anthropogenic CO2 emissions for hundreds of years?”
A#2: The answer is that the atmospheric CO2 level would settle asymptotically toward about 295 ppmv (until the start of the next reglaciation, at which time the CO2 level would go even lower, eventually bottoming out near 200 ppmv, with the Laurentide Ice Sheet covering Boston and Stockholm).
Q#3: Another related question is, “How much atmospheric CO2 increase would there have been, relative to a 280 ppmv baseline in 1780, from the amount of warming we’ve had since then, if humans had added no anthropogenic CO2 to the atmosphere, but the same amount of warming had occurred for different reasons?”
A#3: The answer is roughly 9-13 ppmv (that’s 1.2°C × (+9 ppmv per 1°C of warming)), taking the level to about 290 ppmv.
Q#4: A final related question, and the only one on this list for which the CO2 “adjustment time” matters, is: If mankind’s CO2 emissions were to suddenly cease, how long would it take for the atmospheric CO2 concentration to fall to about 340 ppmv? (I.e., a 63% decrease from 417 ppmv toward 295 ppmv.)
A#4: The answer is about 50 years.
Correction: of course I meant to say that the Laurentide will cover Boston, and the Fennoscandian will cover Stockholm.
Dear Dave.
Thank you for your comment because you show the CO2 Coalition’s argument that human CO2 caused all the CO2 increase.
Therefore, I can now prove this CO2 Coalition argument is wrong.
To recall, I wrote:
1. The rise of atmospheric CO2 levels is NOT easily explained by increasing man-made emissions and the CO2 Coalition has not shown any such argument in a debatable form.
You replied, “The rise of atmospheric CO2 levels is easily explained by increasing man-made emissions.”
For this discussion, I agree with your numbers even though my paper used 2019 data and you used 2021 data. Also, you count from 1958 and I count from 1750.
Any minor differences in the data are not relevant to this discussion.
You argue as follows:
• total human carbon emissions were 180 ppmv since 1958.
• atmospheric CO2 has increased by 101 ppmv since 1958.
• The difference between human CO2 emissions and the CO2 increase is 79 ppmv.
We agree so far but then you say,
“So, nature removed (180 – 101) = 79 ppmv”
That is not a logical consequence of your three bullets. Nor is it a logical consequence of physics.
Your conclusion is based on your invalid assumption that human CO2 caused all the increase in atmospheric CO2, and the equivalent invalid assumption that the level of natural CO2 remained constant.
Otherwise, there is no logical reason to subtract 101 from 180.
You assume IPCC’s theory (1) is true and you use that assumption to “prove” IPCC’s theory (1) is true, which is circular reasoning.
All your other comments are irrelevant because they are all based on your false assumption and invalid physics.
The bottom line is you cannot prove IPCC’s theory (1) is true using your data.
However, if we use IPCC’s data for its natural carbon cycle, as Berry (2021) has done, then it is easy to prove your assumption is false.
As Richard Courtney quickly saw, Berry (2021) is a significant breakthrough in climate physics. That is why only those who truly understand physics understand Berry (2021).
Thank you for providing the CO2 Coalition’s argument for how human CO2 caused all the CO2 increase, so I could prove their argument is wrong.
Thank you also for estimating that at least 90% of the CO2 Coalition members agree with you. This means at least 90% of the CO2 Coalition members are not competent in physics. So, you are not alone.
It is time for the CO2 Coalition to put on their thinking caps and seriously read Berry (2021).
Thank you for your challenge,
Ed
I will post a summary of this debate here: https://edberry.com/blog/climate/climate-physics/the-co2-coalition-is-wrong-because-its-physics-is-wrong/
• total human carbon emissions were 180 ppmv since 1958.
• atmospheric CO2 has increased by 101 ppmv since 1958.
• The difference between human CO2 emissions and the CO2 increase is 79 ppmv.
So, nature removed (180 – 101) = 79 ppmv
To which Ed replied:
“That is not a logical consequence of your three bullets. Nor is it a logical consequence of physics.”
Of course it is. It’s not “physics,” it’s just subtraction.
Ed wrote, “Your conclusion is based on your invalid assumption that human CO2 caused all the increase in atmospheric CO2″
It is not “assumed” that mankind added 1440 Gt of CO2 to the atmosphere, it is calculated by summing the emissions from the various fossil fuels we’ve used, and the manufacture of concrete. The bean-counters (and the tax collectors) keep pretty good track of such things.
Ed wrote, “…and the equivalent invalid assumption that the level of natural CO2 remained constant.”
There are no assumptions about “natural” or unnatural CO2. None of the processes through which nature removes CO2 from the atmosphere care about how natural or unnatural it is.
Ed wrote, “Otherwise, there is no logical reason to subtract 101 from 180.”
Of course there is. 180 ppmv (1440 Gt) is the amount of CO2 mankind put into the air.
But the total amount of CO2 in the air increased by only 101 ppmv (808 Gt).
So something else removed the difference: 79 ppmv (632 Gt).
Ed wrote, “You assume IPCC’s theory (1) is true and you use that assumption to “prove” IPCC’s theory (1) is true, which is circular reasoning.”
It’s not a theory, it’s just arithmetic:
That reasoning does not require any “theory” concerning natural vs unnatural currency fluxes. It’s just arithmetic: YOU increased the the amount by $180, but someone else reduced it by ($180-$101)=$79.
Ed Berry wrote, “Berry (2021) is a significant breakthrough in climate physics. That is why only those who truly understand physics understand Berry (2021).”
Sorry, Ed, “breakthrough” is not the word I would use.
Who says the sinks don’t grow as CO2 goes up? Certainly the planet is greening. Doesn’t that represent an increase in sinks? Where does the IPCC and the climate models take that into account? Where does the greening and the CO2 growth meet? No where?
Indeed the sinks grow in ratio to the extra CO2 in the atmosphere. But as human emissions are increasing every year, the sinks still can’t remove as much as emitted. Currently around half of the emissions:
That’s the definition of a lag, not a rebuttal of cause.
Tim, everybody, including the IPCC agrees that part of the emissions (as mass) is absorbed in vegetation and oceans. That is even measured in the ocean surface and measured via the oxygen balance.
The overall uptake is directly proportional to the extra CO2 in the atmosphere, that is all.
You can call that a lag but it is a direct, linear process, independent of the yearly emissions and only dependent of the extra CO2 in the atmosphere (whatever its source).
Dear Greg,
As my December 2021 paper explains using IPCC’s own data, natural CO2 emissions have increased since 1750 and are the dominant cause of the CO2 increase.
The calculation is simple and a proper use of IPCC’s data for its natural carbon cycle, which is the best data we have today for the natural carbon cycle.
Also, “sinks” is not the best way to think about how carbon flows through the carbon cycle. The better way is to use outflow equals level divided by e-time, as the IPCC correctly suggests.
Ed
Dear Ed,
The fundamental error is that you use the wrong e-time:
The residence time shows how much CO2 is circulating through the atmosphere. Some 4 years residence time.
The real, observed, e-time is about 50 years.
The theoretical IPCC e-time (Bern model) is hundreds of years.
The IPCC uses the definitions of residence time and e-time in a confusing way, and for the e-time they use the Bern (and similar) models, which are equally wrong as using the residence time…
Dear Ed,
The IPCC suggests much wrong things, but as far as I know, they never suggested that outflow equals level divided by e-time…
Instead, they use the equally wrong Bern model which implies very long e-times…
What they agree with is that there is a very fast residence time: there is a huge bidirectional throughput of CO2 through the atmosphere, which gives a short residence time with the common formula:
RT = mass / throughput
No matter the direction of the throughput. But that has nothing to do with the real e-time for the removal of some extra CO2 mass above the equilibrium between oceans and atmosphere for the current average ocean surface temperature.
You may revert the above formula to obtain the sum of outputs IF AND ONLY IF all fluxes are unidirectional from inputs to outputs, but never, ever, if the fluxes are bidirectional!
Dr. Ed,
Another point:
In point 5. Figure 3. You show the Co2 levels in the atmosphere above 280 ppmv, but that is already 50 PgC (25 ppmv) in 1940. That is at odds with the ice core and emission data which show that the accumulated human emissions are near twice as high as the increase in the atmosphere already since 1900.
What is your source of that graph?
Dear Ferdinand,
The solid bold line in my Figure 3 above shows the measured atmospheric carbon level above 594 PgC (280 ppmv) using Etheridge et al. (1996) for Antarctic ice and firn data before 1960 and Keeling et al. (2001) for measured data thereafter.
Etheridge, D.M., Steele, L.P., Langenfelds, R.L., Francey, R.J., Barnola, J.-M., and Morgan, V.I. 1996: Natural and anthropogenic changes in atmospheric CO2 over the last 1000 years from air in Antarctic ice and firn. Journal of Geophysical Research. 101:4115-4128. https://www1.ncdc.noaa.gov/pub/data/paleo/icecore/antarctica/law/law_CO2.txt
Keeling, C.D., Piper, S.C., Bacastow, R.B., Wahlen, M., Whorf, T.P., Heimann, M., and Meijer, H.A. 2001: Exchanges of atmospheric CO2 and 13CO2 with the terrestrial biosphere and oceans from 1978 to 2000. I. Global aspects, SIO Reference Series, No. 01-06, Scripps Institution of Oceanography, San Diego. 88 pages. https://scrippsCO2.ucsd.edu/data/atmospheric_CO2/primary_mlo_CO2_record.html
Ed
Dear Ed,
Agreed, but it is the source of the emission data I am interested in: the figures I have are from the US Department of Energy (DOE) and show already twice the increase in the atmosphere from 1900 on if integrated from 1750 on (only fossil fuel use and cement manufacturing, without land use changes)…
Dear Ferdinand,
Please explain what you mean by “if integrated.” What precisely are you integrating?
Thanks,
Ed
The yearly human emissions from 1750 on, that is the total amount emitted by humans from the start of the industrial revolution…
Historical “carbon budget” information, about sources, sinks & fluxes of CO2 since 1750 can be found in this spreadsheet (or as .xlsx), and newer data is available from the Integrated Carbon Observation System (ICOS), and from ourworldindata (search the downloaded data file for “world”).
Ja. Ja. I told you.
If the oceans get warmer, more CO2 gets into the atmophere. That is Henry’s Law.
Even if as much as 33 ppm was added to the atmosphere by man it does not cause any heating, because the cooling effect due to the 4.3 um absorption is as much as the warming effect due to trapping of heat at the 14 to 15 um absorption.
I explained it all. It is back to the drawing board finding the missing heat. Click on my name.
Mind you. I read in my old books that per km down, T rises by ca. 3K. So you only need a shift of a few hundred meters of the inside of earth to get a rise in T of 0.6K. Global.
https://breadonthewater.co.za/2022/03/08/who-or-what-turned-up-the-heat/
HenryP,
Doesn’t apply to the oceans, these get… colder with depth, with little difference once under a certain depth…
Further, there is a formula that will show you the equilibrium CO2 level with the atmosphere for different temperatures, proven in over 3 million seawater samples…
https://www.sciencedirect.com/science/article/abs/pii/S0967064502000036
“The pCO2 in surface ocean waters doubles for every 16°C temperature increase (∂ln pCO2/∂T=0.0423°C−1, Takahashi et al., 1993).”
Or easier to go from one temperature to another:
(pCO2)sw @ur momisugly Tin situ = (pCO2)sw @ur momisugly Teq x EXP[0.0423 x (Tin-situ – Teq)]
formula used to compensate for the temperature difference between the ship’s inlet and the automatic measuring equipment…
Tin situ is at the ships inlet, Teq at the equilibrator.
If you use that formula, the difference for 1 K increase in temperature is about 12-16 ppmv for current sea surface temperatures.
Ferdinand
We did discuss this before, at length. You cannot calculate that which nobody can or has measured, i.e. the decrease in the sinc areas, in the arctic, due to the increase of heat,
see Table
https://breadonthewater.co.za/2022/08/02/global-warming-how-and-where/
We also must consider the waste water of 7 billion people and even more animals and all the factories. Generally speaking this waste water is slightly acidic. I also told you this before? so, now,
H3O+ + HCO3- = CO2 + H2O
The oceans handle the waste water from all people by putting more CO2 in the atmosphere.
You cannot argue simple basic chemistry with your nonsense stories.
any quantification of that CO2 release?
Are you suggesting that I know how much acid is going down the drain worldwide?
But I do have a strong suspicion that the factories in the east are not bothered too much by our specifications in the west of keeping th pH of the wastewater above 6.
Mind you. Even getting factories here in ZA keeping to the norms has been a challenge to me throughout most of my professional life.
I don’t need to calculate anything, because the observed net sinks (simple subtraction from two knowns) in the oceans and vegetation together still increased in capacity, in direct ratio with the increase in the atmosphere above equilibrium.
Only temporarily influenced by volcanic eruptions, ENSO,..
Ferdinand
We discussed this before. The 6 stations where you have your data from are not nearby the arctic or Antarctica.
So the results you have on offer are not relevant to the discussion here, namely the decrease of the sink areas in the arctic.
I am a chemist. Maybe you can gave me an idea of what you studied which made you sure of forcing the whole world in the wrong direction?
Henry,
No need to know the details, as we have the overall sink rate, which until recently was directly proportional to the extra CO2 pressure in the atmosphere…
No matter where that happened: both the oceans and biosphere do absorb CO2.
The partition between the two can be calculated by looking at the oxygen balance: uptake by vegetation produces oxygen, by the oceans doesn’t.
https://tildesites.bowdoin.edu/~mbattle/papers_posters_and_talks/BenderGBC2005.pdf
Fig.7 last page…
Already from 20 years ago, but even if the partitioning changed, the overall uptake still is proportional to the extra pressure.
There are (more sporadic) data from near the poles too, and these show for the N.E. Atlantic the lowest ocean CO2 pressure: around 150 μatm, far below the average of 415 ppmv in the atmosphere:
https://www.pmel.noaa.gov/pubs/outstand/feel2331/mean.shtml
It is that difference in CO2 pressure which drives CO2 from the atmosphere into the deep oceans.
For a temperature increase of the oceans, the equilibrium pCO2(aq) increases with maximum 16 μatm/K, thus maximum 32 μatm for a 2 K rise in sea surface temperature.
That means that the pCO2 difference goes from:
415 – 150 = 265 μatm
to
415 – 182 = 233 μatm
or a drop of 14% in uptake by the deep oceans.
Not a big deal: with 2.5 μatm (~ppmv) increase per year in the atmosphere, the same pressure difference is reached again in about 13 years…
“If the oceans get warmer, more CO2 gets into the atmophere. That is Henry’s Law.”
A common error. Henry’s Law just says there is a partition coefficient. Not how it depends on temperature.
Obviously it is also the chemistry which is simply that both more warmth and lower pH cause more CO2 in the atmosphere.
Around the equator
HCO3- + heat = CO2 + OH-
Ca. 100 billion tons annually.
Around the poles same amount must dissolve
CO2 + cold + 2H2O = H3O+ + HCO3-
Problem is the sinc areas in the arctic are getting smaller. See my comment to Ulrich below.
Lower ocean pH is the result of more dissolved CO2 so you appear to have it backwards. See the Bjerrum plot for example:
600px-Carbonate_system_of_seawater.svg.png
images
Now do the same plot with seawater of zero degrees C.
Makes hardly a difference: there is only a small shift in pH between the poles at below 0°C and at 25°C near the equator:
https://www.nature.com/articles/s41598-019-55039-4
See the chapter about
“Two cancelling effects of SST on pH”
The temperature dependence of Henry’s Law is known to be about 3% per 1°C.
The effect on ocean ⇄ air CO2 fluxes is small compared to the effect of the 50% increase in atmospheric CO2 partial pressure.
Weaker solar wind states since 1995 have driven a warm AMO phase (via negative NAO/AO) and the warmer North Atlantic reduces its CO2 uptake. It’s a negative feedback, and we are helping it.
The problem is that most of the extra heat seems to be coming from the north, traveling south ….
Look at the table
https://breadonthewater.co.za/2022/08/02/global-warming-how-and-where/
But yes. There is reduced uptake of CO2 due to the increase of heat in the northern seas which in its turn reduce the sinc areas.
But there is also an increase in sea area due to ice melt (seaice area ~30% down from the 1980s average)
“Solar wind?” Huh?
What does solar wind have to do with the AMO?
Allow me, an ignorant peasant who failed his 11+, try to summarise what I have learnt from the interesting and lively debate in these comments.
1. Over the last 11,000 years there have been many large temperature swings. Probably, but we cannot prove, CO2 has nothing to do with these because, we are told, the CO2 levels in the atmosphere have remained fairly constant. What “mechanisms” caused these swings we can only guess at: planetary wobbles, ozone depletion, solar variation, aliens. These “mechanisms” may or may not have gone away. We will not know until it happens again, and we recognise it when it does. These days if you are not looking for CO2 you will not get research funding. The science is not settled.
2. We now have a new kid on the block: CO2. The level in the atmosphere has been rising over the last two centuries. Hotly disputed in these comments are:
a. Where does it come from: Nature and/or Humans. What’s the mix. Some say 100% human, others say 5% human.
b. How long does it hang around: 5 years, 50 years, 5000 years? Some really clever people try to distinguish between human CO2 and natural CO2.
c. Where does it go to: The oceans, plants, outer space?
d. The science is way from being settled.
3. Now, given that we have this CO2 the REAL question is: So what? Does it actually do anything? It is supposedly an inert, trace gas. Does it, amongst all the noise of the climate, really cause some noticeable warming or, on the other hand, prevent cooling? The only thing we really know is that it is beneficial to plant growth. IF (big IF) it does cause some warming is that 1C, 2C, 5C 10C? Is that a good or a bad thing? There are many very clever scientists and many, too many, computer
gamesmodels making predictions. These range from astrological warnings of immediate Armageddon to just a few beneficial degrees C. To date it seems that no predictions have matched observations. Every clever scientist has his own graphs with links to other authors that absolutely prove, beyond all doubt, that his theory is the correct one. If you are looking for CO2 you will get lots of funding. The science is not even close to being settled.4. Do we actually care, will we even notice? We have just had a couple of summer days at 40C. No doubt in a few months we will have a couple of days at -10C. That’s a normal weather range of 50C, by no means extreme. A CO2 increase of a couple of degrees is just noise.
5. What we do know is that the last two centuries of civilisation based on fossil fuels has had awesome benefits for mankind. But a lot of mankind still has a lot of catch up to do. We are crazy to try to reverse this.
6. Now the rant. What makes me mad, I mean really, really mad is that on the basis of this very, very unsettled science a Swedish school girl can address the UN – and they listen. Politicians who should (probably do) know better, the media and Hollywood luvvies are falling over themselves to ensure that we bankrupt our societies, tax the air we exhale, ban fracking, drilling, nuclear, coal and any other form of abundant, cheap, reliable energy. Climate terrorists are gluing themselves to motorways and works of art. Our landscapes are being blighted by vast arrays of expensive, unreliable, medieval technology wind turbines whose foundations need enough concrete to fill an Olympic swimming pool. Instead, follow the clever Chinese, keep going full speed with fossil fuel but encourage research and investment in safe, abundant, cheap, reliable nuclear and any other promising technologies that may one day replace fossil fuel.
This thread could continue to the start of the next ice age (after all, we are supposed to be living in an inter-glacial).
Why are we having these endless discussions. In part it is because Maurice Strong / the UN said we had to find a human cause for global warming which neatly fits a hypothesis (one of many) that human fossil fuels are the cause due to increasing CO2.The IPCC knows the answer it has to find and it does so by playing down the endless uncertainties, the unknowns, and the unknown unknowns.
CO2 can be a forcing and a feedback and the temperature effect is highly dependent on the scale of feedbacks and how much climate change is natural (which the IPCC conveniently plays down). The flat line of Law Dome and other ice cores suggests that CO2 is neither a cause nor an effect of the Medieval Warm Period and nor affected the Little Ice Age.Why not?
Then man comes along and burns fossil fuels so we fit the role of CO2 to give us the answers we want. It is all too neat. Life is far more complex but people want simple answers. Remember the days when heart disease was all due to high fat diets (Ancel Keys) but now we know it is much more complex although the US and others lived with this hypothsis for decades and statins are still the biggest selling drug in the world.because we have been taught that cholesterol is causative rather that associative or irrelevant rather than just choosing your parents wisely!!
The MSM and the public need certainty even though it rarely exists and it most certainly does not exist here..
Patrick
I agree with you. CO2 is not causing any warming. But we have clever people like Ferdinand and Nick who refuse to inform the IPCC that the theory of warming by CO2 is nonsense? It is the same arguments I have with them every time.
It is like nobody of the AGW crowd understands a simple equation:
CO2 + cold + 2H2O = H3O+ + HCO3-
The CO2 that goes up naturally must come naturally. It sinks in the arctic and antarctic. In the Antartic there is no problem. It has not grown warmer or colder there.
The problem lies in the arctic The arctic oceans got a lot warmer.
Look at the table here:
https://breadonthewater.co.za/2022/08/02/global-warming-how-and-where/
So how much smaller did the sink area get?
Thank you for the comment but I did not say manmade CO2 warming is nonsense, only that there is tremendous uncertainty that it does (see Judith Curry and the Uncertainty Monster).The Bern Model may be completely correct but that does not mean that CO2 is causing warming or that such warming is not wiped out by feedbacks.
Another example. Models are running way too hot (even accepted by Gavin Schmitz of GISS) but modeller argue their models are based on the laws of physics. So what. That does not mean such laws can be applied to chaotic systems (the IPCC accepts climate is chaotic). Remember that wonderful expression “all things beinb equal” – in reality they never are..
Patrick
More warming and more waste water with low pH causes more CO2 in the air. The question is whether CO2 in the air causes more warming.
I show a number of investigations, including my own. They all found that the effect on global temperature of the extra 0.01% v/v CO2 that was added to the atmosphere since 1960 is extremely small or even zero, e.g. see here1 and here2 I also did some calculations myself on the infra-red spectrum of CO2. See here3 . (The result is reported in the first 3 rows of the K,L and M columns). The fact is that CO2 concentration follows temperature on all timescales, see here4 and here5 (you have to watch the first 30 minutes of the video, at least)
Even if we suppose that these people and their investigations must simply all be wrong, there is another rather inconvenient truth for the climate activists. The Gas Law implies that due to the diffusion and equal dissipation of the extra CO2 into our atmosphere, especially TOA, the rate of warming of earth must be the more or less the same wherever you measure. Unfortunately, that is not at all what is being observed.
https://breadonthewater.co.za/2021/11/25/an-inconvenient-truth/
If not by more CO2, where does the extra heat come from, it seems mostly from 1979?

there are a few possibilities.
https://breadonthewater.co.za/2022/08/02/global-warming-how-and-where/
https://breadonthewater.co.za/2022/01/10/global-warming-due-to-ehhh-global-greening/
good luck!
The flat CO2 curve of earlier years is probably the result of measurement using ice cores. Since these cores must be taken where the temperature never climbs above freezing then the CO2 level in that location would be low and not variable. The CO2 levels in the graphs accompanying this presentation zoom upward like rockets in recent years. Actually, the Muana Loa measurement for 1960 of 315 ppm is only 3/100th of one percent of atmosphere and the 420 ppm for 2020 is only 4/100th of one percent of atmosphere. Thus, the increase of CO2 level over those sixty years is only 1/100th of one percent which should appear as an almost flat line. But only if the interest is to be realistic.
Bill, the temperature at the place where is drilled or of the ice core itself has not the slightest influence on the CO2 levels. Even today, we see that CO2 levels from near the North Pole via the equator down to the South Pole are very similar with only a delay due to the fact that 90% of our emissions are in the NH and the ITCZ allows only 10% per year air exchange between the hemispheres.
There is an overlap of 20 years (1960-1980) between the CO2 levels in the Law Dome record and direct measurements at the South Pole.
Further, while the quantities involved are small, still it is over 40% increase and quantities don’t say anything about the effect…
Not that I expect that the effect is large, but not zero either…
I think that what does have an effect on the CO2 content of the ice cores is the lack of vegetation in the areas where ice cores are taken. CO2 mapping from satellite data has shown higher CO2 levels in areas of intense vegetation, particularly broad-leaf vegetation. Since that vegetation level has increased World-wide because of global warming is it not possible that the warming is causing the rise in CO2 level rather than CO2 being the cause of the warming?
Bill
That is what I am saying. F & friends think they can ‘calculate’ the solubility of CO2 in icewater without any of them having done an experiment to see how the heat in the arctic has influenced the CO2 in the air….
Remember the natural situation:
Around the equator
HCO3- + heat/UV = CO2 + OH-
Ca. 100 billion tons goes up annually.
Around the poles same amount must dissolve
CO2 + cold + 2H2O = H3O+ + HCO3-
to keep the balance
Problem is the sink areas in the arctic are getting smaller due to the extreme warming there. (ca. 0.7K per decade)
F & them think they can ‘calculate’ it all…..
Your explanation is above my pay grade. I am tending to believe that vegetation is a source of increased CO2 and not just a CO2 sink. I believe this is especially true of broad-leaf trees. I think that there is a need for persons much smarter than me to make use of the data from OCO-2 to better understand the source or sources of atmospheric CO2.
HenryP,
I have given you the formula for the solubility of CO2 in seawater per Henry’s law (what is in a name…).
That formula is confirmed by several million of seawater samples.
I have send you the measured pCO2 values of the main sink place in the N.E. Atlantic, where the THC / AMOC is sinking in the deep oceans: 150 μatm, far below the atmospheric 415 μatm, thus by far not saturated, only (temporarily) less sink capacity.
I don’t “think” I can calculate the sink capacity, I know that it is measured for the total sink capacity of oceans and vegetation together and that still is directly proportional to the extra CO2 in the atmosphere above equilibrium, despite warming oceans.
Measured as a difference between known emissions and known increase in the atmosphere. Simple subtraction, if you want call that a “calculation”, so be it.
No guess work, as your work is without any quantification of the effect of the temperature increase in the Arctic…
Ferdinand
The reactions that are relevant are chemical reactions and each depends on the reaction constant K with the water. Other substances in the water both soluble and insoluble and the concentration thereof may effect K.
Heat is a major factor that affects the reaction as does pH.
Assuming pressure is constant.
Which is exactly where the Bjerrum plot I posted earlier came from. One of the ‘reactions’ is the equilibrium of the atmospheric CO2 with CO2(aq) which depends on CO2 added to the atmosphere by other means. That is the major factor in changing the pH.
Bill, the net effect of more vegetation, is more sink than source…
That can be calculated by looking at the oxygen balance: the uptake of CO2 by vegetation produces O2 and the decay of vegetation (bacteria, molds, insects, animals) uses O2.
The O2 use of fossil fuel burning can be calculated and the difference is the O2 and CO2 balance of the total biosphere.
See:
https://tildesites.bowdoin.edu/~mbattle/papers_posters_and_talks/BenderGBC2005.pdf
Last page, Figure 7.
Needs some update, but as vegetation only did grow in the past decades, thanks to our CO2…
If vegetation was more sink than source then an area like the Amazon Rain Forest would not appear on satellite CO2 mapping as one of the highest locations of CO2 level on Earth. It would appear as having a lower CO2 level than surrounding areas.
Yes. And they cannot actually measure Oxygen as accurate as below 0.005%.
That is another AGW scam to let the people think that all is in balance….
That nonsense seems to be originating from the same source as the person who started the whole CO2 warming nonsense.
If you actually ask for the result as measured they show you non sensible and non SI unit results.
I find the various graphs of recent and current atmospheric CO2 levels to be magnifications of the actual CO2 level. The percentage of CO2 in 1960 was about 3/100ths of one percent of atmosphere(315ppm) and in 2020 was 4/100ths of one percent (420ppm). That means that the rise in CO2 level over a sixty- year period was only about 1/100th of one percent. That would appear as an almost flat line on a realistic graph. I also think that if better means of measuring past levels of atmospheric CO2 levels were available it would be seen that the period 850 AD to 1350 AD would show a rising CO2 level that peaked around 1350 AD and a decrease in CO2 level from the year 1350 until about 1850.
That is true. It is only 0.01% increase. And they think they can pick up such a small increase in proxies from a 100 years ago.
If the oceans get warmer they release more CO2. You can do the test at home. The first smoke from a kettle that starts boiling is CO2.
In the oceans it is the uv from the sun that brings the top layer of the water to boiling. Hence clouds and CO2 which bring life.
There seems to be an uncanny similarity between the lies of the nazi’s about racial purity and the lies of the AGW crowd about wanting pure air. Both are intent on destroying life, not creating it. The green religion is inherently evil.
https://breadonthewater.co.za/2022/06/27/the-green-religion/
Bill,
The repeatability of ice core CO2 measurements is +/- 1.2 ppmv for different samples at the same core for the same depth (thus for the same average gas age). The resolution of the Law Dome DSS core is about 20 years over the past 1,000 years (but others with similar resolution go back several thousands of year).
That ice core shows a drop of 7 ppmv around 1650. That is all and agrees with the drop of CO2 from colder oceans per Henry’s law.
That means that the warming after 1650 is good for 7 ppmv increase, if you agree that the current period is not warmer than the previous Medieval Warm Period.
The rest of the 120 ppmv increase comes not from warming oceans…
Further, it is nonsense to show how tiny the CO2 increase is compared to the rest of the atmosphere, it is the effect of the 50% increase of CO2 that is at stake. That effect is small (about 2 W/m2 more back radiation averaged over the earth, good for about 0.5 K temperature increase), but not zero.
If the tiny level of CO2 was replaced by HCN (hydrogen cyanide), all animal life on earth would drop death…
Relative quantities are not important, the effect of the changes is important.
Bill,
The equator is a continuous source of CO2, while most of the rest of the planet is a continuous sink for CO2. The overall balance is that vegetation is more sink than source, confirmed by the O2 balance and the increase of chlorophyll worldwide, measured by satellites:
https://www.nasa.gov/feature/goddard/2016/carbon-dioxide-fertilization-greening-earth
Thanks to our CO2…
There is a historical rate of amount CO2 change per amount of temperature change during the first 399,850 of the last 400,000 years. Most of the CO2 increase in the past 100-150 years cannot be accounted for by this.
Global temperature datasets that go back that far including HadCRUT4 show multidecadal oscillations superimposed upon the overall warming trend.
Patrick wrote, “The flat line of Law Dome and other ice cores suggests that CO2 is neither a cause nor an effect of the Medieval Warm Period and nor affected the Little Ice Age. Why not?”
It’s not quite flat. Here are Law Dome (Antarctic) ice core data, back to year 1010. Scroll down to “CO2, 75 Year Smoothed,” then keep scrolling. Watch CO2 levels climb to their peak of 284.1 ppmv circa 1170 (MWP), and fall to their lowest level of 275.3 ppmv circa 1615 (LIA):
https://www1.ncdc.noaa.gov/pub/data/paleo/icecore/antarctica/law/law_co2.txt
The decline in temperature from MWP peak to the bottom of the LIA reduced atmospheric CO2 level in Antarctic ice cores by about 9 ppmv, over about 450 years. It’s not much compared to the 135 ppmv increase in CO2 concentration over the last two hundred years, but it’s not quite flat, either.
You cannot really trust the proxies to be able to tell you co2 to a level of 0.01 % accuracy. That is also a farce.
Whenever you measure you first have to calibrate against known standards. So how do you calibrate?
There are in fact quite a number of measurements by people 100 years ago who used the wet chemical method and had results of more than 400 ppm. Somehow those results seem to have disappeared.
HenryP, they measured CO2 in ice cores with an accuracy of +/- 1.2 ppmv (1 sigma), on levels of around 300 ppmv, or 0.0012% in ancient air bubbles. With modern sublimation / mass spectrometry even better.
By far enough to see even the small changes between MWP and LIA.
The ancient wet methods had an accuracy of +/- 0.3% or +/- 10 ppmv. Until the much better NIR method from C.D. Keeling (0.0002%) they didn’t even know that there was a seasonal CO2 swing in the NH…
These historical high results were taken at highly contaminated places: midst of towns, forests, under, in between and over growing crops…
http://www.ferdinand-engelbeen.be/klimaat/beck_data.html
Ferdinand
Why are you wasting so much time on the debate (you and I will never agree) about the ratio of delta CO2 (manmade) versus delta natural CO2 (due to warming) instead of looking at the reports of the people (including myself) who said that the addition 0.01% CO2 that was added to the atmosphere does not cause any warming, see:
https://wattsupwiththat.com/2022/08/16/the-impact-of-human-co2-on-atmospheric-co2-summary/#comment-3580373
and is beneficial to earth for growing more trees, more lawns and better crops?
If I were you I would be refuting each and every report mentioned there by me and come up with my very own report showing me how and why the CO2 is causing more warming…..
You are putting the horse behind the car.
Over at the Dutch site we had an argument about the warming in AU. To determine the accuracy of the post, I looked in some detail at one station, namely Canberra, and I am going to ask you to do the same. Here are the results:
https://www.dropbox.com/s/nag26uh9132mp11/Canberra2022.PDF?dl=0
Carefully look at both graphs (by ‘edit’ and rotate you can see the graphs better). Now I will ask you: Would you not agree that if the the theory of warming by dCO2 were true, we must see Tmin rising, pushing up the average temperature?
Now look at the 2nd graph. Note that it has not been warming in Canberra for the last two decades and Tmin is still going down….
Thus, in a different way, I have proven again to you that the theory of warming by CO2 is incorrect.
Read my latest report
https://breadonthewater.co.za/2022/08/02/global-warming-how-and-where/
but do not forget to look at the report that I referenced there in the beginning.
Good luck!
.
Henry, those results haven’t disappeared, they just aren’t trusted by most people. The exception was the late Ernst Georg Beck. He collected & studied those data extensively.
To his credit, Beck was extraordinarily diligent at compiling such data. But the chemical measurement data he collected was mostly of poor quality, as is obvious from the data itself. For example, he reported CO2 concentration differences of >150 ppmv in one year from one paper to another. Even in the same paper he reported a 70 ppmv change in 1 year, which is obviously physically impossible, on a global scale.
Dr. Beck died in 2010, and his web site is now gone, but parts of it are preserved in various places: Here are two relevant pages:
1. https://web.archive.org/web/20101008134250/http://www.biomind.de/realCO2/
2. https://archive.ph/yCAbl
Ferdinand did a very thorough review of Prof. Beck’s work, here:
http://www.ferdinand-engelbeen.be/klimaat/beck_data.html
Short atmospheric lifetimes indicated by bomb test data are for individual carbon atoms. However, when one CO2 molecule enters the ocean, that usually causes another to gas out of the ocean into the atmosphere. To the extent the decay an injection or pulse of CO2 into the atmosphere can be approximated by exponential decay, efforts by William Eschenbach and by Dr. Roy Spencer have indicated half-life of about 30 to 41 years. https://wattsupwiththat.com/2015/04/19/the-secret-life-of-half-life/ indicates time constant tau of 59 years, which is half life of 41 years. https://www.drroyspencer.com/wp-content/uploads/Simple-CO2-budget-model-2.xlsx linked by https://www.drroyspencer.com/2019/04/a-simple-model-of-the-atmospheric-co2-budget/ has natural removal rate per year of atmospheric CO2 above an equilibrium level of .0233 times the extent of atmospheric CO2 exceeding equilibrium, which indicates time constant tau of 42.9 years or half life of 29.75 years. Meanwhile, as long as both emissions and the surplus are growing approximately exponentially, various decay curves including exponential decay and the Bern model cannot be proven or disproven by these data.
I am so sorry to note that most of you have still not understood that dCO2 in the air is not so much about dT of the ocean water, it is most of all about the decrease in surface area in the pole areas where the 100 billion tons of CO2 that gasses out annually out around the equator must dissolve.
CO2 + 2H2O + cold =HCO3- + H3O+
Apparently you do not understand that there is less seaice in the Arctic than there used to be. For example, this summer the seaice area is ~30% lower than the 1980s average resulting in ~1.8 million km^2 more open water that can absorb CO2.
Phil.
I am disappointed. You are so always so clever. But you don’t get it either. According to Roempps Chemie Lexikon ca. one hundred billion tons of CO2 escapes annually from the oceans around the equator, naturally; if it were not so you and I would not be alive:
HCO3- + heat / UV = CO2 (g) + OH-
Just for the record: a ton is a 1000kg.
Just to keep the balance in the atmosphere, a similar amount must dissolve again there where it is very cold. (how cold? good question! I could not find an answer on the rate of solubility of CO2 in seawater of various salinities versus low temperature – that tells me that nobody really understands the problem)
We know that in Antarctica things have more or less stayed the same over the past 4 decades. So we can safely assume that the m2 of the sink areas have also stayed the same over there. The problem lies in the arctic. One can also see this in the zig-zag of the CO2 results at ML.
Now you say:
this summer the sea ice area is ~30% lower than the 1980s average resulting in ~1.8 million km^2 more open water that can absorb CO2.
So I now ask you: where did all the heat to melt all that ice came from? That must have been an awful lot of Joules? (Maybe somebody can calculate it?)
I explain it here:
Global Warming: How and Where? | Bread on the water
Look at my Table 1. Clearly you can see that the heat is coming from beneath the arctic itself. See here4 It says: ‘In the last three decades…….. the temperature and salinity in the deep Greenland Sea have increased at unprecedented average speeds, and these trends are among the highest in the global deep ocean’.
Both the increase in T of the arctic water and the increase in salinity will affect the ability of CO2 to dissolve in the water and will therefore result in smaller sink areas of the waters of the arctic and surrounding areas.
The article you refer to is for sea water below 800m deep, that is not where the atmospheric CO2 is being absorbed! The absorption is occurring in the surface water which has a much larger surface area than formerly and is cold (~0ºC) and low salinity. Regarding solubility of CO2 vs salinity and temperature you really need to try harder, the data is out there. For example here’s a plot of CO2 absorption coefficient vs T and chlorinity.
kt167nb66r_fig041.gif
Phil.
In the summary, after referring to > 800 m, it says:
‘Yet, their ventilation implies modification of the shallower overflow waters that cross the ridge at rates of 6 Sv [Hansen and Osterhus, 2000; Eldevik et al., 2009].’
In any case, the evidence for warmth coming from beneath the arctic waters is overwhelming.
Your plot also does not help me a lot. I don’t even think it is for CO2, it looks to me like it is for Cs. And the unit on the y is also not correct.
I looked for it. Believe me. That info is not there. Nobody looked for it, because the AGW crowd always believed that they can ‘calculate’ what is natural and what is not natural.
You evidently didn’t look hard enough! The graph is for CO2, “Absorption coefficient (cs) of carbon dioxide in sea water as a function of temperature and chlorinity”.
Are you kidding me?
in mg-atoms? what unit is that?
there is no reference to CO2. Maybe you can reference the report where the graph came from?
Seriously, you claim to be a chemist and you don’t know what a gram atom is?
HenryP,
You still have not understood that 90% of the ocean surface absorbs CO2, because the equilibrium partial pressure pCO2(aq) in water is lower than the partial pressure pCO2(atm) in the atmosphere.
No matter the area of where the waters sink in the deep, there is no sign that the total quantity of water (as the AMOC and other sinking waters) that sinks near the poles is reduced.
The small pCO2(aq) increase (~16 μatm/K) of somewhat warmer waters near the poles hardly plays a role in the total sink capacity, as the total difference between pCO2(atm) and pCO2(aq) is around 270 μatm and increasing over time.
Moreover, oceans + vegetation still absorb CO2 in ratio to the extra CO2 pressure in the atmosphere, no sign of any saturation. About half in vegetation (based on the oxygen balance) the other half in the oceans…
Ferdinand
Clearly you have not understood that what we are talking about here are pure chemical reactions that are happening at the equator and at the pole areas. Henry’s law may also have some influence but not so much.
Do you even know what K is for those reactions?
What about you tell me how much warming is caused by the extra 0.01% that was added to the atmosphere?
See previous comments.
HenryP,
Henry’s law is the start: as long as there is no equilibrium, CO2 get absorbed by the oceans. How much gets absorbed over a time period depends of the migration speed and chemical reactions that also do influence the pCO2 of the oceans.
Until now, there is no sign that there is any reduction in absorption speed, it still is directly proportional to the pCO2 difference between atmosphere and oceans. Thus there is not the slightest indication that the area of uptake in the Arctic plays any role in the total uptake of CO2. None.
The whole discussion here is about the origin of the increase of CO2 in the atmosphere, not about the effect. That is a completely separate discussion.
But if you are interested: about 1 K for each doubling, based an very accurate measurements of the radiation spectra of CO2 in Hitran.
According to Happer & Van Wijngaerden: about 0.7 K for each doubling, based on re-examinating of the Hitran data.
All the rest is speculation from models…
Ferdinand
Now you said
‘The small pCO2(aq) increase (~16 μatm/K) of somewhat warmer waters near the poles hardly…’
Which is my point is it not? If at the equator a 100 billion tons of CO2 goes up in the air each year, a similar amount must dissolve again in the colder waters. All results are pointing to the fact that the area where CO2 must dissolve in the arctic is getting smaller which causes the increase in the CO2 content in the atmosphere. These are chemical reactions which depend on the reaction constant K, the temperature, the pH, the pressure, and the concentrations of the carbonates and other anions in the waters.
Ferdinand, it is must be clear to you, also from previous discussions that we will not agree on this, so it is pointless continuing this discussion. In fact it is not a discussion. it is a debate. I am simply saying that it not possible to say what comes from nature and what is caused by man.
Which is why I asked you to actually check the results that would prove to yourself that the extra CO2 is not causing any warming. I am hoping that if you discover that they have made mistakes by not taking the cooling properties of CO2 into account you will pursue them with the same zealotry as what you pursue people like me who simply see that sometimes it is not possible to measure or calculate what you would like to know.
My own results indicate that the warming by the extra CO2 is zero.
When i started with that job, I started with that funny equation
rf = f * ln([CO2]/[CO2]prein)/ln(2)
becoming AF = 5.35 ln(CO2/CO2) = 3.7 W/m^2
f = Factor including 0.6C that was used at the time representing all the global warming.
[CO2]prein = CO2 concentration pre-industry (1850)
Apparently this came from a report from Andrea at al (2005?) and was used in IPCC 2007 but as you can see it relies on what was then just a correlation, dT versus dCO2 and some original calculations by Arrhenius which were faulty and therefore had to be adapted to reflect what was happening.
In order to prove this relationship is causal they came up with Hitran. Here they made the error to propose earth as a black body radiator which is incorrect. Earth has no outgoing radiation in areas where CO2 also absorbs strongly, e.g. 4-5 um. This means that CO2 causes cooling in the areas where it has absorptions between 0 and 5 um. There are even absorptions of CO2 in the UV which is how we identify and quantify it on other planets.
So where is the balance sheet, showing us exactly how much cooling (by back radiation to space) and how much warming (by back radiation to earth) is caused by the CO2?.
As I said, my balance sheet shows that the warming and cooling cancels each other out.
HenryP,
From Hitran (which is compared and calibrated to what really happens in the atmosphere), according to Happer and Van Wijngaerden: 2.7 W/m2 or about 0.7 K warming for each CO2 doubling.
If you don’t agree with them, you can contact them…
Confirmed by real measurements of the full spectra of back radiation, which show a 0.2 W/m2 increase from only 20 ppmv CO2 increase over the period 2000-2010:
https://escholarship.org/content/qt3428v1r6/qt3428v1r6.pdf
BTW, Hitran is much older than the IPCC and not based on any correlation.
No matter how much by the surface is emitted, some 0.2 W/m2 is coming back extra from 20 ppmv CO2 extra, that without that extra CO2 was directly lost in space…
When I questioned Happer on that issue, he told me he had always thought that CO2 ‘was not opaque’ to the radiation coming from the sun. I did not pursue the issue more out of respect than anything else. I am asking you, Ferdinand, to investigate it yourself. I left enough clues on this thread for you to get started.
My balance sheet tells me that the net effect of more CO2 is very close to zero, but more cooling rather than warming.
As I pointed out about Will was right, absorption in the 2-5μm band is negligible.
The absorption at 4.3 um is massive.
I used it to measure CO2 in nitrogen with FTIR.
I’m sure you did it would be a pathetic FTIR spectrometer if you couldn’t. That’s not how absorption in the atmosphere works though, the absorption of solar radiation at 4.3𝝁m is anything but massive.
The solar radiation between 2 – 4μm is only 5% of the solar radiation since it’s the tail of the distribution, so absorption by CO2 is rather low. On the contrary the absorption by the 15μm band is near the peak of the Earth’s emission spectrum and covers about 28% of the emission band If you determine the absorption (say using Spectracalc) you’ll find that the absorption of the outgoing IR is a factor of thousands of times greater than that of the incoming IR. Why didn’t you mention the dominant absorption band of CO2 rather than an irrelevant one?
Here’s an example of the absorption of CO2 near the Poles measured at Barrow Alaska, note that during the winter/spring when there is no open water, just sea ice the CO2 is increasing, in the summer when the ice melts and breaks up the atmospheric CO2 drops rapidly.
ts_6304f78ed0fdb.png
Quite so Ferdinand, also since as the area of surface water in the Arctic ocean has increased and the area of ice has decreased any contribution of the Arctic will be an increase.
Phil.

thanks.
your graph
confirms the report
https://www.netzerowatch.com/the-annual-atmospheric-co2-variation-a-new-theory/
It doesn’t ‘confirm the report’ it is a component of the data used in the report, quite different.
Henry’s Law is the dominant factor, it is what controls the transition of CO2 between atmosphere and ocean, until the CO2 has entered the ocean the chemical equilibria are not involved. By the way it’s about time you learned the proper use of %.
just when I thought I was standing alone:
The annual atmospheric CO2 variation: A new theory – Net Zero Watch
As usual, correlation is not causation…
The change in sea ice surface over the seasons is nearly the same in the Antarctic as in the Arctic. Despite that, there is hardly any seasonal amplitude in the SH, while a huge one in the NH.
Why? Because the NH is 70% land and 30% ocean, so the biosphere wins the seasonal contest. In the SH it is reverse and therefore a break-even.
Moreover, the opposite CO2 and δ13C changes show that vegetation is the main cause. If it were the oceans, the δ13C level would go up…
Eishh
Ferdinand
I cannot believe you already have a response for a report that is only 5 days old.
that land issue has got nothing to do with anything; it is a red herring.
that is exactly what this study is saying and what I also said, earlier up the thread, namely, I said:
‘We know that in Antarctica things have more or less stayed the same over the past 4 decades. So we can safely assume that the m2 of the sink areas have also stayed the same over there. The problem lies in the arctic. One can also see this in the zig-zag of the CO2 results at ML.”
What they did in this study is confirming that what I said is true….
Now I have been reading the chapter with the graph that Phil. brought along. If you read that your hairs will rise and you will realize that what I said is true: if there are too many unknowns e.g. the pH of the waste water by many factories, 7 billion people and even more animals, that I mentioned earlier, you cannot think to solve the problem. It is basic mathematics. If you pick up too many unknowns (variables) you cannot solve the equation.
Well if you knew anything about basic biology you’d know that the contribution by animals is irrelevant. Here’s a basic diagram to put you right:
pyramid-of-energy_med.jpeg
Sorry. Seems to me you don’t even know the difference between pH and heat/ energy. Give it up, Phil.
Sorry I thought you had a basic knowledge of biology, apparently I was wrong. The energy required by plants is used to convert CO2 to mass, each trophic layer is only able to consume about 10% of the previous layer. So the total of herbivores can only contribute a small proportion of the plants.
Phil.
We were just talking of pH of the Nh waters as one of the variables which is completely unknown.
Your comments are not making any sense. Are you drunk?
No I am not, I was just pointing out that your introduction of the number of animals on the planet as an unknown variable is a spurious comment, controlled as it is by the vegetation, a substantially larger component. A concept you appear to be unable to grasp. Also the pH of the ocean is controlled by the very equilibria you have mentioned and the associated buffers.
Ja.ja. More acid from wastewater causes more CO2
H3O + HCO3 = CO2 + H2O
Only if the CO2(aq) is increased to above the Henry’s Law equilibrium value which unlikely given the buffers.
The Henry’s Law coef is ~130MPa at 280K and ~420MPa at 330K in seawater.
Eissh
Phil.
Are you getting too old for this now?
When aqueous waste water (pH6) meets sea water (pH8) there is an immediate chemical reaction. There is an incalculable amount of carbonates and bicarbonates in the oceans, both soluble and partially soluble which are all in equilibrium. So the hydronium reacts with the bicarbonate and all other equilibria move up. Nothing changes in the ocean. Even the pH stays the same. But the CO2 in the air goes up…..
H3O+ + HCO3- = CO2 + H2O
That is how nature deals with our waste……Maybe, if we estimate the amount of waste water per person based on actual consumption per day and assuming average pH of wastewater is 6, we could calculate how much CO2 goes in the air.
No but clearly you are!
“nothing changes in the ocean”, really then how does the CO2 leave? Also assuming that wastewater is at pH6 is an exaggeration more typically about 7 sometimes 8.
The CO2 in your reaction is actually CO2(aq), whether it enters the atmosphere depends on the Henry’s law equilibrium, when as in most of the ocean surface atmospheric CO2 exceeds CO2(aq) it does not leave.
When, as in the attached Bjerrum plot the pH is about 8 HCO3- actually increases and CO3– decreases.
Bjerrum-plot-showing-typical-concentrations-of-dissolved-carbonate-species-in-seawater.png
CO2(aq) ⇌ CO2 (CO2(aq)=KH*pCO2)
CO2(aq) + H2O ⇌ HCO3- + H+ (HCO3- = K1KH*pCO2/H+)
HCO3- ⇌ CO3– + H+ (CO3– = K2K1KH*pCO2/H+^2)
The specifications I have seen, show that pH of wastewater must be >6. But do you think all countries / factories keep to the rules??
Possibly some break the rules but it’s not a significant factor anyway. As you pointed out when mixing with seawater the pH will change from 6 to 8. Based on the equilibria the Bjerrum chart shows the CO2(aq) drops from 10^-3 to 10^-5 mol/kg and the HCO3- increases from 10^-3 to 2*10^-3 mol/kg. So yes the CO2(aq) goes down but not by exchanging with the air but by increasing the concentration of bicarbonate ions
Phil.
We disagree on mechanism but agree on significance. By my calculations the amount of CO2 involved cannot be more than a couple of hundred thousand tons per annum.
That still compares to almost nothing with the 100 billion tons that goes up in the air around the equator each year and must dissolve again there where it is cold enough.
I am amazed. I fly from Johannesburg to London in 11 hours and it makes me think the earth is small. But earth is bigger than you think. It can handle the waste of 7 billion people just as if it were nothing…..