Open access paper published in Atmosphere Remote Sensing
HT/Leif Svalgaard
Abstract
Total Solar Irradiance (TSI) quantifies the solar energy received by the Earth and therefore is of direct relevance for a possible solar influence on climate change on Earth. We analyse the TSI space measurements from 1991 to 2021, and we derive a regression model that reproduces the measured daily TSI variations with a Root Mean Square Error (RMSE) of 0.17 W/m2. The daily TSI regression model uses the MgII core to wing ratio as a facular brightening proxy and the Photometric Sunspot Index (PSI) as a measure of sunspot darkening. We reconstruct the annual mean TSI backwards to 1700 based on the Sunspot Number (SN), calibrated on the space measurements with an RMSE of 0.086 W/m2. The analysis of the 11 year running mean TSI reconstruction confirms the existence of a 105 year Gleissberg cycle. The TSI level of the current grand minimum is only about 0.15 W/m2 higher than the TSI level of the grand minimum in the beginning of the 18th century.
1. Introduction
The climate on Earth is determined by the balance between the incoming solar radiation—quantified by the Total Solar Irradiance (TSI)—and the outgoing terrestrial radiation. A change in TSI is a solar force of climate change on Earth; therefore, the TSI needs to be monitored as an Essential Climate Variable (ECV) [1].
The first measurement of TSI from space was made in 1969 [2], and continuous monitoring of the TSI with space radiometers started in 1978 [3]. In general, TSI radiometers measure at different absolute levels [4], and are subject to ageing due to solar exposure [5]. Several authors have proposed so-called TSI composite time series quantifying the long-term TSI variation as measured by the space instruments [5,6,7,8,9].
From the available TSI composites, it is now well-established that the TSI varies in phase with the 11 year sunspot cycle [10]. In particular, there is a short-term TSI decrease—referred to as sunspot darkening—when a sunspot characterised by a strong surface magnetic field occurs. There is also a longer-term TSI increase—referred to as facular brightening—caused by the facula, characterised by an intermediate-strength magnetic field, which form when a sunspot decays and which have a significantly longer lifetime than the original sunspot.
On top of the 11 year solar cycle TSI variation, there exists a longer-term variation of the ’quiet sun’ [11]. The TSI level observed during the 11 year cycle minima has long been a matter of speculation. Following [12], it was believed that the sun evolved from the so-called ’Maunder Minimum’ from about 1645 until 1715 when the 11 year cycle amplitude was minimal, to a so-called ’Grand Modern Maximum’ [13], where the 11 year cycle amplitude is supposed to be maximal. Centennial TSI reconstructions, such as the one of [14], used for the characterisation of solar climate forcing by the Intergovernmental Panel on Climate Change (IPCC), include a slow increase in the ’quiet sun’ TSI level from the Maunder Minimum to the Grand Modern Maximum by 1.25 W/m2 over a period of about 300 years. Table 1 gives an overview of the TSI increase since the Maunder Minimum found by different studies.
Table 1. List of various studies on the TSI increase since the Maunder Minimum.

Recently, the Sunspot Index and Long-term Solar Observations (SILSO) Sunspot Number (SN) have been revised [20,21]. Following the latest insights, the Grand Modern Maximum does not exist, and so the 300 year increase in the TSI level from the Maunder Minimum to the Grand Modern Maximum should also be revisited. Independently from the SN revision, from an analysis of the extended 2008–2009 solar minimum, ref. [18] came to the conclusion that the TSI increase from the Maunder Minimum to the present needs to be revised. In addition, the careful intercomparison of all available space radiometer TSI time series in [9] indicates no variation of the quiet sun TSI level over a 32 year period from 1984 to 2016 within a 95% uncertainty of ±0.17 W/m2.
The goal of this paper is to reconstruct the centennial TSI variation back to 1700 based on the available TSI space measurements and the revised SN, in agreement with the insights from [18]. This new centennial TSI reconstruction is a paradigm shift [22] compared to the long-held belief based on [12] that there was a significant increase in the TSI, and hence solar climate change forcing, from the Maunder Minimum to the present. In Section 2, we review the available TSI space measurements and TSI regression models reproducing the sunspot darkening and facular brightening from observations of the solar surface magnetic field. In Section 3, we reconstruct the TSI variation back to 1700 based on the revised SN.
…….
4. Discussion
Since [12], solar-climate research has been dominated by the idea that during the Maunder Minimum, the TSI was significantly lower than the current conditions, characterised by a Grand Modern Maximum [13] of solar activity, and that this lower TSI could be at least partially responsible for the lower temperatures during the so-called Little Ice Age (LIA) [48] from the 15th to the 19th century, where the temperatures in the Northern Hemisphere dropped by about 0.6 °C. For example, in [15], it is estimated that the TSI during the Maunder Minimum could be 3.3 W/m2 lower then its mean value from 1980 to 1986. The theory of the Grand Modern Maximum had to be abandoned after the revision of the sunspot number [20] and after the occurrence of the low solar cycle 24 occurring between 2008 and 2019—see Figure 3. Therefore, the long-term TSI reconstruction needs to be revised.
A reconstruction of past TSI variations needs to be based on the analysis of existing TSI space measurements. We demonstrated in Section 2 that the daily composite TSI from 1991 to 2021 can be reconstructed with an RMSE as low as 0.17 W/m2 and a correlation coefficient as high as 0.94 from a regression model based only on a facular brightening proxy and a sunspot darkening estimate. There is no evidence that other physical effects other than facular brightening and sunspot darkening, both linked to the magnetic field on the solar surface, are needed to explain observed TSI variations.
We can then endeavour the extrapolation of the TSI variations prior to their reliable measurement from space. On annual mean timescales, facular brightening and sunspot darkening are strongly correlated since the faculae result from the decay of sunspots on timescales shorter then 1 year, so that a single proxy for both can be used. In Section 3, we have used two facular brightening proxies—the MgII core-to-wing ratio and the F10.7 radio flux—and one sunspot darkening estimate—the SN—to reconstruct the measured annual mean TSI variation from 1992 to 2020, with RMSEs of 0.071 W/m2, 0.081 W/m2 and 0.086 W/m2, respectively. Prior to the used TSI space observations, the annual TSI extrapolations using any of these proxies agree well during their period of overlap, giving confidence in the soundness of the extrapolation. From the comparison of the sunspot-based TSI model with the other TSI estimates during their period of overlap, the stability of the annual mean sunspot-based TSI reconstruction is estimated to be ±0.25 W/m2. A TSI reconstruction similar to ours was used in [49] for an adequate reconstruction of global temperature change from 1850 to 2019, increasing the confidence in the validity of our TSI reconstruction.
The occurrence of grand solar minima and maxima [50,51] can be studied from the 11 year running mean TSI reconstruction shown in Figure 5. An RMSD analysis as a function of timeshift confirms the existence of a 105 year Gleissberg cycle, similar to the one found in [45,46]. The TSI levels during the earlier grand minima in the beginning of the 18th and the 19th centuries are comparable, around 1363.05 W/m2, while the TSI levels during the later grand minima, in the beginning of the 20th and 21st centuries are also comparable, around 1363.2 W/m2, only 0.15 W/m2 higher than the earlier grand minima. Clearly, this small TSI level variation cannot explain the occurrence of the LIA.
The main contribution of our study is that, in opposition to earlier studies based on [12], we do not find a significant increase in TSI and hence solar influence on climate change between the Maunder Minimum and the present.
5. Conclusions
We have obtained a new TSI reconstruction from 1700 to 2020. It is based on a careful intercomparison and analysis of the TSI space measurements from 1991 to 2021 and an extrapolation back to 1700 based on the latest version of the annual mean SN. The daily mean TSI space measurements can be reconstructed with an RMSE of 0.71 W/m2 and a correlation coefficient of 0.94 by a regression model using the MgII core-to-wing ratio facular brightening proxy and the PSI sunspot darkening estimate. The annual mean TSI model agrees with the TSI space measurements with an RMSE of 0.086 W/m2 and has an estimated stability of ±0.25 W/m2. The analysis of the 11 year running mean TSI reconstruction confirms the existence of a 105 year Gleissberg cycle with grand minima occurring in the beginning of each century. The TSI level of the latest grand minimum is only 0.15 W/m2 higher than the TSI level of the earliest grand minimum.
This article is an open access article distributed under the terms and conditions of the Creative Commons Attribution (CC BY) license (https://creativecommons.org/licenses/by/4.0/).
Reconstruction of the 17th century decades of the Maunder Minimum would be helpful, and of its UV component.
Thanks!
The analysis of the 11 year running mean TSI reconstruction confirms the existence of a 105 year Gleissberg cycle.
Now ‘that is quite the turn-up for the books’
Exactly 13 years ago I got strong chiding by Doc Svalgaard for sugesting that the Gleissberg cycle is ~107 or so years and not 75-80.
on May 4, 2009, 1:25pm, lsvalgaard wrote:
It seems that you do not need science for you quest. Should you in future change your mind I’ll glad to help with the transition.
So I defended it in following manner:
on May 4, 2009, 2:58pm, vukcevic wrote:
I may take you up on that.
In future, I may look at Gleissberg cycle but that might be contentious. It appears you are not totally convinced by it either. Your FFT analysis shows clear ~108y, I have personal favourite (95 +118)/2 = ~107y, but there is a small flexibility there, and 108 is only an average.
http://www.vukcevic.co.uk/SSNAnomaly1.gif
(at the time link was from ntlworld.net)
on May 7, 2009, 3:06pm vukcevic wrote:
I said I might take you up on it.
How about Gleissberg and 107 year Vukcevic cycle? That is pure planetary technology, you gota the data I gota the formula, lets make something out of it.
Are you up for it?
W. Gleissberg In his letter (1945) Evidence for a long solar cycle
writes: ” One long cycle is equal to 7 eleven-year cycles or 77.7 years. “
26 years later in his submission The probable behaviour of sunspot Cycle 21
to Astronomical Institute, University of Frankfurt/Main, West Germany
Received: 18 May 1971 Revised: 30 June 1971
Gleissberg states following:
” After an explanation of the method of forecasting based upon the 80-yr sunspot cycle, reasons are given for assuming that the maximum of the present 80-yr cycle now has passed. “
Considering above conclusion is that Gleissberg believed that the cycle bearing his name is 80 (77.7), and not 70 or 90 or 108 year long cycle.
If any of contributors to are aware of any articles or letters by W. Gleissberg quoting other values for ‘long solar cycle’ I would appreciate a quote or link if possible.
Thanks and appreciation is expressed in advance.
vukcevic
There is more in there, so if you are not bored with it by now you will find rest on my web-page:
http://www.vukcevic.co.uk/Gleissberg.htm
If Dr. Svalgaard would like to make a comment we could have another go at it, like in the good old days.
(if anyone knows how to operate internet way-back machine it should be able to find above exchanges)
Thanks for recalling that exchange. Svalgard is so full of hubris he lives in a little academic bubble where no one can question anything he says.
I recall a similar exchange where I noted a lunar signal in some variable under discussion ( seismic IIRC ) which he disparaged in a similar way. He then posted an analysis where he filtered the data by monthy averaging and said : look there’s no sign of a lunar cycle at all. It was laughable. He stopped replying when I pointed out how absurd that was.
I take little notice of anything he says or publishes now. He is clearly neither honest nor objective.
I like Vuk’s work and would like to see it presented more formally.
The analysis of the 11 year running mean TSI reconstruction confirms the existence of a 105 year Gleissberg cycle.
Now ‘that is quite the turn-up for the books’
Exactly 13 years ago I got strong chiding by Doc Svalgaard for sugesting that the Gleissberg cycle is ~107 or so years and not 75-80.
on May 4, 2009, 1:25pm, lsvalgaard wrote:
It seems that you do not need science for you quest. Should you in future change your mind I’ll glad to help with the transition.
So I defended it in following manner:
on May 4, 2009, 2:58pm, vukcevic wrote:
I may take you up on that.
In future, I may look at Gleissberg cycle but that might be contentious. It appears you are not totally convinced by it either. Your FFT analysis shows clear ~108y, I have personal favourite (95 +118)/2 = ~107y, but there is a small flexibility there, and 108 is only an average.
http://www.vukcevic.co.uk/SSNAnomaly1.gif
(at the time link was from ntlworld.net)
on May 7, 2009, 3:06pm vukcevic wrote:
I said I might take you up on it.
How about Gleissberg and 107 year Vukcevic cycle? That is pure planetary technology, you gota the data I gota the formula, lets make something out of it.
Are you up for it?
W. Gleissberg In his letter (1945) Evidence for a long solar cycle
writes: ” One long cycle is equal to 7 eleven-year cycles or 77.7 years. “
26 years later in his submission The probable behaviour of sunspot Cycle 21
to Astronomical Institute, University of Frankfurt/Main, West Germany
Received: 18 May 1971 Revised: 30 June 1971
Gleissberg states following:
” After an explanation of the method of forecasting based upon the 80-yr sunspot cycle, reasons are given for assuming that the maximum of the present 80-yr cycle now has passed. “
Considering above conclusion is that Gleissberg believed that the cycle bearing his name is 80 (77.7), and not 70 or 90 or 108 year long cycle.
If any of contributors to are aware of any articles or letters by W. Gleissberg quoting other values for ‘long solar cycle’ I would appreciate a quote or link if possible.
Thanks and appreciation is expressed in advance.
vukcevic
There is more in there, so if you are not bored with it by now you will find rest on my web-page:
http://www.vukcevic.co.uk/Gleissberg.htm
If Dr. Svalgaard would like to make a comment we could have another go at it, like in the good old days.
(if anyone knows how to operate internet way-back machine it should be able to find above exchanges)
Correct. Leif gave us a hard time for defending secular solar cycles and now he is pointing to an article that confirms their existence.
So Leif, wasn’t it that the sun has no memory? I guess astrophysicists don’t understand the sun as well as they think. Their models are just that, models.
Cyclomania vindicated.
The sun is a variable star, Its variation in its main visible and IR bands isn’t great, hence TSI doesn’t fluctuate much. However its variation in the all important UV band is huge.
Bingo, along with possible impact on cloud cover.
“Only two things can impact the energy content of a system (earth water atmosphere) in a radiative balance, either a change in input, or a change in residence time within the system.”
Residence time of said energy is potentially a far greater GMT impact than the small change in TSI
Is there any concern here regarding the predicted smoothed values vs actual measurements?
Table 1 really does have content. But you have to click on it to get to the paper, where there is a button that will show it.
The link (Table 1) is to the paper, Nick. Click the link and scroll through the paper. The “various studies” are cited in the paper.
Ja. tsi is useless. As usual.
You must measure Tmax on earth. That way you see the interaction between earth’ s atmosphere and the radiation coming from the sun. Click on my name to watch the drop op Tmax since 1996.
Sorry. Wrong link to name.
https://breadonthewater.co.za/2022/03/08/who-or-what-turned-up-the-heat/
Fig. 4
Henry,
Your claim that the NH might be warming faster than the SH because of “increased Arctic volcanic activity” is so easily shown to be completely false. The heat flux emitted by volcanic activity is many orders of magnitude too small to have caused the observed warming trend:
Space-based estimate of the volcanic heat flux into the atmosphere
https://www.higp.hawaii.edu/~wright/geology32.pdf
The real reason for differences in warming rate between the NH and the SH is pretty obvious: much greater area coverage by high heat capacity ocean water in the SH.
Given identical CO2 warming input, the higher heat capacity SH surface will warm more slowly. Duh. This is grade school level science.
There is no such thing as “CO2 warming input”. That is also grade school level science.
mkelly says: “There is no such thing as “CO2 warming input’ ”
Every major scientific organization in the entire world says otherwise, and moreover, they have over a century of well verified evidence backing what they say.
Sorry, but I’ll accept their boatloads of evidence rather than some amateur “Nuh Uh because I say-so” mkelly claim any day of the week and twice on Sundays.
It’s the Sun that provides the energy to the Earth, not the CO2. The CO2 retards the Sun’s energy from leaving, as such it can do no warming, only retard the cooling.
If it did what you claim it does, it would be a violation of the Second Law of Thermodynamics. Doubtful that any scientific organizations have ever said what you claim they did.
Doonman,
Sorry, but I see your “objection” as being little more than playing silly word games.
Of course the CO2 warming effect is due to a lessening of heat escaping the earth. Less “cooling” if you will.
One can also legitimately describe this effect as a warming “input” to the surface. More infrared is “input” to the earth’s surface due to CO2 keeping infrared from escaping into space.
Regardless what wording is used, the bottom line remains the same: as more and more CO2 is pumped into the air, the earth gets warmer and warmer.
The “Silly word games” you reference are called definitions. Without definitions, there is no science.
CO2 has no warming input as you claimed, period. It can only absorb an existing photon of a specific energy, (which originally came from the sun) become excited and then redirect a new photon in a random direction as it relaxes. That’s called the conservation of energy and no heat is gained.
Since you want to ignore that definition and excuse your misunderstanding as a “silly word game”, it tells everyone all they need to know about your knowledge of the matter.
A portion of those randomly emitted photons from CO2 molecules go back to the earth. Warming photon energy is obviously gained by the earth; warming energy that would have otherwise just escaped into space.
“CO2 has no warming input” remains so obviously false.
You are making a totally baseless jump from CO2 is a GHG ( active in LWIR ) to : the earth is getting “warmer and warmer” as a result and thus any warming is due to human fossil fuel burning.
The amount of warming depends on many things of which we only have basic understanding not definitive quantitative evidence.
We can not even measure cloud coverage to a sufficient accuracy to know how the natural feedbacks of the water cycle respond to the “CO2 forcing”.
If you want to say there must be some warming effect, even if it is infinitessimal and may be swamped by natural variation and thus immeasurable , them just about everyone agrees. That is “basic physics”.
That is totally different from attribution of any recent change to the increase in CO2. That is where the science goes out of the window and it becomes political bias, agenda and spin. That is what you are doing.
re: “You are making a totally baseless jump from CO2 is a GHG (active in LWIR ) to : the earth is getting “warmer and warmer” as a result”
Sorry, Greg, but the CO2 warming effect is far from “baseless”.
You appear to be unaware (though this does not seem surprising) that the actual magnitude of the CO2 greenhouse warming effect has been a known quantity, via direct measurement through the atmosphere, for well over a century. It is not “infinitessimal” and is in no way “swamped by natural variation” as you seem to want to pretend.
The observed warming is fully consistent with the known CO2 warming amount and reasonable feedback estimates that are based on “basic physics”.
It is in reality your own unfounded objections that are “where the science goes out of the window and it becomes political bias, agenda and spin. That is what you are doing.”
Well MGC attached is a part of a page from a thermodynamics book talking about the heat capacity you mentioned. Please note it says the energy can be in any form. So you get the same temperature rise whether CO2 is involved.
mkelly –
Sorry, but your thermodynamics quote is a total nonsequitur.
The real issue here is this: for the same amount of energy input (and yes, regardless where that energy input comes from) different substances that have different heat capacities (like land and ocean) will warm at different rates. You will most certainly not get the “same temperature rise”.
Ocean water has a high heat capacity, meaning that for any given amount of energy input (again, regardless where that input comes from) it will warm more slowly than will land areas. The oceans have greater “thermal inertia” than do land areas.
The southern hemisphere has far more open ocean area and higher heat capacity than the northern hemisphere. Therefore, even with the same energy input into each hemisphere, the southern hemisphere warms more slowly than the northern hemisphere.
This same principle also explains why coastal regions and islands generally have more moderate temperature variations than do inland areas. The high heat capacity of the neighboring ocean acts as a thermal inertia buffer. Temperature variations are far smaller in Hawaii than in Kansas.
This is basic, elementary physics, mkelly, well known for decades and decades and decades.
Relative humidity across Hawaii varies significantly, as does humidity across Kansas.
Temperature across Hawaii varies significantly, as does temp across Kansas.
Tell us about the CO2 variation across Kansas and Hawaii, respectively, and how that variation impacts the temperature.
DonM
Average temperature variations in Hawaii are much, much smaller than average temperature variations in Kansas. See attached graphs.
And sorry, but for a discussion of how the oceans act to buffer temperature variations, relative humidity variations and CO2 variations are irrelevant non-sequiturs.
Another sadly typical “skeptical” fail.
From the above abstract:
“We analyse the TSI space measurements from 1991 to 2021, and we derive a regression model that reproduces the measured daily TSI variations with a Root Mean Square Error (RMSE) of 0.17 W/m2 . . . The analysis of the 11 year running mean TSI reconstruction confirms the existence of a 105 year Gleissberg cycle with grand minima occurring in the beginning of each century.”
So, if I interpret the above correctly, a curve-fitting of measured correlations obtained over a 30-year period (the “regression model”) is sufficient to confirm the existence of a 105-year cycle.
I have a great respect for Dr. Leif Svalgaard and his work and publications—even recognizing that he is WUWT’s resident solar expert—but honestly have to ask if such a claim is supportable mathematically.
30 years out of 105 years in only 29% of a full cycle. The Nyquist-Shannon sampling theorem states that a periodic signal must be sampled at more than twice the highest frequency component of the signal. In practice, because of the finite time available, a sample rate somewhat higher than this is necessary.
(Ref: https://en.wikipedia.org/wiki/Nyquist%E2%80%93Shannon_sampling_theorem )
Of course it is not. The assumption is, that the intra-cycle TSI / SN relation was applicable onto inter-cycle SN numbers. Not just is it only an assumption, it also contradicts the before well established theory of the little ice age being caused by the maunder minimum. I would say it should take more than just an assumption for that..
Nyquist and Shannon can say what they want, but Heinrich Schwabe defined the 11-year solar cycle with 17 years of data. He got an astronomy medal for that.
Ummm . . . I would also add that he got lucky with that . . . the general accuracy of his 11-year cycle prediction, that is.
In science you have to jump the gun. If you wait for thorough confirmation somebody else will get the credit before you. As Feynman said you just have to get it right when everybody else gets it wrong.
Javier
Jumping the gun in the consideration of radiative climate theorizing, from the Earth dimming to Sun brightening, or Sun dimming for that matter is quite nonsensical and stubborn too.
M. Cycles radiative theory of climate, addresses climate in the line of Earth dimming, via sunshine.
And it only covers the explanation of cooling via a runway feedback of Earth dimming-Earth cooling ‘mechanism’.
Because that is the obvious, Earth dimming-climate cooling and earth brightening-climate warming.
The correlative relation.
cheers
You have to jump the gun when positing a theory … then when people test ot try to validate said theory going forward as more data becomes available they can say the XYZ Theory is correct or fails
Jumping the gun, is matter of basics, of human engagement afairs,
but still, in the end of day it projects within the human actions, per the 50/50, of an outcome, and still for as long as it persist, it must not push for, as in if;
for as long as it not gets to, in the end of the day to push forward the stupidity,
as per;
‘Jumping the shark’… as the main successful path forward!… regardless of anything else, there, being there before us now,
and even after us, as for us now, and as then before and after us, is the most frack up schist ever! INSANITY.
Sorry, but got to say it, as I see it!
cheers
A quick follow-up to my previous comment about Heinrich Schwabe “getting lucky” by defining an 11-year cycling based on only 17 years of accumulated data:
“However, the length of this cycle does vary. Between 1700 and the present, the sunspot cycle (from one solar min to the next solar min) has varied in length from as short as nine years to as long as fourteen years. Note, however, that of the 26 solar cycles during that three-century span, 21 had a length between ten and twelve years.” —source: https://scied.ucar.edu/learning-zone/sun-space-weather/sunspot-cycle
A range of 9 to 14 years is a variation of +/- 22% . . . does this mean the Schwabe cycle is regular or irregular?
Heinrich Schwabe did not define an 11-year cycle. He presented his data and said that about 5 years of many spots were followed by about 5 years of few spots. Nobody paid any atention until Alexander von Humboldt included his results in his monumental work “Kosmos.” Then several astronomers, among them Wolff, noticed that Schwabe’s period coincided with small changes in the magnetic field of the Earth.
Solar cycles are quasicycles or quasiperiodicities. It doesn’t mean they aren’t real, it means they have a complex cause. The same happens with tides. We understand what causes them, but to predict the tides a year in advance at an specific location requires complex calculations, that in the 18th-20th century were done with “brass machines,” the first of which was built by Lord Kelvin in 1867.
The Schwabe cycle can be anywere between 9 and 14 years, but its variability in amplitud is even bigger than in period, and during the Maunder Minimum it essentially became undetectable. I am convinced William Herschel would have discovered the 11-yr solar cycle if he hadn’t been so unlucky as to be in the Dalton minimum. Other longer solar cycles show the same behavior and disappear at times for centuries or even millennia.
Javier,
Thanks for your responses, but I do have to point out that in your post above of June 11, 2022 5:02 pm, your first sentence stated:
“. . . Heinrich Schwabe defined the 11-year solar cycle with 17 years of data.”
It was that statement to which I was responding, nothing more or nothing less. I admit I probably was taking that comment too literally.
sorry posted twice but now went into moderation
Any chance of recovery?
I went and read the new paper. Not a solar expert, and wanted to learn. It’s Fig 1 (covering the satellite era from which the new estimator model was developed) gave me pause.
The total max range of TSI variation in figure 1 is 1.8w/m^2, and there are ~four similar repeats of this peak to trough cycle. Now this should have a measurable cyclical affect on delta T IF TSI is a big climate deal. That is because the CERES observed TOA imbalance is ‘only’ about 0.71 w/m^2. So the natural TSI variation range is over twice the average observed TOA imbalance.
But no such TSI induced cyclic variation is observed in either Lower troposphere delta T (per UAH measurements) OR in CERES TOA imbalance. From which I conclude TSI reconstructions are not very important for ‘global warming’ arguments—pro or con.
I have not looked into TSI data recently but in past use to be two or three different sets of data giving different values. I think (people tell me I’m wrong) but the TSI as we know is a poor metric of total solar radiation -effect on climate relationship.
 ?
?
The ToA insolation intensity (power flux) varies significantly over an annual cycle and the sun has distinctly different views of land and water through an annual cycle. Land is a net energy radiator while ocean is a net energy absorber and that is only possible through heat transfer from ocean to atmosphere above land mostly through latent heat as evidenced by the net runoff of water from land back into oceans.
Precession is constantly altering the view that the sun has of Earth during the annual cycle. The northern land masses had 2W/sq.m lower sunlight in April in 1500 compared with 2020. Over the year, the northern land masses were 1.4W/sq.m down in 1500 compared with the 2020 level.
Climate change is an inevitable consequence of orbital mechanics causing changes in Earth’s orientation and distance to the sun. These factors have far greater significance than tiny variation in TSI or changes in atmospheric CO2 levels for that matter.
Wouldn’t orbital changes impact TSI?
Has a climate model with the 30c limit been made?
Of course, same way that CO2 impacts TSI.
/sarc
🙂
cheers
Jupiter is massive enough to influence the sun but Earth not so much. Earth’s orbital variation alters the intensity of solar E-M at the top of Earth’s atmosphere; not the so-called solar constant.
No climate model has a 30C clamp on ocean temperature. If they did that then any notion of runaway global warming disappears.
Correct. What is important is the annual variation at the top of the atmosphere due to eccentricity.
Also important is the hemisphere pointing to the sun when Earth is nearest and furtherest from the sun combined with the distribution of water and land over the globe.
And the key factor that needs to be included for climate analysis is that there is a firm limit on maximum open ocean surface temperature of 30C as well as a hard lower limit at -1.8C for any ocean water.
Actually there is a measurable effect on T from the solar cycle, and it is bigger than it should. Read Lean 2017 review were she explains. That’s why an amplification mechanism is required.
“But no such TSI induced cyclic variation is observed in either Lower troposphere delta T (per UAH measurements) OR in CERES TOA imbalance.”
The LT is modulated by the ocean and the ocean is modulated by TSI via accumulating ASR.
“…TSI reconstructions are not very important for ‘global warming’ arguments—pro or con”
It depends on how you use the TSI reconstructions. Starting with the Community Consensus Historical TSI (which has it’s own drawbacks) we can compute that the sun emitted about 21.5 more W/m2 during the solar modern maximum from 1935-2004 than over the previous 70 years from 1865-1934, because it averaged about 0.308 W/m2 higher TSI.
The Modern Maximum’s extra 21.5 W above the 70-year 1865-1934 total TSI translates into an estimated 1.4 °C expected temperature change from 1934 to 2004 using the Stefen-Boltzmann equation, assuming .7 albedo. ERSSTv5 rose >0.6 °C in that time, indicating the ocean still had a lot of that accumulated absorbed solar energy left over to emit after 2004.
Different TSI estimates were made by the post article authors but the bottom line won’t change.
That’s it in a nutshell. Higher TSI via sunspot activity drove global warming, not CO2.
A different calculation I just did using Stefan-Boltzmann resulted in an expected 0.9 °C temperature rise for the above scenario, still a 50% higher temp change than observed.
The S-B equation applies to circumstances where instantaneous radiative emission exists, whereas in the case of the earth with >70% ocean, the emission of absorbed solar energy can take up to 120 years. This puts a different perspective on using S-B.
Bob, you left out some highly crucial factors:
The spherical surface area of the earth (4 pi r2) is four times larger than the solar input area (pi r2). So you have to divide any quoted TSI changes by four to make a valid representation of w/m2 change over the earth’s entire surface.
Furthermore, 30% of TSI is immediately reflected away from the earth, so only 70% of any TSI change is actually seen as a real change of irradiance input on the earth’s surface. So you need to multiple any TSI change values you’ve quoted by a further factor of 0.70.
End result: actual TSI changes as seen by the earth’s surface are only (0.25)*(0.7) = 17.5% of the TSI changes you have quoted.
The +0.308 w/m2 higher TSI value you quote is therefore actually only +0.054 w/m2 as seen over the earth’s entire surface. Moreover, both of these values are much, much smaller than the roughly 2 w/m2 CO2 radiative forcing increase that has occurred over the earth’s entire surface due to human CO2 emissions.
This is all Earth Energy Budget 101 basics, well known for decades and decades.
This information clearly demonstrates that the claim “Higher TSI via sunspot activity drove global warming, not CO2.” is nowhere near correct.
Rustan mentions:
“the natural TSI variation range (1.8w/m^2) is over twice the average observed TOA imbalance (0.71 w/m^2).“
Rustan, there are some critical pieces missing here, which help explain even further your observation that we do not observe much if any temperature changes because of these TSI variations.
The spherical surface area of the earth (4 pi r2) is four times larger than the solar input area (pi r2). Thus any TSI variations need to be divided by a factor of four to make a valid representation of w/m2 change over the earth’s entire surface.
Furthermore, 30% of TSI is immediately reflected away from the earth, so only 70% of any TSI variation is actually seen as a real change of irradiance input to the earth’s surface. So any TSI variations need to multiplied by a further factor of 0.70.
End result: actual TSI variations as seen by the earth’s surface are only (0.25)*(0.7) = 17.5% of the quoted TSI variations. This is all Earth Energy Budget 101.
The natural TSI variation range actually seen by the earth’s surface is only 1.8*17.5% = 0.32 w/m2, which is less than half the quoted TOA imbalance. And this is a change that varies up and down year to year and decade to decade; it is not a constant imbalance. So it is not surprising that the effect of TSI variation is essentially unnoticeable in comparison to the CO2 induced radiative imbalance.
Anything, anything but CO2. Even a 0.01% TSI change, as long as it casts doubt on CO2.
Meantime, back on Earth.
CO2 climate forcing .vs. global temperature
From Grant Foster https://tamino.wordpress.com/
Resulting in:
Annual global sea surface temperature anomalies
Japan Meteorological Agency
But, but, whattabout the sun?
Even Hobbsians wouldn’t give CO2 as second thought if it weren’t carbon di-taxable.
I’ll type more calmly this time:
Even Hobbesians wouldn’t give CO2 a second thought if it weren’t carbon di-taxable.
Right, it is not sun warming Earth over the last 50 years. The question is rather about the little ice age and the maunder minimum. However…
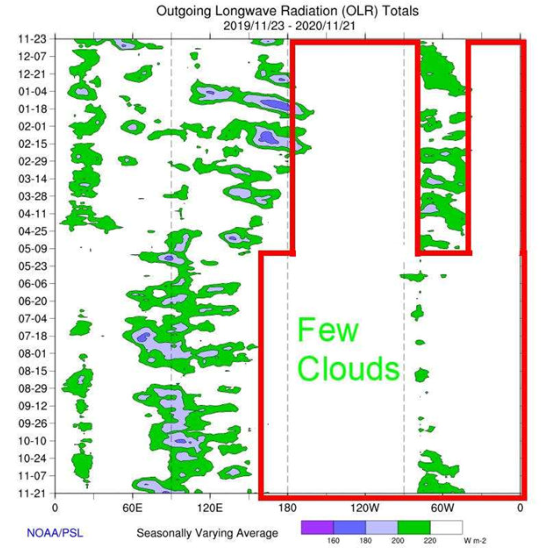
This result shows the increased cirrus coverage, attributable to air traffic, could account for nearly all of the warming observed over the United States for nearly 20 years starting in 1975
https://www.nasa.gov/centers/langley/news/releases/2004/04-140.html
That is an interesting read, especially since it’s on NASA website. Has anyone pursued that line of research or did those scientists get defunded?
No, it was only forgotton and “shelved”. However lots of new data have been gained over the recent pandemic. With lockdowns and up to 90% less air traffic, there was a dramatic decline in cirrus cloud coverage. From this we know the impact of contrails (and their blurred remainders) has been vastly underestimated.
Anyway I wrote a piece on it..
https://greenhousedefect.com/contrails-a-forcing-to-be-reckoned-with
The contrails story again masks the underlying natural reason for fewer clouds: less absorbed solar input for evaporation during the minimum.
.
Some people have even claimed the high cloudlessness in 2020 was due to less ozone caused by volcanic gas chemical reactions, which I reject.
Contrails do just that: They obscure the sky, reduce the amount of sun light hitting the water, and so reduce evaporation. Essentially the atmospheric water cycle is a self limiting process. The more clouds, the less evaporation, the less evaporation, the less clouds..
By adding artificial clouds on top of it, we down tune this whole cycle.
Like hysteresis; this is a favored idea but has problems. It looks like there’s a few variants of this idea, one with contrails, and another with just clouds in general. Both ignore something bigger.
Why would the La Nina area have the same basic spatio-temporal warming/cooling patterns today as in the far past before contrails?
The introduction of contrails hasn’t made the difference, although I know it’s popular to think so, especially if your source is Dane Wiggington, who just can’t recognize the natural drought effects of the solar driven La Nina, and puts all the blame on themtrails.
“This result shows the increased cirrus coverage, attributable to air traffic, could account for nearly all of the warming observed over the United States for nearly 20 years starting in 1975″
This is what NASA and others ignorantly said in 2004 in order to escape responsibility for not knowing the sun warmed the ocean, making clouds an independent variable.
NASA making clouds the controlling factor is pure, unadulterated rinky-dink science.
Ironically, a NASA Goddard scientist a few weeks ago explained at the Sun-Climate Symposium I attended how high cloud fraction was highly correlated to Nino34.
This means the majority of clouds follow ENSO, as a dependent variable.
My work indicates ENSO states are mainly tied to solar activity states.
You have of course seen Tony Heller’s 100yr chart of data manipulating differences from actual temperature readings and how THESE match the the rise in CO2.
So, what your saying is let’s ignore the sun.
Right…..
AW, what I said was very clear. Although the Sun is a factor, it’s contribution to AGW is much less than obvious. Please rebut.
Yes Rud! Everybody should make an easy calculation: From Fig. 3 of the paper in question one can see that the variation of TSI is about 1 W/m², this translates to 0.25 W/m² on TOA. If this variation has an influence on the GMST … what TCR gives a doubling of CO2 which leads to 3.7 W/m² ERF??
In no metric (SST, GMST, whatever) one finds the 11 yr cycle TSI-variation which is about 0.4 W/m² TOA. It’s not the sun!
and yet…
Early thread comment
“The sun is a variable star, Its variation in its main visible and IR bands isn’t great, hence TSI doesn’t fluctuate much. However its variation in the all important UV band is huge.”
followed by…
Bingo, along with possible impact on cloud cover.
“Only two things can impact the energy content of a system (earth water atmosphere) in a radiative balance, either a change in input, or a change in residence time within the system.”
Residence time of said energy is potentially a far greater GMT impact than the small change in TSI
We don’t know the long term decadal flux in cloud cover changes combined with ocean uptake and solar insolation residence time variation. The greater the change in residence time, the greater the energy content change of even a small variation.
I was replying to Lloydo
Nope.
As TSI variation impacts weather and SST in the short term, in a year or few years term.
It has to be considered, as that impact in the data must be filtered out, as in the climate data it consists as noise.
cheers
So, FINALLY, do we all now know the length of your record? I wonder what was going on with global temperatures before 1890? You do realize that Earth history is longer than 132 years?
Now reverse the dependent and independent axes and see how CO2 levels look as a function of temperature. And that’s the problem with the assumption that temperature depends on CO2. It’s just an hypothesis.
Loydo its just a coincidence that CO2 is rising in line with world temperatures.
Nicely played ser.
Uhhhh…..
correlation is not causation
No, but a whopping corellation is a good starting point. Quoting further from Foster about the graph:
“The correlation coefficient between the two variables is a whopping 0.9467, but what really counts is its statistical significance (which is not guaranteed by a large coefficient). In this case the significance is undeniable (with a p-value < 10-15).
you did not respond to Forrest G above.
I’ve said it before and I’ll say it again. Your correlation graph only shows that there is a correlation. Just like if you plotted postal rates, DWI, world population, etc. and get a correlation, there is no way to justify causation.
You want to PROVE your assertion. Show the math that CO2 gives one and only one temperature for each increase in ppm value. THEN, you’ll have something to hang your hat on. Until that time, CORRELATION DOES NOT PROVE CAUSATION.
Same tired old, long refuted, false “arguments” from Gorman, over and over and over and over and over and over and over again.
I’m not a religious man, but Proverbs 26:11 comes to mind.
Here’s one reference to the math that Gorman pretends does “not” exist:
http://www.globalwarmingequation.info/temperature%20increase%20eqn%20derivation.pdf
Your conceptions are faulty. Your logCO2-T plot using annual numbers hides a very important thing: CO2 lags SST, so it can’t be the driver of ocean warming, it is a temperature response.
The 12mo∆ ML CO2 lags the 12mo∆ SST ≥25.6 °C by 5 months, and when you integrate the 12mo∆ SST ≥25.6 °C and multiply by the increase in ocean area with SST ≥25.6 °C, you get a near linear fit to both the annual ML CO2 and JMA OHC since 1959, for r=.99 and r=.96, respectively, which for both yield p < .00001, significant at p < .01.
Look for my sun-ocean plot in comments here to complete the picture of a sun-driven climate.
Since CO2 lags temperature significantly with >99% confidence, we can now know your first plot axes need to be reversed to show the true relationship between logCO2 and temperature.
Are you saying the ocean is currently a net CO2 source?
Thanks, Leif. And thanks Charles for posting this here at WUWT.
Regards,
Bob
To all the folks who think that TSI is not the cause of anything and that some other solar phenomena are what “are doing it”, we must note that variation of TSI is completely understood as due to the variation of the Sun’s magnetic field [which is following the group [and sunspot] number] and that all other solar phenomena are also following the magnetic field]. TSI, however, is where almost all the energy is, hence the importance of TSI.
Dr. Svalgaard,
The variation of ~1W/m^2 out of 1363 does not, to me, sound like there would be much effect on anything here on planet earth. Am I missing something?
No. You are quite right. That is also the conclusion of the paper.
But there are people who claim a much larger variation, partly due to their wish that anything BUT CO2 is the cause of ‘climate change’.
see e.g.
https://wattsupwiththat.com/2021/11/23/solar-variations-controversy/
CO2 is only a variable. The objection is mostly due to claiming CO2 as a climate CAGW driver, (Rarely a good idea to parrot Lloydo)
TSI is only a variable. Flux in TSI wavelength is a variable. Flux in TSI wave length is a variable. Flux in WL residence time is a variable.Flux in cloud cover is a variable. Flux in residence time of TSI input, due to many factors is a large variable, perhaps much greater than the small change in TSI.
“To all the folks who think that TSI is not the cause of anything and that some other solar phenomena are what “are doing it”, we must note that variation of TSI is completely understood as due to the variation of the Sun’s magnetic field [which is following the group [and sunspot] number] and that all other solar phenomena are also following the magnetic field]. TSI, however, is where almost all the energy is, hence the importance of TSI.”
You can say that again and again.
Hi Leif, missed you at the Sun-Climate Symposium. OTOH, someone there said TSI comprises ~99.8% of the total incoming solar energy, excluding the solar wind.
I’m sure that Javier, given his total lack of this perspective, will continue to hammer away at the 0.2%, continuing to think the tail wags the dog.
“But there are people who claim a much larger variation, partly due to their wish that anything BUT CO2 is the cause of ‘climate change’.”
I’m not one of those people you referred to, as I live within the strict limits on TSI learned from your solar activity floor work.
I don’t “wish that anything but CO2 is the cause of climate change”. I know it isn’t because I found it was the sun, and you can know it too.
If you use Greg Kopp’s community-consensus historical TSI, even though we both know it isn’t as good as it should be (yet), there was a 0.308 W/m2 average increase in TSI during the 70 years of the Modern Maximum over the previous 70 years.
My low-ball estimate for the expected temperature change over this period using the Stefan-Boltzmann equation and this TSI diffference is 0.9 °C, which is still a 50% higher change than observed from 1935-2004.
Of course this doesn’t take into account the delayed emission of ASR that takes place over decades, but it shows us the physics of a sun-warmed climate is strictly bounded by simple known physical laws.
On another note I object to the article authors calling these centennial minimums a ‘grand minimum’. Don’t they know the current 30y SN is over twice Usoskin’s grand solar minima threshold?
Weber, your analysis leaves out the 4x spherical geometry factor and the earth’s albedo factor. These are basics of Earth Energy Budget 101.
Actual irradiance changes as seen by the earth’s surface are in reality only 17.5% of what you’ve quoted here. Your analysis is therefore off by more than a factor of five.
Further explanatory details are included in a reply to one of your other duplicate posts in these threads of this (proven wrong) analysis.
I do not doubt you are ‘right’. But the result does not show up much in the observational climate data. As specifically noted. So a lot more must be going on.
A lot more is going on. I might explain after the summer, when I have the time to write on this.
I for one would very much welcome that Javier. I still signpost your astonishing Nature Unbound series, which really should become a book, to friends seeking an understanding of the deep cycles driving natural variation.
The solar-climate mechanism is known and it is in the bibliography. The amplification mechanism was first proposed by Colin Hines in 1974. Joanna Haigh included the effect of ozone when she developed the “top down mechanism” in 1991, for which there is observational evidence, and it is present in reanalysis and models. That mechanism does not rely on TSI because it is due to the 200-315 nm band that is absorved at the stratosphere.
TSI is irrelevant for the sun-climate effect. UV is where the action is.
“ because it is due to the 200-315 nm band “
that radiation varies just like TSI [and the sunspot number] and has thus not increased significantly the past 400+ years, so ‘no cigar’
It varies 10 times more than TSI.
no, because what matters is the relative variation.
If TSI in year A is the same as in year B 300 years later, so will that UV band also be the same.
How do you know what matters for the solar effect on climate if you don’t believe on it?
Paleoclimatology clearly shows that the longer the time the sun spends in low mode the stronger the effect on climate.
So what matters for the effect of the Maunder Minimum is that the UV level was low for 70 years, not how low it was. The effect is clearly cumulative.
wishful thinking. Perhaps you have some reference to cite on this particular issue.
“ if you don’t believe on it?”
belief is not science.
No, but scientists pursue what they believe on, not what they don’t believe.
That’s why you could never discover how solar variability affects climate, even though you were quite close in 1973. Tsk, such failure.
Personally I would love to know the residence time of disparate solar input into the oceans, and the affect on cloud cover of changes in solar insolation, and that affect on energy input residence time as well.
I think there is a lot we do not know. A strong flame on a thin large pot of water may keep it hot, but not boiling. A small flame on a thick insulated covered pot may cause the water to boil. Residence time matters!
This could potentially have a long time effect on ocean heat content depending on unknown energy residence time and cloud cover change.
Especially true when the residence time of some solar input to the oceans is multi decadal, and potentially multi centennial.
Important study from 2017 on climatic and weather effects of O3 and UV radiation. One among many:
https://www.nature.com/articles/s41598-017-05111-8
We use reanalysis and observational data to link the lower stratospheric ozone regulation of the ultraviolet radiation (UV-B) component of solar energy to ENSO modulation. Results indicate that during ENSO extremes, the Walker Circulation (WC) and Brewer Dobson Circulation are related to lower stratospheric ozone alterations east of the date line over the Pacific. These in turn are linked to upper tropospheric anomalous dipole temperature patterns on either side of the equator. The ensuing changes in geopotential height values do not only drive equatorial zonal wind anomalies in the upper troposphere that are reversed at the equatorial surface, but also impact on the intensity of the South Pacific High circulation. When the WC is enhanced, a La Nina type of circulation is indentified but if the circulation cell is inverted, the anomalous circulation results in an El Nino. Though the anomalous lower stratospheric ozone peaks during austral summer it is significant throughout the ENSO lifecycle. Hence, ENSO structure and variability are mainly linked to the lower stratospheric ozone instigated internal dynamics of the Pacific atmosphere. The ENSO forcing most likely originates from the ozone related regulation of the incoming solar UV-B radiation rather than the Pacific Ocean surface.
Yep. The effect of solar variability on ENSO is very clear. First described by Roger Y. Anderson in 1990, and more famously by Theodor Landscheidt at the turn of the century. I wrote a couple of articles about it here and at Judy Curry’s place. It is undeniable yet it keeps being denied.
You mean that the undeniable science deniers are CACA advocates?
Who knew?
Shocking!
Thus the “Landscheidt Minimum” we are no in?
To me it is the “Clilverd Minimum”, as Mark Clilverd was the first to my knowledge that predicted that SC24 and SC25 were going to constitute an extended minimum, in 2006.
Clilverd, M.A., Clarke, E., Ulich, T., Rishbeth, H. and Jarvis, M.J., 2006. Predicting solar cycle 24 and beyond. Space weather, 4(9).
If anybody knows of an earlier precise prediction of an extended minimum at this date with this duration I’d love to hear about it.
Lots of people predicted a solar grand minimum. They were wrong. Clilverd got it right.
It is weather, not climate!
While a small share of TSI, even at its highest, UV differs qualitatiuvely from the rest of the sunshine spectrum. And its variation range is far wider than visible and IR light.
UV makes and breaks ozone, for starters, with a profound effect on air pressure, wind patterns and probably oceanic oscillations. As well as being a GHG and having biological effects.
If you thought that science was certain – well, that is just an error on your part.
Richard P. Feynman
Hello, I apologize in advance for this commen not having anything to do with this post. I’ve been on here actually trying to get some help or advice. I feel very uneducated when it comes to the topic of climate change. To be honest I never was very good at science or math and am very on the fence on this subject mostly because I don’t understand it regardless of how much I’ve tried researching and reading about it, mostly trying to find things that debunk the claims made by the alarmists for my own peace of mind because I have what is now being referred to as eco-anxiety when it comes to climate change. It’s on my mind constantly 24/7 and I’m hoping to find an ease to my biggest worries here. Those worries being the claims that are being made by Guy Mcpherson. I’ve commented on a couple of other posts about this and have been advised to try and develop my own opinion. Being asked where Guy gets his science and told to do some of the work myself. What I’m about to put I typed on a previous post but that post is about 6 days old now and I guess people stopped looking/commenting on it. Before I put it please know that in no way am I a troll or some alarmist. I want to fully believe the skeptical side of this but with so many alarmist claims and so many who agree and say this is happening and argue against the skeptics it makes someone with a poor anxiety ridden uneducated mind like mine difficult to know which side to stand on. And then with Mcpherson and his claims that we’ll all be dead by 2026 because of methane and positive feedback loops and stating that other scientists are being silenced and not able to tell us how bad things are is very worrysome on my mind, and the fact that so many others agree with him, and say he’s spot on definitely doesn’t help. I’m sorry to go into so much detail, just explaining why I’m doing what it is I’m doing here. Anyways, what I typed on a previous post was this: So I took that advice and decided to google ‘Guy Mcpherson data’ and came across this Climate-Change Summary – Nature Bats Last (guymcpherson.com) Some of the links listed in that article no longer work due to them being some years old I guess. I started taking the liberty of going through and finding the ones that still do so I could post them here but it is a very long article with tons of links some of which I’ve started to go through. I’ll admit a lot of the wording goes way over my head and I wouldn’t be sure of where to begin trying to do my own research to try and find other research that debunks the alarming claims. I’m going to keep looking but any looking at the article and responding would be greatly appreciated. Just want to show I am taking your advice but do appreciate any input against the article or any of the links in it.
That whole site is batshit crazy.
Could you give detailed specifics as to why?
The simplest truth as far as runaway global warming is concerned is that open ocean surface CANNOT exceed 30C for sustained periods beyond a few days. It is a simple fact that is observed everywhere open ocean water exists as updated daily here:
Ask anyone who disputes this to show you evidence that is it untrue.Take any open ocean surface and show you that it exceeded 30C for a year.
There are examples like the Persian Gulf that can get monthly surface temperature as high as 35C but they are not open ocean water like the three major Oceans.
Some may reference million year old proxies that indicate the ocean warm pools reached 33C but this was at a time when the atmosphere was significantly heavier than present.
The reason for the temperature limit is due to cyclic deep convection that gets established over warm ocean surfaces (it is often observed as monsoon). At 30C, the persistence of cloud limits the surface insolation to match the heat loss from the surface; meaning it cannot get any warmer.
If there was a volcano sitting below the surface warming the surface water to 32C or more, the surface would never get sunlight. Clouds would always be present.
Others confuse this simple understanding with things like lapse rate or “greenhouse effect” but these are just complexities that confuse most people – particularly climate scientists.
The paper linked here will never get published on anything but skeptic sites because it does not suit the CC beliefs, but the data and physics have never been disputed:
http://www.bomwatch.com.au/wp-content/uploads/2021/08/Bomwatch-Willoughby-Main-article-FINAL.pdf
I cannot dispute the fact that MORE ocean surface can exist at 30C and that will lead to the average temperature increasing- there is variation in extend over an annual cycle. However I do know that no climate model limits ocean surfaces to 30C. They have absurd temperatures, some as high as 40C. That is the only way they can achieve scary global warming.
If you want more information you can get my email from Charles.
There are good sites that provide good climate/weather data. Today the Bay of Bengal is warm. The link shows the temperature at a location in the Bay and the colors give an immediate indication of temperature across the global oceans:
https://earth.nullschool.net/#current/ocean/primary/waves/overlay=sea_surface_temp/orthographic=-285.91,11.78,331/loc=88.563,17.312
This website also calculate the Convective Available Potential Energy that is the amount of energy available to drive deep convection:
https://earth.nullschool.net/#current/wind/surface/level/overlay=cape/orthographic=-285.91,11.78,331/loc=88.563,17.312
The CAPE at the point in the Bay that is at 29.4C is presently at 3523J/kg. Once the instability occurs, that energy will force approximately 1,500kg/sq.m of air from below 8.000m to above 8.000m, reaching peak velocity of 300kph. When it the instability is triggered, it is a significant atmospheric event.
The 30C maximum ocean temperature issue is the home run against the CAGW circus, it at the very least defuses it to an issue of AGW if it exists at all.
Hugely supported with Ice cores, foramin filled sediment cores etc. through massive changes in solar, ocean currents and very hot epochs to the current 2.6M year ice age period mercifully punctuated by inter glacial periods.
Yes, I agree. It is quite easy to very with data being available on a daily basis across all oceans.
If you understand the process of deep convection then it is easy to find the locations that overshoot the temperature limit for a month or two. These are semi-enclosed bodies like the Persian Gulf. Even the Gulf of Mexico can be above 30C for a few weeks. However open ocean water only overshoots the limit for a few days before deep convection sets in and cycles..
By topic, this site has multiple articles per topic going back many years. This site also has a research topic window. Try using it yourself instead of asking the rest of us to do your basic research work for you.
If you’re (by your own admission) not good at science or math, how do you expect to understand any of the answers, either pro or con?
The site you linked to is a typical alarmist web site with so many claim it is hard to know where to begin. I followed one argument that claimed the IPCC said something and provided a link. That link was another article that did NOT say that the IPCC had said anything of the sort, it just said even the IPCC has admitted blah blah blah. The specific admission was supposedly in AR5, I’ve read the relevant chapter in AR5 and it says no such thing.
It would take a ton of work to go through every claim, but alarmist sites follow that pattern. You track down the reference to its actual source and discover no such thing.
But put all that aside for the moment. The world is going to end in 2026? Really? Four years from now? The first prediction (that I know of) that we only have 10 years left to fix the climate was 1989. There have been many since including AOC just a few years ago (she walked it back later). This one was made (apparently) in 2016 and has no more merit than the one in 1989.
It is not challenging to appreciate that open ocean surfaces cannot exceed 30C for more than fleeting period and then ask anyone who disagrees to prove that any actually does exceed 30C over an annual cycle.
Anyone who tries to show the 30C limit does not apply will prove themselves in need of a clue quite quickly.
ALL climate models are WRONG because they forecast/have some open ocean surface exceeding 30C on a sustained basis. That is the only way that they can predict runaway global warming but it is simply a physical impossibility on Earth’s oceans with the present atmospheric mass. Attached shows the warmest part of the Pacific agains one of the models output for the same region.
The 30C limit has been observed in scientific literature since at least the 1970s when CO2 was 280ppm. Now the CO2 is 420ppm and the same 30C limit is still evident. The 30C limit has no sensitivity to CO2.
RickWill, the climate models do not predict runaway global warming. There’s plenty of things wrong with the models but there is no sense in trying to falsify them by saying they claim things they do not.
Well , not so sure. The climate models ( and published papers based on them) predict direct GHG warming and POSITIVE feedbacks that will cause catastrophic harm to human life on earth and large extinction events,
Look at the temperature trend in the bottom chart from my comment above. The temperature keeps rising at this rate for centuries on the basis that CO2 keeps rising at the current rate.
The attached chart below shows the temperature predicted in the Nino4 region from the CSIRO model out to 2300. If you think that is not runaway global warming then fair enough – but I do. However I know it is a physical impossibility on planet Earth.
I think he’s Griff’s alter ego, just a bit more honest here and there..
Bobby,
At the top of this page, on the right side, is a list of other relevant web sites. I suggest you start by clicking on “Dr. Roy Spencer”. I think you will find his presentation of climate issues very readable, even to those of us who are scientifically challenged.
Cordially, Juan Slayton.
Your reaction is exactly what the leftists want — fear and anxiety. Those emotional elements are how they will attempt to control you, your thoughts and your actions. What you need do is just look at their record and then just go about living in peace. I’m near 80 years old and taught science for more than 30 years. I’ve lived through every known piece of BS that the left has handed out. My advice to calm yourself is to carefully read what the greenies have predicted in the past and then ask yourself, “If they haven’t gotten a single prediction right in the past 60 years or more, why should I give them any credence with their predictions now?” Here’s a great start: https://cei.org/blog/wrong-again-50-years-of-failed-eco-pocalyptic-predictions/ Take your time and read each piece and evaluate their latest crap in light of the crap they’ve dealt in the past. No need to know any science or math. Just use common sense. They dealt BS in the past and they’re dealing BS now.
Bobby K.
You can put your mind at ease. CO2 has zero climatic effect, and TSI effects are too small to be of any concern (did not cause the Maunder Minimum, e.g.).. .
Earth’s climate is totally driven by the amount of SO2 aerosols circulating in our atmosphere, primarily of random volcanic origin, but also from industrial activity.
Increase the amount of SO2 in the atmosphere, and it cools down. Decrease the amount of SO2 in the atmosphere, and it warms up. It is that simple.
However, I would add that net-zero will cause temperatures to soar (in the absence of VEI4 or larger volcanic eruptions), because its intent is to abandon the burning of fossil fuels, which .produces both CO2 (no effect), and SO2 (major effect, since it cools the planet).
For supportive information, see my papers on Google Scholar. ..
“his claims that we’ll all be dead by 2026 because of methane”
well yes if you keep eating those heinz beenz sure you might be dead by ’26, cos farting can eventually do you in, and all your friends and neighbours..
Bobby, simple CAGW refutes….
There is not a consensus. ( See The Oregon Petition, See NIPCC. See CO2 Web site. See published critiques of flawed 97 percent surveys)
Per CAGW theory the troposphere has only warmed one /third of projections. (See UHA satelite plot graphics compared to CAGW models.)
All crops worldwide have about a 20 percent increased production of bio-life with zero additional water or land required and are more drough resistant and frost resistant. 9 Due to going from 280 PPM to 415 PPM CO2.) See CO2 science.
Zero increase in hurricane or cyclone intensity.
Zero increase in rate of SL rise. ( See tide gauge papers adjusted for land movements, and flaws in satellite measurements.)
Acid oceans are not happening. (See NIPCC peer reviewed paper summaries and references for every or any CAGW fear based alarmist report.
Our problems are man made, but not CO2 based, Do what you can for you and yours, and try to make your concerns based on what you can control, not what you cannot control.
All the best…
Greetings, Bobby:
I’m a Geologist, so I would first ask you to calm yourself, and do not submit to the intimidation of the control by fear that alarmists peddle. Others here have said, succinctly, that the fear is simply a way to control you, and force you submit to their desires, which are total control over you and everything you do.
Next, I would ask you to consider that the Earth is well over four billion years old. Alarmists, for whatever reason, will only discuss (at most) a few thousand or even a few hundred-thousand years of Earth history (Gore, in his movie, referenced the Vostok ice core, claiming that the fact that carbon dioxide levels shown in the core were all low, we should all be alarmed about some flame-a-geddon happening, because we’ve gone above the levels during the Late Pleistocene).
If you can tolerate the language, there is a great George Carlin routine, “Saving the Planet”. He humorously debunks almost all alarmist claims.
Once upon a time, there was a fabulous poster here named Bill Illis. He created some truly amazing charts, one of which was the past 750 million years, and it showed the (lack of) relationship between carbon dioxide and calculated Earth temperature. For example, from the publication ‘Geological Time Scale 2020’ (Gradstein, Ogg, Schmitz, and Ogg), we know that the Cryogenian Period (late NeoProterozoic) had carbon dioxide levels measured in PERCENTS (data are disputable, so depending upon which data set one likes, it could have been a little as four percent of the atmosphere, or as much as thirteen percent), yet while all this carbon dioxide was around, the Earth was in a near-global ice age (hence the name, Cryogenian Period), for tens of millions of years.
Further, in the Hirnantian Epoch (late Ordovician), and into the early Silurian, there was another global ice event (several million years long), at a time when the carbon dioxide concentration in the Earth’s atmosphere was about 4000 ppm (roughly ten times what it is today).
One of the best pieces of evidence is Bill’s chart; almost any search engine should find it for you. I would download it, print it (and make sure you do proper attribution for it, OK?), and show it to anyone who thinks there’s some relationship between Earth temperature and atmospheric carbon dioxide concentration. Short answer, calming answer: there is no relationship between the two, except that Vostok and EPICA tend to show that temperature drives CO2, and not the other way around.
Alarmists have cause/effect directly bass-ackwards.
I would also reference you to the great posts of Jim Steele here, and to Anthony’s fabulous new book. These should contain the equivalent of a graduate degree in climatology to get you started. Please hang in there. Do not give in to the fear tactics being used against you. Listen to the message(s) here that will assure you that your “carbon footprint” is not harming anyone or anything. Live your life to the fullest: everything in moderation, and without guilt.
Thanks, Bobby; may you know wisdom and peace, and good health all your days,
Vlad
Thank you for your words, yes I’m a very big fan of Carlin, very familiar with his stand ups and the routine you mentioned. My fears aren’t exactly related to the condition of the planet itself. I have no doubt that the planet will be just fine. My fears develop from what alarmists say will happen to humanity but comments on here do help with that. Anxiety and chemical imbalances are definitely not fun. Now if someone could explain or show why here in South TX we’re having much warmer than normal temperature for this time of year that has nothing to do with global warming that would be great. We’re having heat advisories and are already hitting the triple digits when that usually doesn’t happen until some of July and most of August. Local weather reports stating unseasonably warm weather and how we’re 17 degrees above the normal average for this time of year and it doesn’t look to be stopping anytime soon. If I try to look online why it’s already this warm, results I get of course mention climate change so if there’s another scientific/mathematical explanation as to why this is happening that has nothing to do with that I would really love to know what that is.
BobbyK
If you really want to learn about this topic, then go learn from the best of the best:
the major scientific institutions, like the U.S. National Academy of Sciences or the UK Royal Society. These are among the most prestigious scientific organizations in the world.
Here’s a link to the UK Royal Society’s primer in climate change:
https://royalsociety.org/topics-policy/projects/climate-change-evidence-causes/
The “evidence” the Royal Society adduces to support its assertions seems to be entirely based on models.
False. As usual.
There were numerous predictions made, decades ago, of how the climate would change due to human emissions, based on just simple principles of atmospheric physics. Pretty much all of those predictions have actually been observed over the intervening decades.
That’s pretty much the very textbook definition of a successful hypothesis.
Meanwhile, the “evidence” that far too many so-called “skeptics” bring to the table often consists of little more than “Nuh Uh because I say so”.
It is important to know that the centennial solar cycle that the paper describes was discovered not in the sun, but in the climate, here on Earth. Andrew Douglass was an astronomer that developed dendrochronology (dating through tree rings). An entire subfield out of one man’s effort. He noticed that tree rings followed solar activity, and in the 1910s he described a centennial cycle in sequoia ring width that he called the triple-triple solar cycle (9 times the 11-year cycle). You can see it by yourself because his book:
Andrew Douglass (1919) “Clymatic Cycles and Tree Growth. A study of the annual rings of trees in relation to climate and solar activity”
Is available for free in the internet.
https://archive.org/details/climaticcyclestr02douguoft/page/122/mode/2up
How do you like that? The first solar secular cycle, that this article now supports, was discovered through its effect on climate, on the Earth. Then go explaining that the sun has no effect on climate. You are not just an ignorant of how it happens, you are a denier for saying it does not happen.
The sun might not have much memory, but the Earth does.
CitationLaMarche, Jr., V.C., Fritts, H.C. 1972. Tree-rings and sunspot numbers. Tree-Ring Bulletin 32:19-33.
AbstractTree-ring series that record climatic variation have long been of interest for study of possible effects of solar variability on terrestrial phenomena. Spectral analysis, harmonic dial analysis, digital filtering, cross-correlation and principal component analysis were used separately and in combination in an attempt to detect relationships between the annual Wolf sunspot numbers and ring-width indices, primarily from western North America. The results show no evidence of significant, consistent relationships between tree-ring data and sunspot numbers.
https://www.fs.fed.us/psw/cirmount/meetings/mtnclim/2010/talks/pdf/Berger_Talk2010.pdf
“(Nothing of note is seen at ~100 or ~200, incidentally, where sunspot and aurora observations suggest solar power.”
Analyses not properly done.
Breitenmoser, P., Beer, J., Brönnimann, S., Frank, D., Steinhilber, F. and Wanner, H., 2012. Solar and volcanic fingerprints in tree-ring chronologies over the past 2000 years. Palaeogeography, Palaeoclimatology, Palaeoecology, 313, pp.127-139.
In this study we compile and evaluate a near global collection of annually-resolved tree-ring-based climate proxies spanning the past two millennia. We statistically assess these records in both the time and frequency domains for solar forcing (i.e. Total Solar Irradiance; TSI) and climate variability with emphasis on centennial time scales.
the “volcano free” temperature records show significant periodicities near the DeVries periodicity during the entire past 1500 years, further pointing to solar mechanisms and emphasising the need for solar related studies in the absence of strong multi-decadal volcanic forcing.
“significant periodicities near the DeVries periodicity during the entire past 1500″ the DeVries period is not ~100 years but 200…
The 200-yr solar cycle is more easily detected during the LIA in tree rings of the northern hemisphere due to the effect of solar grand minima that took place every 200 years.
But the fact remains that Douglass detected the 100-105-yr solar cycle in sequoia rings in 1919:
https://en.wikisource.org/wiki/Climatic_Cycles_and_Tree-Growth/Chapter_8
“But the fact remains that Douglass detected the 100-105-yr solar cycle in”
Fact?
A claim is not a fact. Modern analysis of his data does not alidate his claim.
https://www.fs.fed.us/psw/cirmount/meetings/mtnclim/2010/talks/pdf/Berger_Talk2010.pdf
“(Nothing of note is seen at ~100 or ~200, incidentally, where sunspot and aurora observations suggest solar power.”
As usual you can’t be trusted. The “nothing of note…” quote refers to Quinn 1992 study about El Niño. Slide 18 in your reference, which is the sequoia data of Douglass, shows a clear centennial band.
What Douglass saw in sequoia rings is there, and Berger confirms it.
Thank goodness there’s someone of sanity around (LEIF).
TL;DR is the temperature of Earth goes up and down in step with the Sun’s energy output, duh.
Table 1 above is blank, just an empty grid.
TSI is now generally accepted to be 1361 W/ sq.M.
https://agupubs.onlinelibrary.wiley.com/doi/full/10.1029/2010GL045777
Leif,
Some years ago I copied this graph of TSI to demonstrate
the separation of TSI results from different satellite systems. The values
cover a range of about 15 Wm-2.
http://www.geoffstuff.com/toa_problem.jpg
You are now quoting a TSI with Root Mean Square Error (RMSE) of 0.17 Wm-2.
In order to arrive at a composite TSI value, there would have to be adjustment to the raw spread of 15 Wm-2. It is plausible that such adjustment required a subjective preference or weighting of the satellite data to produce a preferred value.
In my book, if you do this, you have to recognize the uncertainty involved in that that subjective adjustment. It is simply incorrect to quote your RMS range as if it was a total range of uncertainty that meant something, if that is what you seek to do. You must include an estimate of the error involved in the choice of one satellite system over another, which includes a component of guesswork. It is hard to apply statistics to guesses.
The next satellite to be involved, improved by previous satellite experience, has a probability of creating a new baseline value of UHI which differs from your present preferred estimate by more than your Root Mean Square Error (RMSE) of 0.17 Wm-2. This has happened with each new satellite shown in the graph above.
What do you do then? Geoff S
The spread was due to various systematic errors [construction defects,] not indicative of the inherent uncertainties. This is well known and understood.
Leif,
Care to speculate about “What do you do then?” Geoff S
“such adjustment required a subjective preference or weighting of the satellite data to produce a preferred value.”
Not really. The spread is due to systematic effects of faulty construction. Once these are understood, they can be removed from the series.
Leif,
re subjectivity, you might be depending on different reports to mine. For example, Finsterle 2021 writes –
“The instrument degradation is then assessed by comparing the measurements of the active channel to the occasionally operated back-up channel(s). The exact procedure is a matter of personal judgement by the instrument team and is often evolving over the lifetime of each experiment. Correction of degradation is particularly important when comparing and/or combining the TSI measurements from different missions into a single composite time series. During the last 3 decades, different groups have produced individual TSI composites from different TSI data sets, based on different assumptions and often using personal judgement when processing the data sets4,5,12.”
The total solar irradiance during the recent solar minimum period measured by SOHO/VIRGO | Scientific Reports (nature.com)
So, can you link me to a paper where such subjective judgement is not used, please?
……………………….
There is another matter apart from homogenization of various satellite data. It leads to the fundamentals of how you know that your final value is absolutely correct and not merely correct relative to miscellaneous measurements. Some papers note traces to international radiation standards. Balenzategui 2022 notes inter alia that –
“Correspondence between WRR scale and SI radiometric laboratory scale (based on absolute cryogenic radiometers) have periodically been checked [25–29]. In this way, traceability to WRR automatically provides traceability to SI units. A deviation of 0.3% was usually applied for accounting for the difference between scales [28]. Nevertheless, the status of the WRR scale is currently under review by WMO and CIPM, because of some deviations found in the last comparisons [10,29,30]. The shift between scales is temporarily solved by the application of a correction or transfer factor. Recent intercomparisons and Solar 2022, 2 160 tests with new instruments are showing that compatibility between WRR-SI scales could be solved soon [29,31,32].”
Are we to assume that your work has now progressed beyond this uncertainty?
The “pure” method to homogenise data from 2 instruments after the event is to build a new system, to reproduce the new and old instruments and fly it in the one new satellite. I cannot find that this has been done. Until it is, we have to rely on methodology that does involve subjectivity, which is when you cannot continue to use traditional statistics to express your errors and uncertainties.
………………………..
I am pressing this point of uncertainty because of past experiences with the difference between 2 large numbers, each with their own uncertainties. Solar in minus solar out in the global system means roughly 1361 minus 1360 gives 1 which is the Wm-2 difference that leads to Earth warming, not cooling. If the TSI is really 1362, for example, then text books need to be retracted and a whole set of energy policies modified.
The literature is replete with different estimates of TSI. Kopp & Lean January 2021 note that –
“Features not easily attributable to solar activity include an annual cycle that is nearly in phase with the Sun-Earth distance in ACRIM III data, and 90-day spikes in the VIRGO data coincident with SoHO spacecraft maneuvers that are most apparent during the 2008 solar minimum. Disagreement among overlapping observations, as apparent in Figure 3, indicates undetected drifts that suggest the TSI record is not sufficiently stable to discern solar changes on decadal time scales. For example, Figure 3b shows that only the ACRIM composite shows irradiance increasing by ∼1 W m−2 between 1986 and 1996; if real, the solar origins of this increase are ambiguous since it is also absent in the model.”
https://doi.org/10.1029/2010GL045777
………………………………….
Leif, what feature in particular in your quoted paper here leads you to confidence that this paper resolves the abundanct TSI uncertainties being expressed by recent authors? All the best Geoff S
Satellite instruments aren’t perfect and also deteriorate under harsh conditions.
My goof, it is TSI not UHI of course. Geoff S
The Sun is a constant.
CO2 is the cause of any temperature change.
Temperature during this interglacial was constant until humans made CO2 to increase.
This is what this paper proves?
No, not at all.
Just that variation of TSI has not been large enough to explain climate change the last 300+ years. So go look elsewhere for what you believe is the culprit. There are plenty of ‘know-it-alls’ out there who are peddling their favorite pet theory. We have met some in this post already.
TSI might not be the culprit. But that doesn’t exonerate the sun from benefitting humanity coming out of the Little Ice Age.
Interesting. Has anyone done any research into the effects of interplanetary dust on our radiation budget?
interplanetary dust is not, at this point in time, taxable ….
How Was This Missed By Watts Up With That?
The revised Second Law of Thermodynamics, where ‘back radiation’ (the foundation upon which ‘climate change’ stands) is present in the Earth’s Energy Budget…
https://www.nasa.gov/feature/langley/what-is-earth-s-energy-budget-five-questions-with-a-guy-who-knows
But missing is the ‘back radiation’ on the left side of the graph for the incoming radiation
(77.1 Wm2) that’s directly absorbed by the atmosphere. Opps!
NASA’s earlier graph of the ‘Earth’s Energy Budget’ affirms the Second Law of Thermodynamics by omitting ‘back radiation’…
https://www.nasa.gov/pdf/62319main_ICS_Energy.pdf
I’m not sure what the concern is here. Each of the 3 layers balances with a +0.6 W/m2 uptake at the surface and TOA.
0 = 163.3 – 398.2 + 340.3 – 18.4 – 86.4 – 0.6
0 = 77.1 + 358.2 – 169.9 – 29.9 – 340.3 + 18.4 + 86.4
0 = 340.4 – 77.0 – 22.9 – 239.9 – 0.6
I’m also not sure what the concern is with the 2LOT since the flow of heat Sun => Surface => Atmosphere => TOA => Space is consistent with it. Note that the 2LOT does not say that bodies cannot radiate.
Also notice that the atmosphere is radiating at 169.9 + 29.9 = 199.8 W/m2 upward and 340.3 W/m2 downward for a total of 540.1 W/m2 which matches the uptake of 77.1 + 358.2 + 18.4 + 86.4 = 540.1 W/m2. So that 77.1 W/m2 of absorbed solar radiation is being shed by DWIR and UWIR as expected.
“All weather on Earth, from the surface of the planet out into space, begins with the Sun. Space weather and terrestrial weather (the weather we feel at the surface) are influenced by the small changes the Sun undergoes during its solar cycle.
At Ultraviolet or UV wavelengths (120 – 400 nm), the solar irradiance variability is larger over the course of the solar cycle, with changes up to 15%. This has a significant impact on the absorption of energy by ozone and in the stratosphere.”
Comparison of UV solar activity in the three most recent solar cycles (SC) 22-24. The thick curves show the Mg II index timeseries twice smoothed with a 55-day boxcar. Dates of minima of solar cycles (YYYYMMDD) were determined from the smoothed Mg II index.
The emission core of the Mg II doublet (280 nm) exhibits the largest natural solar irradiance variability above 240 nm. It is frequently used as a proxy for spectral solar irradiance variability from the UV to EUV associated with the 11-yr solar cycle (22-yr magnetic cycle) and solar rotation (27d).
The most obvious and large weather variation is the seasonal variation of weather… and;
Nope, that is not because of TSI or any other Sun variation there.
Besides, weather is not climate.
cheers
The analysis presented is meaningless when discussing 4 centuries of TSI adjusted to 1 AU, as though the earth orbits the sun in a perfect circle.
Abstract
We use reanalysis and observational data to link the lower stratospheric ozone regulation of the ultraviolet radiation (UV-B) component of solar energy to ENSO modulation. Results indicate that during ENSO extremes, the Walker Circulation (WC) and Brewer Dobson Circulation are related to lower stratospheric ozone alterations east of the date line over the Pacific. These in turn are linked to upper tropospheric anomalous dipole temperature patterns on either side of the equator. The ensuing changes in geopotential height values do not only drive equatorial zonal wind anomalies in the upper troposphere that are reversed at the equatorial surface, but also impact on the intensity of the South Pacific High circulation. When the WC is enhanced, a La Nina type of circulation is indentified but if the circulation cell is inverted, the anomalous circulation results in an El Nino. Though the anomalous lower stratospheric ozone peaks during austral summer it is significant throughout the ENSO lifecycle. Hence, ENSO structure and variability are mainly linked to the lower stratospheric ozone instigated internal dynamics of the Pacific atmosphere. The ENSO forcing most likely originates from the ozone related regulation of the incoming solar UV-B radiation rather than the Pacific Ocean surface.
https://www.nature.com/articles/s41598-017-05111-8
With less ozone production in the upper stratosphere, more UVB radiation reaches the upper troposphere.
This explains why the Walker Circulation remains strong and La Niña cannot end.
The decline in stratospheric ozone production is well into 2019.

https://www.cpc.ncep.noaa.gov/products/stratosphere/index.html
What is the current magnetic activity of the Sun and the solar wind.
http://wso.stanford.edu/gifs/DipallR.gif
Figure 5 of the DeWitte et al. 2022 article is very interesting, as it shows the increase in solar activity since 1700, and the Modern Solar Maximum, defined as the longest period with solar activity above average.
Compare to the figures I have been presenting for a long time.
Have they fixed the actual issues with “Total” Solar Irradiance? I/e, it not actually BEING remotely “Total?”
If not, this is just more pissing into the wind.
In July, Earth is the farthest from the Sun in orbit. With La Niña underway, will summer temperatures at the North Pole remain below the 1958-2002 average?
I know, right? The sun can’t possibly be the cause of climate change. Maybe it’s aliens. TSI stands for Total Solar Irrelevance.
In the proposition of jumping the gun, as Javier says,
‘aliens’ is more acceptable than the TSI, to ponder.
🙂
“Based on statistical and composite analysis, a significant positive correlation was found
between sunspot number index and El Niño Modoki index, with a lag of two years. A clear evolution
of El Niño Modoki events was found within 1–3 years following each solar peak year during the past
126 years, suggesting that anomalously strong solar activity during solar peak periods favors the
triggering of an El Niño Modoki event.”
https://www.tandfonline.com/doi/pdf/10.1080/16742834.2016.1231567?needAccess=true