Guest Post by Willis Eschenbach [Painting above, “Uneasy Sea” by Gennady Vytor]
It is not the sea that sinks and shelves,
SOURCE
But ourselves
That rock and rise
With endless and uneasy motion,
Now touching the very skies.
For the last forty years or so we’ve been treated to endless scary claims that the rate of sea-level rise is increasing and coastal cities are all going to drown. I’ve shown that part of this hysteria is due to improper splicing of the four sequential satellite records of the sea level. Here are the four records, along with their respective trendlines.

Figure 1. Four satellite sea level records and their linear trends.
As you can see, the first two satellites (Topex and Jason-1) agree, as do the second two satellites (Jason-2 and Jason-3). However, the satellite pairs greatly disagree with each other.
In response to this disagreement between satellites, the “scientists” have just spliced the four records together, ignored the disagreement of the trends of the earlier and later satellites, and declared that the sea level rise is accelerating. Here’s that bit of scientific malfeasance.

Figure 2. The University of Colorado’s improper splicing of the satellite records, claiming acceleration of sea level rise. SOURCE
In the past, I looked at the question of sea level acceleration in a different way. I took the main three global sea level estimates (Jevrejeva, Church & White, and Ray & Douglas), and I looked at the 30-year trailing acceleration. By “trailing acceleration” I mean pick a point in time and look at the acceleration (or deceleration) over the previous 30 years. I repeated this procedure for each year of the record. Here’s that result.

Figure 3. Thirty year trailing acceleration, three global sea level estimates.
This shows something quite curious. Rather than either steadily accelerating or decelerating, the rate of sea-level rise has markedly sped up and slowed down a couple of times over the period of record.
Today I realized that there’s another way I could approach this. To explain it, first let me make a small diversion.
The underlying problem with determining the rate of sea level rise is that the tide gauge sea-level records are not corrected for the rising and falling of the land. Here are some examples:

Figure 4. Sample of longer (75-year plus) sea level records. Colors indicate that I don’t think science should be in boring black-and-white.
Hmmm … you can see the challenge. In some areas, like the region around the North Sea (e.g. first 4 records, left column), the land has been relieved of a huge burden of ice since the last glaciation. As a result, it is rebounding upwards faster than the sea level is rising. And that means that the relative sea level is falling. And along the east coast of the US, the reverse is happening—the land is sinking, so the relative sea-level rise is exaggerated. Finally, in a number of areas, removing either oil or water from underneath the land is causing subsidence. As a result … you can’t trust the tide gauges. All they can give you is the relative sea-level change, not the absolute change.
The second challenge is that most sea-level records are fairly short. Here’s a histogram of the records by length (total years of observations).

Figure 5. Histogram of lengths of all sea level records. Colors as in Figure 4.
My insight today was that I could first detrend all of the long sea-level records. Then I could calculate the 30-year trailing trends, and from those, I could calculate the 30-year trailing acceleration.
So that’s what I did. Out of a total of 1,544 extant tide-gauge records, only 135 of them have records of 75 years or longer. I took those, detrended them, and calculated the average 30-year trailing trends.

Figure 6. Average 30-year trailing trend, 135 detrended 75-year or longer sea level records.
As you can see, the trends have gone up and down, but there’s no apparent overall increase. The largest rate of rise was around 1915.
Finally, as a check on my calculations of the trailing trend, I used the LOWESS smooth to calculate the 30-year trailing acceleration and added it to Figure 3 above.

Figure 7. As in Figure 3, but including the acceleration calculated from the trends shown in Figure 6.
Given that I’m only using a small subset of less than 10% the 1,544 records, I’m quite happy with that result.
A few notes. First, all of those results show that there is no steady acceleration of the rate of sea-level rise that for years we’ve been sternly warned was coming soonest. The rise of the sea level has been quite uneven, accelerating in some decades and decelerating in other decades.
Next, given that we have only sparse information on the rate of vertical land rise or fall at the individual locations of the 1,544 tide stations, determining a global absolute (not relative to land) sea-level rise is somewhat of a guessing game. As evidence of this, here are the rates of sea-level rise from the three global records shown above, those of Jevrejeva, Church and White, and Ray and Douglas.

Figure 8. Average sea-level rise rates, 1900 – 1990. I have used the data only up to 1990 to avoid the scientists’ nasty habit of splicing the corrupt satellite record (see Figure 1) onto the end of the tide gauge records.
My conclusion? Comrade Obama’s two seaside estates, one in Hawaii and one in Martha’s Vineyard, as well as Bill Gates’ $43 megabuck seaside estate in San Diego seen below …

… are in no danger of being submerged, no matter how loudly they scream about the so-called “CLIMATE EMERGENCY”.
Protip: Regarding the climate, you can relax and enjoy life until the day somewhere in the misty future when the people aggressively lecturing you about your “carbon footprint” stop buying beachfront estates and flying private jets.
And for me, I’m going out now, back up the ladder to continue pressure-washing the walls. When will it be done? I can’t think of it that way, doesn’t work for me. Instead, every day when I finish up and stow the tools, I just tell myself “Another tile in the mosaic” and keep going … if I looked at the whole job I might just walk away, but this way I’m always walking toward the fire.
My very best to everyone,
w.
As Is My Custom: I ask that when you comment you quote the exact words you are referring to. This helps avoid many of the misunderstandings that plague the intarwebs.
Further Info: Given that the ocean looks like the painting at the head of the post, how can we measure sea level accurately? The answer is the “stilling well”, used for hundreds of years. It’s a vertical pipe with only a tiny hole at the bottom for the water to enter and leave. As the name suggests, it “stills” the vertical motions and gives us an accurate sea level at any instant. Heres NOAA on the subject.

Willis- I appreciate the fact that you seem to relish finding the unexpected. I would say that is the mark of a true scientist. Thanks for all you do.
nobody can be drowned by a global sea level change . You may be overwhelmed by a local sea level rise and that is all you need to worry about. I have often challenged the latter day Noahs to show me a single tidal gauge in the world that shows an acceleration in sea level rise. No takers yet
You are wrong!
I guarantee the tidal gauge in Miami will show an acceleration in sea level rise, with a dramatic change of approximately 3.19′ in a mere 6 hours from 2:06PM today to 8:15PM.
/ griff mode off
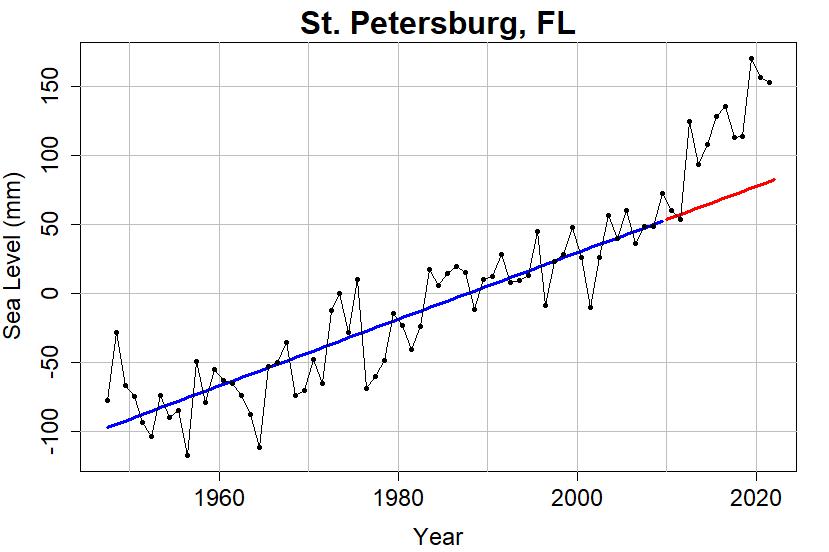
How about St Petersburg?
 %
%
Great analysis, Willis. For me the figures 3, 6, and 7, each showing cycles of accelerating or decelerating sea level, are the interesting aspect of your analysis, because they show cycles that are out of sync with human CO2 generation, ie, natural cycles. While the rebound of land due to glacial ice removal is quite real, the other problem with fixed tide/sea level gauges is the tipping of the tectonic plates. The east coast of the USA is clearly going down (see irregular shoreline with many bays), whereas the west coast is going up (see straight shoreline and escarpments into the ocean). Rate? No idea.
Hopefully, the plates don’t tip so much as to capsize Guam.
Who would have thought that there could be natural cycles?
People that don’t get paid to assign blame onto mankind.
The problem with averaging is that most of the over 75 year tide gauges are in the US or northern Europe. So, the errors on your graphs are misleading, since the tide gauges are not a simple random sample of locations around the world. Moroever, many readings are correlated.
Nevertheless, I think your work does show that whatever the sea levels are doing, they are not accelerating to any degree that should cause alarm.
Hat tip to your data import skills. What software did you use?
most people have worry lists with dozens of concerns far more threatening that a few mm of rise per year
Willis,
You say …”you can’t trust the tide gauges. All they can give you is the relative sea-level change, not the absolute change.” That seems true as best I know, however a long-term tide gauge, for example The Battery in New York City, shows there to be no change in the rate of rise since it was placed in service about 170 years ago. The GPS elevation gauge associated with The Battery shows that at least for the last decade, over half of the relative rise is because the land is sinking as you point out. If somehow, The Battery only began sinking at the moment the GPS gauge was installed, then should not there be a clear knee at 2011? There isn’t. It then seems to me that long term tide gauges are a very good measure or whether or not, sea level changes are or are not accelerating.
I agree. The tide gauges are consistent….which, as this article nicely points out, is more than you can say for the satellite “record”.
The alarmist narrative is essentially that AGW is/will cause more melting and flow of water from land based ice in Greenland, Antarctica and mountain glaciers to flow into the oceans. If this is actually happening it should show up as an acceleration in sea level rise at all tide gauges. That would include even those affected by vertical land motion with perhaps the exception of recent subsidence due to water pumping or large construction projects. Long term gradual vertical land motion, up or down, should still show an acceleration due to warming if the claimed effect is real. The fact that most all tide gauge data shows no acceleration proves the null hypothesis and thus falsifies the sea level acceleration due to AGW claim.
The rate of sinking of some tide gauges can be accelerated by the pumping out of ground water.
Though I would think that even skyscrapers wouldn’t weigh enough to have a noticeable impact.
Here is one study where they looked at many sites with groundwater withdrawal affecting RSLR. Just makes the issue that much more complex, as if it wasn’t already.
https://www.sciencedirect.com/science/article/abs/pii/S0048969721012602
Mark, that is what is probably happening in the Hampton Roads area (Southern Chesapeake Bay) of Virginia. There, relative sea level rise is about 4-5 mm/yr. This is of great concern to the State and the Navy because of the many large Navy and Navy contractor and other private maritime facilities in the area. The water is kinda lousy too. Sulfur stench.
When the land is naturally sinking and the aquifers underneath it are being drained at the same time at a rapid rate as happening in the Tidewater area of Virginia, sea levels tend to rise pretty quickly.
I’m 45 miles north of there on the western shore of the Bay and at least for the 25 years I’ve had a house here I really can’t tell the tides have risen one bit. We have not only the lunar tide but wind driven tides, so it may normally be 1.5′ from low to high tide on a calm day, but a Nor’easter can pile the water up over my dock and a strong westerly can blow it out of the creek. The tide gauge at Lewisetta says it is rising but from just looking at it nothing seems to have changed.
Other than land subsidence, changes in the location of the persistent highs and lows in the oceans can also effect tides. When an El Niño or a La Niña is in effect, wind patterns cause water levels to change as well. Same with the Atlantic and Pacific oscillations. Might be worth looking into this effect.
Great essay WIllis. Very interesting results.
Skyscrapers are built on piles bedded in to solid rock at approved bearing capacity.
Yes … until they’re not. See Millennium Tower in San Francisco, Ca. Not anchored into rock, but used a friction piling … and one side of the building is sinking … which is expected, but problematic, as the other side is not.
how many sky scrapers on what kind of land? A city or two has been built on the delta of some large river. That isn’t always stable ground.
Thanks for this analysis Willis…most useful.
As you are no doubt aware New Zealand has some of the longest records of sea level from tide gauges in the Southern Hemisphere. The following recent paper (2020) has used GPS data on land movement to conclude that the absolute (not relative) rate of sea level rise from 1891-2013 has been 1.45mm +/-0.28mm/year. Not too scary I feel.
Denys, P. H., Beavan, R. J., Hannah, J., Pearson, C. F., Palmer, N., Denham, M., & Hreinsdottir, S. (2020). Sea level rise in New Zealand: The effect of vertical land motion on century‐long tide gauge records in a tectonically active region. Journal of Geophysical Research: Solid Earth. doi:10.1029/2019jb018055
This paper is well worth a read for anyone interested in this issue. Nevertheless our government here continues to use the more scary NOAA/IPCC predictions to achieve its aims. We’re all doomed…
In fact the NZ based BRANZ have tacked on the view that the sea-level is now running at 14mm/Yr an massive acceleration but unsupported by data.
The entire “science” is a fraud in NZ.
Spot on DHR
One other factor for The Battery is the Hudson River.
The Battery is at the outflow of the Hudson. Check a historical outline of NYC map over the last 150 years and see how it has narrowed. Same waterflow in a channel raises as the cross section of the channel is reduced.
How much variation in rain fall in the Hudson watershed can be seen in the tide gage?
I know the Presidio gauge at SF, has as its record high (Jan. 27, 1983) was mostly caused by, “The 1983 high tide accompanied a downpour associated with the El Niño condition”
An El Niño, i.e. when that 1 meter higher sea level by Japan sloshed back to the west & a lot of rain runoff caused the RECORD HIGHEST and not CO2.
https://tidesandcurrents.noaa.gov/sltrends/sltrends_station.shtml?plot=50yr&id=8518750
Battery has a beautiful periodicity!
A really big problem is that when one reads the Jason 3 manual, and puts possible error bars on the many correlations used, one realizes that the satellite record is simply not sufficiently accurate to say what is claimed…the instruments need to be calibrated against surface tide gauges…relies on Doris ground stations to obtain satellite altitude…and has questionable calculations for daily “Earth-Tides” of about a foot twice a day in the Earth’s crust due to the Moon’s gravity…parameterizes atmospheric microwave refraction data, sweeps the same point only once every 10 days (that’s only 36 times per year), and so on. Read sections 3 and 4. It’s a case of scientists justifying their many years long self-importance scam by claiming accuracy in their calculations that simply isn’t there.
https://www.ospo.noaa.gov/Products/documents/hdbk_j3.pdf
I have wondered how they calibrated these satellites. If they don’t agree with the measurements on the ground, how can they know they are correct?
They constantly check against tide gauges…to confirm their correlations aren’t going horribly astray, and especially before conferences. /s
Or at least that the correlation is going the right way.
For the details-oriented here is a paper that shows what the satellite guys attempt to do…
I quote….
“The Jason-2 orbits using the T2L2 or polynomial fit correction are very close to each other, showing an overall average RMS differences in the radial/cross-track/along-track directions of 1.7 mm, 7.6 mm, and 5.7 mm respectively.”
https://www.sciencedirect.com/science/article/pii/S0273117720308346
DMac
And from page 10 of that Jason-3 Handbook:
“As for Jason-2, the sea surface height [measured by Jason-3] shall be provided with a globally average RMS accuracy of 3.4 centimeters (1 sigma), or better, assumimg one second averages.”
Note: Centimeters, not millimeters. And not tenths of a millimeter.
Good find…I remembered it was about an inch but couldn’t locate it today….
The Poseidon-3 dual frequency altimeter is what is on board.
Ku Band 12-18 GHz, 2.5–1.67 cm wavelength…
I used to have a uni prof that said people who measured distances with radar often thought they could take N readings and improve their accuracy by SQRT(N)….but they were oblivious to the fact they were selecting a subset of giga-readings per second, therefore were completely wrong, and instead were limited to about 1/2 wavelength at best.
I suppose someone could come up with something better these days using circular polarization, but it ain’t on Poseidon-3…….
Remember Envisat? Those corrections from 0.46mm/y to 2.52mm/y:
“It’s a case of scientists justifying their many years long self-importance scam by claiming accuracy in their calculations that simply isn’t there.”
Well expressed, DMacKenzie. There isn’t an area of consensus climatology where your observation is not true.
The whole case for climate alarm lives on false precision.
Actually its just fraud sorry.
As with all science the central key issue is understanding the “errors”.
They don’t. Or maybe look the other way.
High precision inaccuracies.
Dr. Pat, I sure wish you would publish more on your propagation of errors thing. I was astonished that even Dr. Roy didn’t get it. He kept going back to what model outputs do do, missing the point that you were talking about error propagation. (Model output doo-doo, pardon the pun.)
Spencer doesn’t understand that uncertainty is not error, like a number of WUWT posters.
Pat,
“ on false precision”, yes. I have been trying for an easy analogy.
You have a flask that is calibrated to hold 50 millilitres to its calibration mark. Time after time you fill, weigh it and find it to be precise between 49.8 and 50.2 ml. giving +/- 0.2 ml precision in simple terms.
Then, you drop a few small rocks in the flask. You can still fill it to the mark with a precision of +/-0.2 ml, but the accuracy is shot to pieces by the rocks.
With satellite estimates of sea level, one can take millions of readings that agree within something like our +/- precision, but metaphorically, nobody knows if rocks have been dropped into the water.
Oh curses, this is more messy than I hoped it would turn out, but then so is measurement work whose authors seem not to know about accuracy or precision or the place of each to describe a system. Geoff S
If I read it correctly, that report concerns ground-to-satellite altitude calibration- a one-way communication signal from instruments affixed to specific locations on dry land. I believe that sea level measurements are made by radar reflection – a two way system. So double the error. Further the satellite altitude is doubtless a function of the earth’s gravity field which varies and is less over the oceans as I recall because water weighs a lot less than rock. Also, I recall that at one time, Dr. Spencer speculated that the satellite measurements are confounded by variations (unknown) and improper correction for the effects of the humidity of the air through which the radar signals propagate. Additionally there are effects on coastal sea level by the local gravity fields, the effects of waves, particularly wave foam, and seafoam in general. All in all, it does not seem credible to me that global sea level can be measured to an accuracy of a fraction of a millimeter by such a system. Maybe someone out there can correct me.
Excellent analysis Willis. Great graphics and right on target in dispelling the flawed increasing sea level rise hype along our global coasts that has been falsely proclaimed for the last 35 years by incompetent climate alarmists.
All of the mathematical masturbation in the world can neither prove nor disprove sea level is accelerating in its rise …. or not. Too many unknowns.
Even the knowns aren’t known with sufficient accuracy.
there are known unknowns, perhaps there are unknown unknowns too
It always seems to be in the same band every time I go there…hi/lo tide sos yoy
And we’re looking at data derivatives and second derivatives. Highly dubious.
Pretty close agreement with the Atlantic Multidecadal Oscillation
Winner winner chicken dinner!
Thomas,
Yes, I was going to comment that the lows in the acceleration like 1940s, 1975s, broadly coincide with “climate shifts” in many parts of the literature.
Whether we have these climate shifts because people saw evidence in early tide gauge work, or whether tide gauge interpretation came later and added to the climate shift story, as in cause and effect, I do not know. Geoff S
Thanks Geoff. The AMO is not based on tidal gauges, I think it’s sea surface temperature and/or atmospheric pressure.
Thomas,
Yes, i know, but broad concepts develop from pieces like a jigsaw. Sometimes it is hard to work out in hindsight the timing of the pieces coming together. Geoff S
To Geoff S.
Yes. Yours is a wise comment. The history of many scientific theories.
Sea level rise acceleration is an article of faith among alarmists, starting with Hansen in 1988. The fact that it hasn’t just shows how wrong the whole global warming alarm remains.
Willis,
As a retired lawyer, my thoughts return to the SCOTUS decision in Massachusetts v. EPA (2007).
The majority found that there was acceptable evidence that Massachusetts was threatened with inundation over this century occasioned by sea level rise.
This of course led to the EPA endangerment finding of December 2009.
As sea level rise is some 6-8 inches a century since 1850 and not accelerating as your post confirms, it is difficult to see how the SCOTUS finding can hold going forward.
That is why the current SCOTUS hearing in West Virginia v. EPA is so important.
If we have so much rampant ignorance among the Political, military and academic institutions of the world would you not expect the judiciary to climb aboard so that they too may wallow in their gratuitous and monumental ignorance
Alastair, rampant ignorance? I call it willful ignorance. All the data one needs to conclude there is no climate “emergency” whether based on temperature, flooding, drought, storms, sea level, fires and everything else is readily available on the web. One would think that policy makers would search out such data to inform their decisions. To not do this makes them willfully ignorant. If they do search and ignore what they see, they are simply corrupt and after so much time and so much data, irredeemably corrupt.
Considering that Boston is mostly landfill at this point, and as it has been around for closing in on four centuries, any sea level rise hasn’t affected the city at all. None of the other coastal cities and towns have been abandoned either. The only problems seem to have been from erosion and people foolishly building on sand dunes. And now they are trying to dismantle all the dams in the state because of trout.
It’s only foolish to build on sand dunes if you intend to move into them personally.
As usual, you make interesting observations that laypeople like myself can understand. Thanks for that. While I get the value of having an “overall” rise or fall value that is accurate, it seems to me that coastal dwellers would be better served with honest information about their actual location. If you live say, in the Florida panhandle, it probably doesn’t matter much what the global sea level is doing, based upon it’s historic rates of change. Actually, it probably doesn’t matter much what it’s doing even locally at these rates. But for the person in Florida, I imagine info about their location is more useful to them than some global value. Luckily, they can just walk to the shore and have a look. It’s just like the frantic screeching about “climate change”. The global average, or it’s rate of change is an interesting factoid, and worthy of monitoring, but we humans deal with local temperature changes far greater than the tenths of a degree per decade everyone who isn’t informed seems to screech about endlessly. I’m confident the climate will continue to change, as it always has. We puny humans don’t have a giant role to play in it if we’re not incredibly foolish.
Given the well-known and widely ignored 1,000 years or so climate cycles, measuring sea level rise and fall on shorter time scales is pretty meaningless. Sea levels were higher several thousand years ago, and we really need to be concerned with the approaching ice age.
yeah…sea level used to be at Columbia, SC but now at Charleston, SC…sea level got so low they found mammoth remains in South Cackalack…apparently all the woolys died perhaps due to sea level rise…10,000 yrs ago…they were doomed as are now we…
Even if we could get an accurate tidal gauges around all of the shorelines of the world, including all the islands, we still wouldn’t have a complete picture regarding what sea levels are doing, because we would still not know what the ocean basins are doing.
For example, what if there was a major eruption along the Mid-Atlantic ridge that poured many cubic miles of lava into the Atlantic. How would that impact sea levels?
This is not an easy problem and there are no simple fixes.
Mark W,
Agreed. We have observed new islands growing in the middles of oceans, but we do not seem to quantify if these affect global sea level to a measurable amount. Anyone have good references to the effects of changes of ocean basin dimensions over time?
Geoff S
I found this.
https://agupubs.onlinelibrary.wiley.com/doi/full/10.1029/2009TC002557
Tanks Chas, more reading to do , but interesting. Geoff
Interesting, Charles. According to that study, sea level has been increasing at about a tenth of a millimeter per millennium … so I don’t think it affects my calculations …
w.
Chas,
Studied it and recommend it especially if you know some geology. Long but thorough and adds a dimension that some might not want.
Geoff D
Another aspect that is ignored is that where there is isostatic rebound happening (such as the coast of Alaska) the rising ocean floor is on the coastal shelf and is therefore displacing water into the rest of the ocean as the shelf rises, thus causing a general sea level rise with no external input of water.
Willis,
You say, with respect to Fig. 6, “… there’s no apparent overall increase.” It looks to me that the 30-year trailing trends have a trend of about +0.05 mm/year/year. That is, the trends appear to increase, erratically, from about -0.75 to about +0.75 over the 30-year period. Have you tried fitting an OLS regression line to the blue line to confirm your claim?
Clyde, fitting a linear trend to a short cyclical signal is useless. For example, a sine wave has no trend …
w.
And a series of 100 random number will essentially always have a trend.
I’m not sure I believe that. At least not a statistically significant trend.
Depends on the kind of random numbers. Random fractional gaussian numbers often have a trend which looks statistically significant unless you adjust for autocorrelation … which lots of folks don’t.
w.
The problem is, there are almost always what appear to be periodic components to measurements of natural systems. The annual/seasonal one is most common. However, for things like tides, there are also periodic astronomical components.
The question becomes, how does one demonstrate that there is a real trend, versus a pseudo-trend. It would seem that one period would suffice to call an asymmetry a trend. If one truncates the data to have even-multiples of the period, they run the risk of being criticized for cherry-picking start and end dates. One way around that is to strictly define the calculated trend as being an apparent trend based on all the available data, subject to future updates.
Therefore, I’d still be inclined to say that your Fig. 6 is showing an apparent trend, unlike your claim of “no apparent overall increase.”
The problem is well illustrated in my graph above of the short sine wave. If you look at a cyclic signal that starts at a low point in the cycle and ends at a high point, it will always show a trend … but as the graph above shows, that means NOTHING.
It does not mean there is an “apparent trend” unless by “apparent” you mean “prematurely or incorrectly diagnosed”.
w.
Both the temperature record and the sea level data confirm that there is no climate emergency.
Once again, Mr. Eschenbach, I invite you to share with us the specific file you used in the generation of this chart project. And, just to be clear, I’m not asking for a link or a reference, but rather the internal data to the charting software you’re using with the associated parameters. If you’d prefer, you can also email this file to me directly, barryanthony35@aol.com.
Thanks in advance.
[badgering Willis by touting your ineptness does not improve your position here or your credibility. ~cr]
Barry, every bit of the data used in computing the trends is from the PSMSL sea-level annual dataset. As noted in the graphs, it is available here. I assume you can download it, so I won’t bother emailing it to you.
If you are unable to replicate my work using that data, tough. I can only give you the data. I can’t understand it for you.
And as I told you before, I don’t use “charting software”. I do all my work in the computer language “R”. It appears you don’t program in R. You should learn it. It’s a free, cross-platform, wonderful computer language with free packages to do almost anything you could want.
w.
“If you are unable to replicate my work using that data, tough. I can only give you the data. I can’t understand it for you.”
It’s unfortunate that you don’t work in an established spreadsheet/charting environment, instead claiming to work in a niche programming environment such as R. That makes the considerations of transparency more challenging. But, that said, I can work in R, and would appreciate access to the repository with the stack used in the generation of these charts (read-only of course). Failing that, perhaps you’ve uploaded an archive of your work to CRAN? That would make access easier.
Again, thanks in advance.
(Please learn to use quote tags and separate your comment from the quoted words) SUNMOD
I am curious who you email to give you these canned answers. R is not niche but the primary open source statistical math tool in the world.
It’s clear you’re in communication with one or more people using you as the sacrificial lamb, or tip of the spear depending on your framing. In a couple of days you’ve gone from demanding an emailed package, (you could forward) to: oh well I guessssss I can work in R if I reeeeaallly haaaaaaaaaave to.
I wasted my time below, I see.
“It’s unfortunate that you don’t work in an established spreadsheet/charting environment”
Translation: “Microsoft Excel is the *only* thing to use. If you do not know that, you are stupid”
Thanks for letting me know.
Then this:
“access to the repository with the stack used”
Can anybody explain to me what he is prattling on about.
A repository containing a stack, in R????
People are coaching him what to ask next, so it can get screwed up in translation.
I thought you had reached the limits of stupidity when you were going on about comparing model outputs and everything was big oil shill. Nope you have now proved you are a complete halfwitt.
Can please go and get an education and come back.
Complete 1/2 wit? I think you give him 1/2 too much wit.
I will try to be helpful.
Willis uses the R programming language. R is the language of statistics and has become the darling of the Bio-Statistics crowd, both because it is fast and can handle huge data sets with out choking. Highly Recommended.
Check out CRAN, the Comprehensive R Archive Network. CRAN has mirror sites worldwide for fast, easy downloading.
Get R, the R programming language and then R-Studio, the do-it-all development environment.
Sweet!
Then you could jump in and join the fun. Grab the data file in question off the interwebs, Read it into the R environment. Then have fun. Regressions, stats, what have you. Then you plot it all up, as you see, R allows you to make really nice looking graphs.
Need help getting started? Take an on-line course at edX, again highly recommended. Years back I took an edX course from the Karolinska Institute in Stockholm.
These days closer to home (for me) edX courses are run by Harvard and MIT among many others. Topics range from “Intro. to R Programming” all the way up to “Advanced BioInformatics” and even “Big Data Techniques”. Best of all, it is all free.
******************
Side note:
Way back, around 2021 or so, WUWT ran a couple of posts singing the praises of R. At first I had no interest in learning another niche language which would likely just be another “flash-in-the-pan”. Just not worth to effort.
Eventually I was convinced to take a look. Fabulous, I never looked back.
Maybe it is time for a few more posts singing the R praises and maybe even some R Programming Seminar type posts.
“Way back, around 2021”
Oops, 2012 actually.
Thanks, Tony, all true. I used to do all my work in Excel, and I could make that sucker sit up and dance. I had all kinds of special-purpose macros that I used. I even wrote hooks into Excel so I could call extensions that I wrote in C because Excel was too slow.
So like you, I resisted when Steve McIntyre kept bugging me to learn R. I finally broke down and learned it, and like you, I’ve never once looked back. It’s far and away the best language I’ve ever learned, and I’ve learned ten or twelve of those. I can’t thank Steve enough for persevering against my stubbornness.
As to Barry, my strong sense is that he’s faking it. For example, he talks about some imaginary “repository” containing some purported “stack” that I’m supposed to be using.
In fact, I simply downloaded the data from the web using the link I gave him and started analyzing it using R. Which of course he’s perfectly free to do.
w.
It’s a “smoke” stack.
Is R good for general purpose programming, replacing C++ say, for making any kind of app, or is just suited for taking in data, analysis and then reports and graphing? I’m kind of curious, having resisted learning any new languages in the past 20 yrs (OMG I am old)
R is excellent for general-purpose programming. The question of building apps is a bit more complex. Interactive web apps, yes. Standalone apps, no. See here for a variety of answers.
w.
No stir in the air, no stir in the sea
The ship was as still as she could be
Her sail from heaven received no motion
Her keel was steady in the ocean
Without either sight or sound of the shock
The waves rolled over the Inchcape Rock
So little they rose, so little the fell
They did not move the Inchcape Bell
The good old Abbott of Aberbrothock
Had placed that bell on the Inchcape Rock
On a buoy in a storm it floated and swung
And over the waves its warning rung
When the Rock was hid by the surge’s swell
The mariners heard the warning bell
And then they know the perilous rock
And blessed the Abbott of Aberbrothock
There are 13 more verses .. I know the whole thing by heart.
I was made to memorise it as punishment while at boarding school, age 12, for being caught walking on the roof at night. Only death or Alzheimers will clear it from my memory.
In my best impression of Barry Anthony, “A frontal lobotomy or electroshock would do it too. I ought to know.”
“A frontal lobotomy or the bottle in front of me.”
The way I heard it:
I would rather have a free bottle in front of me than a pre-frontal lobotomy.
I posted an article here a few years ago based on tide gauges with long time span. My conclusion then was that we could not see any acceleration there.
However, I think we can spot a small acceleration trend in your figure 6. The curve is positive from the early 1980-ies, and end in the highest positive value on record.
Since this is acceleration, the actual speed of sea level rise is the integral of this graph.
The area under the graph after 1980 is larger than any such positive or negative area in the past. That indicate that we now have an acceleration.
/Jan
Thanks, Jan. See my comment here. And the largest 30-year trailing trend on record in Figure 6 is in 1914.
Also, Figure 6 shows trend, not acceleration. Figure 7 shows acceleration.
My best to you,
w.
Willis,
Nice work. To address any question of cherry-picking, does Figure 6 look different when the cut-off point for record inclusion is somewhat longer or shorter than 75 years?
Paul, e run into challenges going both directions. If we go to 100 years, there are only 63 records, and the northern hemisphere concentration gets much worse.
If we go to 50 years, there are 333 records, but there are no non-overlapping 30-year trends in the data.
With that as prologue, here are the 100-year trends.
And here are the 50-year trends
In all cases we see the same pattern—peak value in 1914, down to 1940, up to 1960, down to 1980, up again …
w.
Seems like a pretty durable result. Thanks
Many thanks for yet another clearly reasoned and documented article. I’ve often wondered how to correlate rising/sinking landmass to the figures presented for sea level rise, and here you’ve done it.
One wonders if the rate of lateral motion, “continental drift,” is also a factor, since the figures I’ve seen measures the movement on a similar scale, and would in any case, affect the measurement datum at any given sample point.
That I can answer. Continental drift is so slow it has no impact on SLR over a century. The most active global spreading area is the mid Atlantic ridge. It’s spreading averages about 2.5 cm/year, so 2.5 meters wider average Atlantic Ocean per century. So Columbus had to sail about 13 meters less far in 1492. His boats were longer than that.
Now, with respect to relative sea level, this is NOT true where ‘continental drift’ results in subductions or overthrusts. West Coast of Alaska is a prime example. Essay ‘By Land or by Sea’ in ebook Blowing Smoke is very explicit and graphic.
But they never mention Columbus’s 4th ship, the San Gorgonio, the one that sailed over the edge.
Thanks, Rud. I will re-read that chapter.
Excuse my lack of the appropriate language, but I know that ocean charts use a geographer chosen datum to determine relative sea level — usually a point derived from where a high-altitude point (e.g. mountain top) can be accuratly surveyed, to a point where the sea level can be measured, and this vertical distance treated as a constant. How might the sea level measurement change if the vertical distance is not constant? For instance, volcanic features can rise and fall, and plate lateral movement can make up to 2.5 cm/year difference in location. If one uses a different ruler, or one that is shaved by a little each year, can those measurements be “trusted?”
I blame it all on the moon, anyway : “Lunar Forced Global Warming” ‘https://www.climateclock.no/2021/03/09/lunar-climate/’
Willis,
Help.
Sea Level rise in relation to what? Satellites eventually tie their altitude to the ITRS center of mass of the earth [which moves and has its own uncertainty]. Sea Level from tide gages ties to datums like WGS 84 which tie to ellipsoid models and somehow result in a mean sea level determination. With all this estimating and modeling, and multiple references, how do we really believe we have measured anything to millimeter accuracy [not millimeter precision]?
Thanks.
“how do we really believe we have measured anything to millimeter accuracy.”
We don’t. It’s all swamped by uncertainty. But it’s interesting anyway.
Not Willis. But please read previous post here few year back specifically requested by CR. ‘Jason 3 fit for purpose?’ or some title like that. Laid it all out very specifically.
Stilling wells must have some sort of lag as the waves slosh up and down. So one might guess that on a still day the sea level would read higher than the same location on a rough day.
Or does the water just build up in the well, delayed in leaking out in the same way as it is slowed entering?
Does anyone know? Has anyone looked?
JF
Hey, Julian, always good to see your name on the list. The water in the stilling well can only enter or exit through a small opening. So it equilibrates over a period of several minutes or so, much longer than the wave periods which tend to be on the order of seconds.
As a result, it averages out the wave-generated changes but not the tidal changes.
w.
Thanks. I was assuming quicker equilibrating (if that’s a word). When all you’ve got is a hammer…
Now, about the Sea of Marmara…
JF
There is a good summary here: http://refmar.shom.fr/documentation/instrumentation/puits-de-tranquillisation
That is an excellent painting. 🙂
Excellent.
So, its OK to start peeing off the side of the boat again.
Pro tip, use a piss bucket
Reduced embarrassing tinkle tracks