CMCC FOUNDATION – EURO-MEDITERRANEAN CENTER ON CLIMATE CHANGE
The availability of reliable spatial and temporal data at proper spatial and temporal scale about extreme weather events represents a pivotal challenge for supporting Disaster Risk Reduction (DRR) policy and practice. In recent years several gridded observational datasets have been developed for Europe and for specific European countries; these products feature different temporal (from hourly to daily) and spatial (from ≃ 1 km to ≃ 10–20 km) resolutions, covering different time spans, and their reliability is strictly related to the density of station networks from which they derive.
A potential alternative solution to ensure homogeneity and continuity of data is represented by the use of climate reanalysis. In general, a climate reanalysis delivers a complete and consistent picture of the weather and climate of the past as close to reality as possible, by adopting a numerical weather prediction model to assimilate historical observations provided by different sources (satellite, in situ, etc) but not homogeneously distributed around the globe.
The data produced by the reanalysis are widely used and provide many kinds of information, not only about the atmosphere, such as temperature, wind and precipitation, but also about the ocean and the land surface.
Recently, the European Centre for Medium Range Weather Forecast (ECMWF) has released a new generation of reanalysis, acknowledged as ERA5, representing nowadays the most plausible description for current climate. It has a global coverage with a spatial resolution of ≃ 31 km and provide outputs at hourly scale since 1950 up to now. Such features make ERA5 suitable for a wide range of applications such as analyzing the past climate, monitoring climate change, research, education, policy making and business, in sectors such as renewable energy and agriculture. Despite the authoritative relevance of ERA5, its coarse resolution could prevent a reliable adoption for characterizing localized events (e. g., extreme precipitation) especially in complex areas (e.g., mountain or urban environments), confirming the need for highly localized data.
Based on this state-of-the-art, a study recently published on Weather and Climate Extremes led by the CMCC Foundation present a new hourly high-resolution (i.e., at ≃2.2 km) precipitation dataset, labelled as ERA5@2km, obtained by dynamically downscaling ERA5 reanalysis over 20 European cities for the recent past thirty years (1989–2018), with the ambition support the Disaster Risk Reduction (DRR) community involved in pluvial flood risk assessment by providing a basis for impact analysis at city scale, in terms of extreme hourly precipitation.
“The great added value of our reanalysis-based dataset”, explains Alfredo Reder, CMCC scientist at the REgional Models and Hydrogeological Impacts (REMHI) Research Division, “is the high resolution at 2 km reached that it’s particularly suitable in the view of deriving precipitation characteristics at city scale or at the event scale. ERA5 represents a good reference for general mean statistics (e.g., spatial pattern of annual precipitation, multi-year cycle of monthly precipitation); however, its coarser resolution tends to generate a smoothing of extreme precipitation. ERA5@2km overcomes this constraint by providing a reliable suite of extreme precipitation values for city analyses. A climate dataset such as ERA5@2km may also be a relevant tool to support adaptation strategies and risk assessment.”
“We are so proud of this result, requiring a considerable computational effort (almost two years of simulations)”, comments Paola Mercogliano, REMHI Division Director. “Our study demonstrated the importance of our very high-resolution reanalysis-based climate simulation, at the European level and for different climate conditions. Reanalysis (-based) datasets can indeed fill observational gaps, still existing in wide areas.”
The study evaluates the reliability of this new precipitation dataset for spatial patterns, trends, and extreme values. The evaluation is performed by making use of a set of available high-resolution observational datasets (comparable in terms of spatial and temporal resolution) for a subset of cities (i.e., London, Cologne, and Milan), analysing multiple features of interest such as mean spatial pattern of annual precipitation, multi-year cycle of monthly precipitation, multi-year cycle of hourly precipitation for summer season, and annual maximum hourly precipitation. “Such an evaluation”, adds Alfredo Reder, “provides a clearer understanding about the added value of very high-resolution dynamical downscaling reanalysis, such as ERA5@2km, in terms of localization and magnitude of precipitation events at urban scale confirming its potential importance for the assessment of extreme atmospheric events (such as heavy precipitations). The reliability and coherence of precipitation data provided by ERA5@2km at city scale were validated by the use of high-resolution observational precipitation datasets available over different areas at hourly scale; if our simulations were able to capture and describe the climate of the cities for which observational data were available, we can therefore imagine to apply our dataset even in areas outside the European Union, for which monitoring networks are still poor.”
“This study”, Paola Mercogliano concludes, “represents a first important step: model validation and the demonstration that ERA5@2km is able to understand and represent with great detail some features of the past climate, is the basis from which we will start to realize our scenarios and projections for understanding future climate change”.
The downscaling activity is performed within the framework of the Contract implemented by Fondazione CMCC to support Sectoral Information System about “Disaster Risk Reduction” (see https://climate.copernicus.eu/pluvial-flood-risk-assessment-urban-areas) of Copernicus Climate Change Service (C3S). The authors of this study are CMCC researchers A. Reder, M. Raffa, R. Padulano, G. Rianna, P. Mercogliano at REMHI – Regional Models and Geo-Hydrological Impacts Division.
For further information, read the integral version of the paper:
Reder A., Raffa M., Padulano R., Rianna G., Mercogliano P. Characterizing extreme values of precipitation at very high resolution: An experiment over twenty European cities, Weather and Climate Extremes, Volume 35, 2022. https://doi.org/10.1016/j.wace.2022.100407
JOURNAL
Weather and Climate Extremes
DOI
SUBJECT OF RESEARCH
Not applicable
ARTICLE TITLE
Characterizing extreme values of precipitation at very high resolution: An experiment over twenty European cities
What a bunch of gobldy gook. So what is the outcome, results of the study?
They simply have shoe-horned the climate angle into a weather event (flooding, heavy rainfall) study to get climate funding related funding.
… and, as they say, they are proud of it!…
Well I knew forecasting the future was hard, but what is the problem with forecasting the past – Oh I see _ it relies on “more research”
Climate reanalysis
https://www.ecmwf.int/en/research/climate-reanalysis
maps without gaps? So the ordinary folks of the world will think they have great data?
This little tidbit from the above article is quite curious:
“Simulations” and they “imagine” using their dataset outside of the EU.
sciency
As soon as I see “gridded” I know it’s nonsense. A “gridded observational dataset” is a perfectly good dataset that has been statistically tortured into giving up numbers that don’t exist just to stop the torture.
Oh dear, more of the same Mindset using duff programs with bugs and omissions incorporated. No doubt they will have tweaked things to produce some credibility with the past.
Bullshit. ‘They’ keep producing more models and running them through regressions until they get answers that match their narrative then say “see, this it what will happen based on history”. They failed with the future predictive models so this is the next step.
Understanding past weather events for 20 European cities from 1989 to 2018 says nothing about climate.
It only informs over a relatively short period (30 years) on weather events, not the hundreds of years of hard earned lessons of what nature can dish out in the future in each of those cities.
Long before the climate scam became a “Thing”, civil engineers (not the fake ones like Jacobsen at Stanford) have used the historical 50 year, 100 year, 500 year, and millennial weather events (heavy rainfall and floodings) to plan, build and fortify infrastructure (roads, bridges, levies, flood control structures, sea walls) and buildings and importantly, where not to build.
Climate does not apply.
OK, using the UN IPCC CliSciFi definition they have described a 30-year climate period. 30 years from now they might be able to determine any “climate change” from this period to that future period. Exhume my body and tell me what was revealed. I care!
Dave, if you find yourself spinning in your grave, you’ll know that they found that “It’s worse than we thought!”
I keeer!
I don’t know why all data point in climate science aren’t 100-yr averages.
Climates, like weather, are, it seems to me, quite local. In the rural area were I grew up the farmers report that growing season went up a bit from the 40’s to the 80’s but has been going down again. In my grandfather’s day it was cooler. The same crops, the same climate all the while.
Climate is about what can grow in the local climate. Is the concept of Global Climate even meaningful? We have so many different climates around the globe.
I mentioned this the other day but may be worth another look.
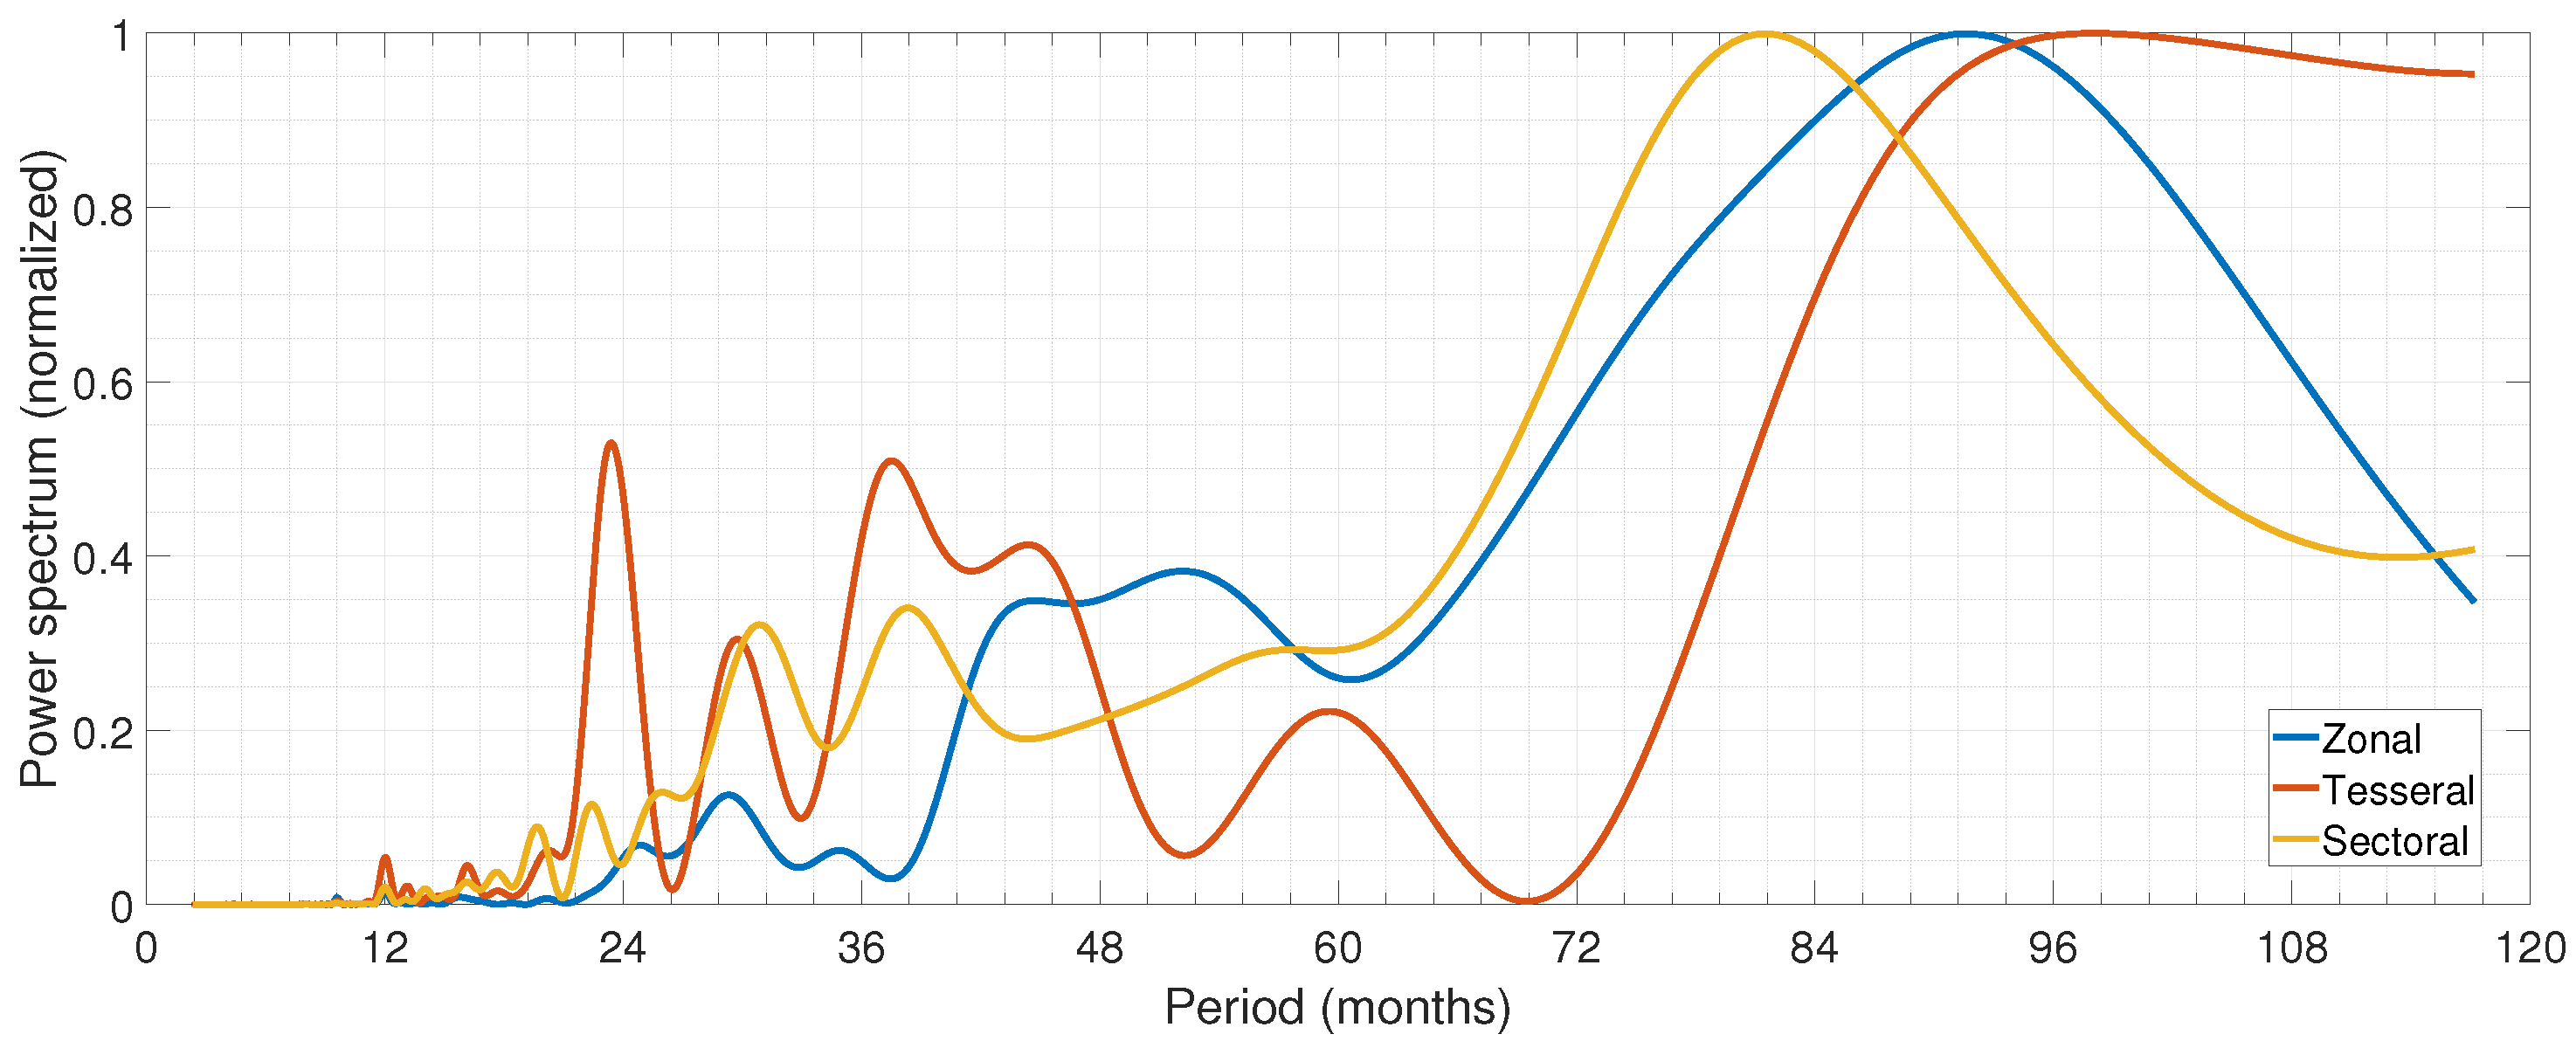
Radcliffe observatory which shows monthly number of hours it rained.
Low pass filter shows that every 40 years there is a burst of rise in the rainfall hours, but this is regularly punctured by another strong periodicity of about 7.5 years.
Where the ‘40 years’ comes from I have no idea but it looks it has nothing to do with the AMO.
‘7.5 years’ is one of the prominent components in the variability of the earth’s magnetic field generated in the planets liquid outer core.
Here is one possible origin of the 7.5 years (90 months, zonal variability-blue line), taken from “Understanding the Interconnection between Celestial Pole Motion and Earth’s Magnetic Field”- GFZ German Research Centre for Geosciences, 14473 Potsdam, German
Prompted and bit puzzled by Matt Kiro’s reply to my post, mentioning Stonehenge, I had a quick look at a Stonehenge diagram and found a surprising coincidence.
Each stone could have represented a year, moving (e.g.) in clockwise direction we find seven and half stones in each of 4 quadrants represented by the north-south and east-west axis.
Ancient Britons were not able to measure rainfall but could count number of raining days in any year. The summer and winter solstice might be important but not as important as dry and rainy years, whatever that meant for bountifulness of wild fruit, hunting of the herbivore wild animals and however limited agriculture they did.
Reanalysis appears to be re-running climate models using bigger computers and knowing what the answers are supposed to be. It looks to me like hindcasting on steroids.
“Downscaling” in the climate biz is more or less the same as “upscaling” that’s now become widely used to enhance older photographs and videos. It works very well if you don’t over-use it. But if you push upscaling software too far, to try and get a level of detail that just wasn’t there in the low-resolution original you end up generating artifacts that simply don’t look real (e.g. faces that were just blobs in the original photo look like walnuts after over-enhancement – I know, I’ve done it). And that’s probably what these twits will end up doing, creating weather details unrelated to reality.
Playing with supercomputers as opposed to actually making real-world observations. That’s my cynical interpretation of this nonsense.
I bet they still parameterize clouds.
And of course they will still make CO2 the sole driver of climate variability.
Right on, Smart Rock, it is almost certain that their “reanalysis” is just re-sampling of an actual dataset, for both the 31 km resolution and the 2 km resolution. Sure, this requires more computing power, and sometimes provides help with a suggestion of a trend, but does nothing to increase data density or quality. About 12 years ago a strong thunderstorm crossed my house and destroyed most of the roof tiles and punched holes in plastic lawn furniture, with max hail size about a tennis ball. The damage was 500 to 600 meters wide and the track was 20 km long, first toward the east, then curving to due south. How do you suppose they got that data into their model? No way, (never mind the difference between weather and climate).
You just reminded me of driving some years ago when for about 200 yards, before reaching a bend, one side of the road was soaked to the centre white line and the other side was bone dry!
Try picking any meaningful rainfall data out of that!
Yes. For thse guys, reanalysis seems to be just drawing the same values in another type of graph.
By chance alone, you can also get patterns: faces in wallpaper patterns, and cycles in a series of random numbers.
Kevin, every now and then, if you squint just right, an image of Jesus or Elvis can be seen on a slice of toast.
I take your point that you can see a lot of things if you squint just right at datasets. Sometimes you see a real aha! and other times you’re just seeing things.
So, more blahblahblah funded with tax dollars that says nothing of any import at all.
Quote:”Such features make ERA5 suitable for a wide range of applications such as analyzing the past climate, monitoring climate change, research, education, policy making and business, in sectors such as renewable energy and agriculture.
What a load of garbage. let’s look at 2 points:
1/ Analyzing past climate.
So what. Why does that need be done, how does it help.
The past climate record is etched into towns, cities, farms, rivers and estuaries etc etc
2/ Agricuture
Lets go with extremes…
Why does a few drops of rain falling on the sand of the Sahara desert set off a flash flood when the same drops of rain falling onto the clay/silt of the Cambridge Fen result in cabbages growing to be the size of beach-balls ##
What sort of story can you and the precious computer confect to explain those sorts of things?
## For the life of me I cannot understand any requirement for such things – who buys and eats them?
IN general, extra large vegetables, pumpkins, etc. seem to me to be transitory version of “who has the best bottle cap collection”
People need diversions, literature, stage, music, parades, … . Their value is to those who enjoy them. Others eek elsewhere.
Just like I said.
More rain around the equator. Less rain at the highest lats. Unbelievable how much rain came down in Brazil the other day.
https://breadonthewater.co.za/2019/09/22/revisiting-the-87-year-gleissberg-solar-cycle/
and NSW, Australia. I must have missed the knowledgable BOM staff’s warning that it WILL flood in the areas that are currently suffering too much wet stuff.
Tom Foolery is apparently running around muttering “dam, dam, dam”, and damn!
The aim of this paper appears to be to determine outlier cities that do not comply.
their examples include London Cologne and Milan.
The model results clearly don’t work for hourly precipitation in Cologne.
Results of future Studies will highlight or hide or tune any results from Cologne to fit their narrative
They only go back to 1950. Useful, maybe, but not very useful. You need to go back before the 1930s at least, and preferably before 1900 (120 years+), in order to cover at least one full cycle of each of the shorter climate cycles.
There is no such thing as a ’30-year climate standard’, only cycles and stochasm. [That’s the noun for ‘stochastic’].
Armagh Observatory has been recording weather conditions for well over two hundred years, making it one of the longest-running meteorological observing stations in the world.
Here is some raw, uncalibrated data (plots) from 1865 to 2000…
http://climate.armagh.ac.uk/averages.html
Averages?
By month?
Not even weighted averages?
28 days, 30 days, 31 days totals are not equitable comparisons.
Nor do averages identify daily rainfall. Identifying the very daily severe rain events that swamp the entire month.
“ some features of the past climate”
And others?
Earlier today on BBC R4 a scientist from Davis claimed to have a climate model that can take changes in human behaviour into account
I never heard such a load of old tosh
The “modelers” should read about what the cooling trend did to northern Europe in the 1500s.
Devastating rains and storms.
It was dreadful that learned magistrates convicted and executed thousands of witches for “causing” the bad weather.
Now it is much more democratic–all, including children–are causing the bad weather.
Major flooding and very high rainfall being experienced in Australia at present, East Coast hit hard but many other areas as well.
Outback Australia is greening again.
you only have to look at the Rhineland extreme rain event last year to see where European weather is heading…
…or the new European record temperature set in Sicily and the new national record in Greece.
So one isolated event gives you an upward trend? Very sciency!
As usual you are spouting nonsense. The historical evidence of flooding events in Rhineland was shown at the time.
Cherish those who seek “the” truth but beware of those who “find” it. — Voltaire (allegedly)
Let me see if I have this right now….the EU has really good weather records for te period 1950 to present. In order to better understand the weather for that period, they will replace the observational record with a computer generated record that will somehow be better than the reality based record?
Why could we possibly need a modelled weather record when we have the observed record? Especially for an area densely populated and a time period during which weather observations were common and accurate?
Have we lost our collective minds?
“the basis from which we will start to realize our scenarios and projections for understanding future climate change”
If they realised the connection between daily-weekly changes in the solar wind and the North Atlantic Oscillation anomalies associated with the flood events, they could then understand more about future climate change.