From NOT A LOT OF PEOPLE KNOW THAT
By P Gosselin on 26. November 2021
Die kalte Sonne reports on a new aerosol study by Liu et al.
The results are a major blow to the high greenhouse-gas climate sensitivity modelers.
IPCC scientists have a favorite wild card they often use to explain serious model discrepancies: aerosols. Mysterious cooling events in the past are often explained away by aerosols from major volcanic eruptions, for example. They act to filter out sunlight.
According to IPCC climate models, the mean global temperature should have risen by 1.5°C since 1850 due to the higher CO2 concentrations. But best estimates show that it has instead risen by only 1.1°C. So what about the missing 0.4°C?
Naturally, the missing 0.4°C of warming since 1850 gets explained by the higher 20th century aerosol levels in the atmosphere – due to the burning of fossil fuels. Air pollution by man over the course of the late 19th century and entire 20th century are said to have dimmed the earth, and thus this explains the 0.4°C less warming.
Surprise: global aerosol emissions have been flat over past 250 years
But now results by a new study appearing in the journal Science Advances by Liu et al tells us that the forcing by aerosols had to have been overestimated by climate modelers. IPCC modelers insisted that 20th century aerosol concentrations were higher than during the pre-industrial times, and this is what kept the climate from warming by 1.5°C.
According to the scientists led by Liu, however, atmospheric aerosols in the preindustrial times were just as high as they were just recently. They were in fact more or less constant over the past 250 years. No change means it could not have been aerosols putting the brakes on temperature rise:

Image: Science Advances, Liu et al.
That’s a real embarrassment for the IPCC modelers. It means CO2 climate sensitivity has been overestimated.
Aerosol concentrations have changed very little
The above chart is the result they found from records of 14 Antarctic ice cores and 1 central Andean ice core. These tell us that “historical fire activity in the Southern Hemisphere (SH) exceeded present-day levels”. Forest fires back then were much worse, and so more aerosol emissions were greater than modelers believe!
“The results come as a real surprise,” reports Die kalte Sonne.
Significance: CO2 climate sensitivity overstated in models
The researchers found that instead of aerosols increasing during the 20th century, they likely in fact decreased by 30% over the 20th century! This means that aerosols could not have suppressed the warming by 0.4°C, meaning the climate sensitivity by manmade greenhouse gases has to be dialed back accordingly.
The models have got the aerosols all wrong.
Confirmed by previous study
The new findings are underpinned by earlier findings in a 2018 study by Hamilton et al, who also found “significantly increased aerosol concentrations in the pre-industrial atmosphere.”
“Stark contradiction” to model assumptions
“The high natural aerosol emissions of the preindustrial time are thus clearly a global phenomenon,” reports Die kalte Sonne. “The documented constancy of the aerosol total emissions are in stark contradiction to the assumptions in the IPCC climate models.”
CO2 warming effect has to be much less
“The consequences for the climate models could be enormous,” Die kalte Sonne adds. This means that CO2’s warming effect thus has to be much less. “The study tells us that the CO2 climate sensitivity indeed has to be in the lower range of the IPCC’s 1.5-4.5°C warming for a doubling of CO2.”
Given that Arctic amplification is not understood and it accounts for a significant portion of warming since 2000, the 0.4C is a valueless value.
Arctic amplification is a myth created by the warmists to explain whey nobody could feel any temperature increase. It was all happening “out there”, where nobody could go to check if it was real.
Hivemind
It is understood that temperatures recorded in the high NH latitudes are increasing >2 times greater than the rest of the planet.
See the chart provided by Willis of latitudinal covering 2000 to 2017.
Perhaps yourself and those who contributed to your up-ticks and my down-ticks could explain what is wrong with the data / chart. Willis is not the only one identifying this latitudinal occurrence.
Hivemind says “It was all happening “out there”, where nobody could go to check if it was real”.
It is rare that anyone checks localized positive or negative variations to temperature anomalies anywhere on the earths surface, let alone what may have been influencing factors.
The look at what I said, and prove that wrong.
Regards
Not only is the effect of CO2 less than models are programmed to emulate, BUT, the atmosphere is actually cleaner of particulate matter which acts similar to aerosols in cooling effect. The CLEANER atmosphere today acts to increase the available solar input into the system.
Having a cleaner atmosphere means we are actually WARMER than we otherwise would have been
Hivemind
But wait there is more…
See the attached chart by Ryan N. Maue detailing the SH, NH and resulting global average for 2005.
Most folks ignore the detail, I live in the detail because that is where the answers are. In all the years Ryan posted these charts NO ONE has ever noticed or commented on the temperature mirror between the NH and the SH.
Look at what happened at the same time as the SH Ozone hole peaked in late September, the SH temperature dropped by 0.8C and shot back up again within a few days. Really. The two charts I have provided identify both the latitudinal and annual verification of the temperature mirror.
Hivmind, unless you or any up or down tickers, or any other person can explain why this temperature mirror is occurring, most notibly in years such as El Nino (not limited to) nobody has a clue as to what really controls the “temperature Anomaly variations” at surface level.
Climate Models that attribute CO2 to global warming, are garbage, and only serve to supply the grease that turn the wheels of the CO2 warming political wagon.
Ozonebust,
The arbitrary aerosol adjustment is unique to each model and, therefore, is wrong for all except at most one undetermined model. This means ALL the climate model indications are valueless.
None of the models – not one of them – could match the change in mean global temperature over the past century if it did not utilise a unique value of assumed cooling from aerosols. So, inputting actual values of the cooling effect (such as the determination by Penner et al.) would make every climate model provide a mismatch of the global warming it hindcasts and the observed global warming for the twentieth century.
This mismatch would occur because all the global climate models and energy balance models are known to provide indications which are based on
1.
the assumed degree of forcings resulting from human activity that produce warming
and
2.
the assumed degree of anthropogenic aerosol cooling input to each model as a ‘fiddle factor’ to obtain agreement between past average global temperature and the model’s indications of average global temperature.
Decades ago I published a peer-reviewed paper that showed the UK’s Hadley Centre general circulation model (GCM) could not model climate and only obtained agreement between past average global temperature and the model’s indications of average global temperature by forcing the agreement with an input of assumed anthropogenic aerosol cooling.
And my paper demonstrated that the assumption of aerosol effects being responsible for the model’s failure was incorrect.
(ref. Courtney RS An assessment of validation experiments conducted on computer models of global climate using the general circulation model of the UK’s Hadley Centre Energy & Environment, Volume 10, Number 5, pp. 491-502, September 1999).
More recently, but still long ago (i.e.in 2007) Kiehle published a paper that assessed 9 GCMs and two energy balance models.
(ref. Kiehl JT,Twentieth century climate model response and climate sensitivity. GRL vol.. 34, L22710, doi:10.1029/2007GL031383, 2007).
Kiehle’s paper is on-line at https://agupubs.onlinelibrary.wiley.com/doi/full/10.1029/2007GL031383
Kiehl found the same as my paper except that each model he assessed used a different aerosol ‘fix’ from every other model.
He says in his paper:
And, importantly, Kiehl’s paper says:
(emphasis added, RSC)
And the “magnitude of applied anthropogenic total forcing” is fixed in each model by the input value of aerosol forcing.
Please use the link I have provided to Kiehl’s paper to see Kiehl’s Figure 2.
It shows that
(a) each model uses a different value for “Total anthropogenic forcing” that is in the range 0.80 W/m^-2 to 2.02 W/m^-2
but
(b) each model is forced to agree with the rate of past warming by using a different value for “Aerosol forcing” that is in the range -1.42 W/m^-2 to -0.60 W/m^-2.
In other words the models use values of “Total anthropogenic forcing” that differ by a factor of more than 2.5 and they are ‘adjusted’ by using values of assumed “Aerosol forcing” that differ by a factor of 2.4.
This means that – at most – only one of the models can provide correct indications and there is no way to determine which one – if any – provides indications with some value.
Richard
Excellent comments, thank you Richard.
Nice to hear from you.
Best wishes, Allan
Yes, great comments, Richard.
It’s nice to be proven correct, isn’t it. 🙂
Tom Abbott,
Thanks for your interest and kind words but I have found it is rarely “nice to be proven correct”.
My experience is that
one is often forgiven for being wrong but rarely forgiven for being right.
Richard
Well, I forgive you ; )
Thanks for all of that.
Richard
Thanks for reminding us of this important information. See my comments above.
For some bizarre reason, Courtney is responding to your comments above.
Odd, that Richard failed to note the similarities of his claims to your claims, except for the greater detail in Richards..
The way I interpret his posting is that he simply attached his comments to the first one at the top. We are not of differing opinions.
Ozoneburst,
Yes. I supported your view with my personal recollections.
Please take no notice of the troll’s attempt to cause a rift between us.
Richard
It is actually pretty easy to determine which model is (Currently) closest to reality.
A physical comparison of the last 30 years of modeled output vs the last 30 years of measurements of Unadjusted (AKA UnKarlized) data
Very nice clear argument, many thanks!
Antarctic is the ideal control for isolating the impact of CO2 on temperatures. There is no weather vapor, urban heat island effect and the albedo of level and constant. The above chart shows Antarctica warming since 1970 which I don’t believe is supported by the evidence. Antarctica hasn’t warmed in over 100 years, and Satellite data shows no warming since inception back in 1979. Anyway, the oceans are warming. The oceans control the global temperatures. You have to model warming H20 to model warming atmospheric temperatures. CO2 only affects LWIR between 13 and 18 microns, peak 15 microns. Those wavelengths won’t warm water, and in fact won’t even melt ice. Ice of temp 0C emits 10.5 micron LWIR. If CO2 could warm water, ice would melt itself. Until someone can demonstrate experimentally that 15 micron LWIR can warm water, they will never be able to model the climate…never. That is like trying to price a bond without knowing the interest rate.
Sorry, but Antarctica does not prove that CO2 does not cause overall warming of the Earth. Go read the recent Wijngaarden & Happer paper on CO2 and you find that increasing CO2 levels tend to cool Antarctica, because of the major and persistent temperature inversion that exists there.
The key issue with CO2, which Wijngaarden & Happer don’t actually address, is what is happening in the 2/3rds of the Earth’s surface that is cloudy.
You’re right that over much of Antarctica, including all of the Antarctic Plateau, the “lapse rate” is typically negative. In other words, as altitude increases, so does temperature. That’s because (unlike most other places) the air warms the ground, instead of vice-versa.
In most places, other than Antarctica, the surface is, on average, warmer than the air. The surface absorbs more radiation than it emits (and loses the balance by evaporation and convection).
But on the Antarctic Plateau, it’s usually the other way around. The surface absorbs almost no radiation. Because the surface is so cold it also emits little radiation, but it nevertheless emits more than it absorbs (and it obtains the balance by contact with somewhat warmer air).
The Antarctic Plateau’s negative lapse rate means as additional CO2 raises the average 15 µm emission height, it increases (rather than decreases) the average temperature at that (higher) emission height. That accelerates radiative emissions, and cools the continent. So “greenhouse warming” becomes “greenhouse cooling” for much of Antarctica.
Cloud feedbacks are certainly the elephant in the living room. van Wijngaarden & Happer are well aware of that issue, it just isn’t the topic of their papers.
Here are their papers, BTW:
● https://arxiv.org/pdf/2103.16465.pdf (2021)
● https://arxiv.org/pdf/2006.03098.pdf (2020)
Thanks for laying it all out, Dave.
It’s fascinationg learning how the Earth’s weather works.
Dave,
I think that if you look at this temperature data it will show that the main thermal radiant emitter to space for the elevated Antarctic icecap is the solid ice surface itself.
Dome Argus Weather Station Temperature Profiles from 09 May to 17 Dec 2008
Expanding on the effect of earthbound aerosols what, if any, has been the effect of transient interplanetary dust clouds getting between us and the sun? We all know that the dust exists and that its density is variable across the space between the planets and the sun. It would be odd indeed if these dust clouds didn’t have an effect on the global temperature, cooling things down from time to time.
It would be interesting to see how the modellers would account for that if it was considered significant.
The Cosmic year is about 250 million years so you’d expect any climate impact, including dust, from that to be at 250 my intervals wouldn’t you?
Presumably the dust is also orbiting the galactic center at the same rate as the various solar systems.
Sigh.
Don’t take much to surprise climate soothsayers does it?
“Forest fires back then were much worse, and so more aerosol emissions were greater than modelers believe!”
No further comment to the fires of today beeing worse then we thought.
Or aerosols are 30% less, which means not only are the not offsetting the warming the drop in aerosols are part of the cause.
Read the history of fires in Los Angeles and surrounding counties. Back in the early 1800’s, people used to set annual fires, because people liked the spectacle. It wasn’t until mud slides destroyed the rail lines that fires became a “problem”. Since the 1950’s, the fires (overall) have lessened… in spite of having more serial arsonists… by somewhere around 20%.
The reason they are so much more devastating should be obvious to all… the huge amount of people and structures now in harms way! There have always been seasonal Santa Ana winds that blow through the canyons towards the Pacific Ocean. I spent all of a 33 year career as a firefighter on the Los Angeles County Fire Department. We had extensive brushfire training every year.
Every year the memo would come from our Fire Chief… “The fire season will be bad this year, because of drought… the brush is dried out… or… because of the heavy rains, which caused heavy brush growth!” We never saw a memo noting it would be an average year!
https://www.latimes.com/archives/la-xpm-2007-may-11-me-history11-story.html
Perhaps this finding will finally nail the lie promulgated on this site by nyolci that the global cooling observed from 1940-1980 was due to increased aerosols.
Graemethecat wrote, “…the lie promulgated on this site by nyolci that the global cooling observed from 1940-1980 was due to increased aerosols.”
1. A difference of opinion, honestly held, is not a lie. Calling it a lie is poisoning the well. Please don’t.
2. That’s just about the only thing I agree with nyolci about.
I do not think it is likely to be a coincidence that the cooling period ended, and warming began, at about the same time that power plants & factories in the developed world began installing scrubbers, to curb emission of air pollutants.
3. The fact that there apparently was no large centennial-scale trend in aerosols in the southern hemisphere does not mean there were no trends, at least on shorter timescales, in the northern hemisphere.
In the 1970s the twin scares w/r/t fossil fuels (besides running out!) were global cooling (loosely, “a new ice age”), and acid rain. Sulfur aerosol emissions were thought to be the chief culprit w/r/t acid rain, and also contributors, along with particulates, to global cooling.
Here’s Newsweek reporting the grim outlook:
https://sealevel.info/newsweek_old.htm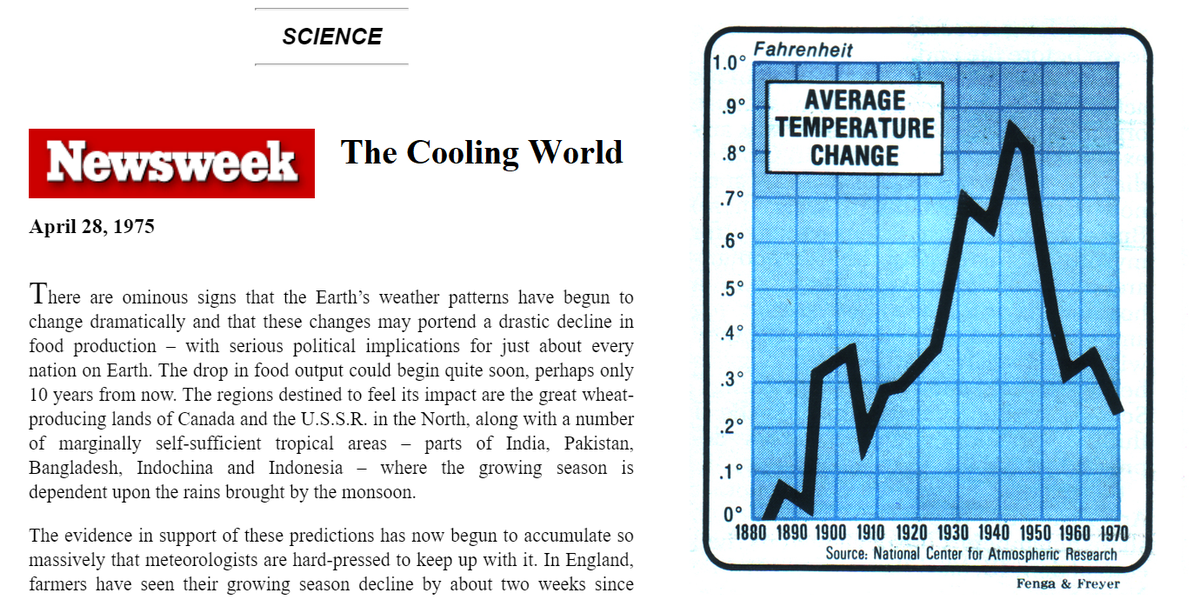
Ground-level air pollution had long been recognized as a significant public health problem. But prior to the “new ice age” (global cooling) and “acid rain” scares, the standard remedy for protecting people from ground level air pollution caused by coal-fired electrical power plants was simply to build very tall smokestacks. That was effective for addressing the public health problems (except when thermal inversions brought the smoke back down to ground level, most infamously in Los Angeles). But it had side-effects, such as aerosols which cause cooling.
So, in the late 1970s building tall smokestacks to abate ground-level air pollution went out of fashion in the western hemisphere. The tallest chimney ever built in the United States was apparently at Homer City Generating Station, in Homer City, PA (≈¼ mile tall), in 1977:
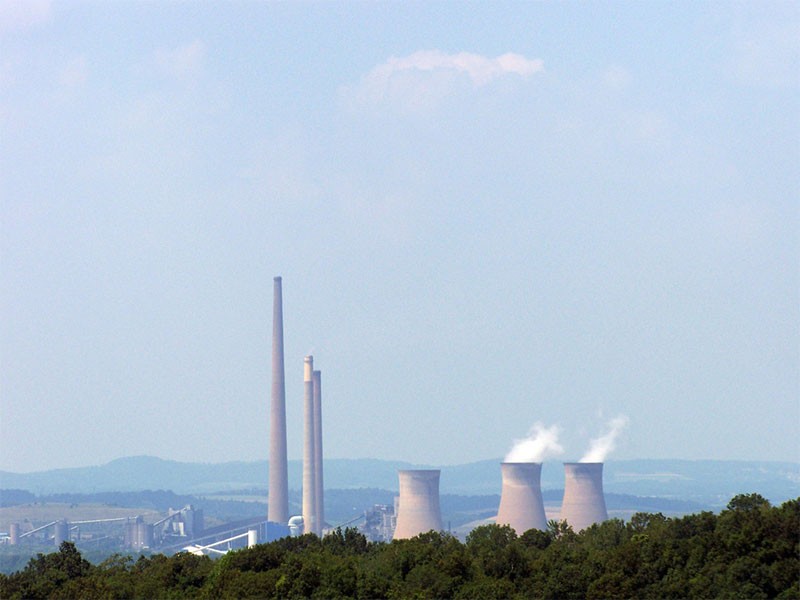
The global cooling scare of the 1970s, and the acid rain scare of the late 1970s and 1980s, put an and to that. Power plants still have fairly tall chimneys, but building taller and taller chimneys hasn’t been considered a primary remedy for air pollution in many decades.
American power plants are very clean these days. There are no longer any operating coal-fired power plants in the USA without scrubbers, and there haven’t been for many years. That’s why, for example, the propagandists at the Associated Press and the Washington Post resort to “fake smoke” pictures (which are really just backlit condensing steam):
https://sealevel.info/climate/Ltr_to_Washington_Post-propaganda_not_emissions_spewing.html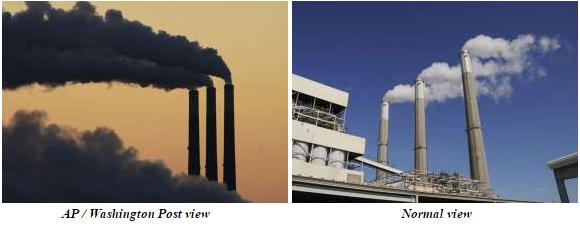
That’s because they can’t find any pictures of real smoke from an American power plant, because there are no power plants which emit any visible smoke, anymore, in the USA.
In the 1970s we were warned, loud and long, that to avoid disastrous global cooling we urgently need to clean up particulate and aerosol emissions. So we did, and, sure enough, the climate warmed. But now some people want us to think that’s a bad thing. The best evidence is that it’s not.
Global warming from anthropogenic GHG emissions is real, but the best evidence is that it is modest and benign, and higher CO2 levels are very beneficial for agriculture and natural ecosystems. We’re currently enjoying a “climate optimum” — in fact, the best climate the Earth has seen in at least a thousand years, perhaps even longer. So why do so many Chicken Littles obsess over fictional calamities, instead of counting their blessings?
The problem with nyolci is that she doesn’t form hr own opinions based on research and consideration. She believes whatever her friends and professors believe.
Nyolci has been caught red-handed several times recounting obvious lies (for example claiming the Vikings did not cultivate barley in Greenland). I therefore make no apology for my statement. Furthermore, he/she/it is of bad faith and immediately resorts to abuse and slurs when confronted.
As the west was cleaning up aerosols China and others were ramping them up so I’m unsure there was a lot of change on balance for the world as a whole?
Just seems like curve fitting.
Didn’t Roy Spencer show that if you remove UHI from the records the continental USA has been flat or declining since the 30s regardless what CO2 or aerosols have done?
“As the west was cleaning up aerosols China and others were ramping them up so I’m unsure there was a lot of change on balance for the world as a whole?”
Good point.
Thanks, Dave, good comments. I suppose people don’t count their blessing because the culture (backed by government, corporate media and academia) produces a drumbeat of constant alarmism.
Exactly, it was due to first the PDO going negative and then the AMO following. Of course, once that is assumed then most of the recent warming must be associated with the warm phases of these cycles.
Moma Nature at work.
How does nyolci, or any of the aerosol crowd, explain the equivalent cooling from 1880 to 1910?
They don’t. They either ignore the cooling or try to claim that it was regional only.
Please don’t confuse me with Facts….
“CO2 warming effect has to be much less.”
I guess Liu et al will all be looking for new jobs any day now.
I bet Mann and the Hockey Stick Team are already conspiring to come out with a study to refute these claims. If history is any guide, anyway.
“The models have got the aerosols all wrong.”
Medieval epicycles all over again.
I don’t think so . . back then they were just going by what they saw in the sky, no one had a time machine to find out about what we now understand about gravitational orbits and such ; )
“Modelers Got Aerosols All Wrong”
Can these models do anything other than consume huge computing and energy resources?
Not really.
They were getting it wrong 30 years ago. See Kuwait oil well fires during Gulf War I.
Wrong vs observations but right on seen from research grant suppliers.
I recall Douglas Hoyt resolved this question way back in 2009.
“No aerosol trends except for major volcanoes.”
Here is one of many records of that conversation.
https://wattsupwiththat.com/2009/06/27/new-paper-global-dimming-and-brightening-a-review/#comment-138288
Is Doug Hoyt out there? Please comment.
http://www.climateaudit.org/?p=755
Douglas Hoyt:
July 22nd, 2006 at 5:37 am
Measurements of aerosols did not begin in the 1970s. There were measurements before then, but not so well organized. However, there were a number of pyrheliometric measurements made and it is possible to extract aerosol information from them by the method described in:
Hoyt, D. V., 1979. The apparent atmospheric transmission using the pyrheliometric ratioing techniques. Appl. Optics, 18, 2530-2531.
The pyrheliometric ratioing technique is very insensitive to any changes in calibration of the instruments and very sensitive to aerosol changes.
Here are three papers using the technique:
Hoyt, D. V. and C. Frohlich, 1983. Atmospheric transmission at Davos, Switzerland, 1909-1979. Climatic Change, 5, 61-72.
Hoyt, D. V., C. P. Turner, and R. D. Evans, 1980. Trends in atmospheric transmission at three locations in the United States from 1940 to 1977. Mon. Wea. Rev., 108, 1430-1439.
Hoyt, D. V., 1979. Pyrheliometric and circumsolar sky radiation measurements by the Smithsonian Astrophysical Observatory from 1923 to 1954. Tellus, 31, 217-229.
In none of these studies were any long-term trends found in aerosols, although volcanic events show up quite clearly. There are other studies from Belgium, Ireland, and Hawaii that reach the same conclusions. It is significant that Davos shows no trend whereas the IPCC models show it in the area where the greatest changes in aerosols were occurring.
There are earlier aerosol studies by Hand and in other in Monthly Weather Review going back to the 1880s and these studies also show no trends.
So when MacRae (#321) says: “I suspect that both the climate computer models and the input assumptions are not only inadequate, but in some cases key data is completely fabricated – for example, the alleged aerosol data that forces models to show cooling from ~1940 to ~1975. Isn’t it true that there was little or no quality aerosol data collected during 1940-1975, and the modelers simply invented data to force their models to history-match; then they claimed that their models actually reproduced past climate change quite well; and then they claimed they could therefore understand climate systems well enough to confidently predict future catastrophic warming?”, he close to the truth.
_____________________________________________________________________
Douglas Hoyt:
July 22nd, 2006 at 10:37 am
Re #328
“Are you the same D.V. Hoyt who wrote the three referenced papers?” Yes.
“Can you please briefly describe the pyrheliometric technique, and how the historic data samples are obtained?”
The technique uses pyrheliometers to look at the sun on clear days. Measurements are made at air mass 5, 4, 3, and 2. The ratios 4/5, 3/4, and 2/3 are found and averaged. The number gives a relative measure of atmospheric transmission and is insensitive to water vapor amount, ozone, solar extraterrestrial irradiance changes, etc. It is also insensitive to any changes in the calibration of the instruments. The ratioing minimizes the spurious responses leaving only the responses to aerosols.
I have data for about 30 locations worldwide going back to the turn of the century.
Preliminary analysis shows no trend anywhere, except maybe Japan.
There is no funding to do complete checks.
__________________________________________
Decades ago, there were real climate scientist like Doug Hoyt and others, who did real climate science, and produced real results – only a few remain – like Lindzen, Spencer, Christy, and the rest of the great old-timers.
The new crop of government-funded climate alarmists with their over-cooked global warming models are little more than climate bullsh!tters, paid to fabricate scary scenarios to frighten children-of-all-ages. Global warming alarmism is a fifty-year-old fraud, filled with false scary stories designed to frighten the gullible and the stupid, to gain financial and political power for a corrupt elite.
Trillions of dollars and millions of lives have been wasted on climate false alarm. National energy grids have been badly compromised, to “fight global warming” in a cooling world.
This will end badly, and soon. Told you so, 19 years ago.
I blame the ubiquity and power of computing resources today. It’s far easier for lazy Climate “Scientists” to run their GCM’s on supercomputers than to do the arduous, exacting long-term work of actually measuring things in the physical world.
“for example, the alleged aerosol data that forces models to show cooling from ~1940 to ~1975. Isn’t it true that there was little or no quality aerosol data collected during 1940-1975, and the modelers simply invented data to force their models to history-match; then they claimed that their models actually reproduced past climate change quite well; ”
Another thing is the climate modelers are claiming they are matching the historical temperature record, but they are not matching the true temperature record, they are matching a bogus, bastardized computer-generated temperature record.
Here’s a NASA vwebsite with the U.S. regional temperature chart displayed next to the bogus, bastardized, “hotter and hotter”, instrument-era Hockey Stick chart.
https://www.giss.nasa.gov/research//briefs/1999_hansen_07/
The climate modelers are matching the bogus, bastardized Hockey Stick temperature profile on the right.
They should be trying to match the True temperature profile of the regional chart on the left, if they are seeking accuracy.
The U.S. regonal chart shows a cooling of 2.0C from 1940 to 1980.
The bogus, bastardized Hockey Stick chart shows a cooling of about 0.5C from 1940 to 1980.
So the IPCC climate modelers are trying to match their bogus future casts of the Earth’s temperatures with the bogus, computer-generated, contaminated, instrument-era temperatue records. How much more wrongheaded can these people be? They are living in a fantasy land they have created for themselves and it doesn’t match reality. And these are the people giving our leaders “guidance”.
Allan
I took that challenge a while ago, went onto the GISS site and graphed the 5 year mean from 1880 – 2000 and got a completely different graph than Hansen shows in that paper, where the 90s are now much hotter than the 30’s
Hansen, before manipulating the temperature record became an issue for him, said that 1934 was 0.5C warmer than 1998.
In the Climategate emails somewhere, a colleague of Hansen’s sent him an email confirming the 0.5C Hansen temperature, saying his data showed virtually the same figure, which he gave as1934, being 0.49C warmer than 1998.
The year 1998 was the hottest year since 1934, and I suppose Hansen figured the temperatures would continue to climb because of CO2 and get warmer than 1934, so at the time it wasn’t an issue that 1934 was warmer than 1998.
But then the temperatures started to cool after 1998, (see chart below), which shouldn’t be happening if humans are increasing CO2 in the atmosphere, which we were, so they had to do something to continue the fiction that CO2 was making things hotter and hotter, so they manipulated the global temperature record to the point that they claimed about 10 of the years between the year 2000 and 2015 were the “hottest year ever!”. Scaring people to death, in the process.
The year 2007 was the last time Hansen admitted 1934 was warmer than 1998, but by this time he was claiming the difference was very small, and as time went along, 1934 was no longer the hottest year in the adjusted temperature record.
Here’s the UAH satellite chart. See if you can see any “hottest year evahs! anywhere between 1998 and 2016. The fact is there are no such “hottest year evahs!” showing on the UAH chart.
NASA and NOAA managed to create lots of “hottest year evahs!” in their computers, but that’s the only place they occurred. They don’t show up on an honest chart like UAH.
NASA and NOAA use temperature charts to lie to the world to keep the Human-caused Climate Change narrative going.
Very interesting and simple technique—unlike using sun photometers to measure aerosol scattering in narrow wavelength bands that have myriad calibration and drift problems.
” New Study: Modelers Got Aerosols All Wrong ”
This is not news!
News would be ” New Study: Modelers Got Something right “.
From the article: “IPCC scientists have a favorite wild card they often use to explain serious model discrepancies: aerosols.”
Yes, a lot of people do that, and not necessarily just IPCC scientists.
From the article: “Surprise: global aerosol emissions have been flat over past 250 years”
Uh, oh, now you are going to make somebody cry with that statement! They thought they had it all figured out, and now look what you have done!
Nothing is more hurtful than hitting your head against the data from nature. Though for so called “climate scientists” the generated sound is much more pleasurable.
We knew this 30 years ago when it was predicted there would be significant global cooling if Saddam Hussein set fire to 100 Kuwaiti oil wells. In the end 600 were set alight.
The subsequent studies, including those by Carl Sagan, showed the effects were local and not long lasting. In effect the Nuclear Winter hypothesis had been disproven.
https://en.wikipedia.org/wiki/Nuclear_winter#Kuwait_wells_in_the_first_Gulf_War
30 years ago Mike Miller and SafetyBoss of Calgary extinguished the last of the Kuwait oil well fires.
I met Mike soon thereafter and had a good chat with him –a great guy – we’re proud of him and his men.
HISTORY: NOVEMBER 6, 1991 CANADIANS CAP THE LAST OIL FIRE IN THE GULF WAR
By Marc Montgomery |
https://www.rcinet.ca/en/2015/11/06/history-november-6-1991-canadians-cap-the-last-oil-fire-in-the-gulf-war/
(excerpts)
Specialized oil well experts were brought in to quell the fires. At first four major US companies were contracted and some from other countries including Kuwait, and then the Canadians were called.
SafetyBOSS of Calgary became the leading effort, and although called in last, ended up capping the most wells, although all efforts were initially slowed by landmines around the sites which had to be cleared first at a high degree of danger.
In the end the Canadian company capped 180 of the some 600 wells, setting a rapid pace the other companies could not match. The fires, which had estimated would burn for three to five years, were put out in a matter of months.
The last fire was put out by Canada’s SafetyBOSS on November 6, 1991.
They did not get anything wrong, they are simply lying to advance their leftist political agenda.
They just been caught out now.
Any person with an intellect above a dried out dog turd has always known they are politically motivated liars, so exactly what have they been “caught out” at?
Have the assumptions (in the models) been tested (or are they accepted until serendipitously discovered to be incorrect)? When? How often? What were the changes? Have the changes been applied? To what effect? Etc., etc., etc.
They are models, they are not reality, treating them as if they are reality is what mental retards do.
Climate sensitivity to CO2 is wrong because the science is wrong. The aerosols should now help highlight that problem. The NASA CERES data reported:
“… the root cause for the positive TOA net flux and, hence, for a further accumulation of energy during the last two decades was a declining outgoing shortwave flux and not a retained LW flux. ” – Hans-Rolf Dübal and Fritz Vahrenholt, October 2021, journal Atmosphere, Radiative Energy Flux Variation from 2001–2020.
“ the observations show a trend in net downward radiation of 0.41 ± 0.22 W m−2 decade−1 that is the result of the sum of a 0.65 ± 0.17 W m−2 decade−1 trend in absorbed solar radiation (ASR) and a −0.24 ± 0.13 W m−2 decade−1 trend in downward radiation due to an increase in OLR ” – Loeb et al, Geophysical Research Letters, June 2021, Satellite and Ocean Data Reveal Marked Increase in Earth’s Heating Rate
From these papers it appears CO2 sensitivity could even be negative. How could this be?
1) One of the most convincing arguments used to promote CO2 warming is the existence of downwelling IR (DWIR). How could it not provide warming? The answer is that the atmosphere responds with a cooling feedback. All the energy transport mechanisms (convection, advection, latent heat, conduction and radiation) immediately work to counter the warming influence. It’s basically the old “nature abhors a vacuum” situation. As a result there is no significant climate forcing from DWIR. When all these energy transport mechanisms are averaged out we have sufficient energy flow to remove incoming solar energy.
2) So, if DWIR doesn’t explain why the surface is warmer then what does? The answer itself is a bit unusual. It is the ability of the atmosphere to radiate energy to space. Kind of the opposite of the greenhouse effect but dependent on the same radiation active gases. Essentially, the radiation of energy to space creates an energy vacuum that all the energy transport mechanisms seek to fill. This leads to the lapse rate which defines the temperature of the atmosphere. The surface temperature is primarily based on the mass of the atmosphere.
As a result the temperature is tied to the ability of the atmosphere to radiate energy to space. Climate science has been studying the wrong mechanism. The real issue is whether changes to the atmospheric composition changes its ability to radiate away energy. Until climate science (models) change to correct this mistake they will never come close to modelling the climate.
Richard,
One of the aspects that became clear from our use of the DAET climate model is that there is a relationship between the temperature of the Earth’s tropopause and the freezing point of super-cooled water. Solid ice particles are effective emitters of thermal radiation and so in general there is a link between the freezing point temperature of the dominant condensing volatile in a planetary atmosphere and its specific tropopause temperature. This relationship appears to hold not just for the Earth, but also for the condensing volatiles of concentrated sulphuric acid for Venus and methane for Titan (the giant moon of Saturn).
It’s incredible that this discussion/debate continues to ignore the actual empirical data measuring the radiative forcing from CO2.
We know from the empirical data/measurements(from almost 2 decades) that the models/IPCC add 42% more forcing from CO2 than is actually taking place.
https://www.marketforum.com/forum/topic/57636/
It’s like Dr. Spencer once stated…………”95% of Climate Models Agree: The Observations Must be Wrong”
https://www.drroyspencer.com/2014/02/95-of-climate-models-agree-the-observations-must-be-wrong/
https://notrickszone.com/2021/10/30/swiss-analysis-climate-models-running-too-warm-falsely-calibrated-ipcc-needs-to-review-its-findings/
There are at least two ways to estimate ECS observationally. One is via energy budget estimates (e.g. Lewis and Curry), giving about 1.7. The other is via Bode feedback analysis, where modelled ECS of 3 is Bode 0.65, of which about 0.5 is WVF per AR4 and the remainder 0.15 is mostly clouds. Now clouds observationally have zero or slight negative feedback, and observational WVF is about half of modeled because models underestimate ocean precipitation by about half (confirmed by ARGO salinity). So Bode about 0.25 gives ECS about 1.7. Both methods give about the same result.
What this study does is help explain why models run hot.
Rud, nice to read your statement, as usual much appriciated. However, also LC18 have to use an estimate for the ERF aero (total) , they give -0.77 W/m² for PI to presence. Both papers mentioned in the meanpost make it more possible that this estimation must be updated to the lower bound ( absolute value). If so the sensitivity to 2*CO2 forcing would also be lower. I’m quite sure that Nic Lewis will incorporate these new findings in a new estimate of TCR(ECS) with the EBM-approach.
best Frank
Thanks Rud!
Some long time ago, that was discussed even at RealClimate in their better days (2006) when they still allowed dissident voices…
https://www.realclimate.org/index.php/archives/2006/02/an-aerosol-tour-de-forcing/
With my comments following the article and surprisingly no comment back of the authors…
First of all, human induced aerosols mainly are in the lower troposphere and rain out in days, while natural aerosols (mainly the haze of the “blue mountains” all over the world caused by terpenes from pine trees) remain far longer and are 7-100 times more abundant in the free atmosphere than human (SO2) aerosols…
Moreover, when there was a firm reduction in Europe of the aerosol emissions, that had no measurable effect at all where it should be, according to the Hadley Center climate model of that time…
See: http://www.ferdinand-engelbeen.be/klimaat/aerosols.html
Those in the Human-caused Global Cooling crowd should pay attention to Ferdinand’s comments.
This probably has nothing to do with the article but it came to mind reading through it.
From Exploring our Fluid Earth: A classic way of demonstrating the difference between precision and accuracy is with a dartboard. Think of the bulls-eye (center) of a dartboard as the true value. The closer darts land to the bulls-eye, the more accurate they are.
Seems to me that “consistency” is a more appropriate term than “precision” in this explanation. Precision in normal usage is synonymous with accuracy.
Not so. Precision is more closely described as repeatability. Resolution is an inherent property. To be more repeatable higher and higher resolution is needed. The result is more precision. That’s why micrometers are used over calipers.
It is why significant digits are important. Averages do not increase precision because of this, even though many scientists would like you to believe otherwise. Averaging multiple measurements can not replace or infer higher “precision”, i.e., the resolution of the original measurements.
Like the band instruments on the Titanic, the important thing about climate models is to get the tuning right.
So, can this be considered to be a Game-Changer?
Can the Alarmists ignore these results successfully?