In a talk featured in our Monday Weekly Climate and News Roundup at the 14th International Conference on Climate Change Willie Soon [at time 26:49] took me, (Svalgaard) to task for arguing that there has not been any trend in solar activity the past 300+ years.
He showed their new reconstruction of solar activity as support for his criticism:
Here is the video cued up.

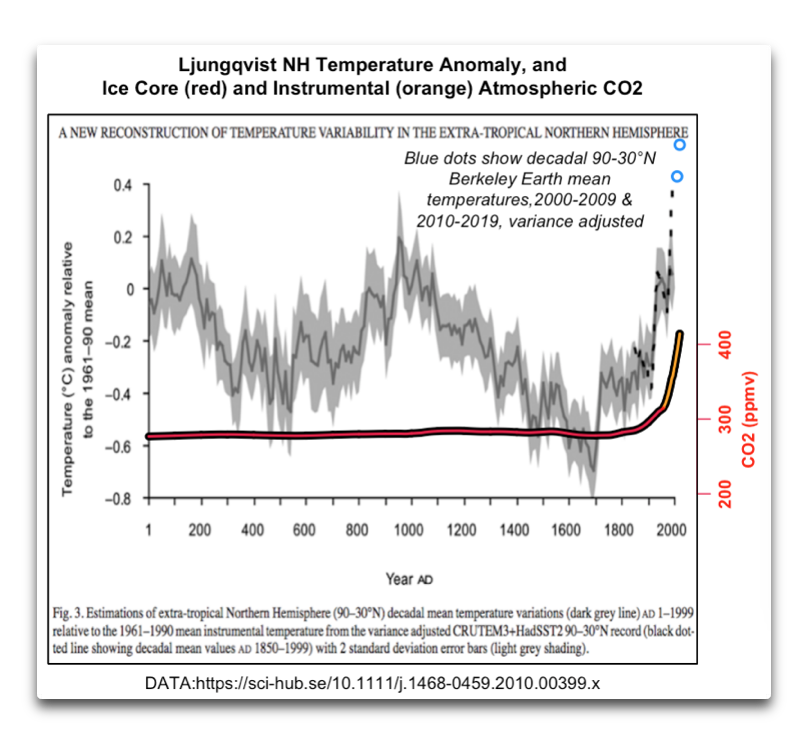
I also show the reconstruction by me and Ken Schatten [2016, https://svalgaard.leif.org/research/Reconstruction-of-Group-Number-1610-2015.pdf ]. To my eye there is no difference between our reconstruction and theirs [based on Machine Learning], except that we have error bars and they don’t. It is amazing how people’s bias can cause them to draw contrary conclusions from [almost] identical data.
Leif,
Unfortunately, your plots do not emphasize the critical part. The peaks vary a lot, the critical part for long-term climate is the baseline under the minima. The relationship between solar variability and climate change is unknown. Is it just TSI, or is more involved? How flat is the long-term baseline? Compare the ACRIM model to the PMOD model for example (see attached). The difference is fractions of a W/m^2 in 1996 and 2008, but might be significant. It can’t be proven one way or another, we don’t know enough about how climate varies with solar activity. Forcing a flat baseline can be done, ignoring the difference can be done, but we still don’t know.
I’m not forcing a flat baseline. It has been shown that variations of TSI are completely explained by variations of the solar magnetic field. We have good direct measurements of the field from the 1960s on both from the ground and from space [since 1996]. We have very well understood proxies of the field going back to the 1740s and of the interplanetary field back to 1843 and the flat baseline is an observational fact as has been known since the 1870s. So, we do know. Of course, you can choose willful ignorance against which no arguments can be made.
Leif, I see that Hoyt and Schatten now are in different camps, while they years ago had written a reconstruction of solar activity together. What happened there?
Ken Schatten now agrees that they erred back in 1998 and that the old H&S group number is incorrect. This, of course, does not prevent true believers to use the wrong reconstruction if it agrees with their firmly held views. ‘Bad science lives forever’ [or until its minions are dead and buried].
Thanks, I was just curious…
Let the data speak for themselves. But that seems quite difficult for a lot of people…
We actually know precisely where Hoyt and Schatten went wrong. They did not realise that Wolf used two telescopes, a large one before ca. 1860 and a small portable one after 1860. The larger telescope was used by Wolf’s assistants, e.g. Wolfer who would see 65% more groups that what Wolf could see with the smaller telescope. Hence, the factor to normalize Wolfer to Wolf’s scale was to divide the count by 1.65 [or equivalently multiply by 1/1.65 = 0.6]. H&S missed that detail and used a factor of almost 1.0 instead, thereby introducing a jump of 1.00-0.60]=40% by which the earlier data were thus too small. As simple as that.
When it comes to UV radiation, differences between solar cycles can be as high as several tens of percent.
But the important baseline is constant. We know this all the way back to 1740 AD.
As always, Leif, I much appreciate your curiosity and willingness to share it in contentious discourse. You have analyzed repeatedly and honestly many claims for a mechanism by which the sun affects the climate by a means other than basic TSI.
You have elegantly maintained your belief that the sun has not had a more active role in warming since the LIA.
I remember the three mammoth solar threads @ur momisugly StevieMac’s, and you were discussing this point in depth even way back then. I am certain that your marvelous curiosity and insatiable need to teach have very much advanced the discussion.
We are closer to the answer and many thanks to you.
======
Doesn’t the decrease in UV radiation show a decrease in sunspot magnetic activity?
https://www.iup.uni-bremen.de/gome/gomemgii.html
Of course, if UV dropped even more during minimum periods, that would be a real disaster for the climate.
Already this year, winter in North America begins in November.
Is Europe ready to be hit by Arctic air? Very high pressure over Iceland.
Deep learning (or “ML” or “AI”) is definitely set to make a big impact on climate science. Some will be deeply nervous about this.
However beware of pseudo-DL which will deliver results exactly from the alarmist hymn sheet.
Good to see Dr. Soon’s presentation get even more publicity. I was there and the whole thing is simply brilliant.
I have my doubts that “To my eye” is valid scientific technique for determining the similarity or differences between data sets and their presentation.
Then look at
Figure posted up the page.
“I have my doubts that “To my eye” is valid scientific technique”
Then learn that the expression is code for careful scientific and quantitative analysis.
Leif ==> If you had meant to supply substantial proof of “careful scientific and quantitative analysis” it might have been better to do so . . . . instead of speaking in code. Maybe a bit more detail and a little less dismissive, petulant language would have been appropriate.
I agree with you that there is no significate difference between yours and Soon’s analysis. Your error analysis is the best evidence of that. I have done a trial and error “human” learning process on your most accurate averages (from 1865 to 2015) maximizing R^2 in a multi-linear regression. I find the ln of the average group numbers best fits two cycles; each with one harmonic, The most significant cycle is 10.75 years with a weaker harmonic at 5.375 years. The second cycle is weaker but still significant at 124 years with a harmonic at 62 years. So the machine learning finds of around 120 and 60 years are very likely real.
Using the resulting coefficients in the best fit equation, I calculated the group numbers back to 1620. The results are well within your calculated error bars. You should be able to calculate expected future group numbers within error bars.
And the 5.375-year cycle is simply an artifact stemming from the asymmetrical shape of the 10.75-year cycle, so is not an additional physical cycle. Here is on the right a series of artificial 11-year cycle; each cycle rises [like real cycles] a bit faster than it decays, with a maximum at 4 years. On the left is the FFT power spectrum of the series; note the peak at 5.5 years, exactly half of 11 years.
So, their ML-reconstruction, or rather the use of it is a predictor is bogus and just shows that its authors don’t know what they are doing. On the other hand, the 120-year modulating ‘wave’ might be real, but we don’t know if it will be repeatable or just be happenstance.
Trying again with jpg file instead of png file:
…
You are right in saying that the harmonic is not a different cycle. However, it is giving us a picture of the shape of the primary cycle(as you have stated) if it is repeatable. Statistical significance is a measure of repeatability.
You can fit any shape curve or repeating curves with enough terms in a Fourier series. However, if the terms are not statistically significant, the results have no validity with respect to prediction or hindcasting.
In my analysis of your best data I assume the primary cycles have a sign or cosign shape with a log-normal distribution with respect to time. I convert time in years to radians, then radians into their location on sign and cosign functions. Sign and cosign functions are orthogonal. So the multi-linear regression I did was on both sign and cosign for the primary cycle , then 2*sign and 2*cosign for the harmonic. I used the f statistic as the probability indicator for each resulting coefficient.
If I have made a mistake in my analysis, please show me where.
I forgot to include the important part of the trial and error analysis. that is I divide radians by the expected cycle length in years before calculating the sign and cosign. These values are changed to maximize R^2. If you wish to discuss this with out making a comment here, go to my word press site and make a comment. http://www.retiredresearcher.wordpress.com
Mr Svalgaard
Re.: your problems with uploading pictures and graphs
When looking at the address of this graph
I see that the name of the uploaded file
5.5-year-artificial-peak-1637790013.1105-300×160.jpg
contains a dot.
This is very probably the problem you have: either the software producing the graph or the upload software thinks that the file’s type is
“year-artificial-peak-1637790013.1105-300×160”
and hence does not add the real file type (‘jpg’, ‘png’ etc) or discards it.
The uploader at
https://postimages.org/
detects incomplete file names and doesn’t upload them.
Best however is to avoid file names containing dots…
Thanks for the advice. However, the upload was a success eventually. Sometimes it is the size that matters, sometimes it takes jpgs but not pngs, sometimes it is the other way around. I have have not yet figured out what the REAL criteria is.
Ron Long November 23, 2021 2:36 am
It certainly has NOT been demonstrated to my satisfaction.
Part 1
Part 2
Part 3
The globe cooled for about 700 years to the Little Ice Age … not seeing the Maunder Minimum in that.
And then we have this …
Just saying, the jury is not only out on the sunspot-climate connection. It’s a long ways out.
w.
Current temperatures.
I can only agree with your position.
Some years ago, I wanted to compare SSN, HadCRUT and the (undetrended) AMO, by uniformly scaling all the very different data to percentiles:
Of course: some would argue that like correlation does not imply causation, the lack of the former conversely does not imply the lack of the latter 🙂
I moreover have seen on this blog that TSI correlates with HadSST, but I don’t recall how good TSI in turn matches SSN and the solar flux at 10.7 cm.
That the latter two perfectly do since F10.7’s ‘beginning’ in 1948 was easy to see:
We seem to conveniently ignore the notion that today’s temperature reflects the cumulative sum of energy imbalances from the past.
Periods of net positive vs net negative. A function of time and magnitude, of course.
Just what is a ‘warm’ sun vs a ‘cold’ sun? Can sunspot number gives us an empirical threshold?
Why not?
Will it explain everything? of course not.
Add in some ocean exhales vs inhales, say from AMO or PDO (whatever your flavor), to explain the wiggles. A solar baseline is not so far fetched.