Viscount Monckton of Brenchley
The New Pause has lengthened by a further month, from 6 years 8 months to 6 years 9 months. As usual, it is calculated as the longest period, up to the most recent month for which data are available, during which the trend on the UAH global mean lower-troposphere temperature dataset is zero.

If anyone has seen a mention of this emerging and now quite long Pause in any mainstream news medium, let me know in comments. Here in the UK, the unspeakable BBC has kept the fact secret from its rapidly-dwindling audiences, preferring instead to broadcast a hysterical piece saying that the frequency of local temperature measurements worldwide exceeding 50 C° has risen in recent decades. Of course, the leftist numbskulls at the BBC took no steps to verify the extent to which the measurements had become more frequent because in hot countries more temperature stations are in operation, and still fewer steps to deWattsify the temperature record by excluding stations inappropriately sited or inadequately shaded. Besides, in a generally warming world one would expect new high-temperature records.
HadCRUT4 has at last updated its surface-temperature record to August 2021, showing no global warming for 7 years 6 months. For almost all the period between IPCC’s 2013 and 2021 Assessment Reports, there has been no global warming at all.

My noble friend Simon Clanmorris has kindly sent me a revealing analysis of the discrepancies between the HadCRUT3, -4 and -5 datasets. It shows that almost 20% of the warming imagined in the HadCRUT5 dataset arises from ex-post-facto adjustments (whether justified or not) to the previously-estimated temperature record.

Why does these long Pauses matter? It is not just that they cause entertaining conniptions among the ungodly (just watch the pompous, pietistic whining by the lavishly-paid trolls who seek to disrupt these threads day after day, convincing none but themselves).
What a long Pause shows – and the New Pause is now a long Pause – is not that there has not been warming in the past, nor that there will be no warming in future, but that for whatever reasons the Earth is at present likely to be in approximate radiative balance with its surroundings, notwithstanding an undiminished and continuing linear uptrend in anthropogenic radiative forcing.
IPCC (2021) imagines that there is an Earth energy imbalance of 0.8 Watts per square meter. But the long Pause indicates that the imbalance (which is extremely difficult to measure directly, and is subject to very wide error margins) is not significantly different from zero.
In short, our activities may be exerting a far smaller influence on the weather than the profiteers of doom would wish us to imagine. Cue trolls.
But why then does CO2 continue to rise if temperature is not?
I know, time lag, oceans etc but it is getting trick, particularly as there has never been atmospheric CO2 as high as this since the Pliocene?
Yeah, when the ocean temp rise pauses for a decade or two I’ll take notice.
Your stupidity is wondrous to behold.
One of the two possible infinite things. And Albert wasn’t sure about the universe.
What? Look at Monckers’ graph above, the pause ended at the start of 2021 when temperatures started lurching higher again.
That assertion may have originated here:
The Oceans Are Heating Up Faster Than Expected
https://www.scientificamerican.com/article/the-oceans-are-heating-up-faster-than-expected/
What I find amazing is that Scientific American made no effort to edit the article as being retracted (thanks to the work of a CAGW denier) or take it down as misinformation. And this is the same for other MSM publishers.
Journal ‘Nature’ retracts ocean-warming study
https://phys.org/news/2019-09-journal-nature-retracts-ocean-warming.html
However, notice the effort to get a retraction of the Richet paper, posted here a few days ago.
——–
Ocean temperature data shows warming is accelerating faster than we thought
“There’s been four different estimates of ocean-heat content published since the 2013 IPCC report,” he said.
“They all show more warming than previous projections.”
Most significantly though, the adjusted historic temperature records used in these four studies now track in sync with climate models, according to Dr Rintoul.
“In the past when [the models and records] didn’t agree so well, part of that was a problem with the observations, not the models,” he said.
https://www.abc.net.au/news/science/2019-01-11/ocean-warming-accelerating-faster-than-thought-science/10693080
In the branch of science I work in, you would report the previous data as contrary to the models, then justify why it should be neglected and move on with better data collection methods. But going back and adjusting previous data that doesn’t support the model, to support the model, and then having the temerity to present that as proof of the correctness of the model??? …it would never fly.
And the latest this week from the Guardian is that the cooling scare of the 1970s was the unrecognized fingerprint of CAGW. (sigh)
Once again, the phrase “They all show more warming than previous projections.” admits that the models used are not fit for purpose.
If they were, no such statements would ever be made.
It is amazing isn’t it? Yet it is all so casual.
U.S. Data Since 1895 Fail To Show Warming Trend
https://www.nytimes.com/1989/01/26/us/us-data-since-1895-fail-to-show-warming-trend.html
I wonder what started the whole thing? When I see a trend, I say to myself, “I think I can build a model that explains that trend.” It is the data that “tips you off” to an underlying process. So, what data tipped them off? It is almost like they said, “We can build a model to contradict that trend.” (of course you can).
And then spend the next two decades adjusting the data to conform to the model, yet here we are. Followed by: the models are running too hot, more snow will be on the way, and the Arctic won’t be ice free by 2014, etc, etc, etc.
Any modeler, in his right, mind would have created a model based on the extant data. Otherwise, you can model anything, if it does not need to conform to the data.
A simple dictionary definition of ‘science’: “the intellectual and practical activity encompassing the systematic study of the structure and behaviour of the physical and natural world through observation and experiment” (Oxford).
The ‘scientific method’: “a method of procedure that has characterized natural science since the 17th century, consisting in systematic observation, measurement, and experiment, and the formulation, testing, and modification of hypotheses“ (Oxford).
It follows that the process of ‘ex-post-facto adjustments’ to observations to fit models rather than the reverse is not science and those that do it are not scientists.
That is so last century.
The definition should be adjusted to recognise the ascendancy of models over reality.
I hope you understood that as I was speaking with my tongue firmly in my cheek.
If plant food in the air be the control knob on climate, why should oceans have to cool for decades to falsify that hypothesis, already repeatedly shown false?
Mmm, nothing falsifies it like ocean temps spiking.
SSTs aren’t spiking.
https://www.nature.com/articles/s41598-020-64785-9
Global average SST as observed by satellites shows 0.09 degree C per decade warming, 1981 to 2018. That interval includes three Super Los Niños. Average SST has cooled since El Niño of 2019-20, and with another La Niña in the offing, that trend is liable to continue into next year.
Argo float data are similar, but they can’t operate under ice.
“Average SST has cooled since El Niño of 2019-20”
No, its way above the long term trend and shows zero sign changing course.
Japan Meteorological Agency
Atmospheric warming accounts for about 5% of the the total global warming. Monckton’s pause bunkum is the noisiness of that noisy 5%. Meantime the giant elephant in the room grows rapidly warmer. But do tell me more about the cooling.
Coming out of the HORRIBLE Little Ice Age, the Earth Temperatures are still “returning to normal” (according to all previous Interglacial Trends)…which at this stage on the Holocene is 1.5° to 2°C ABOVE the current temperatures.
An honest Scientist would have EXPECTED more warming after 1950 (when Anthropogenic CO2 levels started to rise). There was ALREADY an upward Temperature Trend underway. We don’t know why the LIA happened for certain (though both Solar and Volcanic causes are likely)…and we don’t know why it stopped (though Solar and Volcanic changes are nearly certain). But you can’t Statisticslly and Scientifically assert that an *ongoing trend* in Temperature increases that had unknown causes…suddenly stopped…and the SAME trend resumed but with a NEW CAUSE (Atmospheric CO2). The odds against that are astronomical…and no effort at all has gone into explaining that nearly impossible “swithceroo”.
But…an Un-Scientific Theory with only 2 Falsifiable claims…the Tropical Hot Spot…and…Predicted Global Average Temp Trends…BOTH of which have been proven WRONG…has not been pitched into depths of obscurity BECAUSE the Globalist Elites (who don’t pursuade…only lie about everything) have the illegitimate Power to perpetuate the lies…FOR THEIR OWN POWER.
AND trust me Loydo and Griff…those guys don’t give a crap about you. You are supporting your own future Slave Owners…you will be their slaves like the rest of us. You won’t like it after you finally wake up to the horrible truth.
And here we have a tour-de-force of the “D” word.
“Temperatures are still “returning to normal” (according to all previous Interglacial Trends)…which at this stage on the Holocene is 1.5° to 2°C ABOVE the current temperatures.”
If you mean the usual “the Holocene was warmer X years ago”
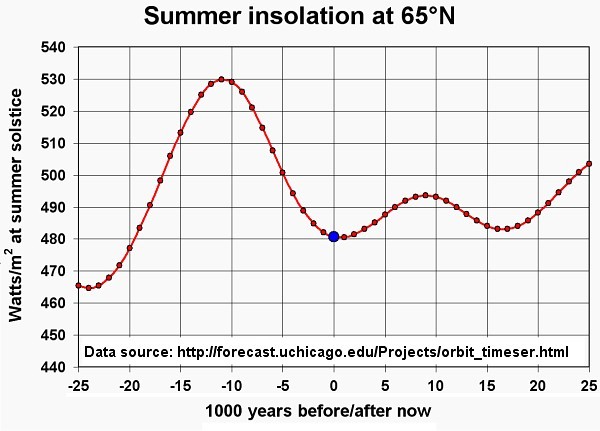
Then this was the reason why ……
Much more solar insolation at high latitudes in summer was why.
Also that graph shows that orbital characteristics still do not favour warming in the NH summer.
“But you can’t Statisticslly and Scientifically assert that an *ongoing trend* in Temperature increases that had unknown causes…suddenly stopped…and the SAME trend resumed but with a NEW CAUSE (Atmospheric CO2)”
“There was ALREADY an upward Temperature Trend underway”.
Indeed there was … because of anthro changes particularly and the beginnings of useful CO2 radiative forcing adding to ~ + 0.6 W/m^2 by 1950
Now it’s ~ 3 W/m^2 …. 5x greater
It’s ALL anthrogrogenic (since ~1850) whether CO2 or aerosol (+ve and -ve) – as some aerosols reflect solar SW and some absorb (so that’s >100% due to some anthro induced cooling). Hence why there was the slow-down/dip in GMST as the atmosphere got dirtier when industry ramped up after WW2 and before clean-air acts came in.
“The odds against that are astronomical…and no effort at all has gone into explaining that nearly impossible”
In the opposite sense …. it’s nearly impossible that it’s not anthro – just a staggering coincidence?
“the Tropical Hot Spot” …. been proven WRONG”
Ah, that myth again ….
It’s very difficult to spot the “hot-spot”.
Seems you are admitting some warming?
You do realise that a tropical hot-spot would form REGARDLESS of what caused the warming?
It is the due to the transport of sensible/LH to the upper Trop via tropical convection.
Chiefly from warmer SST’s.
Radiosondes were/are not designed to be research tools – they are to gauge the current state of the atmosphere to feed into NWP models and going back decades they were even more crude.
And there is a paper that shows evidence of the THS ….
https://iopscience.iop.org/article/10.1088/1748-9326/10/5/054007
“Temperature trends in the updated data show three noteworthy features. First, tropical warming is equally strong over both the 1959–2012 and 1979–2012 periods, increasing smoothly and almost moist-adiabatically from the surface (where it is roughly 0.14 K/decade) to 300 hPa (where it is about 0.25 K/decade over both periods), a pattern very close to that in climate model predictions. This contradicts suggestions that atmospheric warming has slowed in recent decades or that it has not kept up with that at the surface. ”
“Predicted Global Average Temp Trends” ….”been proven WRONG”
Nope ….
Then we have ( the with one bound he was free ) assertion
” …perpetuate the lies…FOR THEIR OWN POWER.”
My goodness – if you say so !
Oh, and how are them there paedoes doing now that Trump isn’t after them – or maybe he’s been to buy a pizza there since, err losing the POTUS.
“You won’t like it after you finally wake up to the horrible truth.”
LOL – how ironic.
Indeed.
Indeed.
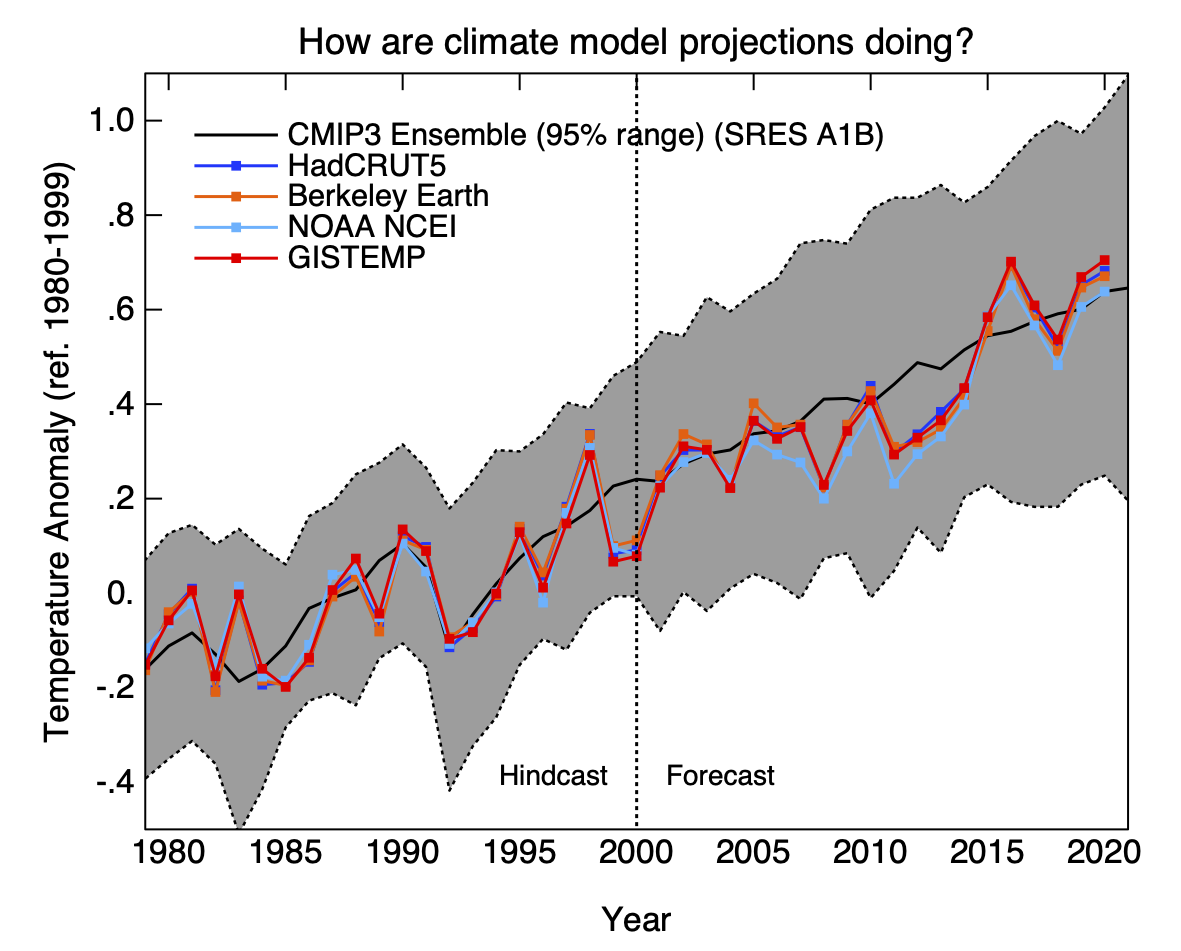
Climate models versus observations 1.
That chart comes from Dr. Spencer. Unfortunately he made two egregious mistakes here.
1) Of the 68 members 50 were selected from the outlier model CanESM5.
2) The black line is SST (tos field) while the model members are air temperature (tas field).
The actual comparison is as follows.
1880-2020 obs = +0.07 C/decade
1880-2020 model = +0.07 C/decade
1970-2020 obs = +0.19 C/decade
1970-2020 model = +0.22 C/decade
https://www.carbonbrief.org/cmip6-the-next-generation-of-climate-models-explained
I was amused that the modelled and observed temperatures you give for 1880-2020 are exactly the same. This would be a wonderful example of the ability of the models if they had been constructed in 1880. Unfortunately, the models were built long after this and were deliberately hindcast to match the observed temperatures. Every update of every climate model I have looked at is adjusted to hindcast every change in the observed temperature record. So all climate models look wonderful as they always match the temperature record very closely. Even more telling is that when historic temperature records have been adjusted, I have noticed that climate models have been adjusted to match the adjustments.
Are you always this gullible in believing everything you read?
No. I don’t believe everything I read. That’s why I had already downloaded the CMIP model data from the KNMI Climate Explorer. I did this by selecting the multi-model multi-member ensemble mean for the ‘tas’ field. I then plotted it against the GISTEMP data. Note that although I provided the official GISTEMP data link here I actually downloaded the source code for it, verified there was no malicious code in it “doctoring” the data, and then ran it on my own machine to generate this data. If want instructions on how to that yourself let me know. I’ll be happy to assist.
Anyway, notice how the model prediction is not exactly the same as observations. Despite that it does adequately represent the other trend. If you know of a model that performs better than the CMIP suite please let me know and I’ll add it to this graph. The only requirement is that data must be supplied on monthly intervals from 1880 to 2020.
Now let me ask you the same thing. Did you not research those graphs you posted? Did you not seek independent review? Do you believe everything read without questioning it?
You are even more gullible than I imagined. I have been writing computer models for 48 years and I am aware of every trick in the book to make them look good. I have looked at the source code of some of the climate models and they adjust different parameters to achieve the best possible match to the temperature record. They don’t need to ‘doctor’ the code. They merely adjust the tuning of the parameters. The problem is that different models now have different values for many parameters which depart significantly from real world data and published science. I now regard the entire climate modelling industry as fraudulent.
Let me see if I have this right. I’m gullible because…
1) Dr. Spencer compared the ‘tos’ field to the ‘tas’ field.
2) Dr. Spencer selected 50 of the 68 models from the same outlier CanESM5 model.
3) Dr. Christy created two charts that have never been peer reviewed and that are inconsistent with RATPAC.
4) You have been writing computer models for 48 years.
5) I showed you the real output directly from KNMI and GISTEMP and provided links so that you can replicate my work.
That’s what makes me gullible?
And more to the point are you trying to argue that because some models have tunable parameters that necessarily means that Dr. Spencer and Dr. Christy’s graphs are somehow correct?
Your reply shows that you really have trouble understanding things. You are gullible because you have fallen for the propaganda that climate models have some predictive value. You have demonstrated that you don’t understand computer models. A computer model of anything can only have value if there exists understanding of what it is trying to model. There isn’t even agreement on the very existence of the parameters required to model the climate.
Some people who don’t understand the problem have actually claimed that faster computers will make climate models better. They won’t.
Climate modelling has turned into a lucrative business for some unscrupulous individuals and organisations. But snake oil salesmen always seem to find gullible people who believe their drivel, like you.
I have trouble understanding a lot of things not the least of which is climate related research because it is very complex. Global circulation models are no exception. They are very complex as well. I don’t for a minute think I fully understand them. I’m certainly no expert either. GCMs are a fascinating topic though and the details on how they work and how they might become better is definitely worthy of discussion.
But none of that has anything to with whether the graphs you posted are correct. I’m saying they are very misleading at best and fundamentally incorrect at worst. I gave you reasons why. You have the opportunity to rebut those reasons by providing justification for 1) comparing the ‘tas’ field to the ‘tos’ field 2) cherry picking 50 out of the 68 model members from a single outlier model (CanESM5) 3) providing insights into how those graphs were created including explaining why the timeseries labeled as being balloon data are inconsistent with RATPAC which is bona-fide balloon dataset specifically designed for climatic research. Lecturing me on my competence level and how you think models work does not address the specific issues I’m raising here.
I understand your desperation to change the subject from climate models. You have been defending climate models from the start and I have been attacking them. If you have a problem with any of the graphs I have posted, take it up with the creators.
However, this discussion is about climate models.
I’ll talk climate models with you all day long. In fact, I’d rather discuss their inner workings, their successes and failures, overall skill, etc. than discussing misleading (at best) charts from Dr. Spencer and Dr. Christy. But the issue in focus at the moment are those graphs.
I did specifically address the issues with Dr. Spencer’s graph as did several people. And although I have not discussed the issue with Dr. Christy others have. And these are the kinds of issues that would easily have been identified in the peer review process.
The question is, which model has been the most accurate over the last 20 – 30 years. PLEASE TELL US YOUR CHOICE AND HOW ACCURATE IT HAS BEEN.
No waffling by saying the average of model outputs give the correct prediction/projections. No one with ANY math training will believe that can happen except thru random good luck like a group of monkeys typing the Illiad.
I don’t have the data readily available for the 20-30 yr period. But for the last 50 years CMIP5 was +0.21 C/decade while CMIP6 was +0.22 C/decade. The observation was +0.19 C/decade.
https://www.carbonbrief.org/cmip6-the-next-generation-of-climate-models-explained
That’s hindcasting, not forecasting.
That is correct. When the execution time of the model is after the projected time it said to be a hindcast. When it is before the projected time it said to be a forecast. Model inputs for hindcasts are as they occurred. Model inputs for forecasts are based on predefined scenarios or RCPs. What this means is that if you want to assess the accuracy of a model you do so with the hindcast output only.
My horse racing model will now make a hindcast for the winner of the Arc de Triomphe for 2021. It is Torqautor Tasso. If this turns out to be correct, this means that my horse racing model is wonderfully accurate and will forecast all future winners of the Arc de Triomphe.
That would be impressive since Torqautor Tasso had an implied probability of a win of only 1.2%. One question…would the model have produced the same output had it ran the day before the race as well?
Of course it wouldn’t. Of course, the models you have named would have got nowhere near the right answer if they had been written 50 years ago with the programmers having no knowledge of what was going to subsequently happen. I’m pretty sure that even I could write a program which accurately forecast the past.
Ah…so either your model does not produce the same output given the same input or one of the inputs was based on information regarding the winner? That would be a problem indeed and would render your model useless for the purpose of predicting horse race winners. The difference with global circulation models is that they produce the same output given the same input every time they run. They don’t know if the inputs they are working with are from the past or from the future. The model doesn’t know if it is hindcasting or forecasting. For example, if CMIP6 were ran in 2021 and produced a 30 year forecast it would look exactly the same as if the model were ran in 2051 and produced a 30 year hindcast as long as the model was given the same inputs both times. It is also important to note that climate models are not provided the temperature as an input to the model. It is an output.
So you are claiming that knowing what the past temperature actually was had no effect whatsoever on the programmers who were understandably keen to get the model output as close to the actual past temperature record as possible? Are you joking?
No I’m not. I’m only saying that temperature is not an input for climate models. Please don’t hear what I didn’t say. I didn’t say that scientists create these models in a vacuum without any understanding of the temperature and what it was doing. What they don’t do is feed the model observed temperatures as an input. That would render the model useless in making forecasts of the temperature afterall.
Of course they are an input, indirectly. They “tune” the array of parameters to get the output to “match” the past.
By that definition then the entire source code including numerical core, physics modules, and general model logic is an input. All of that stuff is “tuned” to get the model to match reality as well. The things I was referring to are variables that the model cannot predict like volcanic activity, anthropogenic land use changes, CFC emissions, CH4 emission, CO2 emissions, etc.
Funny how all but one of the things you mention are things that are GHG’s. How about water vapor and clouds, albedo changes due to greening,. Or how about ENSO, AMO, PDO, are those programmed with the proper changes? Things that can reduce temperature? If so, why no pauses or cooling ever? If they are are why no natural variation in projections?
“What they don’t do is feed the model observed temperatures as an input. That would render the model useless in making forecasts of the temperature after all”.
For all practical purposes, that is exactly what they are doing.
Let me make sure I understand your claim…you are claiming that the models in the CMIP suite all accept the global mean temperature as an input and that when they predict the global mean temperature they are doing so from the temperature input and not the laws of physics? Am I understanding your claim correctly?
No.
You haven’t answered the question at all. How close to the actual measured temps have any of the individual model projections over the last 30 years. In case you don’t understand, which model made the most accurate projection 30 years ago? 40 years ago? Heck, even 20 years ago?
I agree with you, Jim. The accuracy of a model can only be measured by comparing its forecasts with what subsequently happened.
That’s not isolating the accuracy of the model though. Remember a model’s output is based on both its algorithms/heuristics and its inputs. For the forecast phase the inputs are scenario based only. One example of an input would be anthropogenic CFCs emissions.
The accuracy of a model can not be gauged by hindcasts, only by forecasts. Hindcasts, with their parameter adjustments allow hindcasts to be manipulated. By judging what forecast a model made 20, 30, 40 years ago to actual temps that have actually occurred provides an assessment of the model, the ability of the managers to access existing data to set current parameters, and the physics of the program. Any failures of any of these make the model unreliable.
Would you fly in an airplane designed by models that that could only predict what happened in the past?
“The accuracy of a model can not be gauged by hindcasts, only by forecasts.”
Patently False. Here is a counter example to prove the point. To asses the skill of the classical model we can take past observations of Mercury’s orbit and compare them to the projections provided by that model. We can then repeat the comparison with the relativistic model. It turns out from evaluations using hindcasting that the relativistic model is superior to the classical model since it accurately simulates the precession. Note something important here. Neither model has any distinction between past and future. They work the same way regardless of whether the modeled scenario based on past events or possible future events.
“Hindcasts, with their parameter adjustments allow hindcasts to be manipulated.”
Why would anyone do that? If you’ve changed the parameters of the model then it’s not the same model anymore.
“By judging what forecast a model made 20, 30, 40 years ago to actual temps that have actually occurred provides an assessment of the model”
That is not isolating the skill of the model though because the output is product of both the model AND the inputs. If you see a deviation between output and observation how would determine whether the deviation was the result of the model or the inputs?
Would you fly in an airplane designed by models that that could only predict what happened in the past?
No. The reason is mainly because this implies that the hypothetical model is making a distinction between past and future. Not only do I question why the model would use different laws of physics for past and future, but I would also question why it couldn’t make computations to begin with. Any model used to developed aircraft should use the same laws of physics and work equally well for any set of inputs regards of whether those inputs are based on past scenarios or future scenarios.
Um, parameter adjustment is part of the model operation.
What do you think is adjusted and when do you think the adjustment happens?
These computer models are full of many empirical parameters, the values of which cannot be calculated. A tweak-run-tweak-run-…. process is used to get “close” to the temperature values they want to emulate.
Yet after all these cycles, the outputs are basically just linear functions of the CO2 concentration, as Pat Frank has demonstrated.
That I absolutely agree with. They tweak parameters/rules/heuristics between runs as a part of the development cycle. What I disagree with is that they change model during its execution or operation. They don’t tweak parameters/rules/heuristics in the middle of a run or use one configuration for hindcasts and another for forecasts.
That is not what Carlo, Monte said.
I’m responding to the insinuation that models use one set of rules/heuristic/parameters/logic/etc for a hindcast and then another for a forecast or that they change during “operation”. If that isn’t the insinuation and everyone agrees that this only happens during the development phase then I’m all good. Again…my point is that given the same inputs the model will produce the same output regardless of whether those inputs are for scenarios that have already occurred (hindcast) or scenarios that could hypothetically occur (forecast). And the only way you can isolate model skill in this case is by hindcast only because we don’t know how humans will behave in the future thus we don’t know all of the inputs to use.
You are giving way two things. One, that the models are programmed primarily to resspond to CO2 as the control knob, i.e., ever increasing. Two, that the models have no ability to take a single set of initial conditions and project what will happen. Why do I say that, the output curves never show any natural variation. No cooling periods, no pauses, just continued temperature growth! Up, Up, and Away!
Ass I asked, go back to projections made 40, 30, 20 years ago and see which one most accurately has projected current temps. hich one showed any natural variation?
Let me add, you say that
“I’m responding to the insinuation that models use one set of rules/heuristic/parameters/logic/etc for a hindcast and then another for a forecast or that they change during “operation”.
if they are using an RCP type scenario then during operation either manual insertion of growth in CO2 is entered or it is programmed in the software. Either way changes are made during operation.
“And the only way you can isolate model skill in this case is by hindcast”. Ridiculous statement. Only confirmed forecasts can do that. Every single climate model has a hindcast which matches the observational record. Any model whose hindcast didn’t match the temperature record would never see the light of day.
Oh…so we can’t test Newton’s law of gravitation by hindcasting the orbital motion of Mercury and comparing it to past observations? We can’t test the standard model by hindcasting the motions of particles and comparing them to past observations in the Large Hadron Collider? We can’t test the wave-particle duality model by hindcasting the interference pattern of electrons and comparing it to double-slit experiment observations? Are you sure it isn’t your statement that only forecast can accomplish this that is the ridiculous statement?
And duh…that’s the point of a hindcast. If it can’t hindcast reality reasonably well then we aren’t going to be confident that it can forecast either. Science is all about discarding models that are inferior at hindcasting and forecasting. So yes, any model that didn’t match the historical temperature record reasonably well is not going to see the light of day. That is the point. That is exactly what we want.
“And duh…that’s the point of a hindcast. If it can’t hindcast reality reasonably well then we aren’t going to be confident that it can forecast either”. A model which forecasts the past proves absolutely nothing and shows zero skill. Why can’t you understand that?
Every single published climate model has a hindcast which matches the past. But they all work in different ways with different parameter settings. So you are arguing that all these different values for these parameters are simultaneously correct. Do you realise how absurd your position is?
Stop comparing climate models with models for other things with well understood processes like orbital mechanics. There is absolutely no comparsion at all.
That’s a good question. That will take some considerable effort to determine. I’ll see if I can work that request into my queue. I just downloaded all of the data, but I’ll have to write a computer program to analyze it. Follow up with me in a couple weeks. Hopefully I’ll have it done by then.
It was easier than I thought. This is for 1880 to 2020. Of the individual members within the CMIP5 ensembles it was GISS-E2-R-CC that performed the best with an RMSE of 0.193C. The ensemble mean itself came in at 0.165C. In terms of the trend it was IPSL-CM5B-LR that performed the best at +0.0887 C/decade. The ensemble mean itself came in at +0.0790 C/decade. Note the BEST trend was +0.0870 C/decade.
Here is the period from 1979-present with CMIP5 plot against 4 traditional, 2 satellite, 1 raob, and 1 reanalysis dataset including a composite of them. One of the biggest issues I see is the handling of El Chichon. Though it did handle Pinatubo pretty well. And of course there is no skill in predicting the effects of the ENSO cycle.
You are dithering. No one asked for hindcasts from a current model. What did the models project in 1990? Did they come close to what happened? How about the models runs in 2000, did they project temperature accurately? Which one was the most accurate at each past point in time?
We’ll have to see how the model projections from 2020 pan out.
I’ll refer you to Hausfather et al. 2020 for that question.
Quote from Tom Halla “So the IPCC is reducing the range of possible ECS, but making the low end about twice what it probably is? Even using GISS as a temperature record (which is inflated), Lewis and Curry had ECS at 1.2 or so”.
The IPCC range of 2.5 to 4.0C comes (allegedly) from climate models. This is pretty damning evidence that climate models are running far too hot compared to the observational record.
Climate models versus observations 2.
Climate models versus observations 3.
That chart comes from Dr. Christy. Unfortunately no one knows how it was constructed. It was never submitted for peer review.
Per RATPAC the warming from 1979-2020 in the mid troposphere tropical region was about 1.0C and when you appropriate align the timeseries (notice the subtle misalignment in the timeseries in the original) you’ll see that the green line should end around 1.2C. Sure, that is a bit below the red line, but nothing like what is shown in the there. There is a similar analysis with the chart you posted just above this as well. In that case the actual observed trend falls right on the black line in 2020.
You are, of course, encouraged to follow up and double check this for yourself.
Can we have the graph for that?
Ta muchly.
Absolutely. This is the RATPAC tropical (30S-30N) region at 300mb.
This faux assertion of the shortfalls in climate models has already been debunked.
https://twitter.com/nstokesvic/status/1387695497696092163
You say that 2+2=5. You know somebody else who says that 2+2=5. Therefore 2+2=5.
It is interesting you acknowledge that because weather stations with Stevenson Screens were not designed to be research tools either! Nor were dip buckets used on ships. Basically, all the data gathered to support the meme of global warming is from instrumentation not fit for the purpose of climate research. Yet, monthly averages containing 3-significant figures to the right of the decimal point are trotted out to convince the public that we are going to Hell in a 5-parts-per-10,000 handbag.
The criteria for the utility of data to be evaluated is not that it comes from sources “designed to be research tools”. Rather, it’s that we know it’s precision and accuracy. Yes, temp measurement is better now than 150 years ago. But for every source you mindlessly diss, we know both of these parameters quite well enough to use them for the referenced evaluations.
You should really ponder the value you add by belonging to this shrinking, but hardy, band of WUWT statistics 101 deniers. I.e., the folks who can’t get their heads around how we can use statistics and modern spatial interpolation to exploit even data with larger error bands to find the trends you hide your eyes from.
And knowing that the data sources aren’t fit for purpose, it is used anyway with the excuse that it is all that we have. Speaking of being “mindless,” that is not unlike someone saying that they know the gas mileage of their car and will use it to drive to Hawaii for their vacation.
The short time you have been commenting here, you have not impressed me with your mastery of statistics. Therefore, I am inclined to lump you with “statistics 101 deniers.”
I was agreeing with Banton and pointing out that it isn’t just radiosonde data that isn’t up to the drive to Hawaii.
“And knowing that the data sources aren’t fit for purpose, it is used anyway with the excuse that it is all that we have.”
Not based in fact. Your claim, your job to back it up. At least that’s how it works above ground.
“The short time you have been commenting here, you have not impressed me with your mastery of statistics. “
Between the 2 of us, I’m the only one that has done any actual statistical evaluations using actual data, here. You have yet to technically dispute any of it, arm waving about irrelevancies like “multiple sources” ad infinitum.
FYI, in my biz, dozens of petroleum rock and fluid properties are routinely used together to build reservoir engineering models. Each of these properties, permeability, capillary pressure, pore size distribution – on and on – are both mostly taken from multiple sources, and have distributed values. Sometimes these distributions are correlated, sometimes not. But we have no compunction about solving and resolving the diffusivity equation for them, for tens of thousands of cells, to output multiple production realizations, to be sent over for stochastic economic analysis. Even though the distributed input data is much, much, more “noisy” than the data we are discussing, but – somehow – reservoir simulation has disrupted and positively transformed upstream oil and gas operations…
Ha Ha Ha! You are not the only one that has used statistics in pursuit of business goals. In my case do you know how many shared use components in an old electromechanical telephone switching office needed to be measured, tracked and forecasted using statistics to meet performance goals like one call per 1000 being delayed or blocked? These were relentlessly scrutinized because of budget constraints and constant reports to the Public Utility Commissions. The PUC’s were always on the lookout for both under and over provisioning. Over provisioning was treated badly because you weren’t allowed to include it in the rate base to earn money on which hurt investors and the stock price.
You said,
You also said,
Then back up your implicit claim that that I have not done “any actual statistical evaluations using actual data.”
You are such a blow hard! Trying to impress us with your experience with non-statistical models.
Your old columns were not valid statistical evaluation by any stretch. Merely instatisticate, fact free, goal post moving, arm waving. Now, you just entertain us with lengthy tales from your youth and childhood.
Just one example. Your fact free assumption that the error bands of monthly global average temperature evaluations significantly change the standard errors of the resulting trends
Answer:
100 years of the very worst temp measurements increase the standard error the temp trend by all of 0.68%. I.e., back to school for you!
But feel free to play with this yourself, or even to aks me for other examples, since – well, you know – “Uh, it’s been awhile since I’ve done this”. Actually, I’ll predict that you will retreat back into your denial of basic stat laws by dissing the monthly standard deviation data provided by those instatisticate Berkeley Earth Dr. Evil AGW conspiracy theorists….
http://berkeleyearth.org/archive/summary-of-findings/
Good news and bad news for you. The good news. I was accidentally using the last 31 years worth of available data, bigoilbob regrets the error. The evaluation of the first 100 years worth of data does indeed change the standard error of the trend of the data by quite a bit, more than doubling it.
Now, the bad news. That doubling changes the standard deviation of that trend from ~0.047 degC/century to ~0.099 degC/century. I.e., from totally insignificant to slightly less totally insignificant. Sorry, not sorry…..
You don’t know what you are doing with statistics. The software tools, like in excel assume you know what you are doing.
Standard Error is a shortened version of the term Standard Error of the sample Mean (SEM). Do you know how it is calculated? Here is the formula:
SEM = σ/√N
σ = the Standard Deviation of the population.
Excel assumes the data you are supplying is the entire population. It then calculates what you could expect for the SEM if you did proper sampling.
The SEM tells you neither the accuracy of a mean nor the precision of a mean. It is the SD of a sample distribution and tells you interval within which the Sample Mean should lie.
Look at these two sites for an explanation.
https://byjus.com/maths/standard-error-of-the-mean/
https://www.biointeractive.org/classroom-resources/sampling-and-normal-distribution
Maybe you’ll learn something new!
Reading comp. I’m being kind. What is under discussion is not the standard error of a sample distribution. Rather, it’s the standard error of it’s OLS trend. Here’s the formula for that:
sb1 = sqrt [ S(yi – yi)2 / (n – 2) ] / sqrt [ S(xi – x)2 ]. The “x” is the average date, in this case.
Note the “S(yi – yi)2″ term. Familiar? I’m sure it is (still more sarc), but I’ll help. It’s the sum of the variances between the computed values and the actuals. So, if you have another source of variance – in this case the standard deviations of the individual monthlies – they can be simply included in the equation to gauge their impact.
Folks, I suspect that this is all bird chirping to Mr. Gorman, so bb.
But separately, I’m having a bad AM. The added standard error of of the standard deviations from ~1750 to 1850 did not double from considering them. It add ~41% to them – square roots and all. Bottom line, the change in the standard error of the very worst 100 years of temp data would be ~0.02degC/century from consideration of the individual monthly errors. Since we’re contrasting that to the ~1.5 – 2.0 degC/century of modern warming trend, BFD….
What you are are describing is the Residual Standard Error. It is important in science to be accurate with the language you are using. Standard Error is also a shortcut phrase for Standard Error of the Sample mean.
You get residuals when you fit a model a linear regression of y = mx + b to a set of data. There will always be errors that are not offset since a simple linear regression can not truly meet all the “data + errors” in the set of data.
The real question is why are you using linear regression to describe a set of data that is obviously not linear?
Even the IPCC recognizes that the earth’s climate is entirely non-linear.
No one has ever questioned my assertion that climate is periodic. Why? It is made up of all kinds of periodic phenomena. That makes it very susceptible to starting and ending points.
In addition the whole premise of GHG warming is that CO2 is the CONTROL KNOB for temperature. Non-linear functions when combined can create pauses naturally, but if CO2 is the single variable then pauses should be impossible.
You seem blocked by your confusion between the standard error of the bean and the standard error of the trend. FYI, Excel and Open Office both call it the standard error of the coefficient, and the coefficient in this case is the trend.
“The real question is why are you using linear regression to describe a set of data that is obviously not linear?”
Never said that it was “linear”. I was using it only as an example of the silliness of trying to diss trends, whether mostly linear over the evaluative period, such as modern temp data, or quadratic, such as modern sea level data, by claiming that the fact that the input data was distributed made a whit of difference. I intentionally used the worst data to make my point. The comparable example for 1980-2011 data (cyclically linear, even without accounting for seasonality) shows that the standard error of the trend increased by all of 0.0006 degC/century by considering the error bands of the individual data points. 10^BFD….
.
You have never bothered to research time series analysis have you? If you had, you would know you are not dealing with stationary data. The amplitudes variations of periodic waveforms made up from other complex functions can vary widely. Simple growth in variance can result in a trend. You can see growth, pauses, and decreases. You need to investigate the available statistical methods for making data stationary.
“In addition the whole premise of GHG warming is that CO2 is the CONTROL KNOB for temperature. Non-linear functions when combined can create pauses naturally, but if CO2 is the single variable then pauses should be impossible“
That most certainly is not the whole premise of GHG warming. CO2 is not the control knob, but a control knob. It is not the single variable, but only a variable. There are many variables that are in play and modulate the atmospheric temperature.
Then why are trillions being spent as if CO2 IS THE ONLY IMPORTANT VARIABLE?
Is there any assurance that all this spending will affect the other variables in the proper manner?
I have no idea. That is social/economic/political topic which I have little knowledge of and almost zero interest in.
Perhaps you should have an interest in it because the Net Zero campaigns are going to impact your life significantly as well as everyone else.
What kind of person refers to themselves in the third person?
A cheap shot, even for you. Arm waving in the extreme. You hypocritically ignore your own rules:
“Not based in fact. Your claim, your job to back it up. At least that’s how it works above ground.”
Neither Excel Help or Google provide a match for “Standard Error of Trend.” Perhaps you aren’t just having a bad AM, but a bad day, period. Could you come up with a term that other people commonly use? I’m not sure what the point is that you are trying to make with regard to the sample data set. Perhaps your bad day extends to confusing me with someone else, since you don’t specify what you are responding to.
I think that Jim has adequately responded to your claims.
Straight to you from excel (and Open Office) help. In this case for the function linest
Statistic
Description
se1,se2,…,sen
The standard error values for the coefficients m1,m2,…,
Substitute the word “trend” for “coefficient”, since thislinest function was used to calculate that trend. See what I did? Sorry you failed to see it before, even though I spoon fed it to you….
Total sidebar. I’ve read your posts for years, and strongly recommend that you exploit available resources. This has nada to do with our exchanges over AGW and your manifest instatistacy. I mean this in the nicest possible way…
https://buckeyehills.org/aging-disability
Why don’t you learn something from the folks on here.
From the World Meteorology Organization.
5.5 TIME SERIES ANALYSIS
The principles guiding model-fitting (see 5.3) also guide time series analysis. A model is fitted to the data series; the model might be linear, curvilinear, exponential, periodic or some other mathematical formulation. The best fit (the fit that minimizes the differences between the data series and the model) is generally accomplished by using least-squares techniques (minimizing the sum of squared departures of the data from the curve fit). Residuals from the best fit are examined for patterns and, if any are found, the model is adjusted to incorporate the patterns. Time series in climatology have been analysed with a variety of techniques that decompose a series either into time domain or into frequency domain components. A critical assumption of these models is that of stationarity (when characteristics of the series such as mean and variance do not change over the length of the series). This condition is generally not met by climatological data even if the data are homogeneous (see 5.2). Gabor and wavelet analyses are extensions of the classical techniques of spectral analysis. Allowing subintervals of a time series to be modelled with different scales or resolutions relaxes the condition of stationarity. These analyses are particularly good at representing time series with subintervals that have differing characteristics. Wavelet analysis gives good results when the time
series has spikes or sharp discontinuities. Compared to the classical techniques, it is particularly efficient for signals in which both the amplitude and frequency vary with time. One of the main advantages of these “local” analyses is the ability to present time series of climate processes in the coordinates of frequency and time, studying and visualizing the evolution of various modes of variability over a long period. They are used not only as a tool for identifying non-stationary scales of variations, but also as a data analysis tool to gain an initial understanding of a dataset. There have been many applications of these methods in climatology, such as in studies of the El Nino–Southern Oscillation (ENSO) phenomenon, the North Atlantic Oscillation, atmospheric turbulence, space–time precipitation relationships and ocean wave characteristics. These methods, however, do have some limitations. The most important limitation of wavelet analysis is that an infinite number of wavelet functions are available as a basis for an analysis, and results often differ depending on which wavelet is used. This makes interpretation of results somewhat difficult because different conclusions can be drawn from the same dataset if different mathematical functions are used. It is therefore important to relate the wavelet function to the physical world prior to selecting a specific wavelet. Gabor and wavelet analysis techniques are emerging fields and, although the mathematics has been defined, future refinements in techniques and application methodology may mitigate the limitations. Other common techniques for analysing time series are autoregression and moving average analyses. Autoregression is a linear regression of a value in a time series against one or more prior values in the series (autocorrelation). A moving average process expresses an observed series as a function of a random series. A combination of these two methods is called a mixed autoregressive and moving average (ARMA) model. An ARMA model that allows for nonstationarity is called a mixed autoregressive integrated moving average (ARIMA) model. These regression-based models can be made more complex than necessary, resulting in overfitting. Overfitting can lead to the modelling of a series of values with minimal differences between the model and the data values, but since the data values are only a sample representation of a physical process, a slight lack of fit may be desirable in order to represent the true process. Other problems include non-stationarity of the parameters used to define a model, non-random residuals (indicating an inappropriate model), and periodicity inherent in the data but not modelled. Split validation is effective in detecting model overfitting. Split validation refers to the practice of developing a model based on a portion of the available data and then validating the model on the remaining data that were not used in the model development. Once the time series data have been modelled by an acceptable curve, and the fit validated, the mathematical properties of the model curve can be used to make assessments that would not be possible using the original data. These include measuring trends, cyclical behaviour, or autocorrelation and persistence, together with estimates of the confidence of these measures.
I already know how to cut/paste. You do too, but you seem conveniently out of gas in actually discussing the relevance of your latest find.
But here’s the biggest take away:
“It is therefore important to relate the wavelet function to the physical world prior to selecting a specific wavelet.”
This is avoided like the plague here in WUWT. Rather, any patterns that fit your prejudgments are promoted. The latest is this very post, in which an statistically insignificant, quite common “pause” is touted, while statistically/physically significant time periods, with relevant evaluations are ignored.
But you apparently aren’t willig to admit that even the WMO makes the point of time seies analysis being appropriate.
Another irrelevant Homer Simpsonian post. BTW, you need another keyboa()d….
This is an important point that alarmists seem unwilling or unable to grasp!
“(when characteristics of the series such as mean and variance do not change over the length of the series)”
The statistical rules found and used for centuries do a fine job of accounting for changes in mean and variance over the length of any physically/statistically significant parts of “the series”. 2 examples are the BEST temp data and sea level station data. Both come with both expected value and error band input data. Both can be used as is for any trend evaluation, including quadratic sea level rise evaluation to find the post 1980 acceleration evident in ~80% of those sea level stations…
You are a cad! You have crossed the line with insults. Consider yourself persona non grata, and don’t expect any replies from me in the future, which may be what you wanted. However, I won’t waste time with someone like you.
Prove those temperature trends aren’t a product of natural warming.
We’ll wait…..
Are you going to run away from whatever it is you mean by “insolation” again, Baton?
What power does questioning the status quo give us?
We are pretty powerless in the face of “the great global warming enrichment” of the model-masters.
That’s a lot of waffle to try and explain away a hypothesis that has been wrong for 50 years.
SST’ algorithm reporting makes a graph like that possible. Example shows the algorithm in action. Goes up 3.3C in 2 days then down 2.4C in one day. While air temperature cools. This observation shows SST’s chaos.
You do realize your graph stops before 2020, right Loydo? If you’re using that to refute the comment, it’s a fail.
Your graph seems to show that there’s been a steady warming since 1900. I thought the warming was only supposed to start when we really started using fossil fuels at a noticeable amount (ie around about the 1950s). If all the warming for the first half of the 20th century was natural, why did nature decide to turn itself off in the 1950s and hand all the warming over to use humans?
It’s beyond ridiculous Loydo.
And don’t forget to mention that the warming in the first half of the 20th century reached the same level of warmth that we are experiencing today.
The same magnitude of warming from 1910 to 1940 as compared to the period 1979 to the present, and both periods warmed to the same high temperature.
In the case of the United States, it was actually warmer in the Early Twentieth Century than it is today, so North America has been in a temperature downtrend since the 1930’s.
If you see a graph that does not show the 1930’s to be on the same horizontal level as the present day, then you are looking at a distorted temperature record. Real, written, historical temperature records show it was just as warm in the Early Twentieth Century as it is today.
“…don’t forget to mention that the warming in the first half of the 20th century reached the same level of warmth that we are experiencing today.”
Nope, falsified here https://tamino.wordpress.com/2019/01/23/hot-and-cold-curry/
Take your blinkers off and have another look. The slope obviously increases in the mid 70s.
Increases in the 70s? But I thought our evil see-oh-toos were supposed to kick in during the 50s?
My word, you thermageddonists need to get your story straight.
The PDO switch of 1977 was totally natural, without any effect from CO2.
Earth cooled dramatically from the ’40s until 1977. Then another natural warm cycle occurred, as in the late teens to ’40s.
Even if it is warming that does not mean C02 did it, and besides, you used fossil fuels every day of your life, so kindly stow it.
“Even if it is warming that does not mean C02 did it”
That’s right. Mother Nature did all the warming, until proven otherwise, and nobody has proven otherwise. Nobody.
“nobody has proven otherwise. Nobody”
And therein lies the problem:
The activist scientists, the MSM, and the politicians all act as though CAGW is a theory as rock solid as gravity.
The public don’t realise that CAGW is merely a rather shonky hypothesis that has yet to be proven. In fact, the predictions made off the back of the hypothesis have been wrong for the past 50 years. Every time.
It’s a scam on a global scale and people such as Loydo have been silly enough to fall for it.
That’s exactly right.
Didn’t you know? Bellman’s computer is made out of bamboo, and he pedals a bicycle wheel to keep it powered up. It’s a sweaty job, but you’ve got to put in the effort if you want to stop climate change/chaos/breakdown/carnage/obliteration/etc.
0.56 c per century. In two centuries the oceans will be 1.1 C warmer than now. OMG we’re all gonna die. /sarc
Away from the ocean, warming is less evenly distributed with some regions warming faster than others. Unlucky for me, my region seems to be warming faster than average.
Which area is warming the fastest?
Well another bugger me, isn’t everywhere warmer more than the global average, according to you blokes anyway. Oh BoM say no more
BuMet, ie professional liars.
Am I reading this correctly? 61 to 19 is 58 years, right? Pretty much 60 years or 6 decades. And the world average is about 0.6. Hmmm, I calculate that as 0.1 degree per decade or 1 degree per century. Far below what is being forecast.
Beware forecasting the future when you don’t know the real math behind is what happening. Trending the future is fraught with uncertainty.
I’m from Australia…its not hotter anywhere I have lived in my life…so in 3 of 6 states, in fact, if anything it could be a bit cooler and wetter, which is strange because we are supposed to be living in a desert now according to predictions 20 years ago. The BOM has been busy making the past cooler though…so there is that…
Or perhaps the past is cooling ?
https://www.waclimate.net/very-hot-days-marble-bar.html
Wasn’t it also “WAY ABOVE THE LONG TERM TREND” in 1896 and 1943???
I think those years are highpoints in the natural climate cycle.
The decade of the 1880’s and of the 1930’s and of the present day all had similar high temperatures. They should all fit on the same horizontal line on a graph.
The decade of the 1880’s was a highpoint, then cooling took place until the 1910’s, and then warming took place from the 1910’s to the late 1930’s, and then cooling took place from 1940 to 1979, where the cool temperatues were just as cool as during the 1910’s, and climate scientists were starting to think the Earth was going into a new Ice Age in the middle 1970’s, and then things started warming up again until now, the present day, but the highpoint of today never got any higher than the highpoint of the 1880’s or the 1930’s, and now the temperatures are starting to cool, down about 0.5C from the 2016 highpoint, perhaps heading to another lowpoint equivalent to the 1970’s and the 1910’s.
If so, then we would have a cycle where we have three equal highs and three equal lows, so our climate is moving in a channel right now, not too hot and not too cold. Mother Nature is in control. Until proven otherwise.
Agreed, but there has been a slight secular warming trend from the Little Ice Age. The problem is that there has been a cooling trend for the last few millennia.
But even if it gets as warm as the Holocene Optimum, it is still within the range of natural variation. Extraordinary claims need extraordinary evidence. So far I see none.
Great description.
It has already changed course, thanks to La Nina. Look at the latest data points.
It climbed from 2015-16 and 2019-20 Los Ninos, but has headed back down since the La Nina, with another on the way. Has nothing to do with CO2.
Well bugger me, less than 0.5 C in 100 yrs coming out of the LIA. Remind me again, how was that measured
Why do you quote one thing and then show a chart that is on a completely different topic. It’s called deflection and it is what liars and dishonest people are found to do.
https://woodfortrees.org/plot/hadsst3gl/from:2020/to/plot/hadsst3gl/from:2020/to/trend
It appears John’s comment is exactly right.
SST’s reporting is controlled by algorithms as past global coverage was so poor prior satellite era. Anomalies for large areas are predominantly guessing.
(Deleted personal attack) SUNMOD
The oceans average a depth of some 5,000 metres and Argo data collection is confined to the top 2,000 metres. The bottom of the oceans is in contact with Earth’s mantle, whose spreading ridges contain an uncounted number of volcanic vents and fissure along a length of some 66,000 km.
The ocean below 2000 meters is cold, except at hydrothermal sites under high pressure.
Your lying is getting as bad as griff.
So you obviously believe infrared from ghgs can penetrate the ocean skin?
And yet another lie.
(He isn’t here was never here in this thread, do not make people be the topic) SUNMOD
(Deleted)
Serious question:
IF the heat is going into the oceans how can it ever be a problem?
Water is a great way of storing heat with minimal impact on temperature. None of the feedbacks that are hypothesised to make climate change a problem can possibly happen if the heat is going into the ocean.
IF you are right, isn’t AGW now solved?
The heat is not only “going into the oceans”.
The point I am making is that if you want to opine about global warming you might want to include the oceans, specifically SST.
It’s the elephant that wags its atmospheric tail.
Air temperatures are noisy. Focussing on short-term fluctuations in atmospheric temperature but ignoring the order of magnitude larger oceanic warming is a waste of time at best and otherwise disingenuous. Monckton is smart enough not to be wasting his time.
So what you are saying is that most of AGW is solved but a little bit isn’t.
It seems we agree that the whole thing is over-hyped and the climate models don’t work.
No that’s what you said, I said nothing about solving anything.
So how much is being eaten by the oceans and how much have they left in the side of their plate, free to float off and heat the atmosphere?
Per Schuckmann 2020 for the period 1971-2018 1% went into the atmosphere, 4% into the cryosphere, 6% into land, and 89% into the hydrosphere. And the planetary energy imbalance is +0.87±0.12 W/m2 right now.
That’s piece paper with the word “estimate” scattered throughout it i.e. they’re guessing.
Air temperatures are not noisy! They are a data population with high variance. That is NOT NOISE. You and others blindly ignore this variance and it is never quoted when you quote a global mean temperature. Why is that? Perhaps the variance will be greater than the change in the mean.
While I am at it, why do you never quote an associated “absolute” temperature for the GAT? It’s not that hard to add an anomaly to a baseline temperature. Are you trying to hide the percent change in felt temperature. Where I live if you tell me the annual average is going to grow from 60 to 63 I’ll simply say Yea!
It’s almost as if the earth’s climate is self-correcting, isn’t it?
But the thermageddonists want us to believe the climate is out of control.
Technically I would say it is out of the range of control, for mankind! The earth has maintained itself between certain boundaries for millions of years. I don’t see any evidence that mankind can change those boundaries.
That’ll be a first
No you won’t, liar.
That is your idea of a joke eh Loydo? Please tell us you are joking! Your credibility is at stake.
What credibiity?
🙂
I can’t wait for Nick Stokes to come on here and tell us it’s so warm in the winter that he doesn’t need that extra blanket 😉
He will always need the “extra blanket” he uses while sucking his thumb.
You white western leftie morons don’t even realized when we(=people of my former faith)rape the crap out of your wifes(stockholm, now rape capital nr 1 in Europe) and girls(“grooming” in Rotherham,Rothington and do many other places),
and you don’t even ask why and how this all was and is going on for years unpunished by law and ignored by themee too MSM.
You have ignored that the predicted sea level rise of several yards never happened and turned out to be 100% wrong just as ” snow and arctic sea ice will be a thing of the past” and all the lies about penguins,polar bears,walruses etc being killed by AGW ,
and you ignored climate gate 1+2 and the fact that the earth got so much greener(the only real significant impact co2 had on our planet)
but you still dare to claim that you will notice if the ocean temperatures stop rising.
Dude-the oceans could freeze tomorrow and you wouldn’t dare to question the official narrative because you are not capeable to think for yourself.
As the American Goebbels Edward Bernays said ” We are governed,our minds are molded,our tastes formed,our IDEAS suggested largely bu men we have never heard of”
“who understand the mental processes and the social patterns of the masses.It is they who pull the wires which control the public mind”
And Chomsky wrote a book about how powerful people and their are artificially” manufacturing consent”,
and you can bet you butt that climate consent is part of that.
It really is hard to believe that all these clowns keep on claiming terrible happenings caused by CAGW and CO2 but none of them are observable! Where are the dead polar bears, the kilometers of dead corals on the Great Barrier Reef, the droughts and floods, the destroyed rain forests? The only destroyed rain forests I know of are the ones destroyed to plant oil palms for biodiesel, nothing to do with climate. Sea levels continue to creep up by milometers around the world, there is no catastrophic rise in sea level nor is there going to be. The poles are still ice-covered.
That’s not ice on the poles. That’s water crystals formed by global warmening evaporating all the water off and if you get Ridd of Peter the coral is all bleached like they say it is. Oil their palm and the penguins are next for extinction. We simply can’t see the forest for the tree rings because we haven’t been brought up proper like Greta.
Snort!
You’re looking through the wrong end of the telescope.
Chomsky also wrote a Climate Change book
https://www.amazon.com.au/Climate-Crisis-Global-Green-Deal/dp/178873985X
“If [climate change ] became a serious proposal in the United States, there would be a huge propaganda onslaught by the business community, the energy corporations and many others, to try to frighten the population into opposing it – claiming that if they have it, all sorts of terrible things will happen, like you won’t be able to heat your home, or whatever the story is.”
You’d better switch him to the EVIL ledger.
Got your Big Oil pants on again, I see.
Looks like the source of all the warm water north of Hawaii has gone away. Just a matter of time before it slowly cools back to “normal”. The ENSO region is a primary source of warmer ocean waters and all ENSO regions are cooling. From the Australian BOM:
Yeah, because manmade CO2 heat is magical and can suddenly decide to disappear into the oceans when it wants to.
CO2 is the Magic Molecule. It can cause heating or cooling, as needed, depending on the explanation needed.
Also floods and droughts.
The only thing alarmists have not attributed to CO2 is “the heartbreak of psoriasis!”
They’re holding back on that until all other scare tactics have been deployed. Have to keep publishing rubbish or perish.
Loydo
After Josh Willis, ocean temperature data are not believable.
Some abstract, Josh Willis-massaged “average” is neither believable nor even relevant.
Discreet and recognisable ocean phenomena are more important – things that we would expect to see if the oceans really were warming as Josh Willis would have us believe.
Things like the ice at the poles melting. In the real world, not computer models. Arctic and Antarctic ice, land and sea, is proving stubbornly persistent – it has failed to change significantly over the same time period as the warming pause discussed here. That fact alone shows the warming pause to be more real than Josh Willis invented abstractions of mean temperatures.
https://ptolemy2.wordpress.com/2020/09/12/widespread-signals-of-southern-hemisphere-ocean-cooling-as-well-as-the-amoc/
https://ptolemy2.wordpress.com/2021/09/24/ocean-news/
https://ptolemy2.wordpress.com/2021/05/13/southern-hemisphere-sea-ice-now-extends-80-km-farther-north-than-prior-estimates/
Calling all trolls….
PDO MonthlyIndexSince1979 With37monthRunningAverage.gif (880×475) (climate4you.com)
NOAA SST-NorthAtlantic GlobalMonthlyTempSince1979 With37monthRunningAverage.gif (880×481) (climate4you.com)
The Holocene Climate Optimum was considerably warmer than today but carbon dioxide levels were much lower. This strongly suggests that carbon dioxide has not been a significant driver of temperatures in the current interglacial.
CO2 follows temp. change. Due to outgassing.
It alwys has. Now there is undoubtedly a human compnent,
But since it has been warming for a couple of hundred years and CO2 lags warming, that’s probably why CO2 is still rising when the temperature isn’t.
Why can’t anyone see that? Apart from us conspiracy theorists/ awful sceptics?
Most sheep now wear blinkers!
Smart horses sport fly screens when needed (it’s called summer, loy-d’oh) and leave the blinky blinders to those more obsequious! Will the sheeple be issued coats after they’ve been sheared?
True, but the most of the current significant atmospheric CO2 increases are anthropogenic. But increasing CO2 has not been shown to translate into significant warming. There are too many other primary temperature drivers in the dynamic climate of Earth.
If mankind’s CO2 emissions were the driver of global warming, judging by historically known fact, they would take around 20,000 years to raise the planet’s temperature by 2C.
https://wattsupwiththat.com/2021/06/07/carbon-cycle/#comment-3264363
The following is the cutting edge of the science:
The huge decline in fossil fuel consumption during the year-plus Covid-19 lockdown had NO impact on atmospheric CO2 increase – more evidence that Ed Berry’s latest book and paper are correct – see below.
My friend Ed says the increase in atmospheric CO2 is primarily natural, not man-made. The smartest people on the planet think he is correct.
More evidence supporting Berry:
Atmospheric CO2 changes lag temperature changes at all measured time scales. (MacRae, 2008). Humlum et al (2013) confirmed this conclusion.
Kuo et al (1990) and Keeling (1995) made similar observations in the journal Nature, but have been studiously ignored.
IF CO2 is a significant driver of global temperature, CO2 changes would lead temperature changes but they do NOT – CO2 changes lag temperature changes.
Think about that: Kuo was correct in 1990, and for 31 years climate science has ignored that conclusion and has been going backwards!
Climate Sensitivity (CS) to CO2 is a fiction – so small, if it even exists, it is practically irrelevant.
“The future cannot cause the past.” Here is the proof, from my 2008 paper:
https://www.woodfortrees.org/plot/esrl-co2/from:1979/mean:12/derivative/plot/uah6/from:1979/scale:0.18/offset:0.17
In the modern data record, the lag of atmospheric CO2 changes after atmospheric temperature changes is ~9 months. This is an absolute disproof of the CAGW hypothesis, which states that increasing CO2 drives temperature. “The future cannot cause the past.”
In my 2019 paper below, I explained why the lag is ~9 months – it is basic calculus, the 90 degree (1/4 cycle) lag of the derivative and its integral, which is the ~3 year ENSO period.
My 2008 paper remains very important. My 2008 conclusion was confirmed and expanded by Humlum et al in 2013, for which I am grateful.
My 2008 paper has been cited by Ed Berry in his 2020-21 book and related paper, which is at the cutting edge of climate science.
“CLIMATE MIRACLE: THERE IS NO CLIMATE CRISIS – NATURE CONTROLS CLIMATE”
amazon.ca/Climate-Miracle-climate-crisis-controls-ebook/dp/B08LCD1YC3/
“PREPRINT #3: A NEW CARBON CYCLE MODEL SHOWS HUMAN EMISSIONS CAUSE 25% AND NATURE 75% OF THE CO2 INCREASE”
https://edberry.com/blog/climate/climate-physics/preprint3/
All warmists and most skeptics argue about the magnitude of climate sensitivity (CS) to increasing CO2, and whether the resulting CO2-driven global warming will be hot and dangerous or warm and beneficial. Both groups are probably wrong.
There is a high probability that the mainstream climate debate about the magnitude of CS is wrong – a waste of decades of vital time, tens of trillions of dollars of green energy nonsense and millions of lives. Vital energy systems have been compromised, damaged with intermittent, unreliable wind and solar generation – a debacle.
It is important to note that Global Cooling is happening now, even as CO2 concentration increases – another disproof of the global warming fraud.
Cheap abundant reliable energy is the lifeblood of humanity – it IS that simple. The green sabotage of our vital energy systems, whether innocent or deliberate, has cost lives and could cost very many more.
Regards, Allan MacRae in Calgary
Allan,
Thanks for the attempt, but every self-loathing Climastrologist KNOWS that the Evil Molecule Of Doom causes ALL things!
Heating, cooling, floods and drought; it’s what CO2 is all about!
Don’t try to argue ‘cause there is no doubt,
When they ask questions scream and shout!
You will be quoted.
Agreed A-Man – We covered that some time ago:
You put your left wing in
You put you left wing out
You put your left wing in
And you shake it all about
“Heating, cooling, floods and drought;
That’s what CO2 is all about!”
THE CATASTROPHIC ANTHROPOGENIC GLOBAL WARMING (CAGW) AND THE HUMANMADE CLIMATE CHANGE CRISES ARE PROVED FALSE January 10, 2020
https://thsresearch.files.wordpress.com/2020/01/the-catastrophic-anthropogenic-global-warming-cagw-and-the-humanmade-climate-change-crises-are-proved-false.pdf
INTRODUCTION.
Let’s assume that the CAGW is a scientific hypothesis and can be falsified. This concept is important, because the scary humanmade “Climate Change“ hypothesis can mean anything and everything to climate alarmists – warmer, colder, wetter, drier, windier, calmer and thus cannot be falsified – it is Karl Popper’s “non-falsifiable hypothesis”, or in layman’s terms, it is non-scientific nonsense.
When it is scientifically framed, the Catastrophic Humanmade “Climate Change” hypothesis can also be falsified, as discussed herein.
“A theory that is not refutable by any conceivable event is non-scientific.” – Karl Popper
…
There are numerous highly credible observations that falsify the CAGW hypothesis and many are listed herein, but as Albert Einstein famously stated “One would be enough”.
Aaaaah! The hokey pokey; my college major!
Allan, that was a very nice review of Ed Berry’s book you gave on Amazon! I’ll have to see where else I can find it; I’m getting tired of funding big corporate fascists!
Ed Berry’s book is very general – the core of the science is in the paper, which can be viewed and downloaded here.
“PREPRINT #3: A NEW CARBON CYCLE MODEL SHOWS HUMAN EMISSIONS CAUSE 25% AND NATURE 75% OF THE CO2 INCREASE”
https://edberry.com/blog/climate/climate-physics/preprint3/
“HUMAN EMISSIONS CAUSE 25% AND NATURE 75% OF THE CO2 INCREASE”
LOL, FUNNY BECAUSE YOU’RE NOT JOKING.
So what’s the real percentage then?
Inquiring minds would love to know.
Humans are responsible for 100% of the increase from 280 to 415 ppm.
You’ll have empirical proof of that, won’t you?
(I take it you haven’t heard of a thing called a “volcano”)
I agree with your conclusions, Allan, but Man contributes significantly to current atmospheric CO2 concentrations. Please do not deny that Man puts significant CO2 into the atmosphere.
Oof, heresy. Cursed for not following scripture. The truth is less important than the scripture. Ask Elder Allan.
How significant is highly debatable.
Mmm, debatable, indeed, indeed, yes natural, mmm, yup 25%.
https://climate.nasa.gov/vital-signs/carbon-dioxide/
Why stop at 800 000 years BP? Go back a few million years. What happened when CO2 levels were above 500 ppm? Hint: nothing whatsoever.
Pliocene 3C warmer and sea-level up to 40 m higher.
http://moraymo.us/wp-content/uploads/2014/04/2009_raymoetal.pdf
You need to go back a bit further to see that levels were much higher I’m the past, but you knew that already, didn’t you?
This is so stupid. You cannot append a current temperature to this graph. If you want to append anything it has to be an average for the last 10,000 years, just like each datapoint in the rest of the graph.
To illustrate, can you give me ten, one century averages along with the associated temperature variances starting at 500,500 years ago?
CO2 is rising at a slow pace. Oct 2020 411ppm, Oct 2021 412.5ppm. 0.00825 watt/m2-0.0033°C (using radiative forcing calculation). Climate models are tuned so all human emissions cumulates 7.5ppm(35GTCO2) each year. So Feb 2033 reaches 1.5°C above period 1850-1900 0.69 wattsm2 – 0.27°C. Rising CO2 has slowed from 3.5ppm per year to now 1.5ppm. Due to flat temperature.
Oh no! You mean temperature drives CO2 emissions? That can’t be because man-made CO2 is what drives it. (/sarc)
The end of the Pliocene heralded the start of the present Ice Age and coincided with the closure of the connection between the Pacific and Atlantic oceans. Was it a coincidence that hominin remains suddenly became more prevalent around this time? And that hominins appear to have begun moving out of Africa shortly thereafter.
Because the rate of increase in CO2 is correlated with temperature. Temperatures will need to fall for the rate of CO2 increase to go down.
If the temp is stable, the rate of increase of CO2 is also stable.
Temperature is rising! I don’t think there’s any dispute about this. Just because there has been a pause for the last few years, this doesn’t negate the overall upward trend. Nobody expects a completely linear rise – it will be erratic and I would imagine with several more “pauses”, each one at a higher level than the one before…….if of course the theory is realised!!!!
The point is that if pauses occur then CO2 is NOT a direct cause and that natural variation still has a large part to play.
If someone volunteers to pay me I will be a troll. Otehrwise I will just continue to be cheerfully skeptic. When I was young skepticism was considered a societal duty of tejh young. What happened in our age of drab conformity?
Good point, why are the young people of today so willing to believe what they are told instead of questioning everything?
First of all you have to believe that the “young people of today” are “so willing to believe what they are told”. I’ve seen polls where “young people” do not uniformly believe in CAGW. The fact that so many are able to withstand the enormous propaganda that the MSM and the teachers unions deluge them with is really quite amazing. But of course you won’t read about that in the NYT…
The schools have failed and the MSM has taken over responsibility for ‘educating’ everyone.
It’s not a today problem, it’s an always been issue. Kids are going to believe whatever the adults they trust in their lives tell them. If that’s the we are heading into the next ice age then that’s what they believe. If they are told the world is going to burn up because CO2 then that’s what’s going to happen. Heck, when Reagan was shot there was celebration in my school halls because I lived in a liberal area where they kept saying Reagan was going to lead us into WW3. Kids literally were celebrating his potential death (this was before news arrived that he would live) saving the US from war. FYI, I was in 6th grade at the time and this is the event that opened my eyes to how are thoughts are controlled by narrative.
alastair,
I don’t think the pay is worth the required partial lobotomy! And they remove your sense of humor simultaneously; nothing is worth that much misery!
“QUESTION AUTHORITY” was the rallying cry of the baby boomers in the 1960’s when they all thought that implementing Marxism was the answer to their daily woes.
Fast forward 50 years and see the results of what a more centralized government actually achieves.
Now the mantra is ” SILENCE THE DENIERS” as we see daily in the MSM and social media platforms as the “woke” take away debate and implement policy by force.
“Why does these long Pauses matter?” (sic)
It gives Pausists something to talk about. All I can say is thank god the land and atmosphere is doing the opposite of the oceans.
http://homework.uoregon.edu/pub/class/es202/GRL/oheat3.jpg
Ahhh, more lies, how refreshing. Not.
No, no, Zettajoule do actually exist. They’re just like joules but lots of them.
I would suggest laying off the sauce, except that is the only thing that keeps you going, sadly.
Sorry, I mistook you for a pre-schooler.
So, instead of sobering up you just drink more and keep typing. How sadly typical for you.
“Pausists”
I wonder how long it took your undoubted genius to come up with yet another slur for people who disagree with you?
“All I can say is thank god”
You do realise there is no god? That at least explains your fervent beliefs.
The CO2 induced warming selectively goes only into the ocean?
Is this like cooling is actually caused by warming?
Yeah, the atmosphere is boiling! Fortunately the oceans have about 1000x the heat capacity of the atmosphere, so a boiling atmosphere of 100C is only increasing the oceans by 0.1C!
Or something or other….it’s all bollox.
Loydo, you would fit right in at the University of Oregon, located in Eugene, and the self-declared center of LGBTQIX activity in the US. You would also like this: Oregon has just passed an actual law eliminating any testing in reading, writing, or math to obtain a High School Diploma. This is actually racist as it lowers expectations.
Ron,
Loydo is very excited to find a place where he can complete his GED!
So what?
This year is going to be a lot cooler than last. We’re liable to have La Niña again.
In February, Earth’s cooling trend will turn six.
https://www.drroyspencer.com/2021/10/uah-global-temperature-update-for-september-2021-0-25-deg-c/
This La Nina looks locked-in.
– Major cold in four months (and sooner).
– Energy systems in the UK and Germany compromised by intermittent green energy schemes.
– The “”Perfect Storm”, brewed by idiot politicians
– What could possibly go wrong, with these energy-imbeciles in charge?
– Extreme cold and energy shortages. This will end badly.
I tried to warn them in 2002 and 2013, but they would not listen.
Regards, Allan
“…and therefore send not to know for whom the bells tolls; it tolls for thee.”
— John Donne (1624) From Meditations, XVII
https://wattsupwiththat.com/2019/11/12/arctic-blast-has-arrived-in-the-eastern-usnumerous-record-low-temperatures-by-early-wednesday/#comment-2845511
Well, there it is – the perfect Trifecta – my work here is done.
https://wattsupwiththat.com/2019/10/27/the-real-climate-crisis-is-not-global-warming-it-is-cooling-and-it-may-have-already-started/#comment-2835920
[excerpt]
1. “Climate science does not support the theory of catastrophic human-made global warming – the alleged warming crisis does not exist.”
– Allan MacRae et al, 2002
2. “The ultimate agenda of pro-Kyoto advocates is to eliminate fossil fuels, but this would result in a catastrophic shortfall in global energy supply – the wasteful, inefficient energy solutions proposed by Kyoto advocates simply cannot replace fossil fuels.”
– Allan MacRae et al, 2002
3. “If [as we believe] solar activity is the main driver of surface temperature rather than CO2, we should begin the next cooling period by 2020 to 2030.”
– Allan MacRae et al, 2002
3a. “I suggest global cooling starts by 2020 or sooner. Bundle up.”
– Allan MacRae, 2013
Regards to all, Allan MacRae
_______________________________________________
Interesting global SST chart for Oct 1st. You can easily spot the paths of the West Pacific Typhoon that skimmed the east coast of Japan as well as the purported CAT 4 horrorcane that hit nothing in the Atlantic by the “Blue” cool water paths left in their wake
https://wattsupwiththat.com/2013/10/31/blind-faith-in-climate-models/#comment-1130954
AN OPEN LETTER TO BARONESS VERMA, OCTOBER 31, 2013
BY ALLAN MACRAE, B.A.Sc.(Eng.), M.Eng.
[excerpt]
So here is my real concern:
IF the Sun does indeed drive temperature, as I suspect, Baroness Verma, then you and your colleagues on both sides of the House may have brewed the perfect storm.
You are claiming that global cooling will NOT happen, AND you have crippled your energy systems with excessive reliance on ineffective grid-connected “green energy” schemes.
I suggest that global cooling probably WILL happen within the next decade or sooner, and Britain will get colder.
I also suggest that the IPCC and the Met Office have NO track record of successful prediction (or “projection”) of global temperature and thus have no scientific credibility.
I suggest that Winter deaths will increase in the UK as cooling progresses.
I suggest that Excess Winter Mortality, the British rate of which is about double the rate in the Scandinavian countries, should provide an estimate of this unfolding tragedy.
As always in these matters, I hope to be wrong. These are not numbers, they are real people, who “loved and were loved”.
Best regards to all, Allan MacRae
“Turning and tuning in the widening gyre, the falcon cannot hear the falconer…” Yeats
__________________________________
Why can’t politicians see that? 10 times as many people die of cold as heat. Maybe David Icke has a point?
Dying of cold is a signal that more (fossil-fuel/nuclear) energy is needed, not less.
Wrong narrative entirely.
According to Lancet it’s 20 times more people die from the cold than from heat. Furthermore, it was found with both heat caused and cold caused deaths, the majority were not caused by extremes.
The UK Met Office is forecasting snow for end of October beginning of November. Just in time for COP26 junket in Glasgow.
From today:
Thanks!
La Niña is good for fishers, bad for farmers. But ChiCom factory ships are doing to South American waters what they’ve already done to the western Pacific.
That depends on whether the farmers are on the eastern or western side of the Pacific.
True. I was referring to the Americas.
… and the Grand Banks cod fishery.
Wow! Golly gee! We have a 42-year period where there has been a cyclical upswing in global tropospheric temperatures. The best we can come up with is a 1.4 C/century trend. That would seem to put a hard cap of less than 1.4 C on Transient Climate Sensitivity (TCS) estimates. Its all downhill from here.
Oh, Lord Monckey, why are you always keen on making a fool of yourself? This forum is a slapstick comedy version of climate science, and you’re getting associated with it… There’s a proper forum for the greatness of your wisdom, the Upper House, your natural plane of existence (wink-wink 😉 ).
(Your insults and fallacies must stop as POLICY demands it: Respect is given to those with manners, those without manners that insult others or begin starting flame wars may find their posts deleted.
Trolls, flame-bait, personal attacks, thread-jacking, sockpuppetry, name-calling such as “denialist,” “denier,” and other detritus that add nothing to further the discussion may get deleted;)
SUNMOD
No arguments ?
(I had to remove 8 comments that was off topic and part of a derailing thread line over a person, we are supposed to be discussing the topic not about a person who comments here) SUNMOD
Only argumentative fallacies.
Where ? Can’t find any, there aren’t ss you should know.
?????
Ad hominem. Means you have no real rebuttal.
Well, science has, and that’s enough for me. FYI those other guys you don’t like always point out the stupidity of the “Monckey pause” using the proper references.
One more argumentative fallacy – Appeal to Authority.
First, you don’t even identify the authority you are appealing to, “science” is not an authority, it is a process. Second, you provide nothing from the authority that actually supports your assertion.
Yep. Scientific Authority. Eg. in medical matters I would ask a doctor. Would that be “appeal to authority”? Scientists are the trained experts in their respective fields. So I naturally ask them, and I wouldn’t believe in a blog. Furthermore, if you want scientific rebuttal, read the guys below (like Bellman, Banton etc.). They give you a good glimpse in this.
(Guys like Bellman and Banton who provide a distinct opposition viewpoint are a benefit to the blog as they generally make a real effort to debate the topic and be reasonably civil in the process, while people like YOU often come across with personal attacks and insults which you just told me in another comment that you are proud of it, means you are showing that you have little to offer for the debate thus will eventually be put into moderation to stop your useless insulting comments from wasting genuine readers time wanting mature discussion) SUNMOD
Remember, I argued “normally” here too. I always received ad homs immediately.
“Guys like Bellman and Banton who provide a distinct opposition viewpoint are a benefit to the blog as they generally make a real effort to debate the topic and be reasonably civil in the process”
I second that motion.
Banton can be quite nasty also, did you miss this from upthread:
Then we have ( the with one bound he was free ) assertion
” …perpetuate the lies…FOR THEIR OWN POWER.”
My goodness – if you say so !
Oh, and how are them there paedoes doing now that Trump isn’t after them – or maybe he’s been to buy a pizza there since, err losing the POTUS.
“You won’t like it after you finally wake up to the horrible truth.”
LOL – how ironic.
Indeed.
Indeed.
“a doctor” is not the same as “science has”. If you ask a doctor then you should quote who he is and what he said. Referring to “the science” provides no way to judge anything.
Consensus is *NOT* science, especially when it comes to a generalized assertion.
Bellman and Barton are not experts on anything, let alone physical science. Their lack of knowledge on how to propagate uncertainty is total proof of that.
As with all of those mental midgets, they never have despite hundreds if not thousands of requests. Of course, the reason is quite simple: Carbon dioxide levels above 280ppm have never been shown, using real scientific methods, to have an effect on any global climate parameter that is indistinguishable from zero. How easy would it be to prove that statement to be incorrect, if it was incorrect?
You have the podium trolls one and all ……..
We need a new fallacy category – Appeal to Trolls.
““science” is not an authority, it is a process”
That should be said much more.
Well, the last “Monckey pause” lasted over 17 years and created an entire industry attempting (unsuccessfully) to explain it away.
Monkton is a blatteroon and a mumpsimus snollygoster but luckily also a dowfart. I’m surprised he does not draw a line from the peak of 2019 to the minimum for 2021 and claim absolute zero by 2030. When will people realise that climate is a noisy signal. Just look at the hadcrut plots he posted. As others have posted it is better to look at sea temperatures as these smooth the noise.
Oh look, a new contestant.
How unusual.
Pay attention to the following …
(I had to remove 8 comments that was off topic and part of a derailing thread line over a person, we are supposed to be discussing the topic not about a person who comments here) SUNMOD
The moderator is referring to you and those like you. Clearly you have nothing of value to add and haven’t the vaguest understanding of climate science … not to mention your lack of ability to follow Lord Monckton’s reasoning.
LOL
I object to the “dowfart” characterisation – clearly this isn’t true, unless you’re referring to the “effectual” part of the definition, to which I couldn’t comment (and probably neither can you).
Nevertheless, I’ve added all of these: “dowfart,” “blatteroon,” “mumpsimus,” and “snollygoster” to my list of wonderfully rare(?) and obnoxious words I hope to use at some point in the future when, like you, I go blabbering through the blogosphere playing as though I’m another Brad Keyes, of whom there will only ever be a mere image; never an equal.
Temperatures are not noisy. Noise is a signal unrelated to the primary intelligence that prevents knowing the actual intelligence. What you are claiming is that TEMPERATURE VARIATION SHOULD BE REMOVED. You should realize that if you do that you have NO SIGNAL AT ALL!
What you are claiming is noise is actually the variance in a mean. The variance is totally ignored in so-called climate science because it would dwarf anomalies.
Why do you think you never, ever see it quoted in any discussion or paper?
I have always enjoyed your slapstick comedy.
Thx, I’m doing my best 🙂
Ahh I know get it …you are pretending
“Oh, Lord Monckey”
Starting with an ad-hom, already we can see the [religious] venom dripping…
“This forum is a slapstick comedy version of climate science”
You haven’t come up with anything to prove your god exists, yet.
You could always do something about that – post something that proves CO2 really is a problem.
Something that doesn’t rely on a model or several hundred models averaged with the first number you thought of, taken away….
Well, I’m an atheist 🙂
Why? Scientists (I mean the real ones) have already done that. Read them.
Why do you think you can force your completely arbitrary methodological restrictions on science?
They haven’t proved anything as well you know, otherwise you would have taken great delight in posting it.
Why do you think you can force your completely arbitrary methodological restrictions on science?
That reply says it all. The useless models are forced on everybody, they are utterly wrong and yet they are the gospel truth.
If, indeed, you could post something to prove your god/belief is true. You’d have done it by now.
Yes they have. If you can produce a pause with shifting your window a few month ahead or back, that’s not a real pause (but one of your favorites, “natural variability”). I think this is self evident. Furthermore, using UAH data, from all the possible intervals of this length (81 months), 25% of them are either showing a pause or even cooling. All the while of course the whole dataset is showing a pronounced warming.
There is no evidence to support your beliefs on climate. Hell, you don’t even understand the difference between weather and climate.
0.14 C/decade during a cyclical warming period is by no stretch of the imagination your “pronounced warming.”
The 18+ year pause exceeds the 15 to 17 year timeframe the “experts” agreed would falsify the CliSciFi models.
Any hypothesis like CAGW that requires large and continuing post hoc adjustments and “explanations” is garbage.
You do realize you just described a periodic function don’t you? You might want to to quit playing with numbers as numbers and look the phenomena they describe. Mathematicians look at numbers, engineers and physical scientists deal with the real, physical phenomena first and the numbers second.
The “I have scientists that agree with me so that means the global warming scam is real!” argument. Very scientific stuff….
I’ve read your “real” scientists and found their research skills lacking, their math dubious and their bias manifest. Serious scientific reviewers have found the same problems with many CliSciFi practitioner “studies.”
The UN IPCC CliSciFi models are exercises in fantasy, as now admitted by one of the chief modelers, Gavin Schmidt. Additionally, it is widely recognized that model “scenarios” are wildly out of line with reasonably-projected future trends in FF use and social and economic development. Also see the work of Nobel Laureate William Nordhaus.
None of the UN IPCC reports support CAGW. Read WG1 instead of the politicians’ SPM.
Read more material outside your CAGW religion.
Nyolci
are you but not missing the deeper concept here. what you think of as science is merely a few synapses firing up in a brain that allows that brain to see a pattern, and for the training that brain received and for where that brain is in employment to be able to act on that pattern and then through diligent unbiased labour tosee if that pattern appears to be reproduceable.
To suggest that great
ideas/concepts/thoughtsonly come through a degree of intense cogitation from the brains employed in that specific field of endeavor is overtly incorrect. should we suggest that only great ideas come from great men ? (includeswomen)Information such as the
apparentpause mentioned above should not be taken by your brain as a statement that MUST be accepted, your brain is cleverer than that, it should be absorbed without favour or bias assomething that has been saidand your brain will perhaps one day find an embedded pattern that your brain understands and can make use of ; be that the colour of the graph, or the simple length of the line at that time, the number of peaks per time period etcAt least I am heartened by the obvious fact that you do take the time to absorb (unfortunately it appears with bias) such “slapstick comedy version of climate science” websites .
Please continue to absorb, as one day you, or I, will be proven either right, or wrong, or both, on this globally interesting subject matter where information is a fundamental prerequisite
And in the end, on a personal scale, it matters not one jot.
best regards
Look, your rant shows how confused you are. You should know these denier “scholars” here are amateurs at best, and they are doing amateurish errors with statistics etc. It’s no coincidence that the actual experts are called “experts”. They’ve easily refuted anything you deniers have come up with.
“It’s no coincidence that the actual experts are called “experts”. They’ve easily refuted anything you deniers have come up with.”
You should read Donna LaFaframboise’s book “The Delinquent Teenager …” if you want to find out who these UN IPCC “experts” really are. They are a bunch of Charlatans and Politicians masquerading as scientists. They have a political/personal agenda. They are not doing science. Instead, they are trying to fool the world into doing some very stupid things.
Given these “experts” haven’t been able to get a single prediction (projection) right in 30 odd years, it’s no surprise the expertise of these “experts” is questioned.
Be honest for the first time in your life: all you have is the Appeal to Authority fallacy.
Talking of comedy, or own foot shooting, Monckton is an hereditary peer, but one of those Blair ejected in 1999. The Upper House is a forum to which he no longer has access, more’s the pity.
I’m actually in favour of not allowing hereditary peers. Why should anyone be granted the right to order me about because of hereditary?
As far as I can tell, Lord Monckton (and he deserves the title, despite the detractors) has no problem with this either. In my opinion he has definitely shown his good standing without the need to rest on the laurels of his ancestors.
Yes, like most of those booted out he accepted it with grace; they were those kind of people, and a great loss in my view. But it’s odd. The House of Lords is one of those things that sounds odd to modern egalitarian tropes, and one where you say, well I wouldn’t start from here. But it developed organically over the ages and actually worked quite well – one of the reasons Blair ruined it; it got in his way. The hereditaries tended to be older, many with specific niche expertise, with histories of running estates or enterprises, had a stake in stability and practical evolution rather than revolution, and had no real powers bar delaying Bills and advising and proposing amendments that could always be struck down by the lower house. So they were not in a position of ordering us about. Far better than the greasers and schmoosers and failed has beens and party hacks now appointed, who do indeed meddle beyond their remit in party political fashion to order us about. Just look at the Climate Change Committee chaired by Lord Deben; useless man up to his neck in Green investments.
Nine years & counting?
How long can the same unelected bloke chair a Government committee? 🤔
He is extremely concerned with it and he’s been smoldering ever since.
Proof?
That’s why the wink 🙂 Actually, he wasn’t ejected, he had not been not admitted ever.
Yeah, yeah. So clever you cannot see a figure of speech when it is in front of you? Yes, by the time he inherited the title (2006) his line had been disassociated; his right to enter was gone; he was metaphorically ejected.
This contradicts your 9:33 am post, above.
??? He’s concerned with his non-admittance.
Did you refute him somewhere in that post? No, you didn’t. Wonder why? https://twitter.com/dawntj90/status/1439976517908451333?s=21
Thank you, SUNMOD.
Ignorant person.
Lord Monckton is not allowed (courtesy of Tony Blair) to speak in the Upper House, as you call it.
wink-wink 😉
“The fundamental error is the use of the equilibrium average climate assumption to simplify the climate energy transfer processes. This presumes that there is an exact flux balance between an average absorbed solar flux and the average emitted longwave IR (LWIR) flux at the top of the atmosphere. The result is an elegant set of equilibrium flux balance equations that have no relationship whatsoever to the earth’s climate. The so called radiative convective equilibrium models must create global warming as a mathematical artifact of the underlying assumptions. Physical reality has been abandoned in favor of mathematical simplicity. The equilibrium climate models are fraudulent, by definition, before any computer code is even written. There is no ‘24 hour average sun’ shining in the sky at night. The 2 C (or 1.5 C) temperature limit established by the Paris Climate Accord is based on nothing more than the pseudoscience of radiative forcing, feedbacks and a contrived climate sensitivity to CO2 in a fictional ‘equilibrium average’ climate. Irrational belief in computer climate model ‘prediction’ has replaced logic and reason. Eisenhower’s warning about the corruption of science by government funding has come true. There is no ‘climate emergency’.”
Roy Clark
https://venturaphotonics.com/files/VPCP_000.1_RecentResearch.pdf
I heartily agree. When was the last time you saw a study that actually used sin/cos functions to analyze anything. Rud Istvan mentioned above about his use of calculus, derivatives, and periodic functions. Hallelujah! Read Planck’s treatise on heat radiation and you’ll quickly see how important this math is to his deciphering the problem.
The mean (average) of a series of data mean nothing without knowing the associated statistical parameters such as variance, skewness, and kurtosis. Do you ever see these quoted in any study? The only figure you ever see is some bogus calculation of “error of the mean” which only applies to a sample mean and does not illustrate the actual population standard deviation.
Hear, Hear!
Please repeat this as often as you possibly can!
Since we’re defining a period of 6-years 9-months (or 81 months) as ‘long’ and as a period that ‘matters’, it’s worth checking to see how many other of these apparently significant 81-month periods of no warming occurr in the UAH data set.
There are 434 continuous, overlapping 81-month periods in UAH_TLT, including the one highlighted here by Lord M. Of these, 124 have either a zero or a negative (cooling) trend. Yes, more than a quarter of all the consecutive 6-year 9-month periods in UAH show either no warming trend or else a cooling trend.
Despite this, the full warming trend in UAH is now a statistically significant +0.14C per decade; actually, up from +0.13C/dec at the end of last month (a fact overlooked by Lord M).
So how significant, really, is another period of 6 years and 9 months no warming in the overall scheme of things?
Did you start your measurements from the LIA? Or the Eemian? Nail hit.
Not
Your
Ordinary
Laughable
Cobblers
Innit?
Indeed, it isn’t
He was talking about the UAH dataset.
There have also been periods of 8 months where the warming trend was over 1°C / decade.
You forgot 1.0001 😉
8 months warming out of a decade versus 6 years 9 months of a pause.
Surely you miss the point with it.
Sorry, that should have been .81 months – i.e. the same as the pause length.
(Really hope all these lavish payments come in soon, so I can afford a better keyboard.)
Reply to THE FINAL NAIL
So show us where, in the record of warming since 1780 (LIA Nadir), natural warming ended and Anthropogenic enhanced warming began. And for extra credit, demonstrate how you determined the difference
Yes, all coinciding with El Ninos conditions. Now all you need do is show how CO2 causes El Nino’s and you’re home free.
CO2 doesn’t cause El Niños. That’s the point. El Niños and La Niñas come and go, and cause fluctuations in the trend, especially if you look at short periods. An 81 month trend of 0.8 – 1.0°C / decade tells us nothing about how CO2 is affecting global temperatures and anyone who used such a period to calculate sensitivity to CO2 is a fool. Likewise anyone looking at a cooling or flat trend starting with an El Niño.
Amazing, since all El Ninos in the satellite record cause an immediate step up in the observed warming. So if CO2 is not doing that, then limiting CO2 in the atmosphere won’t remove that either. Cause and effect, you know.
El Niños don’t cause a step up in temperature, any more than La Niñas cause a step down. They just cause a temporary spike in temperature. Something else is causing the long term warming.
Carefully starting a trend can give the illusion that the world is warming in steps, but this makes no sense as a cause of warming. You can just as easily choose trends to show the world is warming in periods of rapid warming followed by sudden drops in temperature.
Is the 18+ year flat trend in global atmospheric temperature too short to show that rising atmospheric CO2 concentrations doesn’t significantly affect global temperatures?
The trend from July 1997 to January 2016 is 0.000°C / decade, so I guess that’s the official dates for the last pause. (Which means that the last pause stopped year after the new pause began).
Using the Trend Calculator the 2σ confidence interval is ± 0.17°C / decade.
This compares with:
the trend up to the start of the old pause of 0.08°C / decade.
the trend at the end of the old pause of 0.11°C / decade.
the trend over the whole data set of 0.14°C / decade.
So I wouldn’t say the old great pause was statistically different from the overall trend, and if anything caused the warming rate to increase.
And that’s before you get on to the old problem of how this period was chosen specifically to show a pause.
As far as showing that CO2 isn’t causing warming, as I posted in another comment, the correlation between anomalies and CO2 over the whole UAH data set is statistically significant and explains about half the variation in monthly anomalies.
You say the zero trend has a 2 sigma of 0.17, so that zero trend is not significantly different from various trends of 0.08, 0.11 and 0.14 C/decade. I accept your contention that those other trends are not significantly different than zero.
Then you don;t understand the statistics. The trend up to the start of the Great Pause wasn’t significant, but the other two were.
Specifically:
Dec1978 – Dec 2015: 0.11 ± 0.06°C / decade
Dec1979 – Aug 2021: 0.13 ± 0.05°C / decade
Both reject the null-hypothesis of zero trend at the 2σ level.
You are correct, El Nino’s create CO2.
To a limited extent, though they explain the overall rise in CO2.
“Despite this, the full warming trend in UAH is now a statistically significant +0.14C per decade; actually, up from +0.13C/dec at the end of last month (a fact overlooked by Lord M).”
Yep, of course it is as it is not a pause that actually reduces the long-term trend.
Now unless my common sense logic has gone down some other rabbit-hole different to this one. When Monckton talks of a “pause” he must mean one that slows the LT-trend rise?
Surely?
Clue: else it is meaningless
This is the full UAH TLT data that Monckton posted a month ago.

It shows the LT-trend ending at ~ 0.2C
And here we have this month’s latest “pause” zero trend … err ending at 0.24C
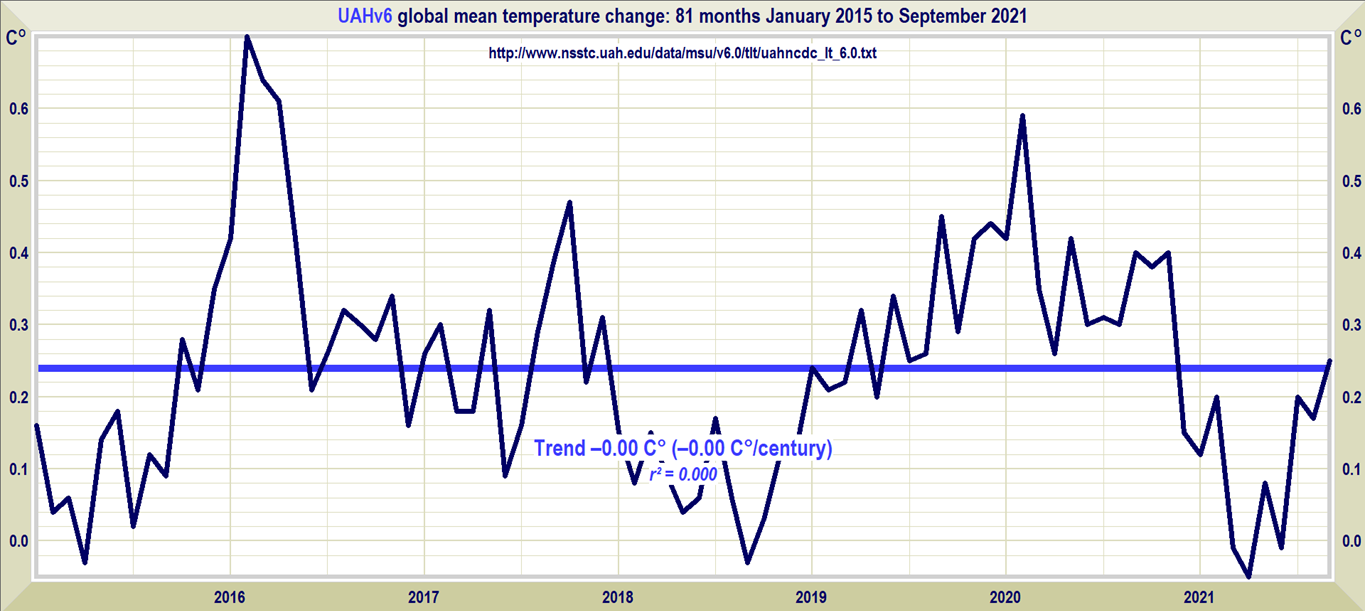
So we have a “pause” that is operating at a higher level than if we were to rightly take it as not significant.
A “pause” is surely supposed to break away from the long-term trend to a lower point!
(that is rhetorical BTW) – as of course it is to mean an actual pause – as in a reduction of the LT trend.
What is happening is that this “pause” is still increasing the LT trend, because as each month goes by with it being at a higher level than the LT-trend then it is of course increasing the LT-trend – as it is incorporated in it !
You just couldn’t make it up – other than to realise that denizens are so unsceptical of “sceptics” for his Lordship’s complete bo***cks” to not get called out as just that, other than by the usual suspects.
The overall effect of the pause so far has been to increase the trend from 0.110°C / decade at the start of the pause, to the current 0.135°C / decade. It has been dropping slightly since the end of last year, but you would only see this in the third decimal place, and none of the changes are significant.
0.135°C / decade.?
Oh my! We’re all gonna fry!!!!!!
Get a grip on yourself.
But won’t that increase Greenland’s average Temperature from a mind numbing -30c up to a bone chilling -28c over the next century?
We’re DOOMED… doomed…
That will be on top of the plateaux.
Ice melts from the sea-level upwards you know?
And more atmospheric WV will mean more TPW which will fall as snow up there (mostly for a few decades yet).
Also, does it not matter about the generations (hopefully) that follow next century and the one after, etc etc ?
Hey, SUNMOD! This is not debate! This guy claims Bellman doesn’t have a grip on himself! This is ad hom! Please do what you have to do.
Don’t worry about it. It’s usually best to ignore these petty insults.
You’re right and I do the same but I got censored for “ad homs”, so I’m just pointing out the almost immediate barrage of ad homs we get for defending science here after showing (mostly you guys, good work) why their argument has failed. They should censor these ad homs too.
Calm down dear!
I was just pointing out that Bellman getting his knickers in a twist about a fraction of a degree is rather daft.
I really wasn’t. It was just to point out the contradiction of talking about a pause slowing down warming when if anything it has had the opposite effect.
So what you’re saying is the flattening of a positive gradient is actually speeding up the rate of change? That’s a new one on me.
Yes, because each flattened period starts above the gradient.
Riiiiight…….
Maybe a picture will help. Red line shows trend of the data up to the start of the Great Pause, extended across the full range. Blue lines are the trends of the two pauses. (No confidence intervals to avoid over complicating the graph).
Um, no. You’re ignoring the el ninos (I find thermageddonists like to ignore natural warming, otherwise they can’t blame it on our evil see-oh-toos)
If there hadn’t been the pauses, but the el ninos still occured, the gradient would be even steeper. The pauses counteracted the (natural) increases of the el ninos.
Try again.
“The pauses counteracted the (natural) increases of the el ninos.”
Well done Monckers, chalk that up as a win.
So you’re saying the pauses have a positive gradient?
What is variance of the data being used for the trend?
The spaghetti graphs are more entertaining than these, Baton, try again.
Hey SUNMOD! This above is anything but “mature discussion”! Please do what you’re supposed to do.
Are you alright?
Nurse, it’s time for nyolci’s meds!
Quite right Monte.
Tell that to Monckton – if he makes an appearance.
As they are his graphs.
(assuming you me the ones just above)
BTW: it’s no surprise to me that you think that of anything I post,
Also you seem to be struggling to find a purposeful derogatory dig.
Bless.
“You just couldn’t make it up – other than to realise that denizens are so unsceptical of “sceptics” for his Lordship’s complete bo***cks” to not get called out as just that”
Skeptics think the Pause is interesting. We won’t start getting excited until the trend starts down. Then what will your argument be?
How can a pause start down when by definition it’s the longest period with no trend? If you want to get exited start in 2016, with trends cooling at something like 0.24°C ./ decade.
Did you get exited in 2009 when Monckton was talking about a 7 year rapid cooling trend?
That should be “Did you get excited in 2009 when Monckton was talking about a 7 year rapid cooling trend?”
I wrote “trend”, not “pause” and no, I didn’t get excited about any of this.
Like I said, I’ll get excited when the trend starts down.
And I won’t be getting excited because it is getting cooler, I will be getting excited because maybe the cooling will show the world what fools they have been to believe in Human-caused Global Warming in the first place, considering there has never been any evidence to back up this claim.
I’ll be getting excited about Mother Nature waking people up from their slumber.
Wow, when you set out to be wrong you do it in spades. Bravo, idiot.
No he is quite correct … and if you were in the slightest bit sceptical you would understand why.
I would call you an “I***t”, as you are, but ad homs are against blog rules.
“ad homs are against blog rules”
You should try telling the entity known as ‘nyolci’ that.
It cannot post without using them
Actually, I can. I don’t know whether you realize but you deniers come up with ad homs almost immediately. So I think this is more like I’m adapting to the tone here 🙂 Remember the “renewables” HV line. I tried to argue etc., but (with very rare exceptions) I only got ad homs.
=====
(Using the words deniers/denialists are considered an insult by this blog policy:)
Hey SUNMOD! Ad hom detected (and nothing else).
Wow, angry when complimented. You really should just be happy the climate of Earth is so good for us to live in. Being angry about that which you can not control is unhealthy, doubly so since humans are not causing the climate to change and can’t stop it from changing. Wasted time is never regained, being angry about the weather is wasted time.
Oh, almost forgot! Coal, Gas, Nuclear and Hydro are the Renewable Energy sources, windmills and solar panels are expensive and failed toys.
Hey SUNMOD! Still waiting for your statement.
Hm, I’m afraid you didn’t understand me. I’m completely calm. I’m not concerned about who has started it. I’m just pointing out ad homs here going uncensored.
[stop it. calm down. I don’t care who started it. charles]
Yeah, well quit your double-standards. Are ad homs snipped or aren’t they?
You’re quite funny. Do you do stand up?
“Despite this, the full warming trend in UAH is now a statistically significant +0.14C per decade; actually, up from +0.13C/dec at the end of last month (a fact overlooked by Lord M).”
In reality the underlying trend has barely changed. It was 0.13497°C / decade last month, this month it’s 0.13507°C / decade this month. It’s just that rounding to 2 significant figures when the trend is on the cusp of 0.135 can give the impression of big swings in the trend.
You can tack on a bunch more digits to these figures, why stop here?
Because the point was to show how little the trend had changed, and I had to go to multiple digits to illustrate the point.
If I’d used the prescribed to sf it would have said last month the trend was 0.13 and this month it’s 0.14, which is exactly the point I was disputing. If I’d used 3 sf it would have said last month was 0.135 and this month was 0.135 would have have made it look like there was no change.
Why did you not elucidate on the radiative connection between CO2 and temperature?
Can CO2 continue its rise without affecting temperature?
If so, how does one establish the mathematical connection between the two? Is it a probability function without a direct connection?
My comment had nothing to do with CO2. It was just pointing out the silliness of claiming that the trend over a period of 6 years 9 months ‘matters’ in a data set that goes back decades and contains literally hundreds of similar flat sequences.
Nobody claims the 6 years 9 months “matters.” It is just something Lord Monckton has been doing for years and he has fun with it. Why begrudge him some fun? Don’t worry; when it gets up to 18+ years again, I’ll let you know.
You think he concocts all this bs for fun? Thats a bit naiive.
Don’t be confusing them with their having to connect all the contents of their juvenile temperature rantings with actual CO2 data. They’ve already taken their ball home on that horrid thought.
In the vast majority of cases a single data-point usually isn’t significant, but for short trends it is often instructive to look at how a “sliding window” of that “cherry-picked” length evolves over the entire dataset.
To me the following graph counts as “interesting”, but we cannot really “conclude” anything from it …
Your chart states that the dotted line shows the “overall 514-month trend”. It doesn’t. It shows your interpretation of the trend of hundreds of other consecutive 81-month trends.
I say ‘your interpretation’ because it’s not one I can replicate. I get a similar looking line and number values, but the linear trend, as calculate in Excel, produces a warming trend of +0.06C per decade. What method did you use to calculate your trend?
That is the (fixed / constant / horizontal line) single value, of approximately +0.14°C per decade, of the 154-month trend of the entire UAH record (from December 1978 to September 2021).
I added it merely for comparison purposes against the minimum and maximum values in the set of 81-month values.
One day, which could be soon, you will be thankful for a pause in the planets declining temperatures. That will happen. That is a certainty.
“That will happen. That is a certainty.”
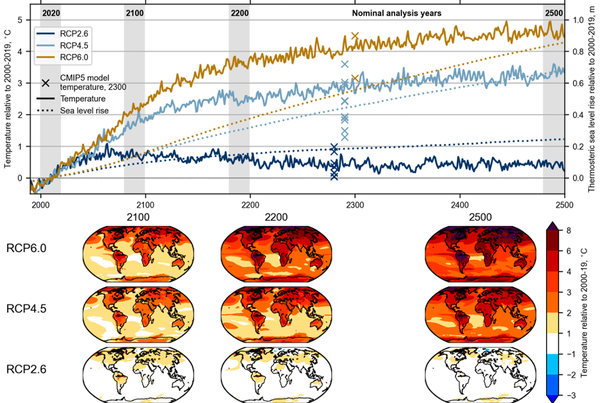
Sorry but that is extremely unlikely. The physics is unambiguous: average global temperature will continue rising until an equilibrium is reached because of the additional forcing caused by a rising CO2 concentration. So (barring a one-off like a VEI-7 eruption) highly unlikely in your lifetime or your childrens, or theirs, or thiers, or theirs…etc
Certainty is a delusion.
So you believe the period of times known as glaciation have ceased to ever occur and that this interglacial will be the final state of the earth for time immemorial.
You missed the nail there. Nobody has said that a 6 year and 9 month pause is significant. The 18+ year pause was, however, very significant. The “experts” started out saying a 10-year or greater pause would falsify the models. Later they changed that to 15 years. Their final desperate attempt towards the end of the 18+ year pause was 17 years. The UN IPCC CliSciFi models have been falsified by many metrics. Get over it.
May I humbly suggest that Viscount Monckton peruses my previous critique of his “perpetual pause” theory?
https://bit.ly/3a2hQgl
The late, great Richard Feynman used a phrase that should be seared into the consciousness of anyone writing about climate science, especially those who are economical with the truth…
Bill the Frog, not the Troll!
“What a long Pause shows – and the New Pause is now a long Pause – is not that there has not been warming in the past, nor that there will be no warming in future, but that for whatever reasons the Earth is at present likely to be in approximate radiative balance with its surroundings, notwithstanding an undiminished and continuing linear uptrend in anthropogenic radiative forcing.”
If you are going to make a claim like that, you really need to show how you determine the trend from January 2015 is a significant change from the previous warming.
If you are claiming that the Earth wasn’t in balance up to December 2014, but suddenly balanced from January 2015, what caused the big jump in temperature between the two months? Why is it OK to consider the last 6 years and 9 months as demonstrating a balance, why does the trend starting at January 2011 to present show warming at 0.396°C / decade? Is the last 7 years more meaningful than the last 10?
Perhaps you should go and study the work done, it is publicly available and free. You like free? Of course you do. You just don’t like anything that is not lock step with the Globall Warmining religious dogma.
Could you point me to published work you are referring to?
You just referred to some of it, apparently without actually reading it, above. Look, if you are trying to convince anyone, anywhere, that humans are causing climate change and that humans can stop climate from changing all you get from me is derision and ridicule.
Let me save you some time so you can go do something productive with your time. I will type slowly so you can understand. Climate changes, it changes continuously, always has and always will. Humans are not causing it to change and humans can not stop it from changing. Your welcome.
You missed some more decimals
Well I was going to say 0.40°C / decade, but then I was worried someone would accuse me of deliberately exaggerating the rate of warming.
Silly…you need to get a thermometer that goes out 5 decimals…way more accurate 😉
I was worried someone would accuse me of deliberately exaggerating the rate of warming.
Is that a denial or an agreement that it is in fact cooling?
Global temperatures are cooler in 2021 than other recent years – Axios
“Why it matters: The lack of a new warmest year record blah blah blah.”
I’ve no idea what you are on about, but in my view the UAH data definitely shows no sign of cooling. Claiming that one year being cooler than the previous one is a sign of a cooling trend is to ignore all natural variability, in particular the fact that we have had a succession of El Niños and have had a La Niña this year.
Bingo, the more the merrier!
You do realize that what you are discussing is a representation of a periodic function, right? Trying to put a linear trend on a periodic function is scientific fraud. It can really only be described in terms of a time function with varying frequencies and phases. What does this mean? It means that our friend Monkton is simply playing your game and winning. It doesn’t mean that it has any more meaning than the drivel that climate scientists are generating.
Your position in the game is that CO2 causes temperature rise. Yet pauses are complications that you can not explain in terms of constant rising temperatures. I’ll give you a hint. Go back and plot ENSO indexes and corelate them with the rise of CO2 and temperature rise/fall. Use time series analysis assumptions and tools. Don’t just use simple averages and linear regression. You will be surprised at what you find.
“You do realize that what you are discussing is a representation of a periodic function, right?”
No I didn’t realize that. Could you define the periodic function and show what tests you use to establish that this function is the best fit.
“Trying to put a linear trend on a periodic function is scientific fraud.”
That’s nonsense, and offensive. Nobody should claim that a linear trend is necessarily correct, but it can be a reasonable first step. And in this case I’m only using the linear trend to establish the overall rate of change, not suggesting that it is the correct fit. Do you accuse Lord Monckton of “scientific fraud” when he so often draws a linear trend over the last 150 years or so of global temperature?
“It means that our friend Monkton is simply playing your game and winning.”
This sounds a lot like you are accusing Monckton of fraud, but saying it’s OK because he’s on your side.
“Your position in the game is that CO2 causes temperature rise.”
Not for the purposes of this “game”. All I’m arguing is that there is no evidence that anything stopped the overall warming in 2015. What caused that warming is another question.
“Yet pauses are complications that you can not explain in terms of constant rising temperatures.”
I think I can explain this pause very easily. There was a big El Niño in 2016 which caused a big spike in global temperatures. It’s pretty inevitable that if you start a trend just before than it will be negative or zero for a time, especially if you time frame is just a few years. It’s also likely that as in this case the trend will actually be warmer than the underlying trend. If you define that as a “pause” than that’s how I explain the pause.
“Go back and plot ENSO indexes and correlate them with the rise of CO2 and temperature rise/fall.”
I’ve done it before and I’m not sure what you think it will tell me. ENSO indices are by their nature flat therefore cannot explain long term warming. But they do explain one of the main reasons for short term fluctuations in temperature – hence the ability to find pauses.
Of course, anything I say will be rejected on the grounds that I’m not doing the correct time series analysis, so here’s a possibility; as you clearly know what you are talking about more than I do, why don’t you tell me what you think rather than giving me hints?
Yet you didn’t do what Mr. Gorman suggested:
I have seen the results elsewhere, it is quite revealing.
I didn’t do it because I’ve no idea what he’s hinting at and as I think he want’s me to use signal processing or something like that which is far out of my area of “expertise” I think it would be better if he explains what result he’s hinting at.
You didn’t even Google time series analysis did you? I don’t disagree that Fourier or wavelet analysis would be appropriate for making predictions/projections but time series analysis is appropriate for past data. It is not simple and has a lot of assumptions you must meet but it should be something familiar to a statistician or econometrics person.
This is getting silly. You make a cryptic claim, then expect me to prove it for you.
Not silly You are the one who will not take advice on proper analysis techniques. I’m not asking you to prove anything. I am telling you that all the linear regressions in the world concerning temperature is not ever, ever going to provide evidence of CO2 being the CONTROL KNOB of climate and temperature. The number of pauses while CO2 is climbing is evidence of that. No one has even shown a consistent time lag from CO2 rise to temperature rising. Again, the pauses destroy that.
Personally from evidence I have seen, I think ocean circulation, sun, and H2O have much more effect on low atmosphere temperature than everything. That’s my hypothesis, prove it wrong!
Your an expert on EE techniques, you know how to analyze a time series for periodic functions or what ever you want me to do – I’m not. You insist that if I do it I will discover some marvelous secret, but you won;t do it yourself and admit that the functions are not really periodic and you don;t know what they are. That’s what I call silly. Show me what the “proper analysis techniques” are, don’t expect me to take a course on electrical engineering just to prove you wrong.
Your should be You’re.
Typing far too much at the moment.
Not only EE’s use this math. Physicists, some mechanical engineers, and guess who else — meteorologists.
Google ‘Guide to Climatological Practices – WMO Library
Here is an excerpt:
“Time series in climatology have been analysed with a variety of techniques that decompose a series either into time domain or into frequency domain components. A critical assumption of these models is that of stationarity (when characteristics of the series such as mean and variance do not change over the length of the series). This condition is generally not met by climatological data even if the data are homogeneous (see 5.2). Gabor and wavelet analyses are extensions of the classical techniques of spectral analysis.”
DOYHW and take a course in digital signal processing.
It’s not my homework. I have no problem with the data and linear trends. If you want to persuade me that you have a better analysis that explains whether the pause is real or not you should show your working.
If you have no problem with linear trends on periodic functions then you will never be able to understand why people don’t believe what you’re selling.
Do what I said in another comment. How do varying amplitudes in periodic complex time varying phenomena affect trend lines?
Please explain the 18+ year pause. The guys writing the CliSciFi computer games can’t. Going from 10, 15 then 17 years, they still couldn’t explain a 18+ year pause.
Once your hypothesis is falsified, you should really go back and re-work the fundamentals. It is a testament to CliSciFi’s funding and ideological and political support that they won’t do it. Big Oil should have that much money and as many influential friends.
“That’s nonsense, and offensive. Nobody should claim that a linear trend is necessarily correct, but it can be a reasonable first step.”
It is *not* nonsense and it is not a reasonable first step. Any linear trend line of a periodic function is highly dependent on start and end points on the periodic functions. The trend line will cycle from positive to negative as you move along the periodic function, especially when you use a fixed, sliding interval.
And guess what it will describe, a sine or cosine function.
And before someone hits this, of course it won’t be a perfect one. That is the point. It is a combination of multiple, varying, periodic waves that are moving through time, i.e., coupled.
I’m sure if you add enough periodic functions together you can replicate the global temperature – but that’s the problem with over fitting, with enough degrees of freedom you can make a function do anything.
Are you denying all the periodic phenomena surrounding the earth have little effect compared to CO2? I can assure you that all these combining DO create climate like it or not.
If CO2 were the only factor, we would see continuous growth in temperature WITH NO PAUSE at all. It is up to you and other warmists advocating CO2 and GHG as being the only factor to show actual evidence. Pauses certainly don”t help your case.
I keep pointing out the dependence of the start point on the pause, and you insist it isn’t cherry picking, yet you call it fraud to look at the trend across the entire data set.
You say the trend line will fluctuate from positive to negative over the longer term, but how do you know if you insist that any global average temperature is useless?
I can’t give the functions primarily because sufficient science has not been done to determine what many of them are. An example is the sunspot cycles. Have you ever seen an accurate mathematical description of this phenomena? Yet it exists and has been known for hundreds of years. Yet denying that there are periodic time varying functions going on is to deny physical reality. The sun’s different cycles, ENSO, AMO, orbital, seasons, and on and on. You are trying to use linear statistics and regression to describe all these periodic functions along with the vast majority of climate scientists. It is all about what analysis tools they and you were trained on.
I have an EE degree, and we live and die with periodic functions and must learn vector calculus to manage Maxwell’s equations where not all engineering disciplines do. Fourier and wavelet analysis of complex periodic signals are a necessity.
When I went to school any physical science major had to learn at least some metrology in order to be prepared to work in certified labs where accurate and precise measurements are a legal requirement. Math majors never learned any of this and hardly ever are required to deal with it even today.
You really need to put down the linear math and start to think in terms of periodic phenomena and how to do more than trying to describe them in terms of trends. For a start, think about how varying AMPLITUDES of periodic functions might affect the trends that you see.
Let me try using just linear regression, then you can explain what other technique you want me to use.
Looking at monthly UAH6 data and comparing it to log2 of CO2 I get a statistically significant estimate suggesting the anomaly is rising at 1.9°C per doubling of CO2. The r^2 value is 0.47.
So next I factor in a linear regression for the ENSO index. I found the best fir is with a lag of 5 months.This increases the r^2 to 0.60, and increases the estimate for temperature increase per doubling of CO2 to 2.1°C.
It certainly doesn’t explain all the variation and the response to high ENSO could be stronger but it does show how the temperature rise will produce pauses even as CO2 rises.
In fact if I just use the predicted value from CO2 and ENSO I get a pause that starts in April 2014.
Good work.
Good nose browning
Why do periodic functions with differing and varying frequencies and phases combine into a resulting moving, periodic waveform that is unpredictable?
Trying to trend this with linear functions like averages and regressions is a waste of good computer time. If you want to know what is happening you need to show some time varying functional relationships that adequately define pauses and rising/falling trends.
Otherwise asking folks to explain short trends is fruitless. That is why folks ask you to explain how CO2 fails to increase temps.
I’m not sure I can explain how CO2 fails to increase temps when I see no evidence that it has failed to do that. By and large CO2 has increased and temperatures have increased. That doesn’t prove that CO2 caused any of the warming, but it certainly doesn’t disprove it. If by failing, you mean fails to be the only reason for temperature changes, then that’s a straw man argument as I’ve never suggested it is the only cause.
You really don;t need to show why every fluctuation to the short term trend happened in order to see that there is a longer term rise that cannot be explained by these short term changes.
Why did global temperatures fall between 1940 and 1980 at a time when CO2 concentrations were rising rapidly?
Sun blocking aerosol pollution, mostly sulfur from fossils.
Now you are arguing that humans can vary the amount of solar irradiation reaching the ground by burning fossil fuels and that it overcomes the effect of additional CO2.
That means if humans want a cooler world, we need to burn more dirty coal.
[stop with the ad homs all around please-charles]
But that would be a temporary effect. It eventually gets precipitated out, unlike CO2.
Yes and no because, well, the effect had started to fade by the late 70s before the clean air acts were introduced. CO2 was “stronger”. And sulfur is a shitty thing, acid rains were a big big concern at that time.
China and other developing countries’ industries doesn’t produce sulfur pollution?
Aerosols were just used to moderate CliSciFi model hindcasts so they could maintain high ECSs.
Aerosol forcing was about -0.7 W/m2 between 1940 and 1980.
CO2 forcing was about +0.5 W/m2 between 1940 and 1980.
You are ignoring the warming from the Little Ice Age, the cooling trend in the mid-20th century, and pauses that have occurred since. These all falsify the GHG theory of CO2 being THE CONTROL KNOB as you are attempting to show. Correlations won’t suffice in face of the real physical evidence I have pointed out. In fact you need to prove we are not simply on the way to another Holocene Optimum temperature level thru natural variation.
I was asked specifically about the early 2st century and when I try to explain that I’m attacked for not including the little ice age.
You know what, it is up to to identify all aspects of what you are being asked about. Otherwise you are just playing the part of one of the blind men trying to figure out what they are feeling.
The null hypothesis is that what we are seeing is still natural variation. Pauses show that is still the case.
Nope. The null-hypothesis is that there is no correlation between CO2 and temperature.
That 0.006 degs has really got me worried……
HadCRUT Data Set
1) The errors placed on this data set are suppose to be within 0.1c.
2) Adjustments with new versions have always made the data set warmer.
3) They are increasingly cooling the distant past to match the GISS.
4) Uniqueness in adjusted data has been lost and are adjusted to match other surface datasets.
5) Changes larger than the suppose error range are deliberate and are actually not in error.
6) Warming the present and cooling the past is delibrate to exaggerate the trend.
7) Previous El Nino peaks are delibrately gradually cooled to make future strong El Nino’s appear they are at least equal.
8) So called equal changes in cooling or warming are nonsense when there are concentrated in precise times to perfectly adjust them to fit the motive.
9) It has become more a play toy for promoting climate change alarmism.
Global Temperature Pauses
1) Occur about every 17 years after a strong El Nino.
2) Using reliable data sets there is no warming until the strong El Nino initiates it.
3) Seem to be related to the sun cycle where on an average 11 years takes around 17 years to appear on a global scale through the ocean and atmsosphere.
4) These 17 years periods hugely depend on albedo especially clouds, sea ice and snow cover.
5) Any change in the energy equilibirum on 4) will be reflected on the next strong El Nino wave that takes years to slowly reduce.
6) The WFT link below show 3 phases of this cooling after a strong El Nino and occurs for roughly 16 years.
7) The volcanic eruption cooled global temepratures back in 1982/3 reducing what should had been a strong El Nino peak. (Purple line reflecting what it should had been like in WFT link)
8) These pauses are increasingly trying to be adjusted out by the dishonest surface data sets trying to match the CO2 trend.
The surface datasets have been adjusted that much they are no use in determining behaviours in the planet’s climate system through history.
https://www.woodfortrees.org/plot/uah6/from:1983/to:1997.5/plot/uah6/from:1997.5/to:2015.6/plot/uah6/from:2015.6/plot/uah6/from:1983/to:1983.2/offset:0.5
Oh no! It is worse than we thought! The climate change data are not changing the climate. The stability of climate is just not fair. Can’t wait for the climate alarmists to try and claim volcano activity is caused by human induced atmospheric CO2.
Don’t think they won’t try. 🙂
As much as I enjoy seeing greentards taking it in the teeth cooling is not actual what we should be cheering. Unless you are like me and enjoy long, snowy winters. Real toss up here.
Here’s the usual graph showing the pause in context, along with estimated uncertainties.
Newer data, higher uncertainities ?
Smaller sample means higher uncertainties.
Possibly, but not inevitably!
I was taught “Fewer data (/ samples) => Larger (/ wider) uncertainties” …
Are you using a non-QWERTY keyboard with the “n” and “f” keys next to each other ?
SUNMOD! Ad hom detected! Everyone knows Krishna is German, and we understand well what he wants to say.
[I’m trying to cool off the temperature and slow things down. Let’s stop with the insults. I’ve told Sunmod to back off as well~charles]
Thx. But I’m still under moderator oversight.
I hesitated before responding to this, as anything I write is likely to be “misunderstood / misinterpreted”, but …
There are almost 8 billion people on Earth today.
I am one of those who did not know that “Krishna [Hans] is German”.
Note also that I have committed more than my fair share of “fat-fingered typing mistakes” in the past.
No negative connotations were intended.
Conjecture : The “detection” issue is with the person doing the “detecting”, not with the text being scanned.
Ad-hom logical fallacy outline
1) Person X is [insert “Bad Thing” here] …
2) … AND THEREFORE person X “must be” wrong
– – – – –
PS (to moderators) : If you decide this post is “inflammatory” at this point in time I have no problems whatsoever with you deleting it.
“Your house, your rules” and all that …
And still way smaller than reality…
Probably, it was just a ball park attempt to show a realistic range of uncertainty. The Skeptical Science Trend Calculator gives a slightly higher uncertainty value. The real question is why Lord Monckton doesn’t show any uncertainty in his pause, despite his claim that it starts in one specific month.
You still don’t get it.
One of doesn’t get it. You’ll have to tell my what “it” is before I can figure out who.
Now a true “pause” would have the elevated broken off “pause” part join the end of the LT trend and take it lower.
As it stands it’s a “pause” that shows continued LT warming.
Nice try. You don’t get to decide what a “true pause” is, or what it shows.
“You don’t get to decide what a “true pause” is, or what it shows.”
If you don’t think that a “pause” is when a rising trend slows or stops then what do you think a pause means.
No, really.
Do tell?
Monckton’s pause is adding to the long-term trend.
Do the graphing yourself on woodfortrees.
Thank you for proving my point. Moron.
“Now a true “pause”
Would mean at the very least that it isn’t getting any warmer. But it’s, er, worse than you thought; 2021 has been substantially cooler than 2020 and this is a real problem for the ’cause’
“Why it matters: The lack of a new warmest year record in 2021 could sap some of the sense of urgency among policymakers in the U.S. and abroad during a critical year for enacting stricter emissions cuts to meet the Paris Agreement’s targets.”
Global temperatures are cooler in 2021 than other recent years – Axios
It’s a PR problem for your side of the argument. Maybe that’s why we’ve heard a lot of that global warming causes cold, lately.
-1
Boom!
indeed!
Nice sashay to the side of my point fret !..
My point is that to say this continuing Monckton bunkum is just that and there is no “pause”.
Because it is at a higher level than the LT linear trend extrapolation.
While his “pause” goes on it is actually increasing.
Is that really so hard to comprehend?
Sorry about that.
But sometimes our heroes have feet of clay.
The pause could be 30 – 40 – 50 years long but so long as the current end point temperature remains above the arbitrary start point (end of the 1970’s cooling period – ala the hyped “ICE Age Cometh” era) the overall trend line will show warming regardless. But with no continued warming increase the overall trend value will decrease slightly when extrapolating out to the century mark. Deg C/Century.
Prove the warming isn’t natural.
Oh yeah, you can’t.
No it never can on here because there is always the spectre of doubt.
And we cannot put an Earth in a lab to experiment with.
That the science is unequivocal that the causation in manmade can’t be provided with the kind of evidence that is required here.
Not because denizens are cognisant of it or of science in general often.
But it is abhorrent to their ideological stance and self-identity in belonging to a certain grouping.
I cant help you with either of those.
And neither can the science.
Don’t worry though you are just a denizen of a motivated Blog and it matters not a jot to climate scientists what denizens think.
Neither do you matter to me, as I am well aware that denizens here will never change their minds.
Even if they do we will never know.
As there will be some who will play the violin even while the “Titanic sinks”.
Allow me to repair your first statements into something resembling truth in facts
October 2, 2021 10:49 am
No it never can on here because there is always the
spectre ofjustification for doubt.And we cannot put an Earth in a lab to experiment
with.That the science is unequivocal that the causation in manmade can’t be provided with the kind of evidence that is
required hereavailable.If it were possible to prove causation anyplace, the Merchants of Fear wouldn’t have to try so hard to find new ways to scare everyone
“That the science is unequivocal that the causation in manmade can’t be provided with the kind of evidence that is required here.”
So the alarmists have no proof that our emissions of plant food control the climate. Glad we agree. Now, why are you worrying?
“Neither do you matter to me”
Are you sure you’re not my wife’?
So in essence you are trumpeting the application of the Precautionary Principle as it relates to the possibility (and only the possibility) of CO2 being THE CONTROL KNOB for an increase in temperature.
What you are recommending is NOT using the same Precautionary Principle to mediate the beginning of the next, inevitable glaciation. Either that or you don’t believe another glaciation is in the cards for the planet. I tend to believe that any cooling at this point in time of the current interglacial could be the harbinger of the beginning of another glaciation – prove me wrong.
“Oh yeah, you can’t.”
It never hurts to keep pointing out that there is no evidence. 🙂
The alarmists are just guessing as to whether the warmth is caused by Mother Nature or CO2.
Good scientists and logical thinkers should always assume Mother Nature is controlling the Earth’s temperatures until proven otherwise.
I don’t have access to an application that can produce graphs like that.
Please could you add the “old pause” (May 1997 to December 2015, 224 months) to yours, to make comparisons with the “new (81-month) pause” easier ?
Something like the following, but with “error ranges / confidence intervals” ?
Without the major 1982 volcanic eruption, there would have been an El Nino spike, leading to a pause between then and 1997 or 1998.
Hmmmmmmmmmm …
The best I can manage is Nov. 1986 to Nov. 1997 (133 months).
Even accounting for “El Chichon cancels El Nino” am I missing “a trick” here ?
There would have been an El Nino-driven temperature spike circa 1982 without the volcanic eruption.
I tend to “get” pictures more easily than words, so after generating the following graph I “see” what you meant more clearly now.
Without El Chichon UAH may well have peaked above +0.5 in 1983, which would certainly have pushed back the start date for my “Pause 0”.
Thanks for the graphing, Mark. And I still maintain that a 0.14 C/decade trend during the warming part of an approximate 70 year cycle is no reason for speculating about a climate crisis.
Uh, your trend-graphing skills missed the step-up in 1997 and the subsequent 18+ year pause. I’m sure it was just an oversight that showed the overall trend to be linear.
Here you go. Not sure how you think that makes it look better.
Without the 1982 volcanic eruption masking an El Nino, the El Nino-driven step-ups would be even more obvious. CO2 feedbacks are supposed to be fast-acting; a linear temperature response.
Of your first 36-year trend, the 18+ year pause covered over half of its duration. Of the overall 42-year trend, the 18+ year pause occupied about 44 percent of its duration.
Are you seriously telling me that a flat trend that covers 44% to 50% of an overall trend is not significant? That such a relatively lengthily pause would not disprove CO2 causation of the overall trend?
Show your work. Handwaving not allowed.
I gave you the confidence intervals, I gave you a link to the trend calculator. You make some vague comment about the percentage of the supposed pause and say it must mean it was significant, then accuse me of hand waving.
You’re the one claiming it’s significant and proves that CO2 does not cause warming. Maybe you could show me your workings.
The 1998 and 2015 flat steps ups lines up with El-Nino phase very well.
CliSciFi baldly assert that CO2 and its feedbacks are fast acting. If they don’t act for over 18 years, there is something seriously wrong with the theory.
It’s not a question of how fast anything is acting, it’s a question of what the rate of warming is compared with other variation. UAH is warming at 0.013°C / year from whatever is cause, say CO2 for the sake of argument. But if there are yearly fluctuations, say caused by ENSO, can be 0.2° or higher, then there’s a chance any linear warming is lost in the noise, for a few years or possibly a couple of decades.
Bellman, if your point is that a linear trend of CO2-induced warming can be hidden in the “noise,” then the 18+ year pause has a whole war’s worth of noise. If that was not your point, please advise us as to your intended point.
Anyway, even for “the sake of argument” I won’t agree that the minor UAH6 trend is primarily driven by CO2. The theoretical energy impacts of a doubling of atmospheric concentrations is so minor as to be unmeasurable in light of the massive energy flows into, around and out of the Earth’s climatic system.
Again temp changes ARE NOT NOISE. What exactly are you trending?
It sure looks like temperature. How exactly can temperatures be noise? Are you sure they are not just pints of widening variance?
As I’m sure I’ve explained to you before, noise refers to the error term, the fact that individual monthly anomalies do not exactly fall on the trend line.
Religions are (primitive) strange things. The Bible (peer reviewed at Nicea) got there first on environmentalism
Genesis 8:22 – While the earth remaineth, seedtime and harvest, and cold and heat, and summer and winter, and day and night shall not cease.
Climate and seasons etc will change. This is the natural order of things. But then…
Isaiah 24:5-6 – The earth also is defiled under the inhabitants thereof; because they have transgressed the laws, changed the ordinance, broken the everlasting covenant.
Jeremiah 2:7 – And I brought you into a plentiful country, to eat the fruit thereof and the goodness thereof; but when ye entered, ye defiled my land, and made mine heritage an abomination.
Luke 21:11 – And great earthquakes shall be in divers places, and famines, and pestilences; and fearful sights and great signs shall there be from heaven.
Revelation 16:8-9 – And the fourth angel poured out his vial upon the sun; and power was given unto him to scorch men with fire.
There ain’t much new under the Sun.
Never had you down as a Bible Thumper Fret.
Being well-read is a positive in everybody, even an atheist like me.
One of the beauties of the New Pause is how ferociously the Warmunist trolls try to attack it, pretending to misunderstand what it means, because deep down they know that it threatens their Warmunist ideology. Hilarious.
Maybe it’s the practice they’ve had with all the hundreds of other 6-year 9-month ‘pauses’ in the UAH data set that has phased the warmunists?
Does that include the 18+ year pause between 1997 and 2015? That is about 44% of the entire 42+ years of UAH6 coverage. Does that support the contention that CO2 affects global temperatures on all timescales, that it and its its feedbacks operate in real time?
Starring at temperature records will not tell you what causes the warming. People do not realize how pathetic such “empiric evidence” is. After all temperatures can only go two ways – up or down, and the fact they go up repesents a 50:50 chance, like flipping a coin.
Could there be a different cause? How about quoting NASA..
https://www.nasa.gov/centers/langley/news/releases/2004/04-140.html
The attenuation the quote includes is easy to dismiss. If contrails should explain ALL warming, there will be nothing left for GHGs, period. But there is a lot more to this than the article and the underlying paper dare to say.
Really there is no need to speculate IF contrails increased, or whether cirrus coverage has grown. Logically both has to be true, and is true based on (more recent) empiric data. Next we need to consider temperatures top of the troposphere are about 220K, black body emissions only about 130W/m2. Moving the emission layer to this altitude, even by only a small fraction of 1 or 2 percent, must cause a significant forcing. And certainly a forcing hundreds of times larger than the 0.01W/m2 the IPCC claims for “linear” contrails.
On the other side we know CO2 can not be responsible, as ECS estimates are all based on erroneous assumptions, that is excluding overlaps and (real) surface emissivity. Once they are allowed for, 2xCO2 forcing halves and vapor feedback actually turns negative (as to be shown).
https://greenhousedefect.com/the-holy-grail-of-ecs/the-2xco2-forcing-disaster
https://greenhousedefect.com/basic-greenhouse-defects/vapor-the-big-misunderstood
Not quite. That’s where significance testing comes in. If it was truly a 50:50 chance over time, then it would be highly unlikely for there to be a statistically significant trend one way or the other. But there is. In every global temperature data set we have, be it surface or satellite, there just is.
The chances of this happening randomly, in a system where warming or cooling is equally likely, is vanishingly small.
Who said temperatures were moving randomly? To our knowledge there is no random, just systems to complex to know all the variables. In the past there have been well documented warming and cooling trends lasting for decades or centuries. The question is what caused them (likely the sun), there is no question however that it was NOT CO2.
With the now about 50 year warming trend the facts are clear; it is not CO2, but contrails.
Global temperature fluctuates naturally. Since the end of the LIA, Earth has warmed by two steps higher and one step lower, just as during prior such secular warming trends, with cycles within them.
Reading this article I became aware of something that I would like to share.
That something is the nature of “the pause“. It seems to be understood by the climatists as a new force of nature that no one was aware of before the first years of the current century.
I reached that conclusion because in the discourse of the proponents of that “concept”, it seems to be something over and above the other forces of nature. They think, and claim, that humans can “control” the climate, at the same time they seem to be incapable of explaining what is “the pause“, how it works, and, most interesting, they seem to believe that, in contrats to the other forces of nature, humans are incapable, have no means, to control “the pause“, making it disappear, as it seems that it is what they hope for.
A force of such characteristics is what long ago scientists and philosophers call a metaphysical (some say “supernatural”) principle. And it is called “principle” because it does not need to be demonstrated, it is not needed to describe its origin and cause, it does not need to be explained.
A few centuries ago, a well known alchemist has advised, most cautiously, “Physics, beware of metaphysics!” (so is said, but not true; he wrote something close to but not exactly that). Thus, even well learned and experienced alchemists know that the invention of some “force” to try to explain what we do not know is not fair play, not reasonable, and may be dangerous…
Forgive me if I went somewhat off-topic, you know, old age and arteriosclerosis… but I think that this point deserves some further analysis.
“Why does these long Pauses matter?”
Another reason might be because each “pause” slightly lowers the overall trend, do they not?
Except that so far every pause has increased the overall trend.
UAH from 1979 to 1998 was 0.09 ± 0.16°C / decade
from 1979 to 2015 was 0.11 ± 0.06°C / decade
from 1979 to present is 0.14 ± 0.05°C / decade
What makes you (or your sources) believe that the already grotesquely small admitted uncertainty of “+/- 0.16°C/decade” has been reduced by a factor of three recently? AFAIK most, or all, of the daily measurements are still in whole degrees, and those that are not give one decimal digit. Anything calculated from such data will have (if averaging is part of the game) a theoretical infinite number of decimal figures, but at most one of them can be significant, and the margin of error can only be that of the measurements that go into it: With a majority of the data being in whole degrees, that’s always +/- 0.5°C. No way around it.
So your figures above should read: 0.1 +/- 0.5°C per decade for any of the three timeframes given. If we give the benefit of the doubt to most of the measurements carrying one significant decimal figure, it’s 0.1 +/- 0.1°C. Nothing to see here, move on….
So the trend is miniscule.
I dare you to notice a change of 0.14 degs if you were stood in the street.
It’s laughable.
It is miniscule to the eye of of a human during part of his/her lifetime – yet Nature can and has taken note with changes.
Please demonstrate a period this side of the end of the last IA when there has been a comparable rate of warming.
You are aware that we are talking of deltaT that should be happening over hundreds/thousands of years were it due to NV.?
Please demonstrate that this miniscule temp increase isn’t natural. Oh yeah, you can’t.
Forgive me if I refuse to get worried about a little bit of warmth.
Paleo temperature reconstructions have a temporal resolution of decades. They are not comparable to modern thermometers temporal resolutions. One cannot compare paleo to thermometer rates of temperature change. Modern temperatures are consistent with past temperature estimates over the Holocene, including as late as the Medieval Warm Period.
Anyway, late 19th and early 20th Century warming rates were the same as the late 20th Century warming that got everybody so worked-up.
The trend will reverse. It’s ludicrous to imagine that the Modern Warming will last longer than previous such trends in the Holocene and prior interglacials and interstadials during glacial intervals.
Endless extrapolation is absurd.
Looking at the complete picture it is slightly more nuanced than that …
The venerable Skeptical Science Escalator retains it’s relevance…
https://skepticalscience.com/escalator
Proof that CO2 only affects temperatures when it wants to.
What was going on before 1970? Also, what did the 1910 to 1945 “step graph” show? The warming rates then were the same as the late 20th Century’s.
“What was going on before 1970”.
It was up and down. Not just up. There is no comparable 40-50 year old period.
But I hope you get the actual point here. For the post aerosol era, the trend is indisputable. The ENSO events don’t create or lose the earths energy. They merely move that energy between the oceans and the atmosphere cyclically. But since 1970, each is higher than the last, as are the inter ENSO periods. These are the Escalator “steps”.
If only Bigoilbob were not so handsomely paid to troll here, he would realize that there was indeed warming during a half-century period at the beginning of the 20th century, and that that warming was strikingly similar to the recent warming period. Professor Lindzen often displays the two charts side by side in his talks and asks people to say which is the more recent: they are virtually indistinguishable.
“If only Bigoilbob were not so handsomely paid to troll here..”
We both wish that were true. Me, because I like money. You, because you could then credibly imagine that WUWT is consequential enough to justify it…
“ENSO events don’t create or lose the earths energy”
It certainly doesn’t “create energy”. But I am confused as to why you think warm water doesn’t cool thereby heating the atmosphere.
I am confused on why you would think that I would think that. You stop thinking when your prejudgments have been met. What is adding heat to the water at a much higher modern rate in the 1st place? Geo heat? Sorry/not sorry. We occasionally find sources of it that we did not know about before, but no significant NEW sources.
You didn’t address the issue. Does the ocean cool by evaporation thereby heating the atmosphere? You were the one that said ENSO doesn’t doesn’t lose the Earth’s energy.
“Does the ocean cool by evaporation thereby heating the atmosphere? You were the one that said ENSO doesn’t doesn’t lose the Earth’s energy.”
Whenever the atmosphere is undersaturated, it does. But whether it does or not, since the oceans and the atmosphere are parts of the earth, the earth does not lose energy from ENSO events. But feel free to share with us the paths of this loss/gain.
BTW, you lost your way. You still owe me the 2 answers from my response to your last post. I suppose you’re just deflecting to avoid answering them.
You’re channeling that Disney fish with near instant memory loss, voiced by Ellen deGeneres? Need to aks the g’kids her name….
Does water vapor carry latent heat upward and release it at altitude?
Why is water vapor considered the largest GHG?
As to your questions. I answer the ones that I feel are worthwhile. Guess what?
“Does water vapor carry latent heat upward and release it at altitude?
Why is water vapor considered the largest GHG?”
Whatever you think about the net effect of water as a GHG, carrying “latent heat upward and release it at altitude?” is not part of it. Where do you get this nonsense?
https://www.acs.org/content/acs/en/climatescience/climatesciencenarratives/its-water-vapor-not-the-co2.html
And per your other fact free ranting on ENSO, let’s inject a few actual facts:
https://www.climate.gov/news-features/understanding-climate/el-ni%C3%B1o-and-la-ni%C3%B1a-frequently-asked-questions
“All of this amounts to a shuffling of heat from one place (ocean) to another (the atmosphere) without affecting the Earth’s overall energy budget—the balance between incoming and outgoing energy across the entire planet.”
Finally, love the convenient, circus logic of “As to your questions. I answer the ones that I feel are worthwhile.”. Interesting how closely the “worthless” questions parallel those for which you have no cogent answer. You even lost the other Gorman on those yesterday….
“Whatever you think about the net effect of water as a GHG, carrying “latent heat upward and release it at altitude?” is not part of it. Where do you get this nonsense?”
You are joking right? Water vapor is the largest GHG by a long shot. You also should understand that latent heat does not raise the temperature until it is released by turning into water droplets, i.e., clouds or rain.
CO2 only works when it wants to? I was told by CliSciFi practitioners CO2’s radiative properties act instantly in the atmosphere, with feedbacks following quickly.
Bob Tisdale Climate Observations blog made a couple of posts showing the defects of the SKS Escalator animation:
SkepticalScience Misrepresents Their Animation “The Escalator”
and,
SkepticalScience Needs to Update their Escalator
Enjoy!
The trend lines can be qualitatively replicated using ENSO and inner ENSO data. The point remains the same, and is “bogusity” free….
You completely missed the point of the two links which are related.
The observed step up warming lines up with the El-Nino phases very well, then the rapid cool down comes afterwards but the step up persists because it is a statistical construct.
The only true step up warming events since 1979 comes when there is a large El-Nino phase
Since ENSO events do not create or lose energy, this interpretation is not valid outside of your eyelids. But feel free to post any above ground research that supports it…
Did you bother to look at the charts in the link?
Never disputed that “Since ENSO events do not create or lose energy….” but that isn’t what is being covered here which is about the TIMING of the El-Nino phase lining up with sudden large warming in the atmosphere, the relationship is obvious…., there is no other phenomenon that causes it.
Look at how many ENSO events have occurred since 1980. Not any ” sudden large warming in the atmosphere” but multiple steps. I.e., an “Escalator”.
https://ds.data.jma.go.jp/tcc/tcc/products/elnino/ensoevents.html
They are all characterized by a relatively flat period, followed by “sudden” rises. This is the essence of cyclicity and has nothing to do with this unexplained attribution of those ENSO events to the overall warming. AGAIN, you have NO explanation for how ENSO events CAUSE the warming. OTOH, AGW explains it both well and exclusively..
The most obvious explanation for the sharp El Ninos is increased subocean volcanic activity. That may have caused a great deal of warming: there are 3.5 million subsea volcanoes, many of them active, particularly in the suboceanic ridges that meet slap bang in the middle of the Nino 1-2 region, and where tectonic divergence is measured to be occurring at ten times the global mean rate. The midocean ridge in the Nino 1-2 region ought to be but is not closely monitored. But the subsea-volcanism explanation, which has been much studied by Professor Viterito in a series of papers, is no less plausible, and no less well evidenced, than the CO2 explanation.
The direct output of heat by mankind should also be taken into account. Likewise, on some (but not all) solar datasets there was a solar grand maximum in recent decades (see e.g. Hathaway 2004); and, as Connolly et al. (2021) have recently pointed out, it is possible that as much as all of the recent warming is of solar origin.
To declare that the sole cause of warming must be anthropogenic sins of emission, as Bigoilbob does, is to make a statement not of science but of faith in the climate-Communist Party Line, which has been proven wrong on just about everything.
“To declare that the sole cause of warming must be anthropogenic…”
You have ventured into the Foxian/fauxian realm that Al Franken describes as “Just making **** up”. I.e., more words put into my mouth. Please point to where I ever said or inferred such a thing…
“The most obvious explanation for the sharp El Ninos is increased subocean volcanic activity.”
Evidence for the recent change in this activity required? FYI, discoveries of heretofore undetected plumes is DIFFERENT than the discovery of enough NEW activity to validate your claim. Once again, the Chris Hitchens rule, so ignored in these fora:
“That which can be asserted without evidence can be dismissed without evidence”
Bigoilbob knows no more about architecture than about climate science. If, on a staircase, the run is longer than the rise, the overall slope is small – exactly as it is in the climate. And the fact that the big rises are attributable not to us but to a recent spate of strong el Ninos, which are of natural origin, suggests – to say the least – a complication of the climate-Communist theory that We Are All Guilty.
How do you determine that the runs are longer than the rises? In a real staircase both are length measurement and so comparable. In the pause staircase the runs are measured in time and the rises in degrees, so not comparable.
A trivial truth. A pause at the high end of a trend will increase the trend average. Conversely, a pause at the beginning would decrease the trend average.
It does not explain the the 18+year pause (1997 to 2015). How was it that CO2’s impact on temperatures was “suspended” for that long of a period of time?
Where’s your evidence that CO2 couldn’t have caused warming during the Great Pause?
CO2 didn’t cause warming during the Great Pause. It was a Pause. There was no warming.
Lord Monckton should look up his explanations of the “end-point” fallacy, where it is shown that linear trends can be misleading and contradictory depending on the choice of start and end points.
To illustrate this consider the UAH trend from 1998 to 2016 where the trend is less than zero, i.e. the Great Pause. So by the logic of the above comment, “there was no warming”.
Now consider the trend from the start of that pause 1998 up to the present day. That’s 0.11°C / decade, which means, assuming you can trust linear trend lines, that there has been around 0.24°C warming since 1998. Logically that must all have happened since the end of the Great Pause, between 2016 and today.
But you can also start a trend from the start of 2015 to today showing zero trend, and so by the above logic there was no warming since 2015.
Which leaves with a paradox. When did this 0.24°C of warming occur? It couldn’t have been after the Great Pause, and it couldn’t have been before the New Pause, but there is no month between 1998 and today that wasn’t in one or other, or both, of those pauses.
You are argung like a schoolboy. If the slope of a line between to points is zero there is no change. Whether it is 2 hours, days, months, or years. That is a pause any way you look at.
You spend all this time arguing about uncertainty, but now say you can be sure there is no change based on two data points.
You complain about my argument style, but make no attempt to address the argument. If there are two overlapping periods of no change, where does the 0.24°C change happen?
The line can be at the top of the uncertainty range or the bottom or anywhere in the middle. If the slope is zero, there is no change in the dependent variable!
If you want to discuss a line within the uncertainty interval that has a slope unequal to zero, go ahead. Just realize that neither you or anyone else can definitively say it is the correct one!
CO2’s impact on temperature wasn’t suspended. CO2 is but one among many agents that modulate atmospheric temperature. Temperature changes are dictated by the net effect of all agents working together.
But if that is the case why are we stopping burning fossil fuels? Why are we going to destroy economies and spend trillions based on CO2 if it is only one of many things. How do you know one of the other things won’t cause worse heating (or God forbid) worse cooling?
The mathematically-challenged Bellman is being overpaid to troll here. A serious mathematician would know that if one replaces the predicted uptrend with an actual pause the warming will be a lot less than predicted, because the overall trend is less than predicted.
I said nothing about predictions. I’m showing the two pauses caused an increase in the overall warming trend.
Thank you, Lord Monckton!
One would think that anyone with a well-functioning mind would notice the frequency of sharp rises in temperature just prior to step declines into glacial periods! Of course, the ice core data show that those warming trends were much hotter than the current Modern Climate Optimum! Maybe those that wrap themselves in the infallibility of Climastrological beliefs have difficulty explaining these data, so they just ignore them; just as wannabe elites ignore the plebes!
Which one will be first into the batter’s box?
I have another question for the author:
“Almost 20% of the warming imagined in the HadCRUT5 dataset arises from ex-post-facto adjustments (whether justified or not) to the previously-estimated temperature record.”
Why not use HadCRUT5 data in your headline graphs in this day and age? Are the “ex-post-facto adjustments” you refer to justified? Or not?
Bill
Pretty sure HadCRUT5 also introduced new station data to better represent the Arctic. So not all due to adjustments of previous estimates.
Pretty sure Lord M knows this. If not, he should.
He should indeed!
In which case perhaps he would be good enough to answer my question?
One of the big differences is that V5 uses a kriging-like technique for grid cell infilling. V4 left sparsely observed grid cells unfilled. When doing a spatial average of the grid and projecting the value globally this effectively causes the unfilled cells to inherit the behavior of the filled cells. This results in a substantial cool bias since the unfilled cells are in regions that are warming faster than the filled cells.
So you’re suggesting that Christopher prefers to plot temperature metrics that exhibit a “a substantial cool bias“?
Why would he want to do that one wonders?
There are no infilling problems with the satellite temperature data, which is why I headline them.
Go to the HadCRUT5 “data download page :
https://www.metoffice.gov.uk/hadobs/hadcrut5/data/current/download.html
At the top you will find the following :
That second link takes you halfway down the same page to the “HadCRUT.5.0.1.0 Non-infilled data” version.
As I understand it the “analysis / Infilled” version is supposed to (eventually ?) replace the Cowtan & Way — AKA “kriged HadCRUT4” — reconstruction, while the “Non-infilled” version is the direct replacement for HadCRUT4.
Note that Kevin Cowtan updated the “official” C&W dataset to June 2021 sometime in late-August or early-September.
Direct link : https://www-users.york.ac.uk/~kdc3/papers/coverage2013/series.html, then scroll down to the “HadCRUT4 infilled by kriging … Global mean/uncertainty: monthly, annual.” section.
Saying “HadCRUT5” on its own is meaningless !
“HadCRUT5 (Infilled)” can be used for comparison purposes with C&W (and GISS, and NCEI, and BEST, and …).
“HadCRUT5 (Non-infilled)” can be used for comparison purposes with HadCRUT4.
NB : IMHO satellite (TLT) datasets, e.g. from UAH and RSS, are a special case and can be compared with the surface datasets, but caution should be applied in copious amounts when doing so.
The difference between “The Pause” (in the satellite datasets from ~1997 to ~2015) and “The Hiatus / Slowdown” (in the surface datasets from ~2001 to ~2013/4) is an obvious example of this.
I first looked at the “Infilled minus C&W” and “Non-infilled minus HC4” deltas in January, when the first versions of HC5 (to December 2020) were made available.
Updating that spreadsheet (to June/August 2021) produced the following graph.
Note that the range on the Y-axis is only +/- 0.1°C or so.
That is really interesting. Help me out with the interpretation here. Because “Non-Inf – HC4” is so similar to “Infilled – C&W” does that mean the HC5 infilling isn’t really having that big of an effect meaning that it is likely the other HC5 changes that caused the biggest changes?
I added the “Infilled – Non-infilled” (orange) line to my graph to check the effects of infilling (originally HC4 –> C&W, now HC5_Non-infilled –> HC5_Infilled) in isolation, and just how “big of an effect” it had on the final result.
It is much more of a “white noise” line that the blue and teal “HC5 – C&W / HC4” lines, which have a definite, and similar, “motif” to them.
Whatever the reasons for the changes when going from “HC4 + C&W” to “the two versions of HC5”, they are very similar to each other.
The underlying additions made by the old “kriging” and new “infilling” algorithms, however, appear more “random”.
The “Ignore data gaps –> Infilled” changes do have an overall amplitude that is comparable to the “Old –> New” changes though.
Thank you. I believe I understand what you are saying. That is pretty interesting indeed.
I am sticking to HadCRUT4 because it remains compatible with the previous postings in the series, and because, although tampered with, it is less tampered with than hadCRUT5, and because until very recently HadCRUT5 wasn’t being updated monthly, and because the wretches at the “University” of East Anglia have failed to keep the data in the same format as before, and I am too busy with other projects at present to do the necessary reprogramming.
The previous hiatus discussion went haywire. I suspect this one will too.
The smarty pants alarmists just spew forth more hogwash.
https://www.quora.com/Have-climate-change-deniers-finally-accepted-that-the-pause-never-happened-One-never-hears-them-mention-it-these-days
How is pointing out that 81-moth periods of cooling or non-warming in UAH are about as common as pebbles on a beach hogwash?
You can check these things out for yourself. You’re a skeptic, right?
The 18+ year pause? Your explanation? The CliSciFi practitioners’ many attempts failed, so their enablers just memory-holed the subject. All of their conflicting excuses for the 18+ year pause was confusing the sheep.
TheFinalNail, who is paid to troll here, does not seem to – or, perhaps wish to – acknowledge that since there was a previous Pause of nearly 19 years, within that Pause and its environs there were of course many 81-month periods with little or no trend.
An objective scientific observer would realize that frequent and long periods with little or no warming indicate that the Earth is very close to radiative balance, which is why there has been so much less warming than IPCC had originally predicted in 1990.
There have also been 81 month periods when the rate of warming has been over 0.8°C / decade. There have also been 81 month periods which saw cooling at over 0.4°C / decade.
Who cares? Now, a 0.14 C/decade warming trend on the warming side of an approximately 70-year cycle is not in any way alarming.
The person who thinks that it’s revealing there are many 8 month zero trends in the data, should care.
Again, who cares? I suspect what removing a G-string might reveal. Other than that, you will have to explain your “revealing.”
About as long as the pause between El Ninos.
https://rclutz.com/2021/05/08/adios-global-warming/
Don’t worry, Hadcrut5 seems to have erased the last pause from existence, once they hear that there is a new pause, they will resume their tinkering and erase it too.
Oceans take decades to dissipate thermal energy. Continents can dissipate most of their thermal energy annually. As the average annual thermal conditions of the continents decline year after year there should develop a growing contrast between the marine and the continental air masses. I’d expect the amplitude of the air mass convergence and swings of the jet-stream to increase making weather extremes more severe.
As for the the Atmospheric CO2 concentrations continuing to rise amidst the global shutdown: They attests to the idea that it is the total average ocean temperature that regulates it.