Guest Post by Willis Eschenbach
I read an interesting quote in the latest Climanifesto from the Intergovernmental Panel on Climate Change, their Sixth Assessment Report, known as “IPCC AR6” to the initiates:
Climate Feedbacks and Sensitivity IPCC AR6 WGI Section 7.7
The net effect of changes in clouds in response to global warming is to amplify human-induced warming, that is, the net cloud feedback is positive (high confidence).
Compared to AR5, major advances in the understanding of cloud processes have increased the level of confidence and decreased the uncertainty range in the cloud feedback by about 50%. An assessment of the low-altitude cloud feedback over the subtropical oceans, which was previously the major source of uncertainty in the net cloud feedback, is improved owing to a combined use of climate model simulations, satellite observations, and explicit simulations of clouds, altogether leading to strong evidence that this type of cloud amplifies global warming.
The net cloud feedback, obtained by summing the cloud feedbacks assessed for individual regimes, is 0.42 [–0.10 to 0.94] W m-2 °C–1. A net negative cloud feedback is very unlikely. (high confidence)
The idea of global net positive cloud feedback always seemed very unlikely to me. In part this is because I lived for years in the tropics, spending much time outdoors. When it gets warmer in the tropics, cumulus clouds form, reflect lots of strong tropical sunshine back to space, reduce the incoming energy, and thus cool the surface. And if warming still continues, thunderstorms form, which cool the surface in a host of ways. So I’ve watched cloud feedback happen day after day, seeing more warming leading to more cloud-based cooling, not to amplified cloud warming. And the tropics is a large chunk of the planet.
Now, clouds have two opposite radiative effects on the surface. They reflect solar shortwave radiation back out to space, cooling the surface. And clouds also both absorb and emit longwave (thermal) infrared radiation, leaving the surface warmer than when there are no clouds.
This is not theoretical. You can feel the shortwave effect on a clear summer day when a cloud comes over and leaves the surface cooler than with no cloud. You can also feel the longwave effect on a clear winter night when a cloud comes over and leaves the surface warmer than with no cloud.
[For those objecting that downwelling longwave radiation from cold clouds can’t leave the surface warmer than if there are no clouds, please see my post “Can A Cold Object Warm A Hot Object“.]
The sum of these two radiative effects, shortwave cooling and longwave warming, is called the “net cloud radiative effect” or “net CRE”. If it is positive, the clouds leave the surface warmer, and if it is negative, the clouds leave the surface cooler, than in their absence.
So I turned once again to the CERES satellite-based dataset to see what I could learn. It contains data on the net surface net cloud radiative effect. Figure 1 shows the net radiative effects of clouds (“net CRE”) around the world.


There are several interesting things regarding the effects of the clouds shown above. First, on average they cool the surface by about twenty watts per square meter (W/m2). Next, clouds warm the poles by about the same amount, twenty W/m2 or so. And clouds cool the ocean about three times as much as they cool the land.
How is the net CRE related to the temperature? We can look at that in a couple of ways. Figure 2 below shows a scatterplot of average net CRE versus average surface temperature.
Because it is using 21-year averages, this type of analysis has the great benefit of including all feedbacks and slow-acting processes. These are the gridcell temperatures that each gridcell has equilibrated to over decades, after the net water vapor feedback and the cloud feedback and any other feedback have had their effect. Thus, this gives us a good idea of the long-term net cloud feedback at various temperatures.

In Figure 2, the trend at any temperature is given by the slope of the yellow/black line. It shows on average how much the CRE changes for a given change in temperature. From this, we can see several things. First, at the coldest temperatures the slope is positive—Antarctic clouds lead to warming. But above temperatures of about -20°C, the general trend of the net cloud feedback is negative.
Next, above about 26°C, which is about 30% of the planet, the net cloud feedback is extremely negative. For each additional degree of warming, the net cloud radiative effect decreases by tens of watts.
Finally, there are two areas where the net cloud feedback is positive—where the average temperature is below -20°C (mostly the Antarctic Plateau) and where it is between 15°C and 25°C (temperate zone)
There’s another way that we can look at the long-term net cloud feedback. It also involves the looking at the same gridcell averages of temperature and net CRE, but in a different way. The method involves looking at the area around each gridcell, to see what the trend is at that gridcell.
The logic behind the method is that if we look at some given gridcell, it has an average temperature and an average cloud radiative effect. And if we want to see what happens if the average temperature is 1°C higher or lower, we can look at the surrounding gridcells to see what’s happening at different temperatures in that local area.
For example, here are a couple of typical patches of Pacific Ocean area, each one measuring 9° latitude x 9° longitude. These are 21-year averages of the CERES data.


As you can see, in that part of the Pacific the correspondence between ~ steady-state average temperatures and ~ steady-state average net CRE is strongly negative. I calculate the trend, and assign it to the central gridcell of the block. I repeat the process for each of the world’s 64,800 gridcells, examining what’s happening in the local area, and that gives me the global map shown in Figure 4 below.


Some things of note. The net cloud feedback is positive over the land, and negative over the ocean. In agreement with slope of the yellow/black line in Figure 2, the Antarctic plateau and the temperature zones are the positive areas, while the tropics are negative. And as indicated in Figure 2, some parts of the warmest tropical ocean is strongly negative..
Finally, as a global area-weighted average, this analysis gives a global negative net cloud feedback of -1.9 W/m2 per degree of surface warming. Negative.
Yes, I understand that this is the exact opposite of what the “climate model simulations, satellite observations, and explicit simulations of clouds” referenced by the IPCC say… but then, the IPCC is a political body, not a scientific body.
And more to the point, this analysis is based on what the earth is actually doing, not on “climate model simulations” which even the IPCC agrees are greatly flawed and uncertain on clouds.
And yes, it disagrees with the “scientific consensus” … when I was a kid we had asbestos ceiling tiles in our grade school because at that time the scientific consensus was that asbestos ceiling tile was 100% totally harmless. So you’ll excuse me if consensi don’t impress me much.
My very best wishes to all,
w.
Endnote: This is only the radiative effects of clouds. In addition to the cloud radiative effects, clouds cool the surface in a variety of other ways.
• They increase the wind, which increases evaporation, which increases surface cooling.
• Wind also increases sensible heat loss from the surface.
• Wind over the ocean leads to an increase in surface albedo through the effects of white breaking waves, spray, and spume.
• Via both spray and waves, wind increases the surface area of the ocean, which leads to increased evaporative and sensible heat loss.
• Clouds lead to rain and snow, both of which have a strong cooling effect on the surface.
• Thermally driven condensing clouds are surrounded by slowly descending dryer air, which allows more radiation to escape to space.
• Wind increases oceanic surface overturning, which brings cooler deep water to the surface.
So the radiative cooling shown in the graphics above greatly underestimates both the total cooling effect and the total net negative feedback of the clouds.
PS: Can I say how bored I am with personal attacks, and with uncited claims that I’m wrong in some unspecified statement that I purportedly made somewhere, and with people repeating the opposing case without evidence … let me recommend to everyone my post “Agreeing To Disagree”, which contains the following graphic:

If you are commenting, please take a look at that hierarchy and determine where your comment fits … then see if you can move it up a level or two …
Most critically, the author of that graphic said:
Refutation.
The most convincing form of disagreement is refutation. It’s also the rarest, because it’s the most work. Indeed, the disagreement hierarchy forms a kind of pyramid, in the sense that the higher you go the fewer instances you find.
To refute someone you probably have to quote them. You have to find a “smoking gun,” a passage in whatever you disagree with that you feel is mistaken, and then explain why it’s mistaken. If you can’t find an actual quote to disagree with, you may be arguing with a straw man.
SOURCE
That, in part, is why I always ask people to quote the exact words you are discussing.
Willis, in your last post about surface radiation you had a plot showing the NH and SH having the same radiation at the surface. Your plot above about clouds shows about a 3 w difference in NH and SH due to clouds. Something has to make up that difference in the SH. Any ideas?
Nice one Willis – Fig.2 is a doozi.
Added to my list of useful information.
I always knew that cloud feedback was likely to be non-linear and temperature dependent – that graphic tells me what I wanted to know.
Your musings on this subject are inspirational.
Thanks.
Willis
You mentioned “thunderstorms form, which cool the surface in a host of ways.”
Relative to cloud feedback, how important are these host of ways?
I have been wondering about this for a long time and appreciate your very readable post. The best part for me was the explanation about longwave radiation effects which I did not understand.
Always enjoy your posts, but I have an incidental quibble with this one. My classroom also had asbestos ceiling tiles when I was a kid, and our house siding was rugged, completely fireproof asbestos shingles that lasted forever. The consensus then was right: they were completely harmless. They posed no threat to anyone, ever. In fact, they no doubt saved lives because they were fireproof. The supposed danger of asbestos from those forms of the mineral and other similar applications was not based on data, but was a simulation created by lawyers who grew rich from lawsuits.
Had the use of asbestos (crysotile) siding and shingles not been virtually banned, there might have been fewer homes burned out in California. There are always unintended consequences for social actions. It is almost like a corollary to Newton’s Third Law.
Asbestos, in the form of shingles or other well fixed material is very safe and very effective.
Asbestos that is frangible or friable, able to spread easily inhalable fibers (most likely to occur in the mining process, not in the consumer product usage) upon being disturbed is extremely bad. Worse than coal miner’s black lung bad, but much less obvious as to why. Probably why it took so long to get the lawyers interested. Where the lawyers got really rich was not on all the people who were directly affected, but on all the people who they could claim were affected because many things exhibit similar symptoms that the technology of the day could frequently confirm only at autopsy.
Interestingly, there is a high correlation between asbestos-related lung diseases and smoking tobacco (probably marijuana, too).
Whatever happened to the simple fact that water vapor already covers most of the absorption spectrum of CO2, and is 2500 times more prevalent in the atmosphere? The contribution of CO2 is like putting a layer of tissue paper on top of a 6″ down comforter.
“CERES satellite-based dataset to see what I could learn. It contains data on the net surface net cloud radiative effect”
If it is that straight forward a use of available data, then IPCC is demonstratively disingenuous! Do the consensus not know what this satellite technology is doing up there?
To Willis Eschenbach ; another excellent presentation of data with mathematical analysis .
If only you had a PHD and got peer reviewed , the climate warmists would still ignore you .
Common sense tells us clouds cool us during the day and keep us warmer overnight .
Some how the AGW enthusiasts only seem to be able to blame local weather events on CO2.
This might be a big ask , but you are the man to do it , could you possibly correlate cloud cover , local air pressure and obvious wind resultation with any of the recent or previous droughts,floods,wildfires,hurricanes,tornado’s ,etc only looking at those specific areas where ‘disaster’ has struck rather than the entire globe .
Of course there is also the sun strength , seasonal time , sea surface temp etc to deal with , but the IPCC’s super computers can only model what they think or expect to happen rather than what how or why it happened previously .
I think you could teach them more than they want to know , but they get paid not to make waves.
The heating and cooling process of water vapour hinges around 45mm TPW.
If you look at the globe month-by-month you will find atmospheric water provides net warming for November, December and January while net cooling for atmospheric water for the other 9 months:
http://www.bomwatch.com.au/wp-content/uploads/2021/08/Bomwatch-Willoughby-Main-article-FINAL.pdf
The paper explains the process of cloud persistency.
Big negative values in figure 4 over the West Pacific Warm Pool, what’s the sea surface temperature trends there like?
The trend for the Nino34 region is zero for the satellite era.
Surely this questions the meme that water vapour is the most powerful “Greenhouse Gas”. Clouds are just a different phase of water.
Why treat water vapour and clouds separately – they are just different phases of the same substance.
Atmospheric water is a net cooling agent. Why select one of the phases and claim it to be the most powerful “Greenhouse Gas”.
If clouds show such dominant cooling in response to surface temperature, what wins out, the “Greenhouse Gas” or the cloud cooling. Why separate the effects. They are both water in the atmosphere. Why not just consider what the water does as whole rather than treating the phases separately.
The concept of “Greenhouse Effect” is fundamentally flawed. The surface energy balance is set by thermostatic upper and lower limits on ocean temperature. The “Greenhouse Effect” does not exist.
Because water responds differently to radiation according to the phase it is in. You can <b>see</b> that with your own eyes – clouds vs ice vs snow vs liquid vs other phases of ice if the pressure is high enough, rainbows and similar optical effects that depend on small droplets. It’s also very much the case that there are big differences in infrared response as the individual molecules cluster into droplets. Water is a polar molecule, which gives it a tendency to cluster as it cools in ways that change the vibrations of its bonds that it can achieve.
Thanks for an interesting article.
After reading some “IPCC related” papers, I realized that the positive CRE comes from increased altitude of the tropopause.
The “theory” is that global warming will increase tropopause altitude. Anvil clouds reach up to the tropopause. Since top of anvil clouds will get higher up, the cloud top will be cooler.
Subsequently, they will radiate less.
I think “IPCC related” papers say the same thing as you. If “top of cloud altitude” stays constant, then an increased surface temperature will have a negative CRE.
As a matter of fact, almost all warming from CO2 is related to increased altitude of tropopause. So far, there are no hard experimental evidence that the altitude is going up.
I have a question: In my youth, doing oceanography for the Navy, we would spot where islands were by looking at the horizon for clouds. They usually were over islands and not the surrounding ocean. So, could the same thing being happening with the higher night time temps being recorded? Do clouds tend to form over heat islands and keep the night time temps higher than the surrounding rural areas? The argument is that the world is warming, primarily by higher night time temps making the daily average higher.
Neat!
I wonder if climate models see clouds as a positive feedback because they rely mostly on terrestrial temperatures.
Clouds are a positive feedback over land…
Cloud modeling needs a few more variables if you want to look at how their formation changes over multiple decades.
Biological contributions to clouds are obvious over land. Forests create clouds. Deserts don’t. Plants enhance evaporation.
Plants also emit clouds condensation nuclei. The blue mountains have blue air because of these emissions.
I’m not aware of any claims that sea life enhance evaporation, but there is solid science around sea life creating cloud condensation nuclei. An ocean full of life will be cloudy more often, all else being equal.
The interesting tie-in is that primary productivity of the oceans has been falling. This is an observed fact during the satellite era.
The explanations I find most compelling is that land use changes have reduced wind erosion over land. This has reduced mineral fertilization of the oceans. And that overfishing and especially killing whales has reduced the availability of nutrients at the sea surface.
Long story short, emissions from sea life helped clouds form more easily, then we reduced their nutrient supply. This caused part of the warming we see today.
I have a pet theory. Authoritative climate opinion is based on the pet theories of a select number of conveniently useful people who use statistical tools to support their pet theories. Left out are the real world investigations that are needed to disprove – or possibly support – the theory.
w seems to ask the common sense real world questions. On the matter of clouds, that question should already be fully investigated. It appears that the data available would answer much, but not in support of pet theories – so no further investigation would be undertaken until they can find a way to spin the inconvenient truths.
You broke me up Willis with that “ass hat” stuff. HAHAHA
This is why I ask people to QUOTE MY EXACT WORDS! Michael, you’re the first person to mention “ass hat” or “ass” on this thread, so I have no clue what you are on about.
w.
It’s the last item under Gregory’s hierarchy – name calling.
It is in your post. I also laughed at that one !
Excellent analysis
The slope of the data of figure 2 shows how much the CRE changes per degree of temperature change, which is the net cloud feedback. Strangely, Willis didn’t calculate the resulting global average net cloud feedback from this curve, so I digitized the curve and calculated the global net cloud feedback of -2.6 W/m2/°C. [Excel file here]
Willis also calculated the net cloud feedback by comparing the CRE at gridcells surrounding each gridcell. Figure 4a shows that the global average net cloud feedbacks is -1.9 W/m2/°C. Both methods give strongly negative cloud feedbacks. I am surprized that there is such a large difference between the two results. I wonder why and which result is more accurate?
Ken, the part that’s missing is the area-weighting. Each dot is a 1°latitude x 1° longitude gridcell. They vary in size, and that much be taken into account.
The local method is the more accurate of the two, because it captures much finer detail. The other method is comparing on the basis of temperature and not location, so it’s comparing less similar locations.
w.
Your figure 2 does show the fraction of the earth to which each 10 deg. latitude corresponds. Those fractions is included in the spreadsheet (see the above link), so the calculated -2.6 W/m2/°C feedback is area weighted.
Not so, Ken. It shows the fraction of the earth to which each 10° interval in average surface temperature belongs.
Best regards,
w.
Willis, be wary about “feeling” effects of clouds. Human body interprets hot/cold by humidity and evaporation from the skin. Clouds that block sun may feel warm while the temperature is lower.
A comparison between All-Sky and Clear-Sky radiative effects from Martin Wild et al. 2018:The cloud-free global energy balance and inferred cloud radiative effects: an assessment based on direct observations and climate models
https://link.springer.com/article/10.1007/s00382-018-4413-y
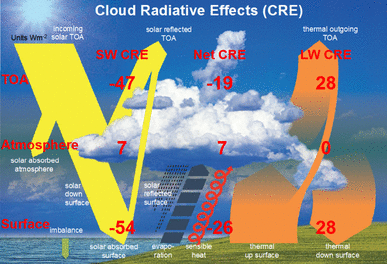
Illustration of the magnitudes of the global mean shortwave, longwave and net (shortwave + longwave) cloud radiative effects (CRE) at the Top-of-Atmosphere (TOA), within the atmosphere and at the Earth’s surface, determined as differences between the respective all-sky and clear-sky radiation budgets presented in Fig. 14. Units Wm−2