Mike Jonas
Sep 2021
The BBC’s Matt McGrath has just reported, under the above ‘Climate Change’ headline, the findings of a paper in Nature linking Arctic variability and change with extreme winter weather in the United States (lead author Dr Judah Cohen, a professor at the Massachusetts Institute of Technology (MIT)):
“A new study shows that increases in extreme winter weather in parts of the US are linked to accelerated warming of the Arctic.
The scientists found that heating in the region ultimately disturbed the circular pattern of winds known as the polar vortex.
This allowed colder winter weather to flow down to the US, notably in the Texas cold wave in February. ”.
There are a number of reasons for being highly sceptical – unlike Matt McGrath – about this paper:
- The climate models all show greater warming away from the tropics, and especially more warming in winter than in summer.
- The climate models are known to be particularly weak at regional predictions, which is one major reason why the climate scientists use an ensemble of models for their predictions.
- The scientists have told us repeatedly that no one extreme weather event can be attributed to global warming.
So what is going on, and why are they making these claims?
The answer is in the way that they tune their models.
They have no way of associating the Polar Vortex, or any other major climate feature, with the drivers of climate, other than through their models. So, when an unpredicted event like extreme cold winter weather hits the USA, they go to their models to try to find out why. The way they do this is to tweak the many parameters in the models, until they get a match with what they are looking for. They then analyse how the models got to the answer and proclaim that as the reason for it.
I explained the tuning process a long time ago in How Reliable are the Climate Models?:
“The fourth IPCC report [para 9.1.3] says : “Results from forward calculations are used for formal detection and attribution analyses. In such studies, a climate model is used to calculate response patterns (‘fingerprints’) for individual forcings or sets of forcings, which are then combined linearly to provide the best fit to the observations.”
To a mathematician that is a massive warning bell. You simply cannot do that. [To be more precise, because obviously they did actually do it, you cannot do that and retain any credibility]. Let me explain :
The process was basically as follows
(1) All known (ie. well-understood) factors were built into the climate models, and estimates were included for the unknowns (The IPCC calls them parametrizations – in UK English : parameterisations).
(2) Model results were then compared with actual observations and were found to produce only about a third of the observed warming in the 20th century.
(3) Parameters controlling the unknowns in the models were then fiddled with (as in the above IPCC report quote) until they got a match.
(4) So necessarily, about two-thirds of the models’ predicted future warming comes from factors that are not understood.”.
The same basic process applies in this case – the extreme winter weather in the USA. To explain it, they turned to their models and tried to get the models to replicate it.
When the modellers had tweaked their parameters to match the required extreme winter weather in the USA, they found that all the climate processes involved led back to the increased CO2 in the atmosphere as the cause. Well, surprise, surprise, there was no way that they can ever find any other cause. Why is that? Well, it’s because there are no other possible causes coded into the models.
As I said in the above quoted article, they haven’t coded any of the following into their models as possible causes (mostly because they can’t but partly because they won’t): ENSO (El Nino Southern Oscillation), ocean oscillations, ocean currents, volcanoes, wind, water cycle, sun, GCRs (Galactic Cosmic Rays), Milankovitch cycles, water vapour, clouds. Yes, they have coded some of these into the models to some extent, but not as primary causes of anything, only as constants or almost-constants, eg. the sun, or as features that react to CO2-induced changes, eg. water vapour and clouds (the IPCC calls them feedbacks).
The causes of the extreme winter weather in the USA remain unknown, apart from the obvious reason: the Polar Vortex. The reasons put forward in the above Nature paper are all based on circular logic, because they come only from the climate models when tuned to give the observed result. ie, the result is an input, which is by definition circular logic.
The situation is that the climate modellers do not know what caused the extreme winter weather in the USA, and they won’t get any nearer to knowing while they remain chained to their models.
Can Arctic warming linked to colder winters?
Should be:
Can Arctic warming be linked to colder winters?
and the answer then is ‘Yes, of course it can…’
Dork
Dork to the ‘⁶’ power.
Trollop to the ‘⁻⁶’ power.
If so, then it is proven that arctic warming isn’t the problem that you have been claiming it is.
That is incorrect! And what the models (CMIP 5 & 6) are telling us is the following:
1] As the Arctic warms the Northern Hemisphere is going to get colder. Don’t be surprised if the Thames freezes over and the glaciers in the Alps start growing. These are all dangerous signs for humanity, that need to be taken seriously; and not be blithely celebrated as a return of the era of “Frost Festivals” and New England sledding, etc.
2] As the Arctic warms, Arctic sea ice is likely to grow again. This is due to a negative conductive feedback process, where the more open waters there are, the more surface area there is to grow ice:
Wintertime Arctic Sea Ice Growth Slows Long-term Decline: NASA
https://www.nasa.gov/feature/goddard/2018/wintertime-arctic-sea-ice-growth-slows-long-term-decline-nasa
3] A warming globe will also cause Greenland & the Antarctic to gain more ice. This is because of the increase in hurricane activity since 1980, which pummels Greenland with snow from tropical storms. And due to a warming atmosphere, there is more moisture in the air, which dumps more snow on the Antarctic (and also the Arctic, BTW).
I could go on and on, batting these anti-CAGW fallacies out of the air, but the bottom line is that due to man’s irresponsible use of carbon based fuels, the Earth is likely to slip into another, possibly epic, Neo-Boreal Era. And due to the opposition to sensible climate change energy policies, as we saw in Texas last year, we may not have the energy grid developed enough to keep all of humanity warm.
Furthermore, for all of you who call yourself “scientists”, you should realize that the most educated physicists in the world (at CERN) are taking climate change very seriously, to the point where they now realize that the Standard Model (eg the expansion coefficient) may need to incorporate climate change.
‘A CERN for climate change’
Working out climate-science’s version of the Standard Model thus provides the intellectual underpinnings for a “CERN for climate change”.
https://cerncourier.com/a/a-cern-for-climate-change/
So, while you all might be mocking Michael Mann now, how surprised will you all be in five years, when it is announced that Mann is the principal author of the updated Standard Model of fundamental physics?
Given all that I have outlined above, I implore everyone here at WUWT to get on the side of “good science”, …before it is too late.
The alarm, it burns!
You forgot the /sarc.
“Arctic sea ice is likely to grow again”
The signs are already there It’s not the ice that’s in a death spiral, it’s humanity. Death by increased Arctic sea ice.
I’d write more, but I need to go out and buy some adult diapers and a rubber sheet for before I go to bed tonight.
This comment has to be sarcastic….
On your first paragraph under “3]”, mentioning an increase in hurricane activity since 1980 pummeling Greenland with more snow from tropical storms, on that alone, I call BS. Regarding outputs from models, they are not data; observations are data, from which we may choose to model physical events in order to better understand our worId.
Sounds like Willis being frivolous.
JF
This paper shows that the increase in Arctic air temperatures was much faster from 1910 to 1940 than it was more recently. It shows that there is a poor correlation between Arctic temperatures and CO2 concentrations but a strong correlation between Arctic temperatures and the circulation pattern in the Atlantic.
Arctic Air Temperature Change Amplification and the Atlantic Multidecadal Oscillation
Geophysical Research Letters
Petr Chylek – Space and Remote Sensing, Los Alamos National Laboratory, Los Alamos, New Mexico, USA
Chris K. Folland – Met Office Hadley Centre for Climate Change, Exeter, UK
Glen Lesins -Department of Physics and Atmospheric Science, Dalhousie University, Halifax, Nova Scotia, Canada
Manvendra K. Dubey – Earth and Environmental Sciences, Los Alamos National Laboratory, Los Alamos, New Mexico, USA
Muyin Wang – Joint Institute for the Study of the Atmosphere and Ocean, University of Washington, Seattle, Washington, USA
Abstract
Understanding Arctic temperature variability is essential for assessing possible future melting of the Greenland ice sheet, Arctic sea ice and Arctic permafrost. Temperature trend reversals in 1940 and 1970 separate two Arctic warming periods (1910–1940 and 1970–2008) by a significant 1940–1970 cooling period. Analyzing temperature records of the Arctic meteorological stations we find that (a) the Arctic amplification (ratio of the Arctic to global temperature trends) is not a constant but varies in time on a multi-decadal time scale, (b) the Arctic warming from 1910–1940 proceeded at a significantly faster rate than the 1970–2008 warming, and (c) the Arctic temperature changes are highly correlated with the Atlantic Multi-decadal Oscillation (AMO) suggesting the Atlantic Ocean thermohaline circulation is linked to the Arctic temperature variability on a multi-decadal time scale.
Exactly!
And because of “Arctic warming”, in cold(er) winters there will be a lesser amount of water freezing; and because of “Arctic warming”, during hotter summers the Arctic ice will melt, even at temperatures below 0 C. And both will result in the disappearance of ice from the North Pole by 2009, thus fulfilling Mr Al Gore’s prediction.
All this occurs because “Arctic warming” is a different kind of warming, recently discovered by “The Science”…
If you don’t know any better
The correct answer is ‘No, of course it can’t…’
You fail to take into account that the left will make any relationships that meet its political purpose. You further make the assumption that all linkages must be logical or scientifically tenable.
334kJ/kg ice will warm the permafrost around the ice-gaining pole ice cap …
https://www.linkedin.com/pulse/water-vapor-dense-rain-drops-ice-doctor-ir-ing-jan-sevenhans/
And the next question is, “If Arctic warming is linked to colder winters then can any of the expected positive feedbacks actually occur?”
And the answer, of course, is…
No.
MOD
Fix the title!
You can link unusual weather to anything just by being selective
https://rclutz.com/2021/08/22/reality-check-on-extreme-weather-claims/
It can be linked (if this is correct) to colder winters in PARTS of the globe (the US isn’t the globe) and warmer winters in others (including the Arctic).
Overall the mean global temp evens out.
Except when it doesn’t.
Are we really having colder winters? Certainly not in my neck of the woods. Would the past winter in the Texas panhandle have been an issue if the gas and electricity supply hadn’t been compromised by poor grid management decisions? My guess is it wouldn’t have garnered a drop of ink from the press.
Doesn’t anyone in Texas have fireplaces any more? Just askin’, because you can cook in a fireplace if you have to.
It’s one thing to have a fireplace. It’s another thing entirely to have wood to put into that fireplace.
Good point, but there is natural gas, too.
[spam comment removed- Anthony]
“When the modellers had tweaked their parameters to match the required extreme winter weather in the USA, they found that all the climate processes involved led back to the increased CO2 in the atmosphere as the cause.” Having done the tweak what happened in the hindcasts?
I suspect the hind casts as the name implies were sh..
so in other words they adjusted the model to get the results they wanted
The modellers need to get into rehab, kind of like the Monty Python Ward for Overacting.
Perhaps if they take out all parameters relating to CO2, the models might actually work.
IIRC, in one study models forced with actual sea surface temperatures instead of man-made GHGs produced more accurate land temperatures hindcasts.
“Having done the tweak what happened in the hindcasts?”.
I can answer that question. Or rather, Swanson (2013) can: “Swanson (2013) noted that the changes in model output between CMIP3 and CMIP5 improved the fit to Arctic warming but worsened it everywhere else, raising the possibility that the models were getting the Arctic right for the wrong reasons. …“. In other words, the more they tweak their models to get one thing right, the more that other things go wrong.
The quote is from https://agupubs.onlinelibrary.wiley.com/doi/epdf/10.1029/2018EA000401
“In models we trust, everything else bring me data.” 🙂
Paraphrasing W Edwards Deming.
It really is joke science. It’s as if they actually believe the US never had cold Winters before AGW.
With the exception of the spike in atmospheric CO2, everything that is being claimed, has happened before or has been happening right along.
I believe if we had hourly records of CO2 in the last several interglacials, we may find periods of 100s of years with equal CO2 rises that have just been washed away by the low pass filter that is the geologic record.
I think this is the same old bs. They brainwash the media that Cold/Snow = climate change, Rain/Wind = climate change, Warmth/Sun = climate change. more Antarctic ice = climate change. They are simply covering all bases to protect themselves from the inevitable conclusion, that CO2 is not the main driver and that their models are destined to fail.
Strong vortex (no volcanic eruptions in NH) warm winters
Weak vortex (strong explosive eruptions) cold winters.
See discussion (search Vuk) here
https://wattsupwiththat.com/2021/02/28/predicting-and-planning-for-the-next-polar-vortex/
and here
https://wattsupwiththat.com/2021/01/18/the-stratosphere-has-warmed-profoundly-this-month-what-are-the-implications/#comment-3164797
Large tropical eruptions strengthen the polar vortex by a positive influence on the North Atlantic Oscillation.
That may be so, but it is that Kamchatkan, Aleutian or Alaskan explosive eruptions cause SSW etc
It’s called The Texas Sharpshooter Fallacy.
For a long time I have been calling many graphs ‘shotgun,’ without a choke, skewed choke, stray pellets as old ones are wont to do. These graphs were pointed out to me decades ago by a sharp mathematician well schooled in real computer science. He lost me in the math, however, but called in hubris. Must be a school teaching these as they can be found in many disciplines.
There have been real Texas Sharpshooters, one a famous female who still has living relatives in San Antone.
3 1/2 years ago an old friend (OK, we’re both pretty old) excitedly (as in ‘We’ll all be killed’) referred me to a Feb.26 Wash.Post article reporting that the north pole had surged above freezing in the dead of winter, stunning (unnamed) scientists, when a portion of the jet stream had headed that way. After examining the particulars I noted that the very much intended impression he had taken away from that notice couldn’t possibly be doing his stomach lining much good. I then quoted from the article that no measurement on site had actually been made(!), but a graduate student (who certainly knew how to advance his career) had simply computer modeled the reported result from that imposing air mass traversing over a much greater thermal mass of ice and seawater below its unspecified height.
I then referred my troubled friend to jet stream graphics I attached showing that while 2 days prior a temporary spur off the main jet stream traversing Mexico and heading northeastward across the eastern seaboard of North America had indeed looped northward over eastern Greenland, by the time of my reply 48 hrs. later it was clearly already dissipating and moving away from the polar region as the main stream re-established its course over the Mediterranean. For some reason this reassurance of a merely transient fluid dynamic atmospheric event and even further attached graphics showing little increase in average daily high temperatures both globally and even in the tropics over our entire long lifetime elicited no expression of relief from this rather incurious self-admitted resident of the “Peoples’ Republik of Berkeley” California who had been chief legal counsel to the California Coastal Commission.
If it’s the BBC you know it’s bogus
…. and that’s being charitable.
This Matt Mcgrath

is a shill for the BS Broadcasters, as he doesn’t even possess a science degree.
He’s actually one step worse than Griff here (if it’s possible).
“He has reported on some of the major issues in science and environment in that period including BSE, foot and mouth disease,”…..
BOTH OF THEM fake scares.
There is a holy trinity at the BBC
Roger Harrabin, Justin Rowland and Matt McGrath
The three redundant monkees
that is an insult to monkees
See no truth, hear no truth, speak no truth!
Why is this limited to North America? Surely these effects would affect mainland Europe and Asia in the same way? I am discounting the British Isles as we are warmed by the Gulf Stream. Are winters getting colder in Germany, Poland or Russia?
Because the USA is in North America, and we’re the source of all that is Evil and Bad and Wrong with the World, and thus we always get it the worst because Gaia decided we deserve it.
Or something like that.
It’s like how the USA does not lead the world in total OR per-capita emissions, but we’re DEFINITELY the source of all emission problems…
“Why is this limited to North America? “
It’s not.
From the paper ….
“In the mid-latitudes, both SSWs and SPV stretching are associated with relatively cold temperatures across Northern Europe, Northern and Eastern Asia, and North America; however, during SPV stretching, North American cold temperatures are more widespread and shifted eastward. It has already been shown that SSWs are contributing to an observed cooling trend across northern Eurasia for the two winter months of January and February (30, 35), but our analysis suggests that an increasing number of SPV stretching events are a cooling influence across North America.”
It is very simple.
To get such changes in jet stream tracks one needs to alter the average gradient of tropopause height between equator and poles.
The models contain no such phenomenon.
Nor is there any way that CO2 could cause such an effect.
Increased meridionality in jet stream tracks is historically linked to cooling periods due to increased cloudiness from longer lines of air mass mixing.
When we were warming the jets were more zonal and global cloudiness declined.
The switch to increased meridionality occurred around the year 2000 which is why ‘the pause’ happened.
That coincides with reduced solar activity and the same happened in the LIA and briefly during the mid 20th century cooler period.
If it continues then cooling will begin once more.
Stephen,
You’ve been insisting on this principle for over a decade(that I remember reading you).
It actually makes a great deal of sense meteorologically and observations seem to back it up.
https://www.marketforum.com/forum/topic/74807/#74810
Thanks, Mike.
Good to know that someone has noticed my stuff.
With the imminent PDO/AMO 30-year ocean cool cycles just around the corner, (which will bring 30+ years of global cooling), Leftists need to come up with excuses for why their catastrophic global warming predictions are so completely devoid from reality with multiple decades of flat/falling global temperature trends.
Some naive Leftist acolytes will believe Leftists’ new silly propaganda about global warming causing global cooling, but most people will finally realize CAGW was, and always will be, the biggest and most expensive hoax in human history,..
Bingo. Now throw in the Earth’s weakening magnetic field and we are in for some interesting times
I can see it, north now points east
Um, Samurai, do those Leftists know or even understand that COLD is due to the ABSENCE of HEAT?
Just askin’, because when the obvious is there in front of them…..
Leftists like pretend the laws of physics don’t apply to CAGW, and if any pesky facts like the Medieval Warming Period or the Little Ice Age exist, they simply erase them, and if observed land temperatures don’t support their CAGW dogma, they ” target=”_blank” rel=”noopener nofollow ugc”>simply add heat to the raw temperature data..
CAGW is a multi-trillion dollar hoax, which Mother Nature will expose shortly…
I don’t know what happened to the above post, but here is the URL I was trying to link:
Thanks!!! I’m still pondering the lack of linkup they have between seasonal changes, which make weather/meteorology forecasts seem sensible, and the lack of common sense in the Leftherds. 🙂
How about the total perspective …..

https://moyhu.blogspot.com/2018/01/satellite-temperatures-are-adjusted.html
You are not showing what you think you are showing, Anthony. See my above comment about “peak adjustments.” The surface temperature adjustments (other than the 2015 Karlization of SST’s) occurred mainly in the pre-1980’s period to support the CAGW meme (see SAMURAI’s adjustment chart, above). Since the modernization of instrumentation and recordings (especially ARGO) beginning in the 1980’s, the surface temperature adjustments have reduced drastically, as your chart shows. By chance, the two satellite measurements start around the beginning of that reduction in surface temperature adjustments.
The two satellite adjustments occur because new processing methods were applied to the raw MSU data. There is currently a scientific debate as to which method is the most accurate. I support the UAH6 method as the best-justified. IIRC, UAH6 uses empirical instead of modeled adjustments and excludes apparently bad data.
The UAH series is taken from one instrument and has to have an algorithm employed on the data in order to extract a single temperature for a broad depth of the atmosphere.
That is open to personal interpretation, never mind the uncertainties of changing instruments on new satellites and sat drift.
The surface series are taken from many thousands of instruments, meaning errors will be negated by the law of large numbers and unless you want to allege fraud (as many do here – and would mean the collusion of hundreds of people, whereas for UAH likely just Spencer and Christy) then that is by far the best way to gauge the global temperature trend anomaly.
As Mears of RSS himself said, and as is self evidently true.
Which s why climate science no real note of it.
Surface temperatures are a dog’s breakfast of data points taken at many locations over time using varying measurement instruments with varying accuracy and varying observational fidelity. The “law of large numbers” doesn’t apply. They are also obviously UHI impacted.
Satellites were justified on the basis that surface measurements were not adequate for scientific work. Review the U.S. government hearings on the subject.
Retrospective sophistry is all the CliSciFi practitioners have. Cite the UAH6 explanation and justification papers if you have a complaint.
I assert no overt fraud, other than Mann and Marcott. CliSciFi is motivated reasoning amplified by ideological hype in politics and the media. Do you deny political influence on the UN IPCC reports or the U.S. National Climate Assessments?
And you are ignoring the adjustment issue which is under discussion.
Have we reached the era of “peak adjustments?”
“any pesky facts like the Medieval Warming Period or the Little Ice Age exist, they simply erase them,”
The LIA is still there as it was global in the sense of being in a period of enhanced volcanic eruption and at the bottom of the solar orbital cooling following the HCO.
The coldest winter in the CET index is 1683/4 (-1.2C) and was followed 2 years later by the 8th warmest on the record (6.3C).
A rather tiny ice age in fact.
https://www.metoffice.gov.uk/hadobs/hadcet/ssn_HadCET_mean_sort.txt
No… Mann’s Hockey Stick graph was based on a very poorly written FORTRAN IV (lol) program where any random dataset (like NHL hockey game scores) would pump out a hockey stick graph… it was really that bad…
Isn’t Leftist common core math great?
Leftists are so funny.
You know since Mann at all, AMO doesn’t exist, it’s only a aerosole outbound /s
It’s amazing what you can prove with a carefully tuned model.
Tune back in next week when we use models to prove that the sun rises in the west.
SAMURAI-SAN,
One of the other sects within the Leftist Church of Progressivism, the Covid Forever crowd, is attempting to eclipse the Climastrologists in the most expensive boondoggle department! CAGW is extremely expensive and potentially very deadly for humanity; but the hucksters pushing vexxines, masks and lockdowns have already killed over a million since early 2020; and the costs of their insanity are almost beyond calculation!
As the globe starts to cool, look for these two sects to join together in pushing more draconian measures wherever they can! Just as all climate ills are caused by the Magic Gas of Doom; all ChiCom-19 virus variants must have their very own jab, and pay no attention to the connection between the jabs and the variants developing! The corporate media complex has Big Pharma firmly wedged under their wings, just as they protect and serve GangGreen!
Based on reliable (enough) data, I believe there is a approximately 70-year cycle in Northern Hemisphere temperature patterns. It would be prudent to at least consider that the warmth predicted by CliSciFi global climate models might be moderated (a little or a lot) by such a cycle in the coming few decades. I don’t know if the UN IPCC CliSciFi AR5’s arbitrary reduction in GCM near-term decadal temperature predictions was influenced by that observation.
University Exeter, on one of the online courses I took from there, actually admitted that ‘models are garbage‘
That they run and run and run their ‘model’ until it produces an output that “Looks right”
(Is that the Texas Sharpshooter in action?)
Pity the hapless jet stream – forever blamed for whatever weather calamity is deemed to have happened or be currently ongoing – while completely silent on what prompted the jet stream to initiate the event
The Most Perfect Buck Pass…
In Peta’s Simple Climate Model Thinking:
Put all that together produces 3 distinct possibilities:
As we are all surely Shirley aware, Climate Science rides to the rescue with an actual measurement and assertion that Point #3 is the case
i.e. the stratosphere is recorded as = ‘cooling’ – this being due to ‘heat being trapped in the warming troposphere’
Fantastic, they’ve correctly applied the 1st Law
While perfectly trashing not only the 2nd Law but also any and all theories of ‘Ideal Gases’
because if the troposphere was warming:
The alert mind will realise what I’ve just described:
i.e. the very actual, real and settled: Science of Climate™
viz: Warming = Cooling
but also the very real possibility that Earth is actually cooling…..
edit to round it all up; Soil Erosion.
Contrary to most/all beliefs and Magical Thinkings, Deserts are Cold Places.
They are natural occurring things but we have accelerated that natural occurrence/variation – by growing (and eating) sugar.
That they run and run and run their ‘model’ until it produces an output that “Looks right”
(Is that the Texas Sharpshooter in action?)
Or in the case of real data that doesn’t look right
NASA Correcting Ocean Cooling
it is simply changed to fit the narrative.
so they disregard the tide gauge data and use the inflated satellite sea level data , then use that to correct ocean temps to ,until they both agree with each other . who needs real data ?
they run and run and run their ‘model’ until it produces an output that “Looks right”
And then run all the models and…. then take an average. Must be right, right?
[pokes moist finger into the wind – if there is any]
If there is no wind, just move your finger towards the direction the wind should be coming from and your finger will be just as accurate as the models….shazaam!
So just another climate modellers wet dream. They do not understand that the polar air vortex is driven by the polar photon vortex which comes directly from the sun. Energetic solar events cause a tightening of the vortex, while weak solar activity makes for a floppy/loopy jet stream, with cold air descending into northern America, Europe and Asia and the observe warming of the Arctic circle.
Firstly, the Arctic warming is mainly linked to weaker indirect solar forcing causing a wavy jet stream (negative NAO/AO) which transports more warm humidity events into the Arctic, and drives a warmer AMO.
The 2020-2021 Arctic outbreak was primed by a Sudden Stratospheric Warming in January breaking down the polar vortex. SSW events are more common in low solar periods, partly because their triggers are more common then. SSW events are teleconnected to the tropical stratosphere which cools, so they are not physically confined to Arctic processes.
I know it’s a wasted effort for most who come here in giving an informed response to this particular dog-whistle.
But at least I brush up my knowledge when I do make the effort.
“So, when an unpredicted event like extreme cold winter weather hits the USA, they go to their models to try to find out why. ”
And yes, of course they do.
It is not the same process though, as they are feeding regional/temporal changes (observed) into a simplified model (Not a true GCM) to see what outcomes occur.
That ultimately is what models are for – to be used as tools for learning the processes of a complex process.
The normal usage of GCM’s of the CMIP series cannot/are not intended to do that – they wont see those events due to the coupling of heat/WV/albedo into a feedback mechanism on a weekly timespan – they are concerned with the conservation of energy balance of the Earth over much longer than that and not the intricacies of temporal/regional extremes, UNLESS utilised, as here, by isolating given parameters to see down-stream effects over a limited period.
It must be noted that the mechanism on the whole increases the chances of more frequent SSW events, IT IS NOT A GIVEN that they occur, as the phasing of long-wave trains is stochiastic to some degree.
What Cohen has done with regards models is to force a model with the observed anomaly trends – Increased and earlier Eurasian snow-field build-up through October (increased albedo) with reduced sea-ice cover at that time and early winter over the Barents/Kara & Chukchi–Bering (increased moisture for precipitaion).
He then found that – “About 2 months after the forcing Is imposed, the model response shows features that resemble the circulation anomalies associated with SPV stretching events”
So we have observational anomaly trends (observations) highlighting and increased trend to Stratospheric PV weakening later in the winter .. WHICH were then fed into a model which confirmed the redistribution of surface energy fed back into the Troposphere (Rossby long wave development) coupling with tropical waves (EP Flux) to predispose the atmosphere to create wave-breaking events into the Strat and thereby warming and hence stretching/disrupting the Polar SPV. This then feeds back down into the Trop to initiate a -ve AO (HP) and drive diverging winds from the Arctic into the Rossby down-wave cold plunge.
Amazing.
Did the Magic Molecule (CO2) get a walk-on part in this production?
I gave you a down vote. I would have given you an up vote for the detailed and interesting explanation, but I downvoted you for the ad hom attack in your very first sentence. it kind of dissuades people from reading further. However, in your discussion you fail to explain how or why CO2 is the ultimate cause.
As every good progressive knows, prior to the coming of man, the world was perfect and static. Any changes are by definition bad, and by definition caused by man.
“ad hom attack in your very first sentence”
Thanks – I thought it would – but, you know, sometimes the nature of this place gets to me.
I wont last long here as I’m not in it for the long-run like Nick Stokes.
Mr. Banton: I can’t speak for “most who come here”, but I don’t consider reading your posts as a wasted effort on my part. I try to learn from the mistakes of others, and yours are quite edifying in that regard.
Thank you Paul.
You have enlightened me, as I honestly thought most of what I say here fell on Stoney ground.
I chiefly post here as a way of occupying my (retired – looking after my aging Mum) time whilst learning stuff in research myself.
It is open to denizens – research that is – just coming here and joining in the echoes isn’t going to teach you the full breadth of the science. (obviously)
I do tend to call a spade a “bloody shovel” (the Yorkshireman in me) so occasionally that impression spills over into my writing.
Spades and shovels are different tools for different purposes. But then, I wouldn’t expect a climate scientist to be aware of such subtleties.
I’m not a climate scientist … if that dig was aimed at me.
just a retired on the bench weather forecaster.
So much arrogance, so little competence.
Definitely a progressive.
If you say so.
Mark is not the only one to notice!
So what caused the previous 5 cold spells in Texas in tbe last 50 years? What you haven’t figured out, Banton, is when it comes to predictions from the Climate Alarmist crowd healthy skepticism is warranted. Why? The actual data almost never supports the climate crisis narrative.
Occam’s razor tells us that if these infrequent WEATHER events also happened before CO2 substantially increased then they aren’t caused by CO2.
“So what caused the previous 5 cold spells in Texas in tbe last 50 years? “
Look, obviously cold Arctic plunges are not unusual.
Cohen is not, nor is anyone saying this is the only mechanism to cause them.
It’s not.
Rossby waves occur in the right place independently within the Troposphere without the Strat being involved.
This is (if correct) a mechanism that is being enhanced by current changes in the Earth’s albedo and sensible/LH/WV divergences from the past during the Autumn and early winter.
“That ultimately is what models are for – to be used as tools for learning the processes of a complex process.”
I models are used the way you say, it is a breach of scientific method. Models are only a representation of an hypothesis of how things work that must then be tested in the real world. Working from the premise that models give evidence of how the real world works is doomed to failure or misunderstanding. It is the major flaw in much of science where models have become the end product rather than the starting place of inquiry. It is all that sustains the unverified hypothesis of CAGW. There is a new total lack of real world evidence to support the theory. A model that is not tested against reality is as useful as belief in unicorns that never appear.
A very old (half a century) classification separated the models into “rational” and “empirical”. Empirical models were in essence correlations, i.e., regular variations in tandem, for what there was not known an effective, physical, cause. This type of models should be tested against observations and could be useful (valid, legitimate usage) only inside the interval of the independent variables where that correlation was observed. That is to say: a regularity was found, we could use it, but we did not know the “laws of nature” underlying it. Thus, while useful, such knowledge should be used with care, not to extrapolate and predict something outside the scope of the tests performed with (i.e., the comparison with the reality) the controlling variables.
On the other hand were the “rational” models. Those were the models or equations that represented analytically the “laws of nature”, the relations between cause and effect, the causality underlying the correlations that could be observed. Galileo’s laws of the pendulum, of the velocity of movements on slopes, Newton’s gravity, are all examples of rational models. As these describe universal laws, there is no limitation with the scope of observations (not exactly, but let’s assume it to simplify).
In “empirical” models, we can add any parameters that are needed to “bend” the equations so that they pass in the observed data. But those parameters have no significance whatsoever, they are arbitrary.
But in “rational” models, parameters are “solid” constants, universal, each one has a meaning: the G of gravity, the R of the gas laws, Plank’s constant, etc. They are not arbitrary, they represent the relations between the controlling variables of the system.
So, Andy, I dare to add something to your clear explanation: “testing against reality” has a VERY different meaning when we are testing an empirical model based on observed correlations and when we are testing a rational model which represents algebraically some laws of nature. The “climate” models have lots of empirical correlations and very few “laws of nature”; and it seems that they do not include all the “laws of nature” that control the system.
In any case: some experiments to test models agains reality are NOT proof that the models, empirical or rational, are “good”, i.e., that their results are always and will always be in conformity with what is observed! That is because our knowledge is always limited: some variable influencing the phenomenon was not taken into account when creating an “empirical” model and, for some reason, its natural variation makes the model fail in certain circumstances. The same regarding “rational” models: very often we do not know all the “laws of nature” which influence them.
Thank you for adding detail and deeper insight to my generalizations. I have become frustrated with a large volume of academic output that treats models of the empirical sort as if they were, in themselves, evidence of truth. Correlation is known to all reasonable scientists to be a prerequisite for causation but far short of proof and often a false path.
We should recall that rational models began as observations and explanatory hypotheses, and then eventually became routed in observable physical laws of nature after repeated testing against observations in the real world. Thus Einstein’s theories of general and specific relativity became accepted as physical laws because successive observations confirm the predictions made by the models. Even today Einstein’s models would be subject to revision should observations refute some aspect.
You are welcome!
Most often nowadays we see people talking as if the rule would be “one fact proves a theory”. But people with a scientific education know that it is the opposite: one single fact can challenge a theory (no matter how many other facts support it).
Another topic: “rational” models are universal. You can use them outside the realm where they were testes against nature. Newton’s gravity was tested on Earth but it applies on the Moon (and elsewhere where humans can go). An “empirical” model may work acurately (usefully) only in the range where it was tested: that is why some models of COVID-19 “predicted” more infectios than the whole population of certain countries (in Portugal, for instance; population 10 million, but according to a full professor of mathematics (!) of one of our universities (!!!), 12 million would be infected in a few weeks…)
And even more often we do not know the initial conditions or the constants precisely enough for the models to accurately predict outcomes. In other cases the “laws of nature” are themselves suspect or speculations.
Yes, you are right!
“Models are only a representation of an hypothesis of how things work that must then be tested in the real world. “
Correct:
And that’s all the IPCC are doingThe real world can only br models in this case (surely for obvious reasons?)
It’s up to the world’s politicians to decide what action their electorate want to take on their basis.
Also models aren’t needed.
The basic science of the RF of GHGs in the Earth’s atmosphere tells us all we need to know.
They slow cooling to space at a rate equiv to between 2.0 and 4.5C per doubling of CO2. …. Pretty much what Arrhenius said 100+ years ago.
”In 1896 Arrhenius completed a laborious numerical computation which suggested that cutting the amount of CO2 in the atmosphere by half could lower the temperature in Europe some 4-5°C (roughly 7-9°F)… “
https://www.rsc.org/images/Arrhenius1896_tcm18-173546.pdf
Strangely enough, even today, 126 years later, the ECS (which is what Arrhenius had calculated) is still not known with any certainty. In fact, the climate models which reproduce the historical temperature record the best are those which have ECS = 0. In other words, carbon dioxide appears to have no effect whatever..
Thank you for the detailed explanation, a bit too long… I’ll try to summarize it:
Sh.t-in->Sh.t-out–>>Sh.t-again-in–>>Sh.t-again-out—>>>Sh.t-onceMore-in—>>>Sh.t-onceMore-out—–>>>>Return-to-start
“That ultimately is what models are for – to be used as tools for learning the processes of a complex process.”
Didn’t work too great for your old employer did it Banton?
100% failure to predict plain old weather 6 years out of 6.
They managed to predict the exact opposite of what happened summer after summer. It takes great skill and plain mega-BS to fail as badly as that eh?
It’s why I don’t give a flying..f..k about your “models” and what you are trying to prove, prefacing it of course with “I know it’s a wasted effort for most who come here in giving an informed response”.
You really are a “prime model” of intellectual arrogance aren’t you, like all your old pals at UKMO?
Anthony Banton – Thanks for your detailed comment. It looks impressive – ie, lots of technical stuff all sounding very convincing – but it is actually exactly what I said was being done. ie, it’s all post hoc (after the event). It’s all very well pumping stuff into a model to explain what has just been observed, but until the model can actually predict these things then you may not actually be learning anything at all, you may be just fooling yourselves.
I’m mindful here of what Ross McKitrick and John Christy described in their 2018 paper A Test of the Tropical 200- to 300-hPa Warming Rate in Climate Models:
Swanson (2013) noted that the changes in model output between CMIP3 and CMIP5 improved the fit to Arctic warming but worsened it everywhere else, raising the possibility that the models were getting the Arctic right for the wrong reasons.
The work that Cohen did to reproduce the actions of the PV may well make the model less accurate in other places, which would certainly suggest that they were getting the PV right for the wrong reasons. In any case, when they force a model with the observed anomaly trends, they could simply be forcing the model with features that are associated with PV changes in the first place. In other words, they may not be looking at the actual causes at all. A bit like the ‘correlation is not causation’ idea. They got a correlation between the anomaly trends and the PV, but that doesn’t necessarily tell them anything about the causes of either.
Anyway, as I said, thanks for your detailed comment. It’s certainly food for thought.
Mike:
Thanks v much for that.
With Paul Courtney that makes 2 positive posts here.
How about doing something like applying the Scientific Method and run some experiments and generate data and analyze the results? Oh, wait……
And just how do you do “experiments” on the Earth’s atmosphere other than within a model??
You don’t.
You observe and record over appropriate time peroids, then see if ACTUAL effects are notably different than anything previously occurring.
If not, find something productive to do with your life.
“You observe and record over appropriate time peroids, then see if ACTUAL effects are notably different than anything previously occurring.”
And that’s what Cohen et al did
Then fed the observations into a modified GCM.
Read the paper ….
https://www.science.org/doi/10.1126/science.abi9167
Models are lies, you worship lies.
Climate models are lies. Other models are useful.
At this place and time all modeling is corrupted, not to be believed. “scientists” have forfeited their right to be trusted by anyone, leftist agenda has infiltrated ALL science. Just look to all this Chinese Disease stupidity, all the proof needed to damn them all.
Actually, medical science has long had a record of research that can’t be duplicated that is almost as bad as the social sciences.
However, materials science seems to be healthy and making advances. Chemistry probably comes in at a close second. One reason is probably because those working in the fields have a simple metric by which to judge their research: “Does the material meet the requirements of performance defined before the experiments took place?” There is no political ideology to be satisfied.
And they are in fields where failure is not rewarded.
Researchers and model programmers who do not return value for funds expended are discharged.
Nor is it long before researchers who do not return value to funds expended become known across the industry and end up teaching, working in government, flipping burgers or cold calling for some marketing scheme.
If you mean scientsts are “lefties” then that is correct.
You will not get rich being one.
A scientist that is.
They serve a higher moral ground that “righties”
Their interest is (patently) not about getting rish.
I am not one as I now lean right (voted Brexit).
I just see the ideological dog-whistled responses on here and post up what the science says.
I can neither do anything about nor care about the rabid hatred that drives some people this blog.
Suffice to say that it does not touch the people you aim it at.
It only festers in your selves.
“the science”…says it all.
“the science”
That makes you look utterly stupid.
Feynmann did Science, (not THE SCIENCE) and won a nobel for fun.
Read a little about him.
You fit perfectly into the kind of role model he particularly detested.
Lefties serve a higher purpose.
Righties are just in it to get rich.
Yet you want everyone to believe you are a righty.
The lies and the self delusions come fast and furious with you progressives.
Look, once and for all – I don’t care a flying f*** what you think.
You clearly do, and it’s hilarious for the rest of us.
Ahh, ain’t you special! You change from post to post and pretend to be whatever gets you up votes. No wonder you get none here. Oh, and your rabid hatred of reality is all you, sweety.
Obviously the work of an ex-government employee.
I take it that you don’t fly planes, rid in cars or cross any bridges.
All of which were developed using models.
So now you are defending greentards. Okely dokely.
Models can be useful, if used appropriately. The problem is that climatologists have not demonstrated that their models are even close to being correct, and they use them to try to predict the future.
Scientific community has thrown away any right they ever had to be taken seriously, first with this climate religion and now with their use of Chinese Disease to push the leftist political agenda. How they make themselves believable again I don’t see.
Oh, and whilst I am here Mark are engineers pushing this climate religion hoax? I can’t find any that are.
I think that’s the big pink elephant in the room. if the data are not available, you just can;t use that as an excuse to make stuff up and assert that that creates a reality.
It is “available” and I have been interested in it for a decade or so now – you could try doing some research to see what they have discovered.
Starting here …
https://agupubs.onlinelibrary.wiley.com/doi/epdf/10.1029/1998GL900321
Why bother writing fiction papers?
It’s what he’s paid to do, after all, in his mind he’s serving a higher purpose.
Only in a lower place.
Since Arctic ain’t warming this just so much bullshyt. Same lies, different liars.
No of course it isn’t.
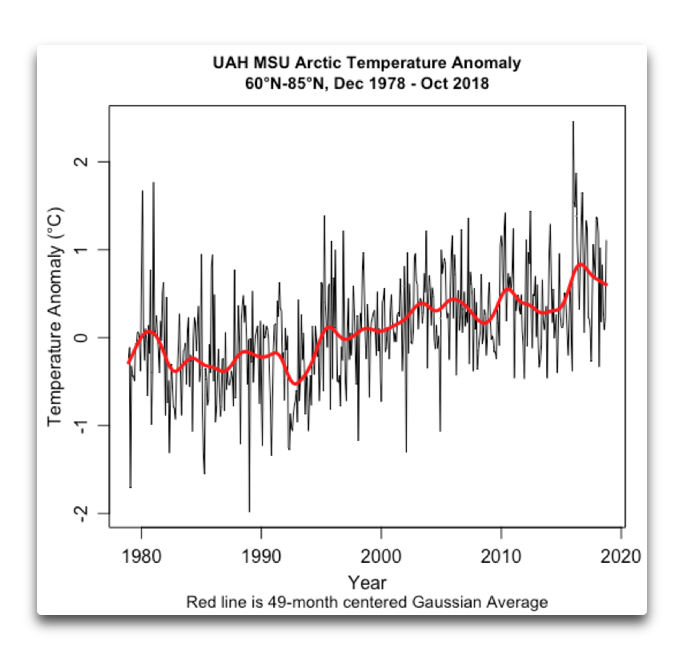
Roy must be in on the “scam” as well (sarc)
The attic temps reflect the positive phase of the AmO. Nothing more.
With a Super El Nino at the end.
Facts aren’t really your thing, are they? The Arctic is covered with ice and still frozen, and it is going to be for the foreseeable future. Those are the facts. You can feel what ever you want, your feelings are irrelevant.
The “facts”, to which I was responding were accordin to you “Since Arctic ain’t warming this just so much bullshyt. Same lies, different liars.”
In the first instance I responded with a graph of the lowest trending (warming) global temperature series there is – and the only one that people on here trust (UAH V6 TLT) – to show the Arctic is indeed warming, and at (currently) over twice the global rate.
Second, I will not respond to the “Liars” part as it says an enormous amount about you and (others) on here.
Just like QAnon following oddballs there are somethings people have psychological issues about.
“Second, I will not respond to the “Liars” part as it says an enormous amount about you and (others) on here.”
Hey come on Anthony, let’s be fair. Please tell me you are not calling 2hotel9 a liar? That’s my job.
Got yer Creepy Quid Pro Joe vaccine passport yet, CCP-Simon?
Simon is like my aunt’s chihuahua all yap, no bite and actually believes he’s making a difference.
Got a mirror.
“Got yer Creepy Quid Pro Joe vaccine passport yet, CCP-Simon?”
Yep. And….Actually it is the Trump vaccine. He got that right. Joe has nothing to do with it. And can I suggest you don’t take it. There’s a chip in it you know.
You have a job ? Typing BS comments where ever you can without be banned ? :d
“Typing BS comments where ever you can without be banned ?”
Does that even make sense.?
As much as you do, simple minded fool.
Poor little simple, can’t get your lies straight yet again.
So you are anti-gay, too? Lets sort this out, ice in the Arctic is still there, ice in the Antarctic is still there, neither place is warming. Now, trout out your 0.001c and tell us how all life on Earth is going to die, we love laughing at greentards like you.
Missing 85° through 90° of the Arctic.
Why is that?
It’s just not representative of the Arctic without the coldest section.
Then there is the 49 month Gaussian filter? one month short of five years?
Whatever for?
Then there is the oddity where 2020 and 2021 data is missing.
Your UAH data looks to have stopped months before January 2020.
Why is that?
Inconvenient data? Or is your spin machine unbalanced?
Not much to lose sleep over from these graphs –
http://www.climate4you.com/Polar%20temperatures.htm#Diagram%20ArcticMAAT
If you mean this one …..
http://www.climate4you.com/images/70-90N%20MonthlyAnomaly%20Since1957.gif
Then thanks – that shows the Arctic mean temp having risen by 2C since the id 60’s – TWICE the global rate ….
Er, this
http://ocean.dmi.dk/arctic/meant80n.uk.php
tells us that the Arctic mean temp is running at below freezing for all but ~ 60 days a year.
And even then (high summer), it barely squeezes above 0C, as it has been doing since at least 1958, and continues to do so right up to the present time.
No wonder that elusive Northwest Passage still freezes up every year, impassible for vessels other than Russia’s nuclear powered super-icebreakers.
“http://ocean.dmi.dk/arctic/meant80n.uk.php
tells us that the Arctic mean temp is running at below freezing for all but ~ 60 days a year.”
Err, of course it is – it’s a vast area of ice!
what do you think will happen to air arriving over it at a temp above 0C?
You know being’s that the LH of fusion/melt is 334 kj/kg
Some 80x that of the energy required to raise the temp of water by 1C.
And for half the year there is no sun.
Does the fact that the summer temp hugs freezing so closely not make you think? – that it is a great energy sink, and the vast majority of both advected and solar absorbed goes into melting the sea-ice.
OOOH KNOWE! ANOTHER DETH GRAF!
If you say so!
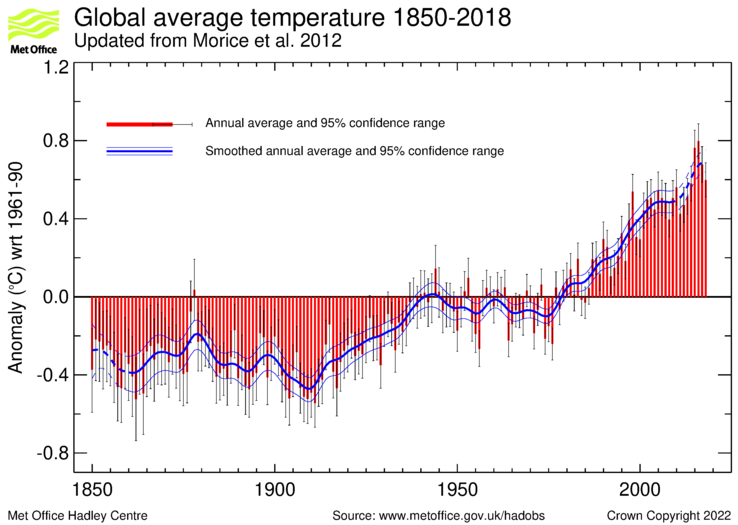
MetO mental madness. Living up to their unprofessional emails.
Assuming there is such a thing as global temperature (there isn’t) I’d really love to know how they measured it in the 19th Century, when vast areas of the Earth were devoid of met stations.
Never mind the natural variation that’s 2x the alleged trend, look at this red line.
And this graph is linked with CO2 . . . how exactly?
Some of the temperature slopes are positive.
There would be no point explaining it to you.
If you don’t know now you are obviously not capable of understanding.
Maybe it’s your ideological blockage, as the science is unequivocal and has been understood for over 150 years.
If you expected a graph of global temperature to rise in parallel to a graph of CO2 ppm then there is even more obviously something lacking. sorry.
Oh yeah, your intellectual superiority over the entire population is glaringly obvious.
Not mine.
All I am doing is relaying the consensus science here.
That denizens mostly do not want to hear it, you can take is a given with me.
I just come from a meteorological background and it is no more than you expounding on whatever your professional background is … with the help of text books in the field.
You’re,welcome.
And the last refuge of the alarmist. the “consensus science”. In other words, not science at all!
Cheap shot! It is an all too convenient way of avoiding any responsibility for explaining why your graph suffices as evidence to support your position.
“And this graph is linked with CO2 . . . how exactly?”
Maybe not that one directly, but this ones seems to be telling us something…
chrome-extension://oemmndcbldboiebfnladdacbdfmadadm/http://static.berkeleyearth.org/pdf/annual-with-forcing.pdf
And, Simple Simon, you claim to have read and understood what you linked ? 😀
Would be the first time 😀
Ummm, it’s not complex. Would you like me to explain?
Moving more heat into the arctic, just increases the amount of heat that the planet is losing to space. Just another of the strong negative feedbacks that keep the planets climate stable.
The article is about regional changes in albedo/and WV instigating an atmospheric wave-train response that favours stratospheric wave-breaking and a higher probability of deep arctic Arctic plunges.
I wasn’t responding to the article, I was responding to you.
Move the goal posts much?
Eh?
you’re the one moving the goalposts as your comment came before mine LOL.
*Skeptics* logic ..; got to wonder.
Of course it cools to space over the Arctic – just like it’s done like forever!
point is, at the surface it’s not doing it as efficiently as it was.
No link, too hard for you?
Meanwhile still ZERO evidence that the bogeyman CO2 is the cause of any warming in the arctic regions.
Maybe it is just standard weather is all it is.
Mr Editor
It wasn’t good enough for the lead author (Mike Jonas)
Or at least the person posting the article on here.
So why would it not be for me?
And if you further follow my discourse here you would have found me doing that very thing at the comment 9:47am …. 11 minutes after your post and without me seeing it.
Did Those People actually define “extreme weather”?
A blizzard is an overloaded snow storm, and not much else. If it happens near a large water body like one of the Great Lakes, and the water surface is not FROZEN, you’re more likely to get a giant container ship load of snow, ice and get hit by the Great Chicago Blizzard of 1967 (which was NOT in the forecast, by the way) than not.
It would really be nice if the “experts” actually put some real-world time on doing what meteorologists do every day: study humidity levels, wind speed and directions, temperature rises and drops, etc.
But they don’t, because that would bet Too Hard. And it might upset their apple carts by proving them wrong.
Not one of these people can possibly explain the 1974 tornado swarm that rampaged through the Midwest and ended up in Xenia, Ohio, flattening towns as those twisters went and doing massive property damage, never mind killing people. There was the 1989 Bangla Desh swarm, also: worse than the 1974 swarm in the USA, and then the latest nasty display by Mama Nature was the 2011 outbreak/swarm, which was mostly in the USA Southeast.
They have no real idea what “extreme weather” is.
I can hear the weeping and wailing now.
2021’s greatest extant in annual minimum sea ice coverage in over a decade = Arctic warming?
Its the globalwarmingcoolingwarmingcoolingwarmingcoolingwarmingcooling hamster wheel.
Make sure that little bearing is oiled, or it will squeak.
So, just for the sake of argument, let’s assume that they are correct. Winter warming in th Arctic disrupts the polar vortex and cused cold winter weather in the continental US and Europe.
I.e., the pole warms 4-5 degrees to ~-35 Deg F from ~-40 Deg F and the ContUS and Europe cools 30-40 degrees from ~35 Deg F to ~0 F.
What does that do to their global average temperature? Or does GAT not matter anymore? If it doesn’t matter anymore, how do you define GW?
Clearly, global heating is going to cause a new ice age.
These people just can’t help but to step on their own d*ck.
“What does that do to their global average temperature? Or does GAT not matter anymore? If it doesn’t matter anymore, how do you define GW?”
It stays the same – as this is a process of moving energy around the Earth and not one changing the energy balance of Solar absorbed vs LWIR out.
“These people just can’t help but to step on their own d*ck”
And *you* people cant help displaying your ignorance like a badge.
Who exactly are “*you* people”? I demand a list.
Lets start with you, eh?
Delusional. Completely delusional.
5 degrees warming in the Arctic, 30-40 degrees cooling in Europe and banty claims the global anomaly remains the same.
https://rclutz.com/2021/09/13/arctic-amplification-not-what-you-think/
Here is a provocative article that has some critical thinking about temperature anomalies and how the GAT can be incorrect. The end result is pretty much what I have seen. The regional averaged temps don’t add up to the GAT. You simply can’t find areas that are hot enough to offset areas with no warming or even cooling.
As pointed out on an earlier thread. There is simply no place on the globe where you can go and live at the GAT temperature.Therefore it is a made-up metric that probably doesn’t mean what it was intended to mean. Besides which, no variance is ever quoted either for the globe or any region which means one can not even begin to analyze what the true distribution actually is.
What will they think of next ?
Global warming ( aka climate change ) is the cause of local cooling .
Modelling is great on a cat walk but not so nice out of a computer .
Turn the computers off and just let us see the weather .
“Global warming ( aka climate change ) is the cause of local cooling .”
Why would you expect changes in regional responses to warming NOT to feedback to create some further changes in global energy (DeltaT) exchanges?
Do you expect there to be a monotonous response across the globe?
If so – why is that?
The clue is in the word “global”:
The thermaggedonists kept screaming that we were all going to die in a boiling maelstrom as it swirled across the surface of the globe.
When that all encompassing boiling maelstrom didn’t happen, the thermaggedonists started desperately backtracking and claimed that actually, um, warming causes, um, cooling.
CAGW is an extremely expensive joke.
A joke for which persons such as Banton here keep stoking the fires.
“CAGW is an extremely expensive joke.”
Indeed … and entirely of the imaginings of the likes of Denizens here.
“Thermagedonists” are not the consensus science.
So that’s akin to me saying that the likes of the Sky-dragon slayers on *your* side speak for all sceptics.
Plainly and manifestly not true.
So what you’re saying is global warming isn’t catastrophic.
So, no catastrophe means no worries. Glad you agree with us sceptics.
CAGW is an extremely expensive scam.
Climate alarmists are a joke.
It’s quite astounding how the fraud continues. It goes completely unquestioned that models which are useless are just accepted as recreations of the Earth and can “prove” anything. I seriously want these people to be imprisoned for conspiracy.
When arctic air moves south, it has to be replaced by something. By definition, the air that replaces it had to come from places south of the arctic. Which by definition, will be air that will be warmer than the air that just moved south.
There is no change in the total amount of energy in the atmosphere, just a change in where certain air masses are currently residing.
In the longer run, such air mass swaps will actually end up cooling the planet. The air masses that move south will absorb heat from the areas they move into. The air masses that move north will be better able to shed heat into space.
Overall, not the climate nightmare that most alarmists want to believe in.
Earthnullschool shows that well. More often than not it is caused by surface winds moving north in the Atlantic and into the Arctic. I have many examples of this occurring including my saved pics from mid February and the Texas cold snap. Surface winds were moving strongly north from around the 13th of February to the 19th, before subsiding. This was from the 17th.