By P Gosselin on 13. August 2021
Typhoon trends contradict alarmist claims made by the IPCC’s latest report
By Kirye and Pierre
The latest IPCC AR6 report claims there is a likely link between extreme weather events and human activity, particular so-called greenhouse gas emissions.
The media wasted no time in spreading panic and magnifying hysteria. But is it true that extreme weather events like heavy rains, storms, droughts are linked to CO2-induced climate warming?
If the link is true, then man’s activity has been desirable
Today we examine the Japan Meteorological Agency (JMA) data for Pacific typhoons going back to 1951. First we look at the trend for the number of typhoons formed in July. The IPCC Summary Report would like to have everyone believe that tropical storms are becoming more frequent and intense.

Data source: JMA.
Yet, as the above chart shows, the number of typhoons formed in the month of July has been trending downward. Using IPCC science claiming there’s an anthropogenic link, then we’d have to say that man has had a desirable impact on typhoon formation.
But that’s only one month, July.
So, next we look at the JMA data for the number of typhoons formed from January through July going back to 1951:

Data source: JMA.
Here as well the trend has been downward – in stark contrast to the baseless hysteria we’ve been hearing from the media over the past few days.
Annual typhoon trend is down
Next we examine the trend for the number of typhoons formed each year, since 1951.

Data source: JMA.
If there’s a link to humans, then us humans must be doing something right in terms of typhoon management. Of course everyone knows that IPCC science behind a link is bogus.
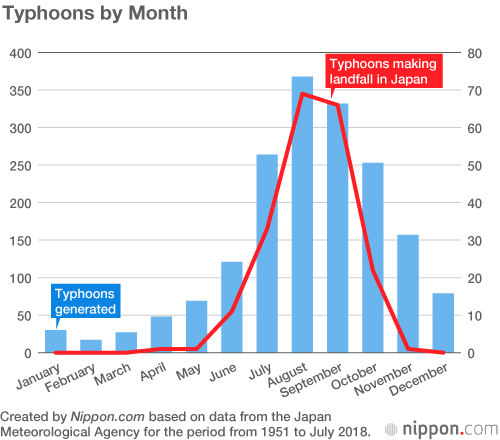
No trend on Japan typhoon landfall
Finally we look at the number of typhoons making landfall in Japan:

Data source: JMA.
Indeed we see there’s been no trend going back to 1950. In terms tropical storms, the amount of hot air coming from the IPCC is at typhoon levels.
I conclude the IPCC jumped the shark into Sir Cyril Burt territory was in 2000, when they embraced Michael Mann’s hockey stick temperature reconstruction. It was so preposterous on it’s face, and clearly not critically reviewed, as the many flaws were not all that difficult to discover.
Extraordinary claims require extraordinary proof, and the IPCC went over the line into advocacy long ago.
The IPCC was created expressly for the purpose of manmade CO2 driven global warming / climate change advocacy.
Aggressive advocacy.
It’s at the very core of their organizational mission and charter.
They never needed to jump any shark –
it was safe passage for them through “The Science” and also from academia, politics, bureaucracy and a salivating media cabal.
Pierre, nice report. I hope you don’t get any hate mail, because the CAGW liars are on a mission.
Instead of wringing their hands and building thousands of useless ‘eco-crucifixes’ (Delingpole) the Japanese deal with natural hazards like floods constructively.
Cooling conditions produce wavier jets, greater temperature differentials, more extremes and more loss of life.
Warmer periods are relatively benign.
The precise opposite of current predictions / projections.
What you just wrote was basic meteorology until they decided to rewrite science (not to mention re-imagining the null hypothesis). Big differentials = big storms. It’s no wonder that most of the early 20th century records still have not been broken.
We’re living in the most climatically pleasant time in human memory. The only thing we need to fear is the cold that’s right around the corner.
There in NO trend in any of the graphs you presented. NONE, just tremendous variations. Go back to your regression analysis and print the r square value on each graph.
rd50, do you realize what you just said? If you claim there is no trend, then you just countered the IPCC 6 claims. See, we do agree.
In order to claim that the regression analysis showing any trend, we need to have the R squared value automatically calculated by any available statistical analysis software. This is NOT presented for any of the graph submitted. Looking at the wide variations of the “linear” decrease is simply not very convincing. Simply, the opposite is true if someone is familiar with this statistical procedure. So much variations and no verification is NONSENSE.
You mean you aren’t a fan of the very common phrase found in many publications to the effect that “there is a trend but it is not significant”. I quickly run out of fingers and toes trying to count up the number of times I have encountered that little gem in peer reviewed publications.
I agree there is possibly no trend, but I am not sure R squared will help clarify the matter. Rather, since this is counting data, I would probably model the time series as a Poisson process, and test for a trend in its one parameter, the average rate of occurence.
The data is all here,maybe I’ll spend a bit of time tomorrow on this.
Very good idea.
If anyone is still around, I finally got around to looking at this. The only graph I analyzed was the total number of typhoons from 1951-2020. Since the annual numbers are moderately large (average = 26.2) I used the normal approximation to the poisson distribution, and tested a mean as shown on the graph as 26 in 1951 declining to 25 in 2020, against a constant average of 26.2 (mean of data). I used likelihood ratio as the test of strength of evidence. The ratio is essentially 1.0 (i.e. no evidence at all in this data of a declining average value).
This doesn’t surprise me as I have done the same analysis, more or less, for major Atlantic Basin hurricanes post WWII and got the same result.
Thank you.
Thanks rd50. My R squared knowledge is beyond rusty these days. Think I should dust it off.
All I’m saying is if you can’t show an increasing trend in typhoons with R squared, then your implicitly supporting the article.
Nice post, Kirye and Pierre. I started archiving the Atlantic hurricanes data long ago. This makes a nice Pacific complement from a reliable source, translated from Japanese. And further confirms the global ACE stuff.
BTW, my father was second in command of the 409th typhoon chasers (original typhoon research) from 1948-1951 off Guam. They used B-29s with the bomb bays retrofitted for dropsondes. He once flew one back so beat up by a typhoon that the tail was bent 17 degrees out of true, by jockeying the four engines to offset. Tough landing. Scrapped for parts.
Thanks Rud.
That story would make a great docu-drama for the likes of Netflix.
Nice post. You must be kidding. The statistical analysis is simply NOT giving ANY convincing evidence that the “decline” is of any importance. The variations are huge in all these graphs and omitting the calculated R squared value for each graph is simply what Nye would do. Pure nonsense just looking at the regression line.
Do you mean Bill Nye the science guy? You’re kidding, right?
No. This was simply NY for an abbreviation. I don’t know how I was corrected.
Still, pure nonsense believing that there was a decrease without having the R square value being higher than 0.5 presented on these graphs. On top of this, all statistical analysis software not only give R square value they also give 95% confidence intervals for the regression line and 95% confidence intervals for the prediction intervals.
These were very time consuming to calculate before computer software was available.
However now, something available in even Windows 365, Excel, is readily available and if you want more you can use MATLAB software as one example. There is no excuse to present a graph showing a linear regression without such available information as R square value if one wants to claim a trend.
The graphs presented claiming a decrease!!! are NONSENSE. Just looking at the data, there is so much variation that NOTHING can be claimed, decrease or increase.
I disagree. You’re talking gibberish. All you people ever do is talk gibberish. I say there’s a trend. Is there some sort of sexual buzz from spouting all that nonsense.
You seem to have misread the original post.
It does not assert there is a negative trend.
It repeatedly says “IF the link is true, then man’s activity has been desirable”.
Which is true from the graphs presented.
You are the only person who is claiming that there is a trend. There isn’t.
You either forget or missed that you are dealing with a time series that probably has cyclic characteristics. Linear regressions on cyclic behavior can give erroneous conclusions. Remember, a pure sine wave will show no trend either.
Afghanistan now has a very good path toward net zero carbon.
and net zero carbonara.
And net zero economy …
$200M a year from the drugs trade is hardly net zero – and that was just what they were making before the US and International forces went in. With more of the country under their control they stand to make far more. Afghanistan could be an economic powerhouse under the Taliban, for all the wrong reasons.
Less than $1 per citizen is damned close to “net zero”. That won’t even cover the damage the Taliban does to housing and infrastructure. These people aren’t exactly wizards of industry. They only have one skill … war.
The best thing for Afghanistan would be to isolate them and let them beat each other into oblivion until they learn to play nicely. They’re past helping.
That alleged $200 million drug money must go towards GDP, not some individual warlord’s weaponry and soldiers.
That is, a functioning national financial instrument from produce and industry.
Product exported for cash that is then exported for arms is not a functioning national finance instrument. Unless you count each individual chiefdom as having their own GDP.
I dunno, with the Taliban about to go into purge mode, I bet a lot of carbon will be released from the hosts
You have got to be kidding, right? All the harvesting of the poppy fields, the processing into heroin and then the shipping? Their emissions will skyrocket!
And definitely a lower cyclone trend for Aussie cyclones over the last 51 years.
NOTE the only year without a severe cyclone was in 2015 to ’16 season. DUH?
http://www.bom.gov.au/cyclone/climatology/trends.shtml
Australia’s BOM is not unbiased, by any stretch. There is nothing one can trust if BOM supplies th data or issues the conclusions.
As Steven Koonin shows in “Unsettled”, the IPCC’s own report doesn’t support the summary for policymakers and its claims of increased hurricane and tornados.
One thing I haven’t seen anywhere else is Koonin’s explanation of how “running records” and “absolute records” produce very different pictures. We are often told that the number of record highs has been going up without it being mentioned that it’s actually the ration of record highs to record lows. There has much more of a decline in record lows (a GOOD thing!). I’m halfway through his book and I’m impressed so far.
All this yakety yak by the carbonphobes but they abhor nuclear power even more than coal, oil and natural gas.
We’re looking at you too UN IPCC-
China’s secret deal with WHO to hide origins of Covid (msn.com)
Soft on Chinese coal power too watermelons?
As a commenter at NTZ suggests the data is too erratic to infer anything useful one way or another.
Well it sure the hell is not trending upward as the warmunists would have you believe.
Climate is weather and weather is climate and they are doing exactly what they have always done.
Another great post by Kirye of Japan on the No tricks zone website.
Kirye of Japan? Did you mean Kirye as in Kirye and Pierre Gosselin of the NoTricksZone?
Pierre translate a lot of Japanese?
Downloads a lot of untranslated Japanese data?
Ozonebust states the situation clearly.
AR6 also says surface wind speed has reduced. Linden said it would, as the poles warm, the equator to polar temperature gradient reduces, and so does wind speed.
CO2 causes less severe weather, a massive increase in plant growth, mild warming, a longer growing season, less cold deaths and makes plants more drought resistant.
What the *** aren’t we giving CO2 the Nobel Peace Prize!
According to Weatherzone July was the worlds hottest month eva. This differs from the graph that we we saw of July on this blog. The amount of propaganda in the main stream media lately, shows clear signs of desperation.
https://www.weatherzone.com.au/news/july-was-earths-warmest-month-on-record-/534792
In terms of extreme hot temperatures… this year was not even close to the extreme heat waves of the 1920’s and 1930’s where large areas (dozens of States) were above 100° F for weeks at a time…several times. Nothing remotely approached that kind of punishing heat this summer.
Tornadoes-
“With increased National Doppler radar coverage, increasing population, and greater attention to tornado reporting, there has been an increase in the number of tornado reports over the past several decades. This can create a misleading appearance of an increasing trend in tornado frequency. To better understand the variability and trend in tornado frequency in the United States, the total number of EF-1 and stronger, as well as strong to violent tornadoes (EF-3 to EF-5 category on the Enhanced Fujita scale) can be analyzed. These tornadoes would have likely been reported even during the decades before Doppler radar use became widespread and practices resulted in increasing tornado reports. The bar charts below indicate there has been little trend in the frequency of the stronger tornadoes over the past 55 years”
https://www.ncdc.noaa.gov/climate-information/extreme-events/us-tornado-climatology/trends
Hurricanes-
“NOAA’s Geophysical Fluid Dyamics Laboratory (GFDL): “Leaders in Climate Model Development and Research.” See their website.
For about a decade (or even longer), GFDL has annually updated their statement on hurricanes and climate change. This excerpt from their 15 August 2019 update lists some of their negative findings about current hurricane activity.
“We find that, after adjusting for such an estimated number of missing storms, there remains just a small nominally positive upward trend in tropical storm occurrence from 1878-2006. Statistical tests indicate that this trend is not significantly distinguishable from zero. In addition, Landsea et al. (2010) note that the rising trend in Atlantic tropical storm counts is almost entirely due to increases in short-duration (<2 day) storms alone. Such short does not provide compelling evidence for a substantial greenhouse warming-induced long-term increase.“-lived storms were particularly likely to have been overlooked in the earlier parts of the record, as they would have had less opportunity for chance encounters with ship traffic. …
“The evidence for an upward trend is even weaker if we look at U.S. landfalling hurricanes, which even show a slight negative trend beginning from 1900 or from the late 1800s. …
“While major hurricanes show more evidence of a rising trend from the late 1800s, the major hurricane data are considered even less reliable than the other two records in the early parts of the record. …
“In short, the historical Atlantic hurricane frequency record
This article only looks at TCs for the months of Jan to Jul
When peak TC frequency comes in Aug and Sep
However I expect there to be a similar flat trend.
From IPCC AR6 Summary for Policymakers
“It is likely that the global proportion of major (Category 3–5) tropical cyclone occurrence has increased over the last four decades, and the latitude where tropical cyclones in the western North Pacific reach their peak intensity has shifted northward; these changes cannot be explained by internal variability alone (medium confidence). There is low confidence in long-term (multi-decadal to centennial) trends in the
frequency of all-category tropical cyclones.”
The changes come in intensities.
These relating to SSTs.
TCs in general in the Pacific are influenced by the ebb and flow of the ENSO regime.
But there are places where they run into waters that are somewhat divorced from it.
Vis:
https://www.researchgate.net/publication/307867326_Intensification_of_landfalling_typhoons_over_the_northwest_Pacific_since_the_late_1970s
“In summary, our analyses of TC data sets from independent
operational agencies show that typhoons that make landfall have
significantly intensified since the late 1970s owing to strengthened
intensification rate. The increase in intensification rate is in turn
due to enhanced SST warming in a band off the coast of East and
Southeast Asia. Our results hence reveal the critical role of local
SSTs in typhoon intensification, and suggest the importance of the
SST change pattern for regional changes in typhoon intensity in a
warming climate”
The energy for a hurricane does not come from the sea surface temperature, it comes from the difference between the SST and the air temp. Basic thermodynamics (I taught Thermo at a major university for years). All mechanical energy, like wind energy, is a function of the DIFFERENCE between a high temperature and a lower temp reservoir – look up Carnot’s Law. Since lower tropospheric temps are rising faster than SSTs (the ocean’s thermal mass exceeds the atmosphere’s by a factor of ~3000 so the ocean takes much longer to heat up) there’s less energy available for hurricane winds, not more.
In response to several commenters below, the slightly declining trend in typhoon frequency over the past 70 years (from a linear regression) may not be statistically significant if there are large short-term variations on either side of the trendline, and a low R-squared value.
But those that are now protesting the apparent declining trend in typhoon frequency due to a low R-squared value would be the first to trumpet an increasing trend, even if it had a lower R-squared value, while skeptics would be hard-pressed to say that it was statistically insignificant. What IS clear from these data is that typhoon frequency has not increased over the past 70 years, despite all the extra CO2 in the air.
We see the same kind of cherry-picking data manipulation when it comes to sea-level rise. If someone finds a data set of sea-level heights at a given location where there seems to be a short-term acceleration (where the rise rate is higher later in the period than earlier), alarmists are quick to point out the acceleration and extrapolate to a huge sea-level rise by 2050 or 2100.
But then, when new data points come in a few years later showing a deceleration, the alarmists are silent. For sea-levels as a function of time, the R-squared values for linear regressions are usually better than 0.90, and there is not much improvement for quadratic regressions. But linear regressions of sea levels are not scary, so the alarmists love quadratic regressions, until the t-squared coefficient (acceleration) turns negative…
Probably, most people living along the east coast of Asia hate typhoons, except for climate scare-mongers, who love them to prove a point.
Good points!
(sotto voce:
Hint, First line posts entered in the top comment entry drop to last position by time submitted.
Replies to comments also drop to last position by time submitted, but stay within the comment reply boundaries to which a reply is entered.)