Guest Post by Willis Eschenbach
Back in 1987, V. Ramanathan noted that we can measure the very poorly named “greenhouse effect”. This effect has nothing to do with greenhouses. Instead, what happens is that some of the upwelling longwave radiation from the surface is absorbed by “greenhouse gases” in the atmosphere, mainly CO2 and H2O. This absorbed energy, of course, is added to the thermal energy in the atmosphere, which is then radiated again with about half going to space and about half going back to the ground.
What Ramanathan noted is that to calculate the size of the “greenhouse effect”, you simply subtract the longwave emitted to space at the top of the atmosphere (TOA) from the longwave emitted upwards at the surface. Here’s Ramanathan’s drawing of the concept:

Figure 1. Drawing by Ramanathan showing upwelling surface longwave of 398.6 watts per square meter (W/m2), TOA radiation to space of 267.5 W/m2, and atmospheric absorption (greenhouse effect) of 131.1 W/m2. Note that Ramanathan has also calculated the absorption as a fraction of surface radiation (0.334, or 33.4% of radiation absorbed).
The use of a percentage to measure the “greenhouse effect” eliminates one of the variables. Where it is warmer the ground emits more radiation, so naturally more will be absorbed by the atmosphere. That means if we want to compare different areas of the earth, we need to use percentages instead of absolute values. Below are two graphs showing the percentage of the upwelling surface longwave radiation absorbed by the atmosphere, shown from two opposite sides of the planet.


Figure 2. Percentage of upwelling longwave absorbed by the atmosphere, Pacific-centered and Atlantic-centered.
There are a few things of interest here. First, where it’s very cold, almost no upwelling longwave is absorbed by the atmosphere. Second, in the cloudy areas around the equator, about half of the upwelling radiation is absorbed. Third, you can see the Gulf Stream along the east coast of the US …
Much is made by climate alarmists of the fact that the percentage of the upwelling surface radiation absorbed by the atmosphere is increasing. This indeed shows that the greenhouse effect is real … but it shows nothing about whether that affects the temperature. Figure 3 shows the rate of increase.

Figure 3. Change in absorbed upwelling surface radiation from March 2000 to February 2021.
Now, I entitled this post “A CO2 Puzzle”, and true to my word, here it is. The increase in the absorbed upwelling radiation is supposed to be from the increase in CO2 … but in fact, the increase in absorbed upwelling longwave is slightly less than half of what we’d expect from CO2. And that’s without the claimed increases in absorption due to methane and other minor greenhouse gases, from”water vapor feedback”, and from “cloud feedback”, all of which are said to increase the slope of the trend in absorption.

Figure 4. As in Figure 3, but also showing the expected trend from the increase in CO2 over the period.
So there’s the mystery. Between CO2, methane and minor greenhouse gases, water vapor, and cloud feedback, the percentage absorbed should be increasing far faster than it actually is … why isn’t it?
And what is the answer to the puzzle? I don’t know, other than to note that as I’ve pointed out in a number of contexts, emergent climate phenomena act to minimize factors that tend to warm the earth. However, I have no idea exactly what is occurring here, all suggestions welcome.
Me, I’m currently in Florida with my gorgeous ex-fiancee, enjoying the rain, the sunshine, and the pleasant and friendly people here. Our profound thanks to the most interesting and kind WUWT folks who have hosted, educated, and entertained us on our peregrination, you know who you are, much appreciated.
My best to everyone from the land of oranges and bikinis …
w.
PS—Two things. First, I implore you not to turn this into a discussion of whether a cold object can warm a hot object, or whether the greenhouse effect is real. There are plenty of places for you to have those discussions. This is not one of those places, and I will snip comments that go over the line. And please, if you get snipped, don’t whine about censorship or the like. It is merely my effort to keep the conversation focused on the topic of the post, you’ve been asked in the strongest terms to stay away from those topics, and if you don’t, it’s on your head, not mine. Oh, and please, leave out the politics … there’s plenty enough division of opinion in the climate world, no need to increase it by including politics.
Second, as always, I request that you quote the exact words you are discussing, so that all of us can understand just who and what you are referring to.
Willis, what your data shows is that the temperature rise since 2000 is less than half what is being claimed, but I’ll get to that later.
Point 1: The data in Figures 3 & 4 have too much noise to give a reliable trend. You need at least 50 years of data to see any trend when it comes to any climate data because the natural variation is so big.
Point 2: What the data does tentatively show is that the % of upwelling radiation absorbed from 2000 to 2020 increased by about 0.2% when about 0.4% was expected or predicted. The radiation leaving the TOA cannot change (unless heat is absorbed by the oceans) because it must balance what is coming in from the Sun. So the upwelling radiation must increase by about 0.8 W/m^2 to account for this 0.2% increase in absorption/reflection in the atmosphere.
A 0.8 W/m^2 increase in upwelling radiation at the surface must be due to an increase in mean temperature at the surface, and that temperature increase must be 0.15°C according to the Stefan-Boltzmann equation.
So what this shows is that surface temperatures can only have increased by 0.15°C since 2000 and not the 0.3°C claimed or predicted. Basically, it shows that warming is less than half what is claimed. This ties in with what I have found on my blog, where most of the data I have analysed show no warming before 1980 and only about 0.5°C thereafter.
So I would argue that CO2 is only half as powerful at creating global warming as is being claimed by climate scientists.
I would suggest the right conclusion would be more like “The temperature has only risen by half the amount claimed by so-called “climate scientists” due to their data being crap and their “adjustments” making it worse instead of better.” And, draw no conclusion regarding CO2 having any effect whatsoever, since CO2 has never been empirically shown to “drive” anything.
Willis, nice to see that it seems you appear to be finding that radiative theory poorly explains surface temperatures…
It’s also not CO2. Intensity of that back radiated energy is weak.. .equivalent to -80C, so it’s hardly going to warm anything in the atmosphere 10km up where there are so few particles to thermalise.
A better explanation is to observe moves mass and creates pressure.
https://reality348.wordpress.com/2021/07/09/all-ye-promoters-of-erratic-sources-of-energy-come-now-repent-and-be-forgiven/
I’m very puzzled. At equilibrium, the outgoing energy must equal the incoming energy. According to Figure 1, we have 131W/m2 excess heating being trapped in the lower atmosphere, which would fry us very quickly. The Watt is a unit of power remember. There is something very wrong in the reasoning there.
I also don’t understand the low percentage of “upwelling” long wave being absorbed by the atmosphere. Even Arrhenius found the IR absorption of the atmosphere was 80-odd percent and not the 38.4% measured here. Later physicists e.g. Happer have found even higher values.
I would also like to add that “upwelling” is a strange term to use in relation to radiation. “Upwards directed”, or similar, would be better. “Upwelling” makes it sound like convection.
I didn’t see your post. I have the same question
It seems to me that there is an obvious semantic issue with Willis E.’s use of the terms “absorption” and “percentage absorbed”. In Eschenbach’s/Ramanathan’s Figure 1, the 131.1 Watts (or 0.334 fraction of the ground radiating number), is actually, specifically, the back radiation amount, *not* the total amount absorbed by the atmosphere! In other words, this is the amount of heat power per square meter, that keeps looping around (in this simple radiative model), so that it never reaches the upper “to space” radiating layer.
Since it is indicated elsewhere in this discussion that about as much heat is radiated up from the middle of the troposphere as down, this would imply that another 131.1 Watts is being radiated *up* from this essential “middle” atmospheric layer too, along with the 131.1 that is ‘back’ radiation (looping down, then back up from the ground again). Since it’s a simple model, one would think this middle layer is what we’re looking as the absorbing atmosphere as such, with 131.1 x 2, or 262.2 Watts/square meter being absorbed altogether, and the same amount splitting into the two parts, upwelling and downwelling, for 131.1 Watts up, and 131.1 Watts “back radiation” going down. So to put it another way, the true fraction of absorption, on a consistent denominator, ought to be not 0.334, but rather 0.334 x 2 = 0.668, getting pretty close to your “Arrhenius found .. 80-odd percent” number.
Maybe it’s a quibble, but it sure would help general comprehension if the percentage of “back” power (or downwelling heat power) were labelled that way, as “downwelling”, instead of being denoted as “amount absorbed”. Also, it’s maybe not that much of a mystery that putting in ’emergent’ ways of ‘looping’ more heat power around, *would* substantially change this kind of model, for one thing complicating it and making harder to visualize the proper outcome?
The right half of this diagram might explain it it better. The 131 W/m2 is I think supposed to be the difference between the 396 W/m2 emitted at the surface and the 239 W/m2 that finally makes it out to space, but actually the difference is 157 W/m2. The diagram is taken from Trenberth’s 2012 paper. See
https://climatescienceinvestigations.blogspot.com/2020/06/13-earths-energy-budget.html
for more discussion.
The problem is that the situation is complicated by the top of the atmosphere absorbing radiation direct from the Sun, as do the clouds. So most of the radiation emitted back into space comes from there, as well as via thermals and evapo-transpiration.
If you look at the balance between upwelling surface radiation and downwelling radiation, you can see that 89% is reflected back.
That diagram has the total outward radiation almost exactly in balance with incoming radiation.
101.9 reflected + 238.5 outgoing longwave = 340.4 W/m2 outgoing radiation
Almost exactly the same as the incoming radiation of 341.3 W/m2, the difference of 0.9W/m2 is presumably what is supposed to be warming the planet.
So that diagram makes sense, Figure 1 does not.
(As an aside is it conceivable these figures can be obtained with sufficient precision to derive that 0.9W/m2 subtraction difference with any confidence? I really suspect not.)
The 0.9 W/m2 is indeed what is supposedly warming the planet, or more specifically, it is the energy that heats up the ocean surface and is retained as specific heat in the sea water.
As for the accuracy of the numbers, there are other papers with different numbers. In fact between 1997 and 2012 Trenberth and co-workers published at least 3 papers with slightly different numbers, and in 2012 Stephen et al. also published a paper with a slightly different set of numbers. I have listed them here with their diagrams
https://climatescienceinvestigations.blogspot.com/2020/06/13-earths-energy-budget.html
The numbers at the top of the atmosphere should be more reliable as they are (in theory) directly measurable by satellite and space telescope, but even here the disagreement between papers and authors can be up to 5 W/m2. The rest of the numbers look like best guesses and could be in error by up to 15 W/m2.
I am feeling really stupid. My intuition is that in equilibrium radiation in equals radiation out. If the atmosphere is constantly absorbing more radiation than is leaving, energy in the atmosphere should be continuously increasing. Something seems off to me.
See the diagram in this comment that I posted above.
Radiation in does equal radiation out.
The problem is Fig 1 is wrong, or at least oversimplified. The 267.5 W/m2 is an overestimate (it should probably be 239 W/m2) and two radiation flows are omitted: the radiation absorbed by the atmosphere direct from the Sun and via thermals, and the downwelling radiation.
So, in summary, we can have no confidence in the author if he can’t even get those things right.
There is a problem here. As CO2 only absorbs at frequencies equivalent to 800, 400, and -80 deg C, it can absorb only -80 deg C IR radiation most of the time, mainly at night. Any downwelling IR would be instantly reflected. I do not see how this purported energy flow works.
Only during sunlight would the higher two absorptions be active and they would be saturated and effectively have no effect, except maybe redirecting some insolation to space before getting to the surface, i.e., cooling things.
Agree. No way that atmospheric CO2 can turn infrared energy from Earth’s surface back into surface heat, threatening runaway global warming. The disproof of is that CO2’s radiation absorption/emission wavelength of 15 microns has a Planck radiation temperature of -80C, colder than dry ice, hence it can’t melt an ice cube much less cause heatwaves, drought, famine, etc. Instead, 15 micron radiation from the surface is absorbed and reemitted repeatedly by atmospheric CO2, with some eventually bouncing harmlessly off Earth’s surface without heating anything, until it’s all finally dispersed harmlessly by entropy.
How big is the correlation from Fig 4 to temperature?
https://www.woodfortrees.org/plot/uah6/from:2000
Should be quite high.
Very indicative that temperature drives LWR “absorption” and not the other way around.
Might Nikolov and Zeller be right in the end?
Correlation with temperature is about 0.31, fairly low. And N&Z are absolutely wrong.
w.
As that may well be, the note that the “extra” LWR measured just could reflect the temperature of the system as with every other object and has nothing to do with the so-called greenhouse effect is not far fetched.
It would explain together with water vapor the recorded phenomenon.
And the correlation is still far better than with CO2.
[Snipped. Why is it so hard for some people to take a hint?]
WV has also been measured since Jan 1988 by NASA/RSS using satellite instrumentation. They claim the accuracy of their Total Precipitable Water (TPW) measurements to have RMS accuracy of “about 1 mm” (in about 29 mm).
Why is so hard for some people not to understand the reality rather than a belief in a silly idea.!
\
Lack of formal training.
Well at least they are now admitting that the hypothesis is not supported by the observations, and now it’s a “mystery” as to why.
And we were told that the hypothesis is as provable as 1+1=2!
It won’t be long now until some reality sets in and the paradigm is shifted back to a physics supported theory, probably in the timeline of 12,11,10,9 years or whatever it is down to now.
Part of the energy goes into wind and oceanic currents.
Those would be converted into heat and contribute to the radiated energy. Some of the energy is stored as plant matter via photosynthesis. If there has been a net gain of plant biomass that would represent stored energy that is not re-radiated on a short time scale.
Hi Willis
I look at your Fig 2 above which shows percentage of up welling, and then have to ask how does this fit with this chart you presented in an earlier post using CERES data over the same period.
Kind regards
From this post
https://wattsupwiththat.com/2018/03/24/where-the-warmth-is/
I don’t know if this is relevant to the question but it could be. Also, while I’ve seen it proclaimed in various posts, I don’t know if it is true, or perhaps don’t know how true it is.
One evidence of the greenhouse effect is said to what an IR thermometer measures when pointed at the clear night sky: something like -60 or -65 degrees C. Without the greenhouse effect, says the claim, the measurement should be the general background temperature of space: very much colder.
The possibly true, possibly relevant information I mentioned is that somewhere around -60 C is the temperature of CO2 emissions in its main emission band. From this it is inferred that CO2 at higher temperatures, such as almost everywhere in the lower atmosphere, does not radiate IR, thus it does not warm the surface or much of anything else near the surface.
I do know that, as a general observation, elements in stars and interstellar gas clouds are identified by their emission and/or absorption spectra. Their temperatures are also measured that way. Aren’t the satellite measurements of atmospheric temperature done through detection of the spectra, or certain parts thereof, of O2 (somewhere in the microwave region)?
Admittedly it seems like something too obvious to be overlooked, but if IR absorption at various frequencies is also temperature dependent, then might CO2 not be meeting someone’s expectations simply because they have ignored that limitation in making their calculations? Higher or lower frequency IR just isn’t absorbed by CO2 in the atmosphere.
Another possibility that comes to mind, perhaps not carefully enough thought through, is that since the average length of time that any CO2 molecule retains an absorbed IR molecule is very short, half of the absorbed IR being emitted more or less immediately skyward might produce that apparent 50% absorption deficiency.
Andy, it’s not true that the main CO2 absorption band is at -60°C. Here’s the graph from MODTRAN.
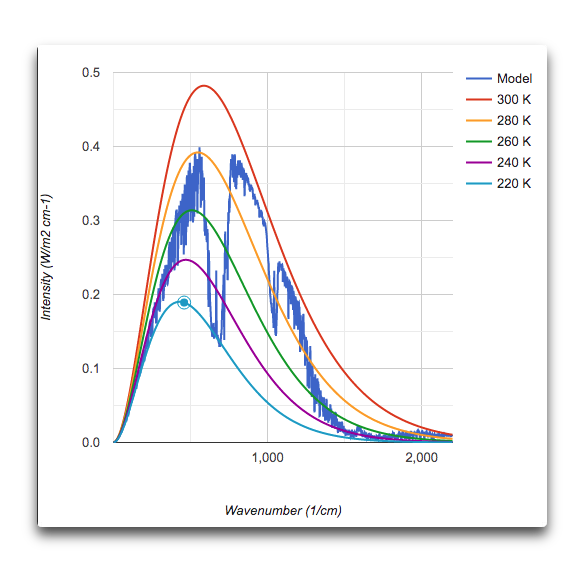
At -60 it absorbs very little (lowest colored line)
w.
@AndyHce
IR absorption and emission from CO2 occurs at any temperature. But absorption is greatest when the peak in the black body spectrum coincides with the centre of the absorption band. The same is true for radiation.
Look at the MODTRAN figure Willis posted in his reply above. Specifically look at the blue Model curve. This is a model of the radiation output of Earth as seen from space. The emission spectrum (called Model) is close to a black body spectrum with a temperature of about 289 K indicating that the radiation comes from the surface of the Earth. The big dip at 660 wavenumbers is because surface radiation at these wavelengths is absorbed by CO2 in the atmosphere. However, there is still some emission at the bottom of this dip corresponding to black body emission from an object with a much lower temperature of 220 K (-53°C). This is IR emitted by CO2 at the top of the atmosphere (tropopause) where the temperature is about -50°C.
Just how are emissions from the surface measured?
See here for the details.
w.
Long time reader but first time poster.
I briefly replicated Willis’s graph and although I got marginally different results, the general trend appears correct. What Willis has neglected to point out however, is that the CERES data clearly shows the cause of the change.
The outgoing LW radiation at the top of the atmosphere (TOA) has actually increased somewhat over the past 20 years (contrary to the implication in Willis’s post and popular belief), but it is the greater increase in upward surface radiation that has driven the change. See graph below of my calculation of the long wave radiation anomalies in Watts per square metre.
The surface radiation is pushing this extra heat upward but the TOA cant keep up!
The driver of this increase in LW surface radiation – as the CERES data clearly shows – is that the net top of atmosphere SW radiation has increased dramatically. More solar radiation is hitting the earths surface and being absorbed rather than being reflected by clouds, aerosols, ice and the like.
As an engineer with a lot of experience in root cause analysis, it is pretty clear to me from my limited investigations (which could be in error?) that the presumption of the post – that the greenhouse effect is driving the changes – is not correct. Sure the greenhouse effect is limiting the flow of this extra energy up through the atmosphere, but it is not the root cause of the problem.
Can’t say I know the field, but your response seems the most compelling to me, at least if you’ve characterized the data correctly.
The graphs like above show instantaneous flows. There are a few instances where the radiation flows from the surface equal the radiation flows from the TOA. It can’t be right that the differences accumulate in the atmosphere through time. So If I could integrate the differences through time, what meaning if any would the value obtained have?
It is ….
https://www.pnas.org/content/111/47/16700
“The greenhouse effect is well-established. Increased concentrations of greenhouse gases, such as CO2, reduce the amount of outgoing longwave radiation (OLR) to space; thus, energy accumulates in the climate system, and the planet warms. However, climate models forced with CO2 reveal that global energy accumulation is, instead, primarily caused by an increase in absorbed solar radiation (ASR). This study resolves this apparent paradox. The solution is in the climate feedbacks that increase ASR with warming—the moistening of the atmosphere and the reduction of snow and sea ice cover. Observations and model simulations suggest that even though global warming is set into motion by greenhouse gases that reduce OLR, it is ultimately sustained by the climate feedbacks that enhance ASR.”
And:
https://news.mit.edu/2014/global-warming-increased-solar-radiation-1110
“So there are two types of radiation important to climate, and one of them gets affected by CO2, but it’s the other one that’s directly driving global warming — that’s the surprising thing,” says Armour, who is a postdoc in MIT’s Department of Earth, Atmospheric and Planetary Sciences.
Yes Anthony, I read that paper some time ago and dismissed it, but I took time to re-read it to refresh. For posterity, I’ll make 3 points here, although it is difficult to properly evaluate their findings without the data.
Firstly, the OLR recovery found in the report using the models takes “decades” to occur. In “some models, the OLR response is much slower”. The transition “may occur by the middle of the 21st century”. In other words, they could not make their models replicate what we have seen in the CERES data 15-20 years ago. Further, the cloud feedback they assume is based on absorption of solar radiation by increased water vapour above the cloud cover. The NOAA data I have shows that the specific humidity around the 300mb level is significantly lower in the last 20 years than in most of the preceding 50 years, but hey, I could be wrong? Only the surface humidity has risen appreciably, as would be expected in a warming world.
Secondly, during my engineering career I reviewed numerous FEA models established by PHD qualified engineers. FEA (finite element analysis) is a respected bunch of programs that provide structural stress calculations in 3D format. The programs are highly respected because the results from the various programs always give results within a few percent of each-other and hand calculations. On more than one occasion I sent the results back because the results were not what I expected with hand calculations. Invariably I found that the boundary constraints used were wrong or some other issue.
The models that the MIT scientists have used are not to be respected because – by and large – they do not produce results that are consistent with each-other or the real world. And PHD qualified scientists can feed in the wrong constraints.
Thirdly, in the real world, engineers who develop cars that are reliable and bridges that don’t fall down solve problems using root cause analysis and/or failure mode analysis (FMECA). These are methods where engineers start from scratch, with an open mind, and brainstorm to find likely causes of symptoms, looking for cause and effect timescales, evaluating likelihood to find the root cause(s). What the climate scientists are doing (including the MIT scientists) is the opposite – they assume a cause and come up with an unlikely explanation as to why it could be true.
Scientists have largely ignored (or under-estimated) the real changes over the past few hundred years – eg. cutting down at least 20-30% of the worlds forests, which must hugely affect atmospheric aerosol loadings and resultant cloud nucleation, or reductions in the earths magnetic field strength. Over the past 40 years huge movement in the north magnetic pole is sure to have made substantial changes to ocean currents in the northern hemisphere, and possibly even southern oscillation? Changes in the solar cycle are sure to have made some change. There will probably not be one root cause, there are many roads that lead to Rome. The best data we have available however (the CERES data) does not clearly point to CO2 as being a root cause, despite the MIT’s convoluted conclusions.
Willis:
You say “However, I have no idea exactly what is happening, all suggestions welcome”
As I have told you before ,Earth’s climate is TOTALLY controlled by varying amounts of SO2 aerosols in the atmosphere, of either volcanic or industrial origin (plus some natural warming as Earth recovers from the LIA cooling, primarily due to albedo changes).
Every increase or decrease in average anomalous global temperatures can be associated with an increase or decrease in SO2 aerosol levels. There is no indication of any temperature change due to greenhouse gasses, cycles, sunspots, or changes in solar irradiance.
Again, see my article
https://www.skepticmedpublishers.com/article_in_press_journal_of_earth-science-and-climatic-change/
And if you (or anyone else) disagrees with it in any way, please state your specific objections.
In response to why “percentage absorbed should be increasing far faster than it actually is” First realize that the population of WV molecules declines on average about 1200 to 1 from surface to tropopause. This huge gradient allows much of outward directed radiation from WV molecules to make it all the way to space.
Radiation absorbed by CO2 molecules is (within nanoseconds) shared with surrounding molecules because relaxation time is orders of magnitude longer than the sharing time. This warms the atmosphere. The ghg in the warm gas radiate according to the gas temperature and characteristic wavelengths for each specie. By far most of the radiation at low altitude comes from the 24 times plentiful WV molecules. Thus much of the radiation energy absorbed by CO2 molecules gets ‘redirected’ to WV molecules which radiate it to space. Therefore the added CO2 is less of an impairment to radiation than it would otherwise be.
This article is corroborative of the analysis at http://globalclimatedrivers2.blogspot.com
The object is to determine total heat out versus total heat in so I trust the % calculation of watts/sq.m has been adjusted for surface area difference at the points of measurement.
Indeed, all the calculations are area-adjusted.
w.
Forget CO2. Just concentrate on atmospheric water. Water vapour above 45mm cools the oceans. Water vapour less than 45mm warms the oceans. So simple. CO2 has no direct role in the energy balance; indirect role through altering the biosphere. You are simply confusing the picture by bringing CO2 into the energy balance.
“Much is made by climate alarmists of the fact that the percentage of the upwelling surface radiation absorbed by the atmosphere is increasing.”
If you have a situation where a cold gas increases it´s heat absorption from a warm body, it leads to more cooling of the warm body.
Do you know how to increase the cooling of a water-cooled engine? By increasing the amount of heat absorbed by the water.
Tell me, why would the atmosphere work in the opposite way?
But more by increasing the amount of heat being transferred out of the system (to the atmosphere) at the radiator
“This absorbed energy, of course, is added to the thermal energy in the atmosphere”
Yes. And it´s subtracted from surface emission. The surface emits 390W/m^2 and it transfers 390-240=150W/m^2. In total that´s 390+150=540W/m^2 of thermal energy going out from the surface. If there was no atmosphere there would be no transfer, all 540W/m^2 would be emitted from the surface as radiation. Which means that the surface is cooler when there is an atmosphere than it would be without it. Which is an obvious fact since it has been known for hundreds of years that cold heat absorbing air cools warm bodies.
The surface only emits 390 W/m2 because of the contribution of downwelling radiation. Without it the surface would emit the same amount of energy that it absorbs: 161 W/m2.
Even if there was no atmosphere it could only absorb a maximum of 341 W/m2 direct from the Sun, assuming the albedo is zero. Again it would have to emit the same amount of energy as it absorbs.
If the albedo of the surface is 0.13 (which it is), it would absorb even less: 298 W/m2.
possibile che la terra sia un “sistema chiuso” e non ci sia interazione con lo spazio esterno? mi sembra di aver letto che a causa del vento solare viene asportata parte della nostra atmosfera, quindi la terra non potrebbe cedere del calore allo spazio che ci circonda?
‘is it possible that the earth is a “closed system” and there is no interaction with outer space? I seem to have read that due to the solar wind part of our atmosphere is removed, so the earth could not give heat to the space that surrounds us?’
wrong mechanism.
here is the best explanation
Thanks, Steve, hope you are well.
While that was indeed fascinating, I fail to see how it relates to the issue I pointed to above. My point was that the change in “greenhouse forcing” over the period was only about half of the theoretical change in greenhouse forcing due to CO2 alone, much less that theoretically due to CO2 + “H2O feedback” + minor GHGs + “cloud feedback”.
Also, the amount of energy radiated by the planet is NOT a simple function of GHG levels or raising the effective radiation level as Pierrehumbert so confidently asserts. Instead, it is a function of:
GHGs as Pierrehumbert says, PLUS
Atmospheric absorption of solar energy
Atmospheric absorption of latent energy from the surface
Atmospheric absorption of sensible energy from the surface
Amount of energy which bypasses the GHGs via thunderstorm deep convection
Amount of energy reflected by variable cloud albedo
Changes in the nature and composition of the clouds
Changes in the timing of emergence of the clouds
Changes in the mechanical transport of heat from the surface to the atmosphere (e.g. dust devils, wind speeds, tornados, thunderstorms, the El Nino)
Amount of advection of energy from warm areas, where much of it is absorbed by GHGs, to cold areas where there is little absorption.
So to claim that it is all simple, or to say that it is a slight oversimplification as Pierrehumbert does, is a scientific lie. It is not that simple in the slightest, and to misquote the Bard, “There are more processes in heaven and earth, Steven, than are dreamt of in Pierrehumbert’s philosophy”.
My very best to you and yours,
w.
Quite interesting, but it could all get very complicated? At the same time, simple back radiation models are really way more complicated than they look too?
The interesting thing here is that there seems no sure way to decide if it’s the upper emission layer’s shedding of heat out to space that forces the earth’s temperature one way or the other, *or* if it is in fact the greenhouse effect sending heat back to the ground that determines things (with the upper emission not being the primary cause of anything, but instead just tagging along behind the greenhouse effect as such)?
Just typical with climate theory, just when you think the horse is pulling the cart, maybe the cart has a motor, and is pushing the horse.
“ the greenhouse effect sending heat back to the ground that determines things”
The piece I keep missing is that if the heat coming back actually heats the earth then the earth will radiate *more*, not the same. As it radiates more the radiation leaving the system to space should be going up.
But I never see anyone trying to explain this. It just seems like everyone assumes the earth gets hotter and hotter but never increases the radiation it sends spaceward.
Well, the back radiation can’t actually add anything to the heat input overall, since the atmosphere can’t generate any IR energy from scratch. So if I’m understanding you right, that would imply that you are definitely wrong or misinterpreting the idea of back radiation. In principle, this back radiation in itself is supposed to just raise the surface temperature, without actually making the earth any hotter in terms of the overall emission of heat infrared.
Having said that, as usual there’s a complication to consider. We depend on the clouds, or cloud albedo, to reflect away a quite large amount of the solar light, and/or short wave solar input (this is before that sunlight ever gets converted to long wave infrared as such). So if you by chance had clouds in mind, and were thinking that making the clouds more ‘open’ to incoming sunlight, lowering the earth’s albedo, could be a key to really warming the whole earth overall, *then* you might easily be right about *that*.
“In principle, this back radiation in itself is supposed to just raise the surface temperature, without actually making the earth any hotter in terms of the overall emission of heat infrared.”
And just how is this supposed to happen? Radiation from a source is based on its temperature. Make the source hotter and it radiates more. Make the source cooler and it radiates less.
You lose any sense of what is actually happening when you base all your analyses on the daily mid-range temperature and ignore the time-varying temperature curve.
If the atmosphere is an insulator, slowing the loss of heat, then it also slows the gain of heat from the sun. Just like a blanket on top of you in bed. It slows the loss of heat to the surrounding environment when there is no external heat source. But that is also a two-way street. Set up a propane heater blasting heat toward you and blanket and the blanket will slow the gain of heat you experience. You see higher minimum temps when the heat source is off and lower maximum temps when the heat source is on.
Thus in terms of the earth, we should see lower maximum temps as the atmosphere insulates us from the sun and should see higher minimum temps as the atmosphere insulates us from space. And that is exactly what we are seeing around the globe, lower maximums (i.e. lower cooling degree-day values) and higher minimums (i.e. lower heating degree-day values).
The only thing left is HOW the insulating atmosphere works as an insulator. Are clouds the primary insulator? Is CO2 the primary insulator? Is radiation the primary mechanism? Is conduction/convection the primary mechanism? Or is it a combination of all of them?
And, as Freeman Dyson asked so long ago, what is the holistic impact on the system. Is lower maximums and higher minimums actually beneficial? Mid-range temps won’t tell you anything holistically.
steven,
Thanks for the clear, simple and concise video. Do you know if Dr. Pierrehumbert has ever likewise (clearly, simply and concisely) addressed the non-existent tropospheric hot spot that consistently manifests itself in the GCMs?
PS – Not my downvote.
Something doesn’t add up for me. Through geologic time there is almost no correlation between CO2 and surface temperature. Why isn’t it the case that minor changes in convection more than offset any impact of changing greenhouse gases. I have always thought that instantaneous to a CO2 molecule absorbing a photon that the molecule moves higher in the atmosphere as vibration occurs. Isn’t this what Einstein said in his 1917 paper. I just don’t see how you can separately solve radiation effects from convection. Also, the height of the Troposphere is constantly changing, and hence Troposphere is constantly changing. If the story told in the video is right (and complete), there should a way to measure that constantly increasing radiating height of the atmosphere. Is there such a measure?
You need to think the other way around:
The ”percentage of upwelling surface longwave absorbed by the atmosphere” obviously increases with temperature.
Temperature is the primary driver for the increased CO2 concentration in the atmosphere.
Therefore the upwelling longwave radiation should increase in relation to the increase in temperature NOT to the increase in CO2.
That is what can be seen in the figure between year 2000-2020 and explains the poor correspondance to the theoretical CO2 forcing.
No answer here; I’d say the best so far came from Engineer Dave.
But I have an additional question (which may make things worse). Why are you using the forcing value (3.7 W/m^22 per 2xCO2) for the greenhouse effect? I would have thought forcing and greenhouse effect are different animals.
Specifically, I had thought that forcing is a top-of-the-atmosphere thing, while, if we assume (apparently contrary to fact according to Engineer Dave) that the emission temperature remains approximately fixed, the greenhouse effect is basically a surface thing.
That would imply that the greenhouse effect corresponding to a 3.7 W/m^2 forcing would be more like 5.4 W/m^2.
Specifically, let’s say that from equilibrium we instantly double CO2 concentration and thereby instantly raise the effective emission altitude. Lapse rate being what it is, this (temporarily) reduces the emission temperature enough to reduce emission out to space by 3.7 W/m^2. Let’s call that difference–and thus the increase in temperature difference between the surface and the emission altitude–1°C.
If no more greenhouse gas is added, the emission altitude and thus the temperature difference between the surface and emission altitudes remain unchanged (in our hypothetical). But in the fullness of time the surface temperature increases by 1°C in order to restore the emission-altitude temperature to the (equilibrium) value it had before the emission altitude increased.
So after a transient excursion the emission at the top of the atmosphere returns to its equilibrium value, but the 1°C change at the surface has increased its emission by, say, 5.4 W/m^2. The greenhouse effect is therefore 5.4 W/m^2, i.e., more than the 3.7 W/m^2 transient change of which I had thought forcing is the measure.
Wouldn’t that mean you should have used 5.4 W/m^2 instead of 3.7 W/m^2?
The highly nonlinear nature of the radiation over time is far more interesting than the meaningless linear trend, which will be highly sensitive to the chosen interval.
Willis, on earth.nullschool.net it’s possible to plot the geographically distributed CO2 concentration.
Should there be a correlation between this and TOA radiation, according to the GH theory, and if so, is it possible, using your programming and data processing skills, to find one?
https://earth.nullschool.net/#current/chem/surface/level/overlay=co2sc/orthographic=-40.51,-8.02,185
I have a question about the “two graphs showing the percentage of the upwelling surface longwave radiation absorbed by the atmosphere.”
What is the time frame of the measurements that these charts are based on?
Is this a cumulative total over a year? All available data? Some particular instantaneous measurement on some specific day?
Sorry if this is common knowledge or it says so somewhere here.
Hey, Nick, good questions. They are global area-weighted monthly averages from 03/2000 to 02/2021 based on CERES satellite observations.
w.