Reposted from NOT A LOT OF PEOPLE KNOW THAT!
JUNE 14, 2021
By Paul Homewood

The rate of sea-level rise in the 20th century along much of the U.S. Atlantic coast was the fastest in 2,000 years, and southern New Jersey had the fastest rates, according to a Rutgers-led study.
The global rise in sea level from melting ice and warming oceans from 1900 to 2000 led to a rate that’s more than twice the average for the years 0 to 1800 – the most significant change, according to the
study in the journal Nature Communications.
The study, for the first time, looked at the phenomena that contributed to sea-level change over 2,000 years at six sites along the coast (in Connecticut, New York City, New Jersey and North Carolina) using a sea-level budget. A budget enhances understanding of the processes driving sea-level change. The processes are global, regional (including geological, such as land subsidence) and local, such as groundwater withdrawal.
“Having a thorough understanding of sea-level change at sites over the long term is imperative for regional and local planning and responding to future sea-level rise,” said lead author
Jennifer S. Walker, a postdoctoral associate in the Department of Earth and Planetary Sciences in the School of Arts and Sciences at Rutgers University–New Brunswick. “By learning how different processes vary over time and contribute to sea-level change, we can more accurately estimate future contributions at specific sites.”
Sea-level rise stemming from climate change threatens to permanently inundate low-lying islands, cities and lands. It also heightens their vulnerability to flooding and damage from coastal and other storms.
Most sea-level budget studies are global and limited to the 20th and 21st centuries. Rutgers-led researchers estimated sea-level budgets for longer time frames over 2,000 years. The goal was to better understand how the processes driving sea level have changed and could shape future change, and this sea-level budget method could be applied to other sites around the world.
Using a statistical model, scientists developed sea-level budgets for six sites, dividing sea-level records into global, regional and local components. They found that regional land subsidence – sinking of the land since the Laurentide ice sheet retreated thousands of years ago – dominates each site’s budget over the last 2,000 years. Other regional factors, such as ocean dynamics, and site-specific local processes, such as groundwater withdrawal that helps cause land to sink, contribute much less to each budget and vary over time and by location.
As the actual data shows, the rate of sea level rise in New Jersey has been pretty constant since 1910, which suggests that carbon dioxide emissions have little overall effect. What we are seeing is the result of natural global warming since the Little Ice Age ended:

https://www.tidesandcurrents.noaa.gov/sltrends/sltrends_station.shtml?id=8534720
The study claims that 20thC sea level rise is double that of the years 0 to 1800. But their modelling does not take account of changing century or decadal trends within the period. We know for a fact that glaciers advanced massively between the 17th and 19thC. There therefore had to have been a significant reduction in sea level rise at that time, maybe even a fall in sea levels as HH lamb believed.
Lamb also believed that glaciers were almost as great as the LIA in the previous cold epoch, around AD 450 to 850. There will therefore have been fluctuations in the long term trend, with sea levels rising faster at times, and slower at others.
What we do know is that many of the world’s glaciers are bigger now than they were in the Middle Ages and before.
As with all climate studies, the object is to prove climate change is “getting worse than ever”. Hence talk of accelerating sea level rise. The intention is to make people fearful of something which is too tiny to concern them.
NOAA kindly provide this chart, comparing actual sea level rise with official projections:

https://www.tidesandcurrents.noaa.gov/sltrends/sltrends_station.shtml?id=8534720
Not, or even nonexistent, in other places.
Fear triumphs over facts when these social ‘scientists’ pontificate.
We are lost in the world of facts while they disport in the fairyland of fantasy.
To whom are the people trained to listen…?
Climate Crackpots at work.
Still wrong, but at least they said that it has nothing to do with CO2. Billy Preston’s “Nothing from nothing” should be the new green goons’ theme song.
Do my eyes deceive me? NOAA provide a graph with some scary lines marked from extreme to low and the observed line is tracking the low sea level rise perfectly.
Perhaps the sea level rise is not accelerating after all. Perhaps the sea level is just doing its very stable steady state thing, that it has been doing for the past 7,000 years and maybe all this concern about CO2 impacting sea level, via global warming is just plain wrong?
Actually looked at this new Rutgers nonsense after Paul alerted me it this morning. There are two massive problems:
First, their millennial ‘model’ of the past is not a statistical model based on past observation, it is a ‘model’ built only on obviously wrong historical guesswork. For example, we know alpine glaciers in Europe and in Glacier National Park have ebbed and flowed from where their moraines stopped and what has emerged from beneath them—so SLR cannot have been continuous, nor always low, as ‘modeled’. Greenland ice cores also show similar irregular patterns of its ice sheet accumulation on a larger scale than mountain glaciers.
Second, their statistical methods to sort the past century’s global from regional from local contributions at a mere 8 east coast tide gauges has an easy work around proving its general conclusions false: go get the 70 or so diffGPS corrected (for local vertical land motion) long record tide gauge SLR records. They disagree with Rutgers results, but do agree with one another around the world—showing that the SLR rate has for at least 7 decades been about constant globally at about 2.2mm/year, with no regional differences to account for, no acceleration, and with closure (for which last see my years ago guest post here ‘Sea Level Rise, Acceleration, and Closure’).
Sea Level Rise, Acceleration, and Closure. Worth a review. Thanks.
Sea Level Rise is a complete joke. Sea Levels are <b>FALLING</b> at many places around the globe. The Ice Age Compressed and distorted coasts around the N Hemi and that is what is impacting sea levels, not melting glaciers.
https://imgur.com/a/siHPINY
That’s the rebound from Scandinavia’s ice sheet melt. The Gulf of Bothnia (google it) is expected to have no access to the Baltic in 2000 years around Kvarken.
Yep, thank you. Factors totally unrelated to CO2 are dramatically changing sea level. That link has falling sea levels from all around the globe, not just the Gulf of Bothnia.
In 2000 years there may be a new Scandinavia’s ice sheet…
Similarly, Hudson Bay is getting shallower and smaller every year.
You’re correct about the compressed coastlines, but wouldn’t expansion (decompression) of coastal areas cause sea levels to fall if the data is not corrected properly?
The acceleration of sea level rise since the advent of the satellite measurement is an artifact of the different measuring device
note the history of adjustments to the records
1) prior to the satellite measurement, the tide gauges showed 1.5 to 2.25mm per year rise.
2) after the introduction of the satellite, the satellite showed 3.1-3.2 mm rise per year from 1993 to 2015. The tide gauges shows the same 2.0 – 2.25mm per year.
3) Approximately in 2016, a downward adjustment was made in the “satellite records to show the satellite rise of 2.0mm to match the tide gauges in the 1993 with an acceleration to 3.3mm circa 2016 in order to show a high accelaration of sea level. yet the tide gauges still showed 2.0-2.2 mm per year in 2016.
4) sometime in in 2020, the global mean tide gauge record was adjusted to show 3.3mm acceleration to match the new satellite record.
somehow, those adjustements look a little dubious
Joe, this site
https://www.psmsl.org/data/obtaining/
has all the tide gauge data you could wish for. And as far as I know, it hasn’t been adjusted.
Regarding adjustments, that is the realm of the satellite boys, and they have been adjusting the crap out of their data. Here’s a graph that illustrates the point:
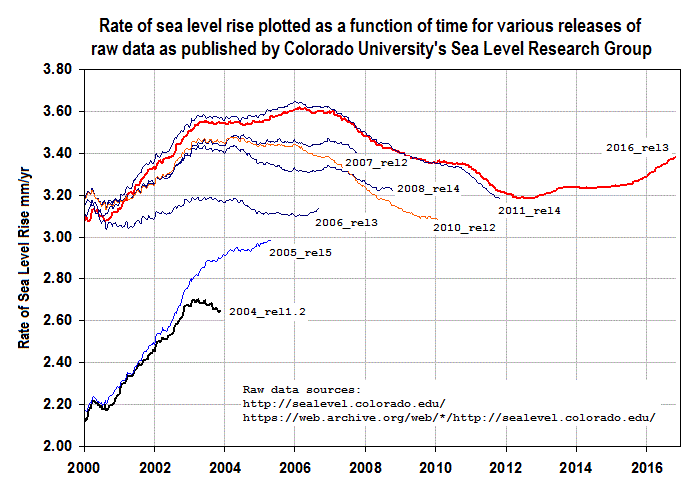
Each data point represents the rate of sea level rise since 1992. As you can see, the rate in 2004 had been a little over 2.6 mm/yr and by 2016 it had been adjusted, corrected, gun decked, dry labbed, pencil whipped, call it what you want, to a phenomenal almost 3.6 mm/yr.
Colorado U’s Sea Level Group
https://sealevel.colorado.edu/
has produced two releases since then that now show acceleration where there hadn’t been any in 2016, and now shows 0.084 mm/yr² in 2018 and bumped up to 0.097 mm/yr² in their latest 2020 release. I can hardly wait to see what bullshit rate they are going to claim on their next release when ever that is.
I seem to remember someone at WUWT (was it Willis or Dave Burton?) saying they thought that even the PSMSL data was now being corrupted. That would be very sad it if was true.
Does anyone have info on this?
How does one average global sea level when tidal movements are slight near the equator and immense near the poles?
Sea level ends up as a remainder from tidal measurements. The greater the water movement, the harder it is to isolate a pure remainder accurate within a few millimeters.
Besides, it is my understanding that any sea level information kept at Colorado EDU has 1.2mm SLR correction applied automatically.
Steve – thanks for the link – Thankful that someone is preserving the data from the WAYBACK machine to document the adjustments and prevent the loss of the data showing the adjustments
Satellites cannot measure anything – uncertainties are much greater than the result.
sydney hydrologists say Fort Denison water level unchanged on 100 years at DuckDuckGo
Usually when a significant glacial load melts the terrain rebounds and rises. How fast? Yes.
That should counteract any SL rise. However, there was typically also a fore-bulge in front of the glacier. As that adjusted, it would make the SL appear to rise. That is why DGPS is essential to sort out the different drivers.
And a doughnut ring of land around the glacial load which was forced UP as the load formed, then begins to collapse back down. As is happening in areas of the US east coast. Even better examples in Sweden.
In coastal Northern California, in 1906, a great earthquake on the San Andreas fault struck. As evidenced by railroad tracks the land on the ocean side of the fault slipped 16 feet northward. As evidenced by mussel colonies exposed above seal level on pier pilings, the land also rose a foot.
In coastal Northern California, in 1989, an almost great earthquake on the same section of the San Andreas fault struck. As evidenced by state highways, the ocean side of the fault slipped 5 feet northward. As evidenced by mussel colonies exposed above seal level on pier pilings, the land also rose a foot.
So in 83 years, the coast of northern California rose 2 feet. Since no one has ever suggested that the San Andreas fault will stop slipping, I’m pretty sure the sea level rise emergency there in Northern California can be cancelled.
NOAA kindly provide this chart, comparing actual sea level rise with official projections:
Even their “Low” dark blue line for Atlantic City, NJ graphically comes to 8.6 mm/yr by 2100.
That’s over double today’s rate. Who in their right mind thinks that’s going to happen?
It looks plausible on the graph, but in reality it is not. The other lines out to three meters and beyond are just nuts.
Sea level is the biggest scare the Climate Crusaders have, but graphs like this represent a gross overplaying of their hand.
Oh, I dunno –
it’s obviously not at all scary enough to stop the Obamas, the Gateses, the Gores, the Suzukis and other “climate champions” of the world spending vast treasures on their seaside luxury estates acquisitions.
(Maybe they know something they’re reluctant to share with the rest of us?)
Perhaps there will be, as yet unannounced, large subsidies for those brave enough to stay and fight. Better get your position established early!
The government of the Maldives was very vocal in denouncing SLR a few years ago, going as far as holding a Cabinet meeting underwater to draw attention to it. Strangely, however, they are currently building a large new airport at less than 1 m above sea level. As always, watch what people do, not what they say.
“Sea level is the biggest scare the Climate Crusaders have”
Hey, hold on a sec. It was always the bronze medalist at the Climate Crackpot Olympic Games. Arctic Sea Ice and Polar Bears, while being severely past their prime, aren’t finished yet.
….. well, maybe they are, but some drones don’t know it yet, so Sshhhhh.
“Sea-level rise stemming from climate change threatens to permanently inundate low-lying islands, cities and lands. ”
The insinuation from this statement is that humans burning fossil fuels is solely responsible for current sea level rise. Oh the humanity!
For those of you who have swallowed the kool-aid, I’d like to refer you to a geologic map of the Coastal Plain of the eastern USA. You will see that much of it is overlain by a marine sediment late-Pleistocene in age. I live 3000 meters from the Atlantic Ocean in Tidewater, Virginia. If I was at my current location back then and wanted to go to the shore, I would have to swim 50km west.
So how was it so warm back then that the sea level was so much greater than today? For those who want to cite Milankovich Cycles, you’ll need to explain mid-Holocene, Roman, Mideval climate optimums as well as the 1930’s.
The chart I have from a lecture on Milankovich Cycles shows that it was warmer 6,000 years ago, and the current warming was obviously the result of the most recent so-called 1,500 year cycle (actually more like a 1,000 year cycle) which gave us the so-called “little ice age.”
Ha! I had to hunt for a bit before I finally picked out the “Observed” line on the NOAA Atlantic City Sea Level graph. The emphasis is on the scary, colorful curls shooting up on the right.
Anyone educated before about 1970, with a H.S. education and a ‘C’ average, would look at that graph, scratch their head wondering what the fuss is about, and then laugh.
From the linked article:
“These photos show approximately the same view in October (left) and September 2016. The hill in the upper left corner is the same. Photo by Jennifer S. Walker”
Are you sure, Jennifer? Because the later picture shows that the area in review was a little dryer. But it is not unusual in climate science to get things exactly backwards. You are almost at the level of Mann!
As I recollect, the flooded scene was the result of storm surge. And, the area is subsiding! There is, understandably, concern about the local ‘ghost forests.’ However, it is not a representative example of SLR!
Down around New Orleans there are multiple ghost forests.
By and large, most if not all of the ghost forests are man destroyed. i.e., dredging waste spoils were piled along areas where access ditches were dug.
The dredge walls locked in salt water and prevent fresh water inflows from floods, whether rainfall caused or river overflow.
Turns out that tends to be the case for most watercourse or coastal ghost forests:
SLR rise is very low on ghost forest causes
Good catch, R-H Shark!
From the linked article:
Except, the right hand picture clearly shows the remains of an old dock sticking above the water. There are no old dock posts sticking above the grasses that are allegedly flooded in the right hand picture.
Flooded as in the alleged dry grasses are well submerged in the flooded picture.
Then there is their phrasing:
That is, the flooded picture occurred before the dry land picture?
Clearly their picture and attribution are meant to confuse viewers while they baldly lie.
Besides, that land looks just like tidal marshlands.
Even worse is the roads don’t match. The picture on the right has the dirt road curving right and the left picture has the road curving left. Nor is there enough of the hill in the right picture to claim it is the same one. Even the grasses look different.
“As the actual data shows, the rate of sea level rise in New Jersey has been pretty constant since 1910”
Interestingly, if you calculate 40-year trends, the rate of sea level rise at the site you chose starts at about 4 mm/year, drops to 3 mm/year for the 40-year periods centered around midcentury, and then grows steadily to over 5 mm/year in the 40-year periods centered on years more recent than the early 1990s. So acceleration of about 0.05 mm/yr/yr.
Marcus,
What are the 2sigma error bounds to your figures assuming the observed distributions are suited to some form of statistical error analysis? Geoff S
Actually, it turns out the NOAA website includes something like what you want – they show 95% confidence intervals around 50 year trends (though I don’t know exactly what goes into the confidence interval calculation):
https://www.tidesandcurrents.noaa.gov/sltrends/sltrends_station.shtml?id=8534720
Based on that, it looks like the most recent 50 year trend of sea level rise is about 95% likely to have been faster than the full period trend.
And SLR measurement is accurate to 1mm? ?
?
Utter BS.
Water levels change in response to low/high pressure weather systems, tidal movement, lunar orbit, local influences – pumps, rainfall, storm surges, wind driven water movement, etc. etc.
Sure. But weather systems, tidal movements, etc. generally average out when considering a 50 year trend. If you want to get a grasp on the potential contribution of local influences, that’s when you start looking at multiple different nearby stations (whose rates of sea level rise do indeed vary by a mm or so… but they do all show similar temporal patterns of faster sea level rise in the 30s, slower in the 50s/60s, and then faster or fastest in the last periods). But the original poster had picked out one station, so I did my analysis on the one station they picked out.
It is a well known oscillation in long term SLR. The exact cause is unclear to me at this time. I note that the period coincides to the nodal precession of the moon. (~80 years) Willis E. thinks it is due to some Sun/Earth/Moon orbital mechanics at ~56 years. As tides vary one per day to 2 per day, and amplitude variations are huge for different locations, the primary cause of the long term cycle may shift as well. In any event, there is no reason to believe the current upswing in SLR is anything but cyclical. (I note here that NOAA has been caught truncating the data prior to 1970, and claiming the upswing is AGW.)
Here is my take. The first plot shows 2 curved lines which are higher-order polynomials I used to curve fit the cycle. The straight red/blue line is the linear fit (blue) and the X^2 acceleration fit (red line) As you can see, they overlay each other, so no long term acceleration.
The second plot is the same data set with a more proper sine wave modeled in, as per the fit obtained with the polynomials. This eliminates the polynomial tendency to shoot off wildly at both ends. Take all this with the usual amount of skepticism, here is the data.
Here is the first.
Here is the second.
Marcus,
Quite so. Even an eyeball of the graph supplied shows about 90% of data between +/- 150 mm a year. I have no confidence that the official claim of +/- 0.15 mm a year.
There is a factor of 1,000between these estimates of variability. Geoff S
I made this recently, after I saw several claims in the media about SLR. One TV “science” show claimed 10 ft. of SLR by 2100 for New York City, others made similar claims. I used Boston data because that was handy, and Boston and NYC are are the East Coast twins of SLR.
This is what 10 ft. of SLR by 2100 looks like.
I graphed actual, extrapolated out
Constant rate
Constant acceleration.
For constant acceleration, the final rate is given at the end, at 2100.
Anybody here can tell me if this looks anything like plausible.
Loony Tunes
Aah, I think that’s why we have ‘tipping points’.
Correct, you are. Those Tipping Points will have to do some Serious tipping.
Perhaps the Tipping Point is like when the island of Guam tips over. {With a hat tip to US Rep. Hank Johnson}. If that is the case, Manhattan will tip over as well, but Boston has nothing to worry about except for the harbor islands.
Yup!
Exactly the kind of SLR Hansen expected when he made his SLR impact predictions back in 1988.
He was wrong then, even after his disciples claimed he meant
10,20, 30 years further in the future.Now the sea level catastrophism is somewhere between now and 2100, maybe.
‘Temperature-driven expansion is not due to mass (ice melt) but density change and therefore along coasts where the the water depth approaches zero is not important’ (see climate4you->oceans->sea level in general).
Don’t worry — John Kerry is working the issue — and he looks good on his surf board … https://www.youtube.com/watch?v=R9F8LSxR4Yo&t
Now that’s the scariest thing I’ve ever heard about climate matters.
And now with the “Ministry of Truth” in charge of the climate, Kerry will probably get the Nobel Peace Prize like Al Gore.
“Using a statistical model….” Read no more!
Those who claim that global temperatures are rising in recovery from the little ice age might be correct. However, such a claim must be linked to a mechanism or mechanisms than can provide such warming. Some possibilities are geometric change in earth to sun distance from planetary cycles; changes in air humidity and thus in IR absorption; changes in cloud type, height thickness, reflection and/or cover; plus several other possibilities.
It is known that such factors can affect global air temperatures. Temperatures are thought to cause sea level change, with the oceans acting like the liquid in a thermometer. Yet, there is so far no accepted equation in physics that links T to rise. While this elementary link is missing, there is no point to a paper like this. Geoff S
Just curious as to why these “experts” continue to use the generic term “sea level rise” when they all know (or should know) that a measured SLR above about 3 mm/year (the global average as measured by satellites over the last 28 years*) has to be caused by a combination of land subsidence, prevailing winds, and tide gage errors.
*see: https://www.star.nesdis.noaa.gov/socd/lsa/SeaLevelRise/LSA_SLR_timeseries.php
What happened to the old adage that water finds its own level? In paper after paper on sea level rise, this principle seems to be unknown, not mentioned, hidden because it conflicts with the intent of the author, or similar. It is simply not possible over terms of years, to have local sea level changes that differ from the global rise. Water does not form permanent hills and valleys to suit the mathematics of the authors. Geoff S
Maybe it will wash away some of the NJ BS.
So, it’s actually “land level sink” caused by the melting of that ice sheet, but described as “sea level rise” and that makes it man made. Got it.
(As I read somewhere the land sinking effect is caused by the same process as when your wife gets of the water bed and you sink three inches)
Not sure why this station was featured. The other 2 NJ stations are qualitatively much more typical of post 1980 world trends, which are what actually matters.
Bigger pic, why are we straw manning anomalous individual stations, when we have global data? Station data can be tempered with known isostatic adjustments. Newer Sat data can be ranged and compared. it’s a Trumpian YUGE, wishful retreat from what is commonly available.
hey Rube ….
Now who can argue with that?
or do you prefer Roob?
Using models to develop budgets? I wonder what made them think that’s a good idea.