Guest post by Bob Wentworth, Ph.D. (Applied Physics)
I’ve been thinking about some ideas that WUWT contributor Willis Eschenbach (WE) has proposed. In particular, WE has suggested that tropical cumulus clouds and thunderstorms provide a “thermostatic mechanism” that helps to stabilize the temperature of the Earth within a narrow range. WE has also offered a procedure for predicting surface temperatures changes in response to increased radiative forcing.
I find both these ideas intriguing. Yet, there are assumptions implicit in WE’s thermostat hypothesis and predictive procedure—and I haven’t been at all certain that those assumptions are valid.
So, I wanted to do what I could to check those assumptions.
The Earth is a complex thermodynamic system. When it comes to understanding thermodynamic systems, my experience is that verbal reasoning often leads to incorrect conclusions. So, I always want to know what the what the math and physics tell us.
I’m not about to try to produce a complete, realistic model of Earth’s climate. However, I decided to apply math and physics to a simplified “toy model” of the Earth and its atmosphere.
Simplified models get some things right, and other things wrong. They’re not entirely trustworthy. Yet, such models can still offer valuable insights, beyond what one can get to with verbal reasoning alone.
With that in mind, I’ve analyzed a toy model I call “Thunderstorm World,” to see what light it could shed on WE’s procedure and hypothesis.
I’ve applied this model to examining these questions:
- Does WE’s procedure for predicting how surface temperature changes in response to forcing seem likely to provide valid predictions?
- Does it seem likely that tropical cumulus clouds and thunderstorms might regulate the temperature of a planet to keep it within a narrow range?
Overview
This is a fairly long essay. So, I’ll offer an overview, and you can decide how much of the detailed exposition you want to read.
I describe the Thunderstorm World (TW) model, a simple model of a planet and its atmosphere which includes convective and radiative heat transfer and cloud-induced albedo changes.
The TW model exhibits strong convection and cloud formation at low latitudes. Among other results, the model yields a curve of surface temperature vs. total surface irradiance. This curve is qualitatively similar to the curve that emerges from measurements on Earth. This similarity offers a measure of validation for the model.
I apply a procedure proposed by Willis Eschenbach (or my understanding of that procedure) to trying to predict the response of the TW model to a “forcing” due to an increased concentration of greenhouse gases. Unfortunately, the procedure predicts an increase in mean global surface temperature that is too small by 45 percent. The procedure also fails to correctly predict the variation of temperature with latitude. I identify two mistaken assumptions implicit in the procedure that lead to these flawed predictions.
I examine whether tropical thunderstorms (or, more precisely, low-latitude convection and cloud formation) moderate or limit increases in planetary temperature. Within the TW model, it turns out that convection and cloud formation do moderate temperature increases. But these mechanisms don’t impose any hard limit on such increases. Although the onset of tropical convection might appear to act as a “thermostat” limiting surface temperature, in the TW model, the setting of this “thermostat” is relative to the temperature of the upper layer of the atmosphere. So, if a “forcing” warms the upper troposphere, then tropical surface temperatures can also rise.
Thus, to the extent that the TW model bears a relationship to real-world climate dynamics, the results of the model suggest that (a) the proposed procedure for predicting responses to forcing may not be trustworthy, and (b) tropical thunderstorms likely moderate but don’t place any absolute cap on planetary warming.
The Thunderstorm World Model
The Thunderstorm World (TW) model is designed to be as simple as possible while still accounting for convective heat transfer, cloud formation, radiant heat transfer, and variations in surface temperature.
To this end, the TW model assumes:
- The planet has a uniform surface, high thermal inertia, rotates rapidly, and has no inclination, so that diurnal and seasonal temperature variations can be ignored, and there is no variation with longitude. Temperatures and energy flows depend only on the latitude, 𝛳.
- The atmosphere has two layers. Each layer of the atmosphere is characterized by a single temperature at a given latitude.
- Although the surface temperature, T₁(𝛳), and the temperature of the lower layer of the atmosphere, T₂(𝛳), vary with latitude, the temperature of the upper layer of the atmosphere, T₃, is the same at all latitudes. (On Earth, the average temperature in the upper troposphere at a pressure of 190 mbar is only weakly dependent on latitude, so this assumption of constant temperature isn’t unreasonable.)
- Convection happens whenever the temperature difference between the surface and the lower atmosphere layer, or between the lower and upper atmosphere layers, exceeds a threshold value 𝚪H, where 𝚪 is the adiabatic lapse rate and H is the elevation change between layers.
- The heat transfer rate associated with convection is assumed to be proportional to how much the temperature difference exceeds 𝚪H.
- When convection occurs at the surface, this is assumed to lead to cloud formation which leads to reflection of shortwave radiation from the Sun. This increase in albedo is assumed to be proportional to how much the temperature difference exceeds 𝚪H.
- The layers of the atmosphere have radiative properties similar to those assumed in my prior essay, Atmospheric Energy Recycling. Each layer of the atmosphere absorbs fully a fraction f of thermal radiation wavelengths, and is transparent to a fraction (1– f) of thermal radiation wavelengths. The parameter f is taken to relate to the concentration of greenhouse gases present in the atmosphere.
- At a given latitude, the surface and the lower layer of the atmosphere are assumed to adjust their temperatures to ensure energy balance, so that the rate of energy entering and leaving match. For the upper layer of the atmosphere, energy balance is also assumed, but this requires integrating energy gained and lost over all latitudes, since air circulation is taken to maintain a uniform temperature for the upper layer of the atmosphere.
- Heat transfer between latitudes via atmospheric circulation is not fully modeled, but is addressed partially via the assumption that the temperature of the upper atmosphere is independent of latitude.
These assumptions vastly oversimplify the way Earth’s climate works. Yet, they include enough elements, and enough thermal physics, that perhaps some dynamics of the real system will be reproduced by the model.
The model is depicted below.

Figure 1
The surface receives energy from the Sun, more at the equator and less at the poles, and exchanges energy with the lower layer of the atmosphere, as well as radiating some energy directly to space. The lower and upper layers of the atmosphere also exchange energy, and the upper layer radiates energy to space.
At low latitudes (near the equator), surface heating leads to the adiabatic lapse rate being exceeded in a way that triggers convection.
In general, the zone where convection happens between the layers of the atmosphere may be different than the zone where convection happens between the surface and the lower layer of the atmosphere. (In a more complex variant of the TW model, these zones are more similar.)
That’s the TW model.
In what follows, I offer results for the dynamics of the model, based on model parameters as specified in the Appendix. Given those parameter values, I’ve numerically solved for the temperatures T₁(𝛳), T₂(𝛳), and T₃ and the energy flows that yield energy balance in steady-state.
Basic TW Model Predictions
For the model parameters I’ve considered, within the TW model temperatures vary with latitude as shown in the following figure.
Please keep in mind that I’m not expecting the TW model to accurately model Earth in any quantitative way. I’m just hoping to see some general qualitative similarities between dynamics of the model and some of the dynamics on Earth.

Figure 2
The figure shows how surface temperature (red curve) and the temperatures of the two layers of the atmosphere (green and blue curves) vary with latitude.
The surface temperature (red curve) rises as one moves from the polar region towards lower latitudes, until a latitude of 42º where a threshold temperature of 25.4℃ is achieved. After that threshold point, the surface temperature rises only very slowly, reaching 26.9℃ at the equator.
The surface temperature is very cold (-80℃) at the poles. This is because the TW model does not account for the air and ocean currents which warm Earth’s polar regions.
Averaging the surface temperature over the globe, the average surface temperature is 19.3℃, a little warmer than Earth. (In computing the average, latitudes nearer the equator are weighted more heavily than latitudes nearer the poles, because the surface has more area at lower latitudes.)
To understand why the temperature plot looks as it does, it helps to look at convective cooling effects, as shown below.

Figure 3
For latitudes below 52º, convection transports heat between the two layers of the atmosphere. For latitudes below 42º, surface convection transports heat into the atmosphere and forms clouds that reflect some of the incident shortwave radiation.
The onset of convection explains why the curve for surface temperature (in Figure 1) changes slope at these two threshold latitudes.
(On Earth, the threshold latitudes for the onset of major convection and ocean thunderstorms are closer to the equator than they are in the TW model for the parameters I’ve chosen. The oversimplifications in the TW model mean that one can choose only a few of Earth’s parameters to fit properly. I chose to roughly fit the insolation and mean surface temperature values for Earth, at the expense of allowing the threshold latitude to be significantly different than what is observed on Earth. I think this is ok, because I am interested in the qualitative behavior of the model, not the absolute value of any quantitative results.)
These cooling effects can also be plotted as a function of surface temperature, as shown below.

Figure 4
One can see that surface cooling increases rapidly for surface temperatures above 25.4℃. This seems qualitatively similar to what one sees in WE’s Figure 3. This offers reassurance that the TW model is reproducing some of the climate features that WE’s analysis relies upon.
Let’s look at another type of graph that WE uses.

Figure 5
This chart shows surface temperature as a function of total downwelling irradiance at the surface within the TW model. It is notable that the slope of the curve greatly flattens for irradiance values above about 450 W/m². This looks qualitatively quite similar to WE’s Figure 2, though the specific irradiance threshold value is different for the TW model and for the Earth.
In Figure 5, temperature increases monotonically with irradiance. This matches WE’s Figure 3 for land-based data, but differs from WE’s Figure 4 for ocean-based data. In the latter figure, temperature above the threshold declines somewhat with increasing surface irradiance.
Can the TW model account for such non-monotonic behavior?
It turns out that a variant of the TW model exhibits such behavior.

Figure 6
The simple form of the TW model uses the same adiabatic lapse rate, 𝚪, everywhere. In reality, the adiabatic lapse rate depends on the extent to which water vapor is present. For moist air, the lapse rate is smaller, and for dry air it is larger.
I would expect that the atmosphere is likely to be more humid where surface convection (presumed to be above an ocean) is happening, and less humid where there is no surface convection. So, the lapse rate for convection between the layers of the atmosphere ought to be larger when there is no surface convection, and smaller when there is surface convection. That’s the assumption used in the variant of the TW model that yields the temperature vs. irradiation curve in Figure 6.
In Figure 6, the temperature for a given irradiance drops as surface convection begins. This is qualitatively similar to what is observed in WE’s data for ocean locations.
Once again, I feel reassured that the predictions of the TW model qualitatively reproduce what WE has seen in data for Earth.
For the remainder of this essay, I’ll stick to the version of the TW model that yielded Figure 5, since that model is easier to understand.
Response to Greenhouse Gas Forcing
What does the TW model predict will happen if the concentration of greenhouse gases is increased?
Let’s consider a top-of-atmosphere (TOA) radiative forcing ∆F = 7.4 W/m², which I understand to be roughly the radiative forcing predicted to occur on Earth if the concentration of CO₂ was quadrupled.
As I understand climatologists’ use of the term, radiative forcing is a measure of the radiative imbalance that would occur at TOA if greenhouse gas concentrations were increased, but the atmosphere and surface were otherwise unchanged thermodynamically. I assume this means that all temperatures remain the same, as do convection and cloud coverage.
Based on this understanding, a TOA imbalance of 7.4 W/m² occurs in the TW model if the longwave absorption fraction, f, is increased from f = 0.600 to f = 0.631. So, to compute the effect of a TOA forcing ∆F = 7.4 W/m², I re-ran the TW model for f = 0.631, solving for the new temperatures, convective heat flows and cloud-induced albedo increases.
The old and new temperatures are shown below.

Figure 7
The mean global surface temperature in the TW model increases by 1.84℃.
Please don’t attach significance to this particular value. I don’t believe the absolute magnitude of this number to be meaningful, given the limitations of the TW model. What is likely to be meaningful, however, is how this value compares to other predictions of temperature change associated with the same model.
Checking WE’s Procedure for Predicting Response to Forcing
As I understand it, WE’s procedure for computing the Surface Response to Increased Forcing goes like this:
- For a given TOA radiative forcing value ∆Fₜ, compute an equivalent increase in downwelling surface irradiance, ∆Fₛ. In WE’s example, on Earth, a TOA forcing of ∆Fₜ=3.7 W/m² was thought to lead to a downwelling forcing 1.3 times as large (presumably leading to a ∆Fₛ=4.8 W/m² increase in downwelling radiation).
- Given a graph of surface temperature T₁ versus surface irradiance 𝚽, compute the derivative dT₁/d𝚽. (That graph might be WE’s Figure 3 or 4 or my Figure 5.)
- At each point on the planetary surface, compute the temperature change ∆T₁ as ∆T₁ = ∆Fₛ × (dT₁/d𝚽).
Let’s call this procedure Temperature-Irradiance Curve Following, or TICF. TICF might or might not be an accurate representation of the procedure that WE is advocating. He can let us know. Regardless, we can evaluate how well TICF works with respect to the TW model.
With regard to step #1 above, comparing the mean total (SW+LW) surface irradiance before and after applying the ∆Fₜ=7.4 W/m² TOA forcing (i.e., before and after increasing f from 0.600 to 0.631), the mean total surface irradiance increases by ∆Fₛ=12.15 W/m². (So, in this case ∆Fₛ=1.6 × ∆Fₜ.)
When I apply step #2 to my Figure 5, then apply step #3 using ∆Fₛ=12.15 W/m², and average over the surface of the planet, the TICF procedure predicts a mean global surface temperature change of 1.02℃. That’s 45 percent less than the “actual” mean temperature change value of 1.84℃ produced by the TW model.
So, the TICF procedure did not do a very good job of predicting temperature changes in the TW model.
Why Doesn’t TICF Predict Temperature Correctly?
The TICF procedure is appealing intuitively. So, why doesn’t it correctly predict temperature changes?
As far as I can tell, there are two ways in which the TICF procedure as I outlined it goes wrong.
One problem with TICF, as I’ve outlined it, is that the surface irradiance forcing ∆Fₛ is assumed to be a constant that is independent of latitude.
Let’s look at how the surface irradiance changes when the forcing is applied (i.e., when f =0.600 changes to f =0.631).

Figure 8
The red curve (∆ SW+LW) indicates the change in total irradiance absorbed by the surface, ∆𝚽. As one can see, this is nowhere near being a constant. It depends strongly on latitude, 𝛳.
Let’s assume we know ∆𝚽(𝛳), and try using this to predict temperature changes via the formula ∆T₁ = ∆𝚽(𝛳) × (dT₁/d𝚽). We could call this procedure Spatially-Varied-Forcing TICF, or SVF-TICF. (This procedure isn’t likely to very useful in practice, even if it works, because anyone who knows ∆𝚽(𝛳) probably also already knows the temperature change.)
How well does SVF-TICF predict temperature changes?

Figure 9
The chart above shows the change in surface temperature, as a function of latitude, as predicted by TICF, as predicted by SVF-TICF, and as in the actual solution of the TW model.
It’s apparent that the TICF procedure which assumes a constant forcing ∆Fₛ (green curve) matches the right answer (red curve) almost nowhere. It’s no wonder that its prediction of the change in mean surface temperature is way off.
What about SVF-TICF? For latitudes between 90º and 44º, the SVF-TICF predicted temperature (blue curve) change closely tracks the “Actual” temperature change within the TW model (red curve). So, that’s an improvement.
However, while it might be a little difficult to see in the chart, for latitudes between 44º and 0º, the TICF (green curve) and SVF-TICF (blue curve) predictions join together, and both predict tropical surface temperature increases much smaller than the “Actual” result (red curve).
Because a global average weights low latitudes strongly, the mean global surface temperature increase predicted by SVF-TICF is 1.05℃, just barely larger than the 1.02℃ predicted by TICF, and still much less than the actual increase of 1.84℃.
So, even with accurate information about spatial variations in the downwelling irradiance forcing, the TICF procedure fails to accurately predict temperature changes.
What is the core problem with TICF?
TICF depends on the assumption that the curve of surface temperature vs. surface irradiance is fixed, and that a “forcing” will simply cause different locations on the surface to change where they appear on this fixed curve.
So, the procedure is critically dependent on the temperature vs. irradiance curve not changing.
Unfortunately, the curve does change.

Figure 10
As seen in the chart above, the curve of surface temperature vs. total surface irradiance superficially looks mostly the same before and after the forcing is applied. But what is going on to the upper right? Let’s look at that part more closely.

Figure 11
Once total surface irradiance exceeds about 450 W/m², the “initial” and “final” curves are different. Unfortunately, this region of the graph applies to a majority of the surface area of the planet.
If a forcing raises the temperature of the upper atmosphere layer (as can be seen to happen in Figure 7), this increases the temperature at which tropical thunderstorms “cap” the surface temperature. This is what shifts the temperature vs. irradiance curve.
To generalize this result a bit, the temperature vs. irradiance curve in the TW model is unchanged by forcing in locations where energy transfer is entirely radiative, but the curve changes in locations where convection is important.
Since convection and atmospheric circulation are important, albeit to varying degrees, almost everywhere on Earth, it seems likely that the temperature vs. irradiance curve on Earth might shift in response to forcing.
Thus, the TICF procedure seems unlikely to be effective in accurately predicting surface temperature changes in response to forcing.
Do Tropical Clouds and Convection Moderate Warming?
WE has suggested that tropical cumulus cloud formation and thunderstorms (supporting strong convective heat flows) help to moderate Earth’s temperature.
Let’s see what the TW model has to say about this hypothesis.
I redid the temperature change calculation, holding some factors fixed. Once again, I assumed a 7.4 W/m² TOA forcing, modeled by increasing the longwave absorption fraction from f=0.600 to f=0.631. The results for the increase in mean global surface temperature were:
- 2.61℃: cloud albedo and convective heat transfer held fixed.
- 2.05℃: cloud albedo held fixed and convective heat transfer allowed to adjust.
- 1.84℃: cloud albedo and convective heat transfer both allowed to adjust.
So, if a researcher failed to account for increased cloud albedo, they would predict a temperature change 11 percent larger than what actually happens in the TW model. If a researcher failed to account for both increased cloud albedo and increased convection, they would predict a temperature change 42 percent larger than what actually happens.
(I have the impression that the GCM computer codes used by climatologists all model convection changes. Some reading suggests that GCM’s typically also model cloud. But, I’m not an expert on GCM’s and would rather not get into a debate about them. Let’s stick to talking about what the TW model tells us.)
(The TW model likely overestimates the cooling effect of clouds because the model accounts for increased reflection of sunlight from clouds, but does not account for increased longwave absorption and emission from clouds, which tend to have a warming effect. On Earth, on average, longwave warming by clouds compensates for about 60 percent of the shortwave cooling by clouds, although cooling effects predominate more strongly in the tropics, cf., WE Figure 2.)
The bottom line is that the hypothesis that “increases in tropical cloud formation and convection moderate planetary warming” is valid within the TW model.
Do Tropical Clouds and Convection Cap Warming?
The results of the TW model do not support the hypothesis that “tropical cloud formation and thunderstorms place a hard limit on planetary temperature increases.”
In the TW model, there is not an absolute “thermostat” effect that prevents tropical surface temperatures from increasing in response to a forcing. To the contrary, the temperature at the equator increased by 1.46℃ in response to the forcing.
What may be confusing is that there is a relative “thermostat” effect that prevents tropical surface temperatures from increasing too much, within the context of a given upper atmosphere layer temperature.
So, in the context of the baseline TW model, surface convection is triggered at a surface temperature of 25.4℃ at a latitude of 42º, and once convection is active temperature increases slowly to a maximum of 26.9℃ at the equator.
This might make it appear that there is a “thermostat” set at 25.4℃.
However, after the forcing is applied, surface convection is triggered at a surface temperature of 26.8℃ at a latitude of 43º, and once convection is active temperature increases slowly to a maximum of 28.3℃ at the equator.
So, there still appears to be a “thermostat”, but after the forcing, the thermostat is set 1.4℃ higher.
The reason it works this way is that the onset of surface convection is governed by the lapse rate and the temperature of the upper layer of the atmosphere. The forcing caused the temperature of the upper layer of the atmosphere to increase by 1.4℃. In the TW model, this leads to a corresponding increase in the “maximum surface temperature” in low latitudes.
The lesson to be learned from this is that, within the TW model, tropical thunderstorms cap the maximum surface temperature, but only relative to the temperature of the upper atmosphere layer. If the temperature of the upper atmosphere layer (i.e., the upper troposphere) increases as a result of forcing, then the temperature limit enforced by tropical thunderstorms will increase as well.
Relating the TW Model to Earth
How does the TW model relate to Earth?
The TW model certain leaves out many processes which are important in Earth’s climate. Earth’s atmosphere includes many layers, and is affected by global circulation patterns in the atmosphere and oceans, circulation patterns which are largely unaccounted for in the TW model. The radiative dynamics in Earth’s atmosphere are also more complex than those assumed in the TW model.
The parameters used in the TW model example I’ve presented lead to behavior that matches Earth in some ways (e.g., insolation and global temperature are at least vaguely comparable in the TW example and on Earth) but not in others (e.g., strong convection occurs over a broader range of latitudes in the TW example than on Earth). The simplifications in the TW model mean that its behavior can’t be quantitatively matched to that of Earth except in a few respects.
Yet, the TW model includes the dynamics of the onset of convection in a way that seems likely to be at least somewhat relevant to the way things work on Earth. Both in the TW model and on Earth, convection is stimulated when surface warming causes the adiabatic lapse rate to be exceeded. This creates a threshold effect that is relative to the temperature of the upper troposphere.
I think the TW model is accurate in portraying this aspect of climate physics.
Conclusions
Based on working with the Thunderstorm World model, it seems that:
- It makes sense to be skeptical about the ability of the TICF procedure to accurately predict how surface temperatures would respond to forcing.
- Tropical cumulus clouds and convection associated with thunderstorms likely moderate planetary temperature changes, but aren’t likely to provide any fixed limit on planetary warming.
APPENDIX: Model Details
At a given latitude, 𝜽, the net energy flows within the Thunderstorm World (TW) model are as depicted in the following illustration.

Figure 12
For the calculations presented in this essay, the following parameter values were used:
- Mean insolation, Sₐ = 292.6 W/m². (This is approximately the insolation Earth experiences, if non-cloud albedo is taken into account.)
- Convection adiabatic lapse threshold, 𝚪H = 30 Kelvin.
- Convection strength, Z = 0.2 /Kelvin.
- Convection reference power, Sᵣ = Sₐ.
- Convection heat-transfer vs. cloud-formation fraction, 𝝌 = 0.7.
- Long-wave radiation absorption fraction, f = 0.6 (prior to added forcing).
The area-weighted global average of a quantity g(𝜽) is given by the integral from −𝜋/2 to 𝜋/2 of ½⋅cos(𝜽)⋅g(𝜽).
For the variable-water-vapor model variant used to generate Figure 6, the adiabatic lapse threshold 𝚪₂H for convection between the lower and upper atmosphere layers is made to transition from 33 K to 30 K as surface convection begins. (In particular, this transition is made as the value of T₁’ − T₂’ − 𝚪₁H transitions from -1 K to 1 K, where T₁’ and T₂’ are the values that T₁ and T₂ would have if only radiative heat flows were present, and where 𝚪₁H = 30 K. This slightly odd recipe was chosen because it was found to support numerical convergence.)
What a ridiculous conclusion, Willis gives actual observations and a theory that explains them and you create a model to verify the observation! Models should be used to explain observation not correct them. I have read several of your post now and have come to the conclusion that you are hopelessly stuck on computer outputs and you own biased scientific understanding and not open minded nor do you have an understanding of scientific method.
Did you even read the report?
Over and over again, the author says that he is verifying WE’s model, not his observations.
The discrepancies are between his model and WE’s model.
He gives explanations as to why he believes his model is a more accurate explanation of reality than is WE’s.
Question, don’t the climate models show decreasing temperatures in the upper atmosphere as forcing increases?
So what? We aren’t talking about climate models.
Because Bob used upper atmosphere warming under forcing as the key to showing where Willis theory falls apart.
Another question, exactly what is Willis’s model?
You don’t know, yet you are defending it?
You still haven’t admitted to your mistake of claiming that the author was trying to disprove Willis’s observations.
Willis doesn’t have a model, he has a theory based on observation.
Mark
I am not claim that the author trying to do anything. I am stating that his conclusions have no practical value because his method is seriously flawed.
Read Willis comment he states it plainly, he essentially says this model doesn’t conform to observation and as such has no value in testing the theory. That was my point, models should be tested against observation before being used for any purpose.
Hers a comment from the author “Yet, the TW model includes the dynamics of the onset of convection in a way that seems likely to be at least somewhat relevant to the way things work on Earth”
What does that mean? he feels like it might be right? over and over again in the article he says things like this. Bob W is putting out there and that’s commendable but he clearly thinks way to much of simple untested models.
Perhaps it is that a model should be used to validate the reasoning of an hypothesis. An invalid model verifies nothing, and a valid one can only, sometimes, illustrate part of a complex system.
Falsification, measurement, and testing verifies theory.
An ad hominem challenge isn’t part of either, but works great for propaganda or senseless contention.
Bob, could you be more specific on what you dislike?
Peter, you may have to specify which Bob you are addressing. Author and commenter share the first name.
Where is the observational evidence that this model has any relevance? Willis produces observation after observation that show the relevance of his theory, and most of his observation is from TOA bypassing any nonsense this model shows.
Don’t mean to be too harsh but this is modeling gymnastics for the sake of modeling that’s all.
Bob b,
If I understood it correctly, this is intended to support Willis’ hypothesis and his observations, adding depth to Willis’ work. Do you understand it differently?
DK
I don’t agree, I think it’s a bit of a back handed refutation of Willis and that’s fine but again it’s a model based on no observation using the same basic parameters and theories that the standard models use. Which to me means it’s a models based on models trying to show whether observations are valid, hence nonsense.
I think I get you. Not sure I agree, but at least I think I better understand your critique.
DK
You are correct and my initial post was to harsh in tone and for that I am wrong.
Acknowledged. I do that all the time, even when I really don’t intend it. Good of you to say so.
Yeah, I really don’t ever intend to be a jackass (except when dealing with Griff) but sometimes it just happens and that’s on me.
I am not a real fan of Bob W approach, it’s seems to me he doesn’t take the time to check and validate before he puts out his post which is fine but when he is critiquing the works of others that have put in the time I think he does us all a disservice. To me this is a general problem with people who look at the output from computers as the real world, it’s too easy and there for subject to laziness.
I’m no scientist but I’m starting to sense that climate models have no more predictive value than the Drake equation- both with too many unknowns.
Glorified weather models will never be useful for climate until they incorporate the physics of clouds rather than parameterising clouds. If they do that then the modellers will see that the tropical oceans must regulate to 30C upper limit and the whole “climate emergency” disappears.
I was thinking along the same lines.
The number of assumptions is dizzying.
And basically all of them have to be somewhat correct for the result to have any meaning.
RE: the Drake equation and climate pseudo science. Dr Michael Crichton was about 20 years ahead of you, and most of us in associating the two.
At least the Drake equation is logical- and it admits that most of the numbers are missing. It doesn’t assume much- like climate “science”. It doesn’t declare anything- such as, “aliens will invade Earth and destroy it by 2050 so we must have a Reset and while at it solve all social problems- and spend countless trillions doing it”.
The Drake equation is hardly logical – it’s a string of assumed relevant criteria that may or may not be relevant at all. It is simply a fringe opinion and completely unscientific.
It’s a thought experiment and rational because it suggests factors that ought to be relevent- it doesn’t claim to have any answers or prove anything.
Joel Michael Crichton is a personal hero to me. Kudos for mention his name positively.
We had the box Earth model yesterday and now this Thunderstorm world.
Why would this model be correct when all the others are not? It was probably a fun exercise.
As the old saying goes, all models are wrong, some are useful.
Within the limits detailed by the author, this model does seem to be useful.
I’m glad you found it useful.
And some arent
That goes without saying, so why did you feel the need to state the obvious?
Because I disagree with you on it’s usefulness because I don’t think it’s founded in observation.
The author’s model follows actual observations better than Willis’s mental model.
BTW, since you don’t know this. Models aren’t founded on observation, they are founded on math.
They are either confirmed or refuted based on observation.
Rather simple point, but one that seems to be beyond you.
MarkW, I’m curious as to
w.
Mark W
I have the greatest respect for you and almost always agree with you, but here again I disagree models are used to try and mathematically recreate observation.
Models are called Models because they model what has been observed. Though to some they are what is observed and that is becoming the problem more and more each day.
“Models aren’t founded on observation, they are founded on math.”
It seems to me that MATH is much like a model. Math itself is using an artificial construct to describe reality, and in many cases needs to be corrected or expanded to match real world observation.
Of course developing artificial constructs (rules and algorithms) that work is needed so we can predict and test reality in a useful way.
Guess what, your MATH might be wrong as well as your models. If it doesn’t match observations, its just wrong.
Seems this author is doodling to explore possible theories, he himself says his model is simplistic – so it is most unlikely to be valid.
WE’s hypothesis of low latitude Thunderstorms being emergent phenomenon that AFFECT the planet’s average temperature is undoubtedly correct.
Notice I say ‘affect’ and not ‘control’. The reason I say this is that “https://epic.gsfc.nasa.gov/“ continually plays as my screen saver. This is obviously not a rigorous scientific analysis, but always shows that cloud cover and hence albedo of the planet is in the hands of large weather fronts moving around the world.
These fronts are directed by Coriolis forces acting on horizontal air flow from/to high (cooler air attempting to descend) and low barometric pressure (warm air attempting to rise) areas. Yes, some of these huge systems are partially composed of WE’s afternoon thunderstorms. But most of them are the result of ‘advection’, moist air cooling until clouds and possibly rains form along huge weather fronts.
Thanks for the good article that makes people think. May the WUWT armchair reviewers not be too hard on you!
Thanks. Good of you to draw the distinction between affect v. control. I keep having problems with “control” used in the context of weather and climate.
You do not have many control systems that regulate the upper temperature of ocean warm pools better than the atmosphere over tropical oceans.
It is a controlled upper limit through convection and moist air convergence. Sunlight does not get to the surface if the surface temperature gets to 32C – observed overshoot to 31.5C at the onset of convergence. The additional moisture that has borrowed high level atmospheric cooling from cooler surface regions actually adds to the surface cooling when the precipitation sets in. So the regulation is around 30C rather than the overshoot that can reach 32C.
It is a very tight limit because the level of free convection is the same altitude as freezing above 32C surface so cloud is persistent; cumulus at the start of the cloudburst cycle and cirrus as the convective potential builds for the next cycle:
https://earth.nullschool.net/#current/wind/surface/level/overlay=cape/orthographic=-278.08,10.37,318/loc=57.089,7.354
Arabian Sea about to release the 2021 monsoon.
You are probably right. My issue with the word control is the same as with the word force. In context both seem to me to lend agency to natural phenomena, and make me over critical of usually the wrong part of what I am reading. I can see where control might be the right way to imagine the effect, probably lack of formal training on my part.
DMackenzie, the Bob Wentworth report is a contribution to the struggle to understand, only incrementally-not completely, the chaotic weather/climate of our earth. The WE analysis always starts with his direct observations, and with respect to thunderstorms he has a lot of experience, probably some of which were a little frightening. Here is the one observation I am sure of personally: When there is a strong summer thunderstorm the air temperature clearly decreases as it leaves, so where did that heat go?
Hint…It gets cool during an eclipse of the sun…
DMacKenzie May 16, 2021 6:58 am
Thanks, D. A few comments. First, there are no weather fronts in the tropics.
Second, about 2/3 of the solar energy enters the planet between 30N and 30S. As a result, whatever happens there in terms of controlling total energy input to the system is much more important than say what happens closer to the poles.
Third, thermally generated thunderstorms (as opposed to frontal thunderstorms) happen in many parts of the temperate zones. I’ve seen them in England, in New Mexico, and many other locations. They are common in the “tornado belt” of the US, for example.
Fourth, thunderstorms are only one of a number of emergent climate phenomena that thermoregulate the planet. These include the Rayleigh-Benard circulation of the surface ocean and the lower troposphere, the formation of thermal cumulus clouds, dust devils, cyclones (AKA hurricanes or typhoons depending on location), tornadoes, the La Nina pump moving excess warm surface water from the equator polewards, and the great decadal oscillations in ocean currents such as the PDO.
Finally, these phenomena emerge spontaneously in response to local temperature exceeding some threshold. As such, their effort is applied exactly where it is needed to prevent overheating, with no wasted effort in those regions which are not extra hot. This makes them efficient out of proportion to their size.
Between all of these, the temperature is kept within fairly narrow limits.
Best regards,
w.
“Between all of these, the temperature is kept within fairly narrow limits.”
Well at least on the +side of the equation.
One question, then, is: for the periods in Earth’s history when the global temperature was otherwise, from the early “snowball Earth” during the Sturtian 700 Million years ago to the Cretaceous Thermal Optimum 90 Million years ago, what changed?
Willis,
Upvoting your count, based on para starting “Fourth,…”
I think that, starting from the viewpoint of a an ocean planet Albedo that is quite a bit below our satellite-measured 0.304, anything that causes surface warming cranks out more H2O vapor, much more so over ocean than say, a desert. This includes warming IR effects due to CO2 and water vapor. However, at some point clouds form, whether it be thunderstorms or coriolis forced cyclones. Then heat is reflected into outer space. We achieve “balance” at about 2/3 cloud cover. But it depends on daytime/nightime clouds, number of cloud layers, Mother Nature isn’t picky and just keeps on evaporating until the clouds can’t hold any more H2O. This includes the many emergent phenomena you mention. The “balance” is mostly between reflection of incoming sunlight by % cloudcover, and the water vapor content of the atmosphere as presented by the Clausius-Clapeyron equation…..Specifically the water vapor content that is at its dewpoint, which is the “cloudpoint”. Check a Skew-T diagram. A saturated surface air parcel, when convected upwards, will form clouds.
It is obvious from typical USCRN data that moisture and dry bulb exchanging energy on a diurnal basis create a thermal surge tank the moderates the atmospheric temperature.
i think your graph just shows a relatively constant number of water molecules in the air at La Junta CO (absolute humidity), and that relative humidity varies quite a bit with diurnal temperature when there is no source of local evaporation.
check some g/Cu.M numbers
https://www.tis-gdv.de/tis_e/misc/klima-htm/
I don’t like relative humidity as a heat analysis tool, relative humidity is most important to fungal propagation, and right now we don’t care about that. Can you obtain the data in grains of moisture/lb dry air? …or something similar, something that gives me an absolute value of the number of water molecules in the atmosphere?
Dew point is a measure of absolute humidity.
All one has to do to make the conversion you want to see is to look up some numbers and do some algebra.
Dew Point Calculator – Find The Dew Point (omnicalculator.com)
I even have that macro in my Excel spreadsheet, but to get much accuracy I need to know air pressure, I don’t want to just assume a constant 1.0 atm.
BTW…grains per lb?
Kidding?
Scientist use S.I. units because it makes everything about a millions times easier.
To do anything using the units you want to see, one must convert atomic and molecular mass numbers to lbs and ounces and grains and…huh?
Use SI/CGS.
…or go to a psychrometric chart, marked in Imperial units. Yes, I know, SI is easier to work with, I used it and enjoyed it in college, but when I started work (in the U. S. Air Force) all that was available, or at least all that was known to those teaching me, was Imp., I couldn’t even get an S.I. psychrometric chart. I have gotten used to those numbers and now recognize when I’m in the right neighborhood, at least, by my familiarity with the numbers.
But the real clue is, I’m not a scientist, I’m an engineer. I use the units most recognizable by those I work with. 🙂
It is more than a surge tank. Water is a strong cooling agent in the atmosphere. The short wave reflectivity of clouds is greater than the absorption and re-emission at lower temperature of outgoing long wave. The peak energy rejection occurs in July, a month after the area of the ocean warm pools at or above 30C peaks.
Figure 12 my way.
This is only good out to 32 km where the molecules cease.
GCMs do not model clouds. They parameterize them.
Grid cells are far too large actually to model clouds. Orders of magnitude more computing power would be required to model clouds.
Not only that, they are parameterized on a “per square meter” basis, but in the real world a square meter of warmer sea surface temperature generates more than a square meter of additional cloud cover, each square meter reflecting an additional 700 or 800 watts of incoming solar back into outer space.
The problems with complex models is trying to include too many variables (and assumptions) to get fits with obsevations. I have worked with a simple vertical flow model to quantify the flow of CO2 from tropical ocean sources to polar ocean sinks.See Climate Changes,
Try http://www.retiredresearcher.wordpress.com
t
t
‘4. Convection happens whenever the temperature difference between the surface and the lower atmosphere layer, or between the lower and upper atmosphere layers, exceeds a threshold value 𝚪H, where 𝚪 is the adiabatic lapse rate and H is the elevation change between layers.’
This assumption is wrong!
Convection happens because of density differences. Density differences are caused by both temperature and the concentration of water vapor. While density varies linearly with temperature, the concentration of water vapor, and thus density differences due to it, varies exponentially with temperature.
In addition, the rate of water evaporation is a product of the potential, i.e. the partial pressure of water vapor, the surface area available for evaporation and the mass transfer coefficient, which is itself dependent on convection, i.e. the wind speed. When convection begins, the mass transfer coefficient increases, further increasing evaporation. If the wind increases sufficiently, over open water, to cause waves with a broken surface, then the surface area increases dramatically, which can cause an explosive increase in the evaporation rate. Under these conditions the rate of evaporation is sufficient to cool the underlying water, which puts a limit on the rate of evaporation.
It is the above mechanism of an explosive increase in the rate of evaporation that drives tropical storms. This mechanism requires water temperatures of at least 25 C. However by 30C the rate of evaporation is so high that it cools the underlying water and puts a hard limit on the water temperatures.
This is Willis’ hard limit.
Sorry, I don’t understand. Perhaps, as an erstwhile knuckledragging ordnance handler I am hung up on our different useage of “explosive.” Can you restate your explanation of why the assumption is incorrect and not merely the author’s stated oversimplification?
dk, you are asking two separate questions.
dh,
Acknowledged. Yes, it was at least two questions.
Thanks for your added explanation. I am trying to take in your point #1. Given an ideal gas of a constant temperature with a density gradient over a nominal space (caused by gravity, centrifuge, whatever) over time would not the more dense part retain a higher temperature than the less dense portion?
Point #2 also thanks. I have a different mental first glance definition of explosive as a term of art, which leads me to many errors.
Consider the real world case of dryline thunderstorms, which are a huge subset of severe thunderstorms. They are very common in places such as West Texas.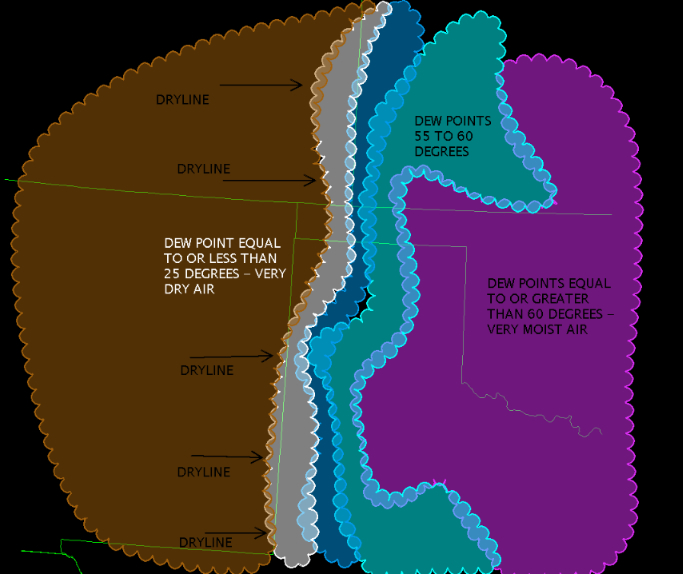
The main difference in the air masses is the dew point, not temperature, and yet these thunderstorms can be among the tallest and most energetic anywhere on Earth.
https://weather.com/science/weather-explainers/news/dryline-severe-weather-tornado-storms-plains
Note that in a dryline front, the air behind the front can actually be warmer than the air in front of the front, exactly opposite of what occurs in the similar in appearance cold fronts.
“You’ve probably heard of a cold or warm front, but there is an equally important surface boundary you may not be familiar with. It’s called a dryline.
Drylines typically set up north to south through the Great Plains – in states including Nebraska, Kansas, Oklahoma and Texas – during spring and summer. They separate warm and moist air from the Gulf of Mexico to the east from hot and dry air originating from the Southwest on the west.
They are associated with large-scale low-pressure systems, which also have an attendant cold and warm front.”
Thanks Nick. Have experienced dry line storms in Texas, and surprising to some, also in North Dakota and Northern Central New York, and twice in Southern Arizona. I can bear witness that in all these states, unprotected individuals (at least three times me) caught outdoors in these sorts of storms have experienced near hypothermia on what was otherwise a hot summer day. My observation is that these often coincide with/cogenerate notable hailstorms, also with their own definite cooling effect. Although these were not scientifically documented experiences, they do make me give credence to Willis’ reasoning/model/theory.
I want to understand both Dr. Bob W’s support of Willis’ work and Bob b’s objections. You may have given me a better way to visualize the process, again thanks, but I am still hung up on what may in my mind be either mild disagreement or violent agreement between the two Bobs.
I regularly drive I-10 across West Texas and thus across the Dry Line. It is quite evident, in terms of clouds aloft and humidity at the surface. Unless its monsoon season in New Mexico, I know I have a good drive ahead of me when I’m west-bound crossing that dry-line. Monsoon season though means TRW in NM and So AZ that kick up bad dust storms early in the season when the dry ground is still lacking moisture to hold the dust in place from the winds.
I think this comment approaches my biggest objection to ALL climate modeling. Our atmosphere is dynamic, yet ALL models, including the one described here, try to model it as static blocks. I know, I know, you say that there is heat transfer between your static blocks, but you are still modeling static blocks, only the interactions are (potentially) dynamic. Look, I took Differential Equations (twice) and I know the limitations of partial differential equations… Since only the static equations can be solved, differential equations attempt to take a particular point in time and model that statically, with all its static conditions, and then do that again for the next point in time (or whatever your chosen differential) and pretend the result of taking all those equations produces a valid representation of what happens in the real world. So we’re kinda stuck with this approach. But this approach’s failure is most completely demonstrated by the failure in the thunderstorm treatment, with current computing power we cannot take discrete enough differentials to accurately represent the real world. This model has the same limitation, not because of computing power but because of oversimplification.
As understand WE’s hypothesis, once a thunderstorm develops, all bets with regard to forcing (which in the case of changes in CO2 is just a change in insulation values) are completely off, since the thunderstorm is a heat engine that punches a hole right through the atmosphere, regardless of the composition of that atmosphere, and transports the heat to the top of the (lower, at least, also upper?) troposphere where it can radiate to space directly. Once that happens, neither ECS nor TCS matters anymore.
Red Viper,
Too long since I took DEs, but in general I agree with your distinction between static and dynamic analysis and its misuse at times. Many times I have criticised an analysis in a blog for using static analysis when dynamic is appropriate. My comment does not apply to the present case here because I have not thought about it enough yet. Geoff S
That’s not the only way differential equations can address complex dynamic systems.
One can also sometimes write differential equations for “ensemble averages,” thereby providing simpler equations that eliminate dependence on details without rendering the equations invalid.
Care is needed in doing such statistical averaging rigorously, but there is nothing inherently wrong with it as an approach.
Such an approach is the entire basis of statistical mechanics and thermal physics.
As WE discusses, thunderstorms are processes that start at some point in time. When and where those thunderstorms start depends on lapse rate in the atmosphere. Consequently, it depends on things like the temperature of the upper troposphere, as influenced by CO₂ concentrations and other effects. Thunderstorms also stop at some point. This is also influenced by the temperature profiles in surrounding regions. So, it’s not the case that the overall level of thunderstorm activity is independent of those factors.
It’s not entirely wrong, though it’s a bit oversimplified, insofar as the adiabatic lapse rate 𝚪 (which reflects air density variation) is actually dependent on water vapor concentration and temperature.
But, perhaps the point you’re making relates to the water vapor concentration profile near the water surface, which is something that might have only a weak connection to the lapse rate in the atmosphere above?
Thanks for bringing that up. This offers an intriguing avenue of investigation for trying to make sense of WE’s hypothesized limit.
While I like your qualitative description, I wonder if a quantitative analysis would bear out your conclusions.
For example, yes, water vapor concentration depends exponentially on temperature, but that doesn’t mean the concentration varies rapidly over a few degrees of variation in surface temperature. It matter how large the exponent is. (It depends what your standard for “rapid” is.)
I see that, relative to a baseline vapor pressure at 30°C, the vapor pressure at 25°C is 25% less, and the vapor pressure at 35°C would be 33% more.
How much evaporation will occur could still, in principle, be limited if the incoming air is already fairly saturated. Though, I suppose that condensation and precipitation will tend to dry air when it’s at altitude, so that when it returns to the surface it will be unsaturated and ready to pick up more moisture. So, maybe that point doesn’t have much significance?
The dependence on absolute temperature in these dynamics do make WE’s hypothesis more plausible to me. (It would take more number-crunching to convince me that this necessarily leads to any absolute limit.)
Do you have any reference that addresses this subject more fully?
Thanks for the food for thought.
Can we describe a dataset or experiment that would refine theory?
NASA/GISS regularly describes a theory that refines various datasets.
Nice, J O’B
Ok Bob, I am confused about one point. In order for your upper layer to warm and raise the thermostatic setpoint, wouldn’t that require that the forcing be due to increased total solar insolation (TSI)? It was my understanding that standard GHG theory implies a cooling of the upper atmosphere as a result of the delay in radiation escaping from the surface.
If my reasoning is correct, then there should be no way for the upper atmospheric temperature to rise due to GHG emissions. Could you please comment? It seems to me that you don’t contradict WE but point out that the setpoint depends on TSI which is of course intuitively obvious.
This is why modeling for the sake of modeling without observational reference is meaningless. Willis theory is based on observation and data not a thought experiment routed in climate model produced theory. This essay is essentially a model based on output theory generated by other models.
Once again, you demonstrate a fundamental failure to understand how science and models work.
Willis mad a hypothesis. The author created a mode to either confirm or refute Willis’s hypothesis. If this model better matches the observations than does Willis’s model, then the model is confirmed.
Where does he show that it matched any observation? Maybe I miss read his results and if so then I stand corrected, but as far as I can discern he only generates modeled outputs and flatly states where and when it does and doesn’t agree with Willis observations.
He also states that the upper atmosphere warms under forcing and that is why Willis’s theory that there is a hard limit how warm the oceans can get is incorrect and that this warming will allow that limit to rise. It’s the key to his refutation of Willis main premise. But under climate theory (which he is basing his model on) the upper atmosphere will cool not warm under increased forcing. So I am not sure why you are so strongly defending this paper but that’s your prerogative, perhaps it’s because of my first post being a bit harsh and there I was wrong, Bob is contributing and that should commended.
Two things:
1) I’m not basing my model on “climate theory”; I’m basing it on basic thermal physics. (It just so happens that “climate theory” is also based on that physics.)
2) There is a simplification that happens when one connects my TW model to what happens in the real atmosphere.
The real atmosphere has many layers, not just two. Conventional climate science predicts that the troposphere (both upper and lower layers) will warm under increased forcing, though the stratosphere (and mesosphere?) will cool.
I believe that the “upper atmosphere layer” in the TW model corresponds to the upper troposphere. So, it’s entirely consistent that this layer would warm under the influence of increased forcing.
Most of the mass of the atmosphere is in the troposphere, so it makes sense that a 2-layer model would mostly just model the troposphere.
Willis’s theory is a hypothesis + data, without anything but verbal logic to connect the two. The data does not actually support the hypothesis unless there is a model of how to interpret the data.
I supplied one possible model to connect the data to the hypothesis.
That’s something Willis has not done, and without that, the data neither confirms nor refutes the hypothesis.
Thanks, Bob. So … because Einstein never built “a model to connect the data to the hypothesis”, the data of say the transit of Venus doesn’t confirm or deny his theory?
Say what?
A model is good. It is not necessary.
I asked in my first comment above if your model is like the earth in having a maximum ocean temperature. I haven’t seen an answer, which makes me think that the answer is “no”. That would seem to indicate that something is acting to limit temperatures in the real world … and my hypothesis gives a possible explanation.
w.
What I would say is that:
In the case of Einstein, his theory of General Relativity included a complete description of how his hypothesis integrated with other physics. It offered a bridge between what he was proposing and pre-existing physics.
In the case of Einstein, he applied his new GR mathematical model which made one prediction for the transit of Venus, and the previous Newtonian mathematical model of physics which made a different prediction for the transit of Venus. The data confirmed the GR prediction but not the Newtonian prediction.
In the case of your temperature regulation hypothesis, you haven’t offered a recipe for integrating it into existing physics. That doesn’t invalidate the hypothesis, but it makes it harder to establish that any predictions you make are really predictions of your model, and not just ad hoc additional hypotheses which you intuitively think ought to follow from the first hypothesis. The logic is fragile and harder to falsify, because it doesn’t have a clear, rigorous, internal logic that has been announced up front, which would make the model more testable.
That’s not inherently wrong. Maybe that’s the best one can do for now. But, it does weaken that case that you’re presenting something truly testable.
Where I see a bigger weakness in what you’re presenting is with regard to my point #2 above. It seems to me that you’re largely speculating that other hypotheses, which do not amount to there being a climate “thermostat,” cannot explain the same data that you’re asserting supports your hypothesis.
Einstein checked what prior theory predicted should happen. As far as I can tell, you have not done the equivalent of that. (It’s really critical that this not be done in a “straw man” fashion where one simply asserts that conventional theory would conclude X without checking to see that this is actually so.)
That’s where my TW model comes in. It clearly ties to known physics (albeit an incomplete subset of that known physics). It shows that some of the data which you claim supports your hypothesis is readily explained by a model which (a) is well-integrated with known physics, and (b) replicates apparent “thermostat” behavior without there being any actual limiting of planetary temperature changes.
In other words, it offers an alternate hypothesis to yours which explains much of the same data, and does so in a way that is connected to established physics.
I doubt if any data about present-day Earth can differentiate between your hypothesis, which I gather involves regulation to an absolute temperature, and the hypothesis that emerges from the TW model, that temperature regulation occurs on a relative basis, relative to the temperature of the upper troposphere.
And, since the latter (relative) hypothesis is connected to known physics and your (absolute) hypothesis so far is not, the burden of proof to support your hypothesis is higher. It appears to me to be in the category of “extraordinary claims require extraordinary evidence.”
Well, the lack of response as yet is partly simply indicative that, unlike prior posts I’ve done, I wasn’t notified that my post was being published, so I’m just catching up on comments rather belatedly.
But, you’re right that the TW model doesn’t seem to predict any “maximum ocean temperature” in the context of forcings, though in any given climate context, it will appear that there is a “maximum ocean temperature.” It’s just that that maximum temperature could change if relevant climate drivers change.
I agree that the data you’ve referenced for historical temperatures in the Western Pacific Warm Pool are suggestive of that.
However, this data does not firmly establish your hypothesis, because there has been no calculation of what conventional theory would predict.
Your hypothesis doesn’t establish anything new unless it can be shown that you’re predicting something different than what others would predict.
Maybe if one did a climate analysis based on underlying physics (like what I did with TW, but more sophisticated), one one find that such an analysis would also have predicted a stable WPWP temperature during that period, without this implying any general limit on variations in global temperatures.
If that’s the case, then the WPWP data wouldn’t support your hypothesis as being superior to conventional understandings of climate.
Aside: I recently discovered that there is a GCM computer code (EdGCM) that is available for use by anybody, and which can be run on a desktop or laptop computer. Maybe that could be useful for looking at what conventional theories predict?
Well, it sort of names the alleged phenomenon. To me, it will be fairly weak as an “explanation” until the hypothesis is integrated with some model of what physics could lead to it being the case.
In the absence of such linking, it’s all too easy to make wrong guesses about the implications.
For example, the TW model shows that it’s not valid to infer from an apparent “thermostat” phenomenon in the world as it is now that the setting of that “thermostat” could not change if external climate drivers change. That’s the sort of insight that can arise when one ties in to underlying physics.
Have you included the huge horisontal transport of latent heat from ~20-30 deg. lat. towards the equator?
No. A limitation of the model is that it doesn’t account for horizontal heat transport, except at the level of the “upper atmosphere layer.”
I guess that the Hadley cells would cause winds from “~20-30 deg. lat. towards the equator” and these would carry water vapor evaporating from the ocean surface, and hence, latent heat.
I wouldn’t expect that latent heat to be released near the surface, though. Presumably it gets released at altitude when condensation occurs. Still, an interesting heat flow.
Yes, but it’s adding a lot of LW to the WPWP, which WE is so hung up on.
https://jra.kishou.go.jp/JRA-55/atlas/en/column.html
“Hung up on”? I am interested in the WPWP, as are many scientists, not “hung up” on it.
Are you naturally an unpleasant jerkwagon, or did you have to study and train to get as good at it as you are?
w.
All it took was reading a few comments here, similar the one I’m responding to now.
No. The upper layer in the TW model can warm simply from the increase in GHG concentrations (as modeled by an increased value of the longwave absorption fraction, f).
That’s what happens if you apply radiative physics (it’s not specific to “GHG theory”) to Earth’s full atmosphere.
But, the two layers in the TW model correspond to the lower and upper layers of the troposphere. They don’t really address what happens in the statosphere and higher layers of the atmosphere.
Your reasoning is not correct. The upper layer in the TW model, and the upper layer of the troposphere, in the case of Earth, both rise when GHG concentrations are raised.
There is nothing inconsistent about this.
Earth’s upper atmosphere (stratosphere and above) behaves differently because it is optically thin, and is also influenced by the presence of ozone absorbing SW radiation.
Feedbacks involving clouds and sea surface temperatures, which seem to regulate the latter, limiting warming in the tropics, have been reported and studied for forty years. I have a collection of links on the topic, including several of Willis’s articles, here:
https://sealevel.info/feedbacks.html#tropicalsst
Great. But scratch “They’re not entirely trustworthy..” Unless one is disposed to confuse the map for the territory, a model is as trustworthy as the modeler. I trust you, why undermine that? You’ve made the map v. territory distinction, good on yer.
Second pass: IMO Critical to Willis’ model seemed to be the passage of time and variation in solar radiation through the day. I’ve missed where TW model includes temperature changes necessary due to day/night rotation. The feature again seems to me to be adding a critical dynamism into Willis’ model that is not reflected in yours. I must ask if TW, without day/night heating/cooling, correctly applies WE’s reasoning? Perhaps I am mistaken in my understanding of you and/or WIllis?
Agreed: My understanding of Willis’ overall results is that it has a component dependent on overnight cloud dissipation and resultant radiative cooling of the surface.
Same. But from my pov more interesting is warming from morning to mid afternoon, starting from the “cold” overnight state. Depends, I suppose, just where one steps onto the merry-go-round.
It is difficult for me to imagine a globe spinning so rapidly that the equator is equally warmed day and night. Probably equally difficult would be a ringed “sun” around the equator of a stationary sphere. If we’re going there, why use three dimensions at all? But it is Sunday, and I somehow need more coffee. Probably just me.
Bob Compliments on initially exploring Willis Eschenbach’s Emergent Thermostat model.
Emergent phenomena – Cirrus Clouds
Richard Lindzen (2001) proposed the Iris Effect, and reviews it in 2021. Lindzen finds differential changes in visible vs infra-red driving Cirrus Cloud feedback. Cirrus Cloud is another “emergent” phenomena that could be considered a of Willis Eschenbach’s larger “Emergent Thermostat” concept.
Lindzen, R.S. and Choi, Y.S., 2021. The Iris Effect: A Review. Asia-Pacific Journal of Atmospheric Sciences, pp.1-10. https://link.springer.com/article/10.1007/s13143-021-00238-1
https://link.springer.com/content/pdf/10.1007/s13143-021-00238-1.pdf
“The original study suggested that the anvil cirrus would shrink with warming, which was estimated to induce longwave cooling for the Earth. This is referred to as the iris effect since the areal change hypothetically resembles the light control by the human eye’s iris. If the effect is strong enough, it exerts a significant negative climate feedback which stabilizes tropical temperatures and limits climate sensitivity.”…
“Current studies found that the iris effect may not only come from the decreased cirrus outflow due to increased precipitation efficiency, but also from concentration of cumulus cores over warmer areas (the so-called aggregation effect).”
“For the iris effect to be most important, it must involve cirrus clouds that are not as opaque for visible radiation as they are for infrared radiation.”
Eschenbach has clearly exposed the negative cooling feedback from those “concentration(s) of cumulus cores over warmer (tropical) areas” (“aggregation effect.”)
Please add Lindzen’s Cirrus cloud feedback to your model as another “emergent” element.
Cirrus cloud formation incorporates ice crystal formation and temperature inversion.
Water driving emergent control
Demetris Koutsoyiannis finds “we provide arguments that water is the main element that drives climate, and not the opposite.”
Rethinking climate, climate change, and their relationship with water – ITIA (ntua.gr)
http://www.itia.ntua.gr/en/getfile/2098/1/documents/water-13-00849.pdf
I encourage you to explore how water fluxes are the primary feedback control of climate (rather than temperature), and exploring more “emergent” features of Willis’ “emergent thermostat” principle.
Best David
PS Fig 12 Recommend conceptually adding the small but finite back radiation from space Ts^4 at Ts=2.728 K. See NASA. spectrum above is that of a radiation field at a thermodynamic temperature of 2.728 K.”
Cosmic Microwave Background Radiation (nasa.gov)
The key parameter IS ocean surface temperature.
The level of free convection and level of freezing coincide when the ocean surface reaches 32C. Cumulus cloud forms during cloudburst and cirrus cloud forms during the recharge of the convective potential. So cloud is persistent above 32C.
Ocean warm pools tend to regulate to a maximum of 30C due to high level moist air convergence from cooler water.
The only ocean surface that does not regulate to 30C is the Persian Gulf in August. The mid level air is too dry to form a level of free convection.
https://earth.nullschool.net/#2020/08/16/2300Z/wind/isobaric/500hPa/overlay=relative_humidity/orthographic=-306.25,28.28,727/loc=53.182,25.874
Convective instability is a near ideal temperature limiting process. All ocean warm pools regulate to an annual average of 30C.
The elephant in the room is total average pressure at sea level. If cloud do in fact provide emergent thermostatic bounds then total average pressure at sea level sets the long-term average. At current long term pressure tropical ocean surface does not appear to exceed 32C before emergent evapo-convective processes take over as stabilizing parameters. Similarly polar ocean freezing temperature is also set by pressure. Thus a hypothesis is that cloud/storminess and ice albedo properties emerge as a result of hydrostatic equilibrium in the earth system.
in this view the radiative properties of gases could be largely irrelevant. Overturning atmospheric mass in convection may completely overwhelm any “blanketing” imagined from GHGs. The presence of ample water likely dampens the temperature sensitivity of the troposphere to minor perturbations in total system energy (century scale) through Willis’ emergent cloud phenomena idea. It seems unlikely water vapour must always be considered a positive feedback. Additionally, upper atmospheric layers may also have dampening mechanisms yet to be explored. These emergent phenomena may work in concert to maintain the average density/pressure profile to top of atmosphere.
JCM is correct.
Willis is also correct in seeing the importance of emergent phenomena but seems not to see his examples of such phenomena as just one part of a greater whole.
Bob Wentworth unfortunately fails to see the overall significance of convective overturning and so has to make things overly complex and ultimately fails to see the wood for the trees.
His previous failure to grasp the basic concepts in the work of myself and Philip Mulholland leads him along multiple dead end tracks.
Only thing I can say, at this point.
Thank you Bob.
Excellent.
cheers
Interesting model approach! As the thunderstorms often have a short lifetime and tend to emerge in the late afternoons and evenings, I would argue that the fast spinning Earth model argument cannot properly describe reality. The corresponding features are clearly shown in WE’s nice scatterplots of observation data.
Bob Wentworth
In your conclusions you state:
“The TW model likely overestimates the cooling effect of clouds because the model accounts for increased reflection of sunlight from clouds, but does not account for increased longwave absorption and emission from clouds, which tend to have a warming effect.”
I believe you are erroneously considering “clouds” instead of tropical thunderstorms here. Global cloud cover may “tend to have a warming effect”, but deep convection tropical thunderstorms would likely not. In addition to their increased reflectivity at low latitudes (where the insolation is highest) they would be radiating away a lot of latent energy during condensation and precipitation of water. In essence, in a thunderstorm, thermal energy from the sun is converted to latent energy during evaporation, then converted back to thermal energy and radiation on condensation and precipitation, where a lot of this radiation leaves the system. It seems to me that these thunderstorms have to remove energy from the system.
Thanks for the post.
Forget all that BS. Learn a little about convective potential. You will then begin to realise how a level of free convection forms and why it is the key in regulating the surface temperature of the tropical oceans.
https://earth.nullschool.net/#current/wind/surface/level/overlay=cape/orthographic=-278.08,10.37,318/loc=67.710,19.752
Arabian Sea poised to release the 2021 monsoon. As you can observe from this data showing CAPE of 3258J/kg, this is a high energy process; sufficient to catapult the water vapour upward at over 200kph. It saturates the entire atmospheric column above the LFC.
Convective potential catapults a lot of water vapour above the level of free convection forming high cumulus cloud. Some vapour condenses and precipitates immediately. The rest saturates the air above the level of free convection and forms high level, reflective cirrus cloud as it solidifies above freezing due to radiative cooling above 273K. At surface temperature of 32C the level of freezing and level of free convection coincide. So persistent cloud forms and the water surface below cannot get warmer than 32C.
The only part of the oceans over the entire planet that does not regulate to 30C is the Persian Gulf in August when it gets above 34C. Explain that and you will have a clue.
Bob, thanks for a most interesting essay. I haven’t had the time yet to go through it in detail, but my first question would be this.
In the real world, the Pacific Warm Pool is the warmest part of the ocean. However, on a yearly average basis, it never goes above 30°C. And a recent study entitled “Stable sea surface temperatures in the western Pacific warm pool over the past 1.75 million years” verifies that this is not some temporary condition.
On the contrary, it shows that there is some combination of phenomena that keep the Pacific Warm Pool not just from getting warmer but from getting cooler as well … and that these phenomena have been in operation for over a million years.
So my question is, does your model contain such a region, where the ocean temperature is relatively invariant over a range of conditions?
Because if not … I fear that your model is inadequate to test my hypothesis about emergent climate phenomena.
My very best to you, and thanks for the work,
w.
Willis wrote
Not in August. When you can explain why the Persian Gulf reaches 34C in August – warmer than any other ocean surface at any time – then you you will actually understand the temperature regulating process. This will give you a clue:
https://earth.nullschool.net/#2020/08/16/2300Z/wind/isobaric/500hPa/overlay=relative_humidity/orthographic=-306.25,28.28,727/loc=53.182,25.874
‘When you can explain why the Persian Gulf reaches 34C in August – warmer than any other ocean surface at any time’.
So, the Persian Gulf is a relatively small body of water. And from what I see from the link that you provide is that there is relatively little wind over the Persian Gulf, compared to other bodies of water. Under these conditions, it will be harder, in the Persian Gulf, to get waves that are sufficiently large to have a broken surface, and associated high mass transfer rates (i.e. the rate of transfer of water vapor from the ocean surface to the atmosphere), as compared to the oceans. Thus it will require a higher driving force (i.e. the partial pressure of water vapor, which increases exponentially with temperature), essentially a higher temperature, to achieve the same mass transfer rates as the oceans.
So, in conclusion, the answer to your question is that the Persian Gulf is a small body of water with generally lower prevailing winds. Thus it needs a higher temperature to attain the same convective mass transfer rates, in order to offset the incoming solar radiation, as compared to the oceans. There is a similar situation in the Gulf of Mexico, where, I believe, the water temperatures tend to be higher in summer, than in the Atlantic ocean at a similar latitude.
Nope – try again.
The Persian Gulf is known for its steady summer Shamal. That blows down the gulf from the northwest:
https://earth.nullschool.net/#2020/08/21/0300Z/wind/surface/level/orthographic=-308.62,30.73,1005/loc=51.858,26.481
This is similar strength to the trade winds in the ITCZ where the temperature regulates to a limit of 30C.
Thanks, Rick. My bad for lack of clarity. I was speaking of the open ocean. There are three long narrow gulfs surrounded by desert that get warmer than 30°C in August—
The detailed information on the LCL etc. is much appreciated. As to why those three long skinny bits of water get extra hot, the atmosphere above each is constantly replenished with hot dry desert air, so clouds don’t have much chance to form.
Finally, the Persian Gulf is very shallow, with an average depth of a mere 35 metres, so it is much easier to heat up than the open ocean regardless of cloudiness.
Regards,
w.
Wills wrote:
The first part is true but not the complete story. The water column reaches 45mm in the south of the Gulf, which is a lot of atmospheric water – well above the 30mm needed for convective instability. It is the lack of mid level moisture that prevents convective cloud formation. There is usually no level of free convection. Although cloudburst do occur but infrequently.
The second point is wrong. The mixed layer in the Persian Gulf has the same depth as the tropical warm pools. The bottom water sits at 21C throughout the year. In fact cooler water from the Arabian Sea pours into the Gulf in August so the surface is actually being kept cooler by that inflow than it otherwise would achieve if there was no inflow:
https://www.researchgate.net/publication/285581886_Study_of_the_Physical_Oceanographic_Properties_of_the_Persian_Gulf_Strait_of_Hormuz_and_Gulf_of_Oman_Based_on_PG-GOOS_CTD_Measurements
The point is that the Persian Gulf is the exception that proves the temperature regulating process of clouds over tropical oceans. Their short wave reflective power exceeds the reduction in outgoing long wave power through absorption and re-emission at their lower temperature.
Atmospheric water is a cooling agent when the planet is warm and a warming agent when the planet is cool. The wide distribution of surface water makes the planet habitable as it is both a store of heat and a good distributor of heat.
Strongest cooling effect in July, a month after the maximum extent of warm pools, with average of 4.2W/sq.m of cooling for every cm increase in atmospheric water.
Thanks, Rick. Regarding your second point, the average mixed-layer depth (MLD) in the Persian Gulf is only about 23 metres. In the Pacific Warm Pool, it’s more than twice that, ~ 50 metres. (data from here).
http://www.ifremer.fr/cerweb/deboyer/mld/Surface_Mixed_Layer_Depth.php
I looked at your reference. I didn’t see any data about the average mixed layer throughout the Persian Gulf, just spot readings and things like this:
Other than that I agree with your points, including:
Best to you, thanks for your most informative comments.
w.
Willis
You are misinterpreting the meaning of well mixed as used in the paper:
That is stating that the layer below 60m has stable conditions and is not subject to the annual variation. It is well-mixed in terms of stable temperature, stable salinity and stable density in the bottom zone. It is observed in the thermocline plots for warm and cooler month from the same paper attached here.
Like I said, all they give are point estimates at a certain time, not year-round averages.
Next, they say the thermocline (the bottom of the mixed layer) varies between 20 and 60 m. My source gives the annual average at about 25 m.
Finally, average depth in the Gulf is only 35 metres, although it’s deeper at the mouth.
w.
Willis wrote:
The bottom set of vertical profile plots in the paper show the conditions in August when the surface temperature is above 33C. The deep water is near the Iranian shore line. At 26.5N 54E the depth is over 80m and the surface temperature is above 33C. The whole column is not being heated and the mixed layer is just below 20m.
It is to be expected that the mixed layer would shoal with the high rates of evaporation. The thermocline steepens with 30C at 20m down to 21C at 60m.
Shoaling of the mixed layer can also be observed in the high net evaporation zones of the Pacific with mixed layer no more than 30m deep. profile_sep2s110w_20210218_hf__eps20t_2021051707.png
And daily rates of evaporation in the Pacific, even in the peak zones, is a fraction of what occurs in August in the Persian Gulf.
The warm pools in the open ocean have net positive precipitation so that drives the mixed layer deeper down to about 150m:
profile_sep0n165e_20210320_hf__eps20t_2021051707.png
There is no precipitation associated with the high surface temperature in the Persian Gulf. This is the exact opposite of the open water warm pools where the precipitation is contributing to the surface cooling but also driving heat deeper into the ocean as there is a net inflow of the order of 8mm/day over warm pools.
The salinity plot across the Pacific gives insight into the net precipitation across the tropical Pacific:
Warm pools to the west are at the low end for salinity while the evaporation zones to the east are at the extremes end of the range. This is another difference with the Persian Gulf because the surface evaporation is being replaced with water from the Arabian Sea.
RickWill May 16, 2021 11:42 pm
Thanks, Rick. Upon re-reading your previous comment this morning, I see that they are indeed using the opposite meaning of “mixed layer”. In normal parlance, there is a layer of water on top of the ocean that is somewhere around 50-100 metres deep. The temperature is pretty constant throughout that layer because it overturns nightly and is mixed by the action of wind and waves. It’s called the “mixed layer”.
Below that is the “thermocline”, the layer where temperatures drop rather rapidly.
And below is another area where temperature and salinity is pretty constant throughout. But despite the fact that that deeper layer is obviously well mixed, it is NOT what is generally called the “mixed layer” that I’m referring to. That’s the layer above the thermocline, and in the Persian Gulf it’s quite shallow.
And because it is shallow, it is easier to warm than the mixed layer in the Pacific Warm Pool, which is ~ twice as deep.
My best to you,
w.
Withdrawn
Already above 31.5 C in the Bay of Bengal.
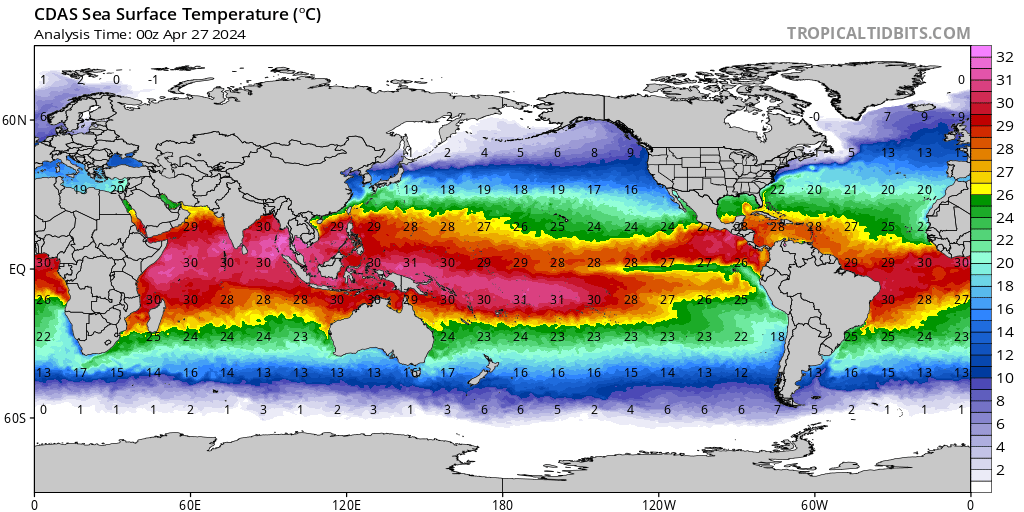
The monsoon is about to set in and that will cool the sea surface around India. The warm pools reach their maximum extent in April. By May they are already reducing but still building around India. The Arabian Sea and Bay of Bengal will cool by the beginning of June. It is primed to release the heat that has built up through April and May:
https://earth.nullschool.net/#current/wind/surface/level/overlay=cape/orthographic=-297.08,15.27,927/loc=67.642,18.040
And provide the precipitation India needs.
The highest average temperature in the iIndian Ocean is still 30C over the Equator.
If you take a daily peak at the temperature you will see the temperature limiting process at work. The formation of convective potential, the convective cycle and the persistent cloud that regulates the surface insolation. It is an elegant system that works in the same manner every year.
Thanks. Indeed an elegant system, but with the solar input alone the temperature of the WPWP would have been 247 K.
RickWill, I clicked on this particular comment of yours but I mean to comment on the totality of your comments… Thank you! For me, they are are somewhere between “compelling” and a tour de force.
You aren’t merely retorting to specifics with specifics (though you do provide them) but rightly rebuking the prevalent paradigm and approach. The tone of your comments are a standalone feature of your efforts. Your tone itself is a proper rebuke to the irritating banality of the current climate orthodoxy and its somnolescent priests, with their stupid totems, models.
The professionally obtuse climate bureaucrats aren’t just badly mistaken. They purposely drain the dynamic vitality out of reality. Whatever else models provide, they provide modelers an escape from the enormity of reality – and a way to hide it from the rest of us. They (the models and the modelers) are virtually anti-life.
Your comments – and Willis’ articles – embrace and describe the poised power of our world. Our climate is like a troupe of powerful, athletic artists performing a dance. Amazed at first by the sheer power of it all, and the skill of individuals who happen to catch our eye, it dawns on us they all constitute a kinetic orchestra, a cohesive whole, playing a precise and balanced piece that ebbs and flows, on time and on cue – for a reason, with a purpose.
In the end, the explanation of our climate can’t merely cover the mathematics and physics of it, but also the potency, beauty, and grandeur of it. I believe a core purpose for man is as Observer. To be worthy of that task, he has to be a scientist and a mathematician, but he must also be a poet.
LGL, as usual, you are misrepresenting what I said, which was:
Do try to keep up. A YEARLY AVERAGE basis, not one day at a time.
w.
I could have commented on that but not here to waste time.
Instead, this: http://virakkraft.com/WPWP.pdf was an interesting exercise until the last two slides…
The temperature trend in the Nino34 region is down:
http://climexp.knmi.nl/data/isstoi_v2_190-240E_-5-5N_n.png
The tropical ocean temperature trends over decades are zero. Whether there is a positive or negative trend depends on the time of the start and end points.
There was an expansion in the annual maximum area of warm pools from 2008 to 2016 but that is now reversing.
“The tropical ocean temperature trends over decades are zero.”
What dataset?
WE.
The model in question is a math and physics model, a simple one,
testing and checking your
hypothesis.
A TW model to check WE explanation.
Either wrong or right, it concludes that your explanation has merit, quite a significant one, but still is not an enough potential mechanism to count and explain for the whole thermal compensation as in reality.
It does not challenge or tries to explain reality.
That is my understanding of this TW model experiment.
Pardon me,
but from this point of view, I got to say;
the rationale in your above comment “sounds” more like circular reasoning.
cheers
Whiten
“Tropical cumulus clouds and convection associated with thunderstorms likely moderate planetary temperature changes, but aren’t likely to provide any fixed limit on planetary warming.”
Not the way I read his conclusion.
26-30 C
https://www.researchgate.net/publication/8069906_Stable_sea_surface_temperatures_in_the_Western_Pacific_warm_pool_over_the_past_175_million_years
In the TW model, ocean temperature is capped within the context of a given climate, with a given upper troposphere temperature. But, it’s not invariant as climate forcings change.
As I mentioned in another comment, to establish your hypothesis as anything new, you need to establish that it predicts something different than what would be predicted by established models and theories.
I take your hypothesis with regard to tropical thunderstorms as being that there is an absolute temperature limit that is imposed on ocean surface temperatures.
What my TW model establishes is that an alternate hypothesis, rooted in simple physics and involving only a relative temperature limit, which can explain ocean surface temperatures being limited in the context of the current climate.
That weakens the case for saying that any data about Earth’s current climate supports your hypothesis, because that data does not differentiate between the two hypotheses.
(The model also weakens the case for believing that your procedure for predicting how temperatures respond to forcing is likely to be valid.)
It’s true that the TW model does not explain long-running-stability in the temperature of the Western Pacific Warm Pool (WPWP).
But, there are global phenomena in the data you’re citing that the TW model doesn’t try to address (e.g., the Eastern Pacific is cooler than the Western Pacific). So, while the TW model doesn’t address that phenomenon, the phenomenon of the WPWP doesn’t establish that your hypothesis is any different than what conventional climate modeling techniques would predict.
I get frustrated by how frequently, in climate skeptic circles, people say “conventional theory can’t explain X” without ever actually checking to see what conventional climate science or physical theory predicts. Usually, people’s guesses as to what conventional theory predicts are wrong, and they act as a “straw man” to be knocked down, without ever addressing what conventionally theory really says.
I’m not saying you’re doing that. But, I haven’t seen you do anything that establishes that what you’re observing isn’t perfectly predictable and explicable via physical models which are rooted in established theories and techniques, and which might not have the implications that you believe your hypothesis has.
Maybe standard climate models would predict that the WPWP temperature should have been stable over that period?
(As I mention in my other comment, there is a GCM that anyone can run, though it does require purchasing a license. I’m curious what that would predict about the WPWP during that period—if it has enough flexibility to model that period. There are also place where it appears that one can get GCM source code, if anyone is curious about what assumptions are embedded.)
* * *
It would be interesting to look at possible temperatures during other geologic eras. One reference suggests that ocean surface temperatures during the Cretaceous were likely limited to about 30°C, but at the poles the temperature was 14-17°C, so that the planet’s overall temperature was far warmer.
On the one hand, information about the Cretaceous might seem to support the hypothesis of there being an absolute cap on ocean surface temperatures. Yet, it would not support the hypothesis that such a cap places any limit on planetary warming, since the planet was on average much, much, warmer during the Cretaceous.
Matching and predicting earths albedo seems to be the challenge.
https://reality348.wordpress.com/
Dr. Wentworth, two things: 1) Willis doesn’t make use of the 3.7W/m² per doubling of CO2 used by climate warming protagonists. He uses actual satellite data and observations of cloud formation and the timing for onset of thunderstorms and their behavior as a lifelong sailor and resident of the tropical Pacific.
2) Your noting that Willis neglected the additional warming from back radiation of longwave infrared from clouds shows you have no idea of how these towering violent heat engine storms work. They behave like a chimney, the warm wet air is conducted in a rocketing updraft that moves it up to the stratosphere, bypassing the troposphere to where the sensible heat and the release of latent heat of water drops and ice is readily emitted to space. Lapse rate in a chimney is meaningless.
It also means that your assumption that atmospheric layer-2 is unvarying, most pariculary in the tropical region, is incorrect. You have too tame an atmosphere!
Gary
Exactly
To quote Willis: “Then I multiplied that by 3.7, since in theory the forcing increases by 3.7 W/m2 when the level of atmospheric CO2 doubles.”
I did not say that Willis neglected this. I said that my own TW model neglected this.
The lapse rate is what determines when and if that storm (chimney effect) will be initiated.
Did you look at the data that supported this assumption of a layer with a temperature that doesn’t vary much with latitude? Yes, storms fire air and water vapor all the way up into the stratosphere. But, there is still a layer (at around 190 mbar of pressure) where temperature is relatively independent of latitude.
In the last paragraph of the section labelled “Overview”, I got stuck at this sentence:
“Unfortunately, the procedure predicts an increase in mean global surface temperature that is too small by 45 percent.”
Too small according to what or whom?
Observations?
Raw or adjusted?
Surface or TLT?
Radiosonde, or satellite, or both combined?
Adjusted values of ocean warmth using buckets and ship intakes?
Adjusted ARGO floats that originally showed cooling of the ocean but were adjusted to show the expected amount of warming?
Only warmistas think there has been anything but cyclical variations that overwhelm and subsume any putative CO2 induced warming, so what does it mean to say this?
The US has not warmed at all.
Using data produced by all sources prior to the era of global warming alarmism, there is no increase over time periods up to as much as 100-140 years!
Roll back the erasure of the pause, and refer to the widespread conclusions that as of the late 1980s, there had been zero overall warming, and we are left with the distinct possibility that there has been no actual long term warming.
Last month the UHA satellite data showed a temp equivalent to a period which is known to be (prior to the highly dubious “adjustments”, of course) the coldest the Earth has been in 100 years.
What if all these adjustments are really just fudging, as was admitted by the people who make them in the climategate emails?
So…what warming is being used an an “actual” value for the purpose of comparison?
This sentence and how to interpret it illustrates vividly how one must make certain assumptions in such exercises, and the conclusion one comes to is or can be wholly dependent on which assumptions one starts with.
This is of course, and always has been, the big problem with models.
But in the modeling world models trump observation, hence my problem with the whole paper. Some have stated that you use models to test observation, ugh, models are an attempt to mathematically explain observation and as such need to be tested against observation. Model usefulness comes from the ability to mimic observation end of story.
WE proposed a process for predicting the response of a climate system to a “forcing.”
The claim is that the process must produce the right answer.
If the process is generally valid, then it ought to work in both the real world and in simplified versions of the real world.
I tested the model in a simplified version of the real world, where it is possible to compute both what actually happens in that simplified world, and what the procedure predicts.
The procedure made predictions that don’t match what happens in the simplified world, TW.
I examined why the procedure produced predictions that didn’t match what happened in the simplified world.
Those reasons are reasons that one can expect to also apply in the real world.
This indicates that the logic of the prediction process is broken and untrustworthy.
If you’re suspicious of “models” it’s important to recognize that WE’s procedure for predicting the response to “forcing” is itself a model. I tested the internal consistency of that model, and found that it is not consistent — in a situation where the outcome is known, it doesn’t predict that outcome.
Bob,
Thank you for the reply.
I have to say, I am still pretty fuzzy on this aspect.
I was not aware that WE had predicted any increase.
In his essay Surface Response to Increased Forcing, WE wrote:
This is a prediction. I’m not sure WE understood it as a prediction; perhaps he thought it was an irrefutable logical conclusion based on data. But, it wasn’t. It was a prediction based on some inferences about the significance of certain data. But, the inference was based on implicit assumptions that aren’t rigorously justified, and which are wrong with regard to my model, and likely wrong with regard to Earth’s climate.
One could maybe think that your model for GHG forcings could be a little too simple. First of all the forcing of CO2 depends on where it takes place: upper or lower atmosphere, high or low latitude (sometimes it heats, sometimes it cools). The concentration dependence of the forcing is not linear. On top of that, presently the absorption bands of the main GHGs (water and CO2) are almost saturated (at sea level, in the upper atmosphere, or both?).
That’s reflected in the TW model. The impact of the forcing differs in each of these locations.
That’s also reflected in the TW model. There is no assumption of a linear dependence on concentration.
Saturation doesn’t actually preclude there being an impact to increasing GHGs. This was demonstrated, for example, in my prior post, where I showed that adding additional optically opaque layers to an atmosphere still increased warming.