Guest Post by Willis Eschenbach [See update at the end]
Thanks to the excellent comments by folks here on my post “A Request for Peer Preview“, I thought I’d go down the rabbit hole of the surface response to increased downwelling surface radiation, AKA “radiative forcing” or just “forcing”.
Surface radiation includes the net solar or “shortwave” forcing plus the downwelling “longwave” infrared thermal radiation from the atmosphere. On a global 24/7 basis, the sum of these two averages about half a kilowatt per square metre.
(Please don’t bother me with claims that downwelling longwave radiation from the atmosphere doesn’t exist. It has been measured, not estimated or modeled but measured, thousands of times by scientists all around the planet for over a century. If you don’t think it’s real, you need to do your homework … and in any case, this is not the place to debate it. I never delete comments on other peoples’ threads, and I almost never delete comments on my own threads, but in this case, I’ll make the exception. Please just take up the debate elsewhere, thanks.)
Now, the most direct way to see how variations in total forcing affect the temperature is to use actual data. So on a gridcell-by-gridcell basis, I took a direct look at how the surface temperature is affected by the variations in forcing. For the surface temperature, I used the Berkeley Earth gridded temperature; and for the radiative forcing, I used the CERES data. I first removed the seasonal variations from both datasets, then used standard linear regression to calculate how much the temperature changed when the forcing changed by one watt per square metre (W/m2) in each gridcell. Then I multiplied that by 3.7, since in theory the forcing increases by 3.7 W/m2 when the level of atmospheric CO2 doubles.
Here’s the result of that analysis:


Figure 1. Change over a 20-year period in the temperature due to the change in downwelling longwave (LW) plus shortwave (SW) at the surface.
Note that this gives us 0.15°C per each additional 3.7 W/m2. As expected, the ocean changes less than the land, because of its greater thermal mass, and again as expected, the poles change more than the tropics. Note that there are large areas of the tropical ocean where the surface temperatures are negatively correlated with forcing. This means that in those areas, when the temperature rises, the clouds rearrange to cut down incoming radiation.
However, there’s a huge problem with this method—it doesn’t give the surface time to equilibrate and adjust to the changes in forcing, because the changes are occurring on a monthly basis. So this is just a short-term response to changing forcing. But what we want to know is, what is the long-term response to such a change?
In my last post, I pointed to a novel way to calculate this. I took the average of each of the Berkeley Earth and the CERES 20-year 1° latitude by 1° longitude datasets I’d used to calculate Figure 1 above. Then I made a scatterplot where each dot is one gridcell. I calculated a LOWESS smooth of the data to show the average trend. Here’s that graph from my last post.

Figure 2. Scatterplot of surface temperature versus downwelling surface radiation. The slope of the LOWESS curve is the change in temperature resulting from a 1 W/m2 change in downwelling radiation.
Upon further consideration, I realized that I could get a more accurate answer by dividing the two datasets up into land and ocean. Here are those results.

Figure 3. As in Figure 2, but for the land only.

Figure 4. As in Figs. 2 and 3, but for the ocean only.
Now, these are interesting in their own right. As we saw in Figure 1, the response of the surface to increased forcing goes negative at high ocean temperatures, but not for high land temperatures. In addition, the data is more tightly clustered around the LOWESS smooth when divided in this manner.
These two graphs lead to the following relationships:

Figure 5. Change in land temperature in °C corresponding to a 3.7 W/m2 change in surface forcing at various temperatures/forcing levels.

Figure 6. Change in ocean temperature in °C corresponding to a 3.7 W/m2 change in surface forcing at various temperatures/forcing levels.
Note that as expected, the change in ocean temperature is smaller than the change in land temperature at a given level of surface forcing.
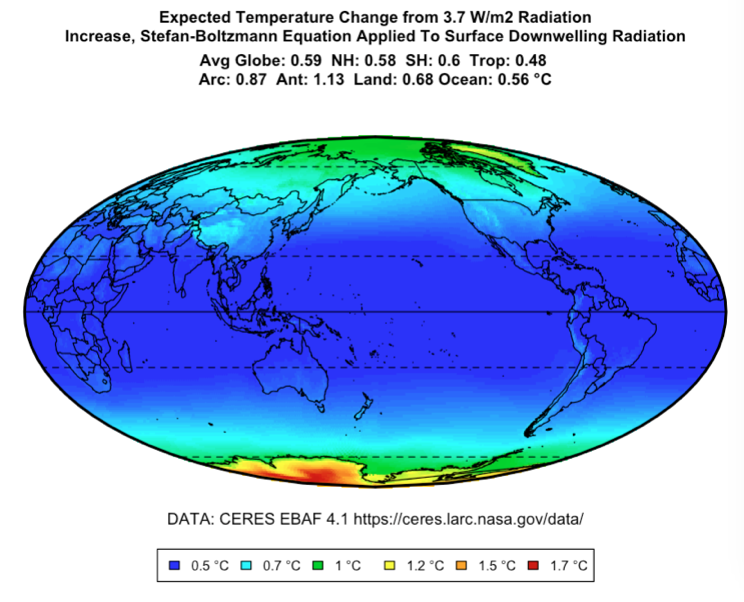
Finally, I took the LOWESS smooths for the ocean and the land, and I used them as lookup tables to let me know the average temperature response for any given level of downwelling surface radiation. I used those temperature responses to calculate the expected temperature change for a global 3.7 W/m2 increase in downwelling surface forcing for each gridcell on the globe. Figure 5 shows the end result of that calculation.


Figure 7. Expected change in surface temperature in the long term for a change of 3.7 W/m2
Some things of note. First, despite this being the result of an entirely different calculation method from that used in Figure 1, the main features are the same. The ocean still warms less than the land. But since this is long term, the ocean has had plenty of time to equilibrate, so the ratio of the two is not as large (Figure 1, ocean 0.08°C, land 0.31°C per 3.7 Wm2. Figure 7 above, ocean 0.39°C, land 0.71°C per 3.7 W/m2 of TOA forcing). We also see that as in Figure 1, the poles warm more than the tropics.
Finally, we see much the same general areas of the ocean cooling while radiation is increasing as we saw in Figure 1.
How well does this represent the long-term response of the surface to changes in radiation? I’d say quite well. Suppose we have two adjacent 1°x1° gridcells of the surface. One is a bit warmer than the other because it has greater downwelling radiation, and the difference between the two temperatures divided by the difference in the two radiation levels is a valid measure of how much the additional radiation heats the planet.
Two key points about this situation. First, the average temperature in those two locations is the result of centuries of them having approximately the same average radiation. We’re talking about variations of a few W/m2 over time, and total downwelling radiation averages about half a kilowatt per square metre.
Second, if over that time the global downwelling radiation has slowly increased due to changes in greenhouse gases, the temperature of both locations will have increased, and that will just shift the points a bit up and to the right in the scatterplots above. But it won’t change the underlying relationship of the temperature differences divided by the radiation differences.
So I’d say that this is a very valid way to accurately measure the long-term real-world surface temperature changes from changes in downwelling surface radiation.
And the bottom line of the analysis? An increase of 3.7 W/m2 in downwelling surface radiation, which is the theoretical increase from a doubling of CO2, will only increase the surface temperature by something on the order of a half of a degree C.
Hmmm …
[UPDATE] An alert commenter has noted that the nominal 3.7 W/m2 per doubling of CO2 is measured at the top of the atmosphere (TOA) and not at the surface. It turns out that for each additional W/m2 of forcing at the TOA, the surface forcing increases by about 1.3 W/m2. This increases my estimate of the temperature change from the 3.7 W/m2 from 0.36 °C to 0.47°C, or from about a third of a degree per doubling to about half a degree per doubling. I’ve swapped out the graphics in Figure 7 for the correct values, and fixed the references in the text.
Here on our dry California forested hillside, the State has officially declared our county a drought area. I went out yesterday to take a look at the two water tanks that together supply both our house and the rental house on our property. Instead of containing 5,000 gallons or so between the two tanks as usual, they had about 1,500 gallons … as you might imagine, I said bad words. Possibilities regarding our two-well water system:
- Float switches in the tanks are bad.
- One or both of the submersible pumps are bad.
- One or both wells silting in.
- One or both wells w/plugged screens on the submersibles.
- The wells need plunging or acid-washing or ??.
- Leakage in the distribution system.
- It’s just the !@#$%^ drought.
Gotta love owning land, you’ll never get bored. For those aware of my checkered past, it’ll be no surprise that I used to drill water wells and install and service pumps for money, but I’m retired, so the guy from the company who drilled our well is coming out on Friday to take a look.
Best to all, stay well, hug your family, glory in the day, because as the song says, “You don’t miss your water ’til your well runs dry” …
w.
OT
https://www.latimes.com/environment/newsletter/2021-04-29/solar-power-water-canals-california-climate-change-boiling-point
Something remarkable happened over the weekend: California hit nearly 95% renewable energy.
I’ll say it again: 95% renewables. For all the time we spend talking about how to reach 100% clean power, it sometimes seems like a faraway proposition, whether the timeframe is California’s 2045 target or President Biden’s more aggressive 2035 goal. But on Saturday just before 2:30 p.m., one of the world’s largest economies came within a stone’s throw of getting there.
What about 2:30 am?
From the article
They also don’t count imported power, just what is generated in-state … and the imported power is usually fossil-fired.
And if all of that impresses you, you don’t understand electric power. It’s just feel-good green hype.
And meanwhile, California power costs have skyrocketed. Other states sell power for around 10¢ per kWhr. Here, I pay an average of TWENTY-EIGHT CENTS PER FREAKIN’ KILOWATT HOUR, so you can stuff your clean green BS up where solar panels don’t work.
ENOUGH! This is off topic. Take it elsewhere. And Gregory, next time you try this, I’ll snip it so fast your head will spin.
w.
Willis,
Pease don’t snip the imp. We all need to see the morons for what they are, and they need to see the thoughtful intelligent responses such as yours above to their ignorance.
Really, Gregor, does not include LA or silicon valley on an afternoon with mild temperatures not requiring heating or AC, while people are NOT at home washing clothes, taking showers, cooking dinner, etc. etc. OR CHARGING THEIR EVs? Why not pick the HIGHEST electricity usage? Because then reality prevails.
Gregor, your idiocy is apparent to most all of us here and your “viewpoint” is needed here, to reinforce the knowledge that this battle is being fought be some really devout religious fanatics that not only need to be defeated but in the end crushed.
Willis, thank you for a great post.
Drake
PS Is Gregor, Russian bot, may be an explanation for the idiocy?
Whoa there, Willis,
I posted this because I thought it would be of interest, especially for you. I am impressed, all right, impressed by the stupidity of Californians, and I used to be one, back when I was young. Why would you believe that I believe in this crap? You are the one living in Cali, so it should be of interest to you when The LAT publishes something like this. Where in WUWT can I post this if not by OT? Snip my head off? Lay back and have a beer or two…
(I refrained from DELETING your off topic post because it was allowed to stand, but you do it again I will just delete it no matter what) SUNMOD
Gregory, if you didn’t believe it, you should have said so, because it certainly wasn’t obvious from the comment.
In addition, putting a wildly OT comment up as the first comment on a brand new post? VERY bad manners.
Finally, you say:
Say what? There are literally dozens of posts on WUWT, including many of my own, regarding renewable energy. On any one of them it wouldn’t be OT. For example, you could put it as a comment on my recent post The Latest CO2 Fantasy.
w.
Your post sure didn’t sound like you were skeptical
If you had been honest, all the replies would be different
Seems like you just wanted to drop a firecracker into the nest and watch the ants scatter
> “95% renewables…. on Saturday just before 2:30 p.m., one of the world’s largest economies came within a stone’s throw of getting there.”
Of course they still couldn’t stop producing wasted non-renewable power as a demand cushion and expected loads later.
In your mind, if I can use the term so loosely, making 95% for a few seconds on one day, proves that we can 100% all of the time soon?
PS, over the weekend, most factories are shut down, so I suspect you are hitting 95% of a pretty low target.
Call back when the average percentage gets above 10% for an entire week.
Yes, sustainable, renewable – but not intermittent – electric production, which is ideally generated by green, not Green technology.
OT. ‘Fleeting moment’ is correct. However, it seems that what is always forgotten is that during that time the gas turbine power stations have to be paid even though though the are not supplying power to the grid. It is this necessity to pay for backup which makes renewables so blessed expensive. The alternative doesn’t bear thinking about.
According to the ISO, for 4 seconds.
Willis / mods
Can we request the blog devs to provide a way for the authors/mods to flag OT posts and alter display such that they show up as “collapsed” by default, showing maybe 5 lines of the top sub-post, but then still allow users to “expand” the OT post and its sub-posts if they want to delve in?
E.g.
Trollboy
May 5 2021 10:00 am
Blah blah
Blah blah
Blah blah
Blah blah
Blah blah [cut off after 5th line]
<This post was deemed to be off-topic, click to expand>
Good post Willis, as usual. Your comments on increased forcing generating increased clouds brings up a question in my mind. If a short term forcing occurs and generates clouds, do the clouds persist in the atmosphere long after the forcing goes away? Like at night when the forcing is gone, do the clouds remain to provide further negative feedback? Past my expertise at this point but on a side note, my sewage pump failed the other day and the chore of draining, cleaning and rebuilding was fun, fun, fun.
Clouds at night tend to hold in heat in like a blanket so it has opposite effect (positive feedback) versus clouds in daytime which can block the sun’s direct isolation
Willis: Very interesting analysis as usual. One question: Figure 6. shows data for ocean surface temperatures down to -26 C. I would assume that from about -2C down the surface would be ice, not liquid water. Wouldn’t that be likely to result in a significant discontinuity due to albedo difference? I would expect both land and sea surfaces at less that -10C to be either snow or ice so the dissimilarity is surprising to me.
Good question, Rick. Sea-ice albedo differences are much smaller than folks think for several reasons.
• Much of the time the sea-ice area and surrounding areas as well are cloud-covered, and cloud albedo is very similar to sea-ice albedo.
• Much of the time the sun is at a low angle, and at those angles the ocean albedo is very similar to sea ice albedo. Look at the glare in this picture.
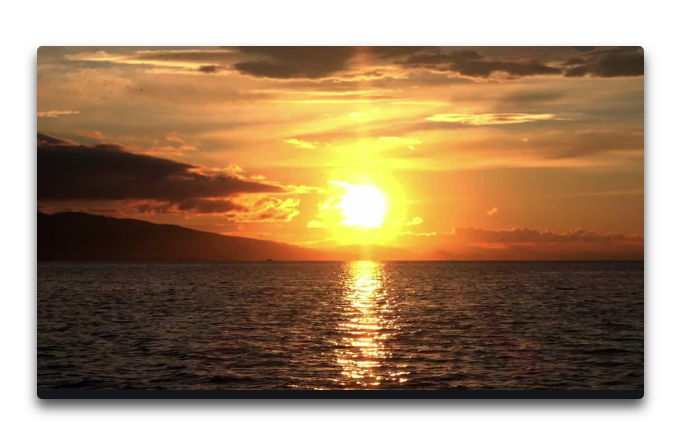
• Most of the time, when the sea ice is around the sun isn’t and vice versa.
• When the sea-ice is around and the sun is around, it is going at a slanting angle, so there’s a lot of loss to atmospheric absorption. This leaves less to reflect.
Regards,
w.
Rick, for ice to form on land, you need both cold temperatures and a source of water.
That is, you can’t assume that just because it’s cold, that the land would be covered by ice or snow.
Willis, please add atlantic-centered maps.
Hey, Hans, always good to hear from you.
Done.
w.
Hope the well issue is sorted quickly.
I grew up in rural Scotland where you’d think water wouldn’t be an issue. The water came from a spring up the hill, into a three tier storage tank. The spring never actually failed but on a couple of dry summers we had to ration ourselves as the flow was so low a decent bath used a couple of days output from the spring. The modern world with clean water and plentiful energy is a golden age.
I am finding your current series of articles and the comments interesting and informative, so thanks for taking the time to write them.
We tend to forget what a miracle it would have seemed to our grandparents (mine, anyway) to be able to have power and light at the flick of a switch, or hot and cold running water at the twist of a wrist, or comfortable heat throughout a house.
If the greens have their way, our grandchildren will be considering it a miracle as well.
Agreed, Dave Yaussy!
Especially, that if/when my grandparents had installed electricity, they couldn’t afford to turn it on.
Their perishable goods were stored in a “cold cellar” they dug in the back yard.
When you wanted milk for your cereal, you went out back, pulled a tarp off, crawled under the dirt covered roof, got your milk and returned the same way.
Home grown vegetables, e.g., cabbages, Brussel sprouts, lettuce, carrots etc. were kept in the cold cellar.
“!If you don’t think it’s real, you need to do your homework”
The question is does it do what it says on the tin?
Richard Feynman on Pseudoscience
As far as Richard Feynman’s doubts about the supposed validity of carelessly done science (i.e., science with insufficient self perception or insufficient skeptical diligence), his example being the claimed superiority of organic farming, my reaction to this is a big ‘hehe’. At the same time, when it comes to the most basic premise of the head posting here, it is difficult to know where an incisive skepticism ought to take a person? Detecting long wave IR at the ground as coming from the atmosphere is one thing, but does anyone know for sure that doubling CO2 would increase that a certain amount, that is, 3.7 Watts/square meter?
Anyway, I assume that the datasets that Willis E. uses do represent a valid measured estimation of how much IR power is coming down, and how that is affecting the temperature at the surface. The grand ‘whole Earth’ conclusion of roughly 1/3 degree C. per doubling of CO2 just sounds a lot like an estimation I once read by Dr. Lindzen, in the context of estimating negative feedback (cloud “iris” effect).
The most incisive question that I have at this point, given the persuasive nature of Willis Eschenbach’s conclusion here, is to ask, just how is one third of a degree temperature ’cause and effect’ resulting from doubling of CO2 any different from a conclusion of exactly *zero* degrees overall from such a doubling? Do we have any prospect that such a result for CO2 greenhouse sensitivity could be in any way corroborated as an actual climate change result for the entire Earth system (with the total temp change averaged and verified) at any point in the foreseeable future? Even if advanced science could effectively corroborate such a small overall effect, why should anyone care?
David,
Thanks for commenting. The issue is this. It is physically impossible for a body that only contains low frequency energy to transfer high frequency energy to another body that contains energy at a higher frequency level. The low frequency source cannot pass across what it does not have.
When I was twelve or so, I built a little two tube AM radio transmitter, an “Edu Kit” it was called. The low frequency sound of my voice was able to go right in to this thing, mixing with the much higher frequency radio carrier signal, so that I could hear it on the family kitchen radio at 800 KHz or whatever. So, it’s kind of complicated, you’ve got sidebands there, if you want to get technical. But still, there’s no problem with power moving around that way?
David,
Your analogy is not relevant. The low frequency sound wave is modulating the high frequency carrier radio wave.You are now talking about a machine that involves sound and electromagnetic waves .I am not talking about a machine so why are you?
I agree that the machine I mentioned is modulated in a particular way that would be unlikely in a natural flow setting — with the modulation even producing matching side bands in the analysis of that kind of modulated outcome. However, that sort of situation, while a very particular outcome in itself, is *still* a valid example of frequencies mixing, i.e., of beat frequencies resulting from the modulation and then producing those sidebands. My point is, there’s no fundamental physics to prevent different frequencies from mixing in some way.
Now use your imagination and think of other examples of frequencies mixing. In the world of music generally, say, does the high frequency E string on a mandolin somehow prevent the low frequency G string from sending sound power in any particular direction? It seems to me that all the strings send out power in all directions, to mix and produce harmonics and beat frequencies as they may.
In the situation of radiant light and heat that warming theories try to describe, you almost seem to be saying that longer EM waves and shorter ones somehow just can’t mix or interact for a total effect on the air, or on the ground, or wherever? Or have I misunderstood, do you maybe have an idea about the ground absorbing one thing better than another, something like that?
Mixing frequencies in a machine and absorbance of electromagnetic energy in molecules are two entirely different things. If you insist on a radio analogy, think of a receiver that only responds to ONE frequency. No energy in any other frequency is allowed. That means no interference, no sideband frequencies, JUST ONE FREQUENCY.
why on earth would there only be a response to just one frequency? the frequencies that affect a water molecule are well known and easily testable. some are high, some are low. IR is a large part of waters absorption spectrum.
i think seeing the difference between low frequency rotation and high frequency transition of the molecule is what is confusing the issue, so think of the basics. a hot/warm object will radiate em. to test this, use an IR imager/thermometer or the like, you can see this radiation because it exists. the amount of this radiation will be guided by its temperature, the frequencies (and there will be many frequencies) of this radiation will be guided by the absorption spectrum of the object you are testing.
whether the radiation from that is enough to cause rotation or high frequency transitions of other molecules will depend on the amount of photons (higher intensity = more photons, not frequency changes).
It’s possible for a material to absorb radiation at only certain relatively specific frequencies. But, only gases work that way.
Solids and liquids don’t work that way. They absorb all radiation frequencies within broad bands of frequency. A material like dirt absorbs essentially all frequencies. Seawater absorbs most frequencies as well, despite lower absorptivity at optical frequencies.
So, Philip’s implication that gases can’t send radiative energy to the surface of the Earth is just silly. Dirt, trees, and seawater easily absorb the radiation emitted by atmospheric gases.
Absorption and emission spectra for these materials have been measured. The measurements show absorption in excess of 90 percent at all the wavelengths associated with downwelling longwave radiation.
Most of those measurements weren’t done by climate scientists. They were done by scientists in other fields who needed that information for other purposes. So, whatever your opinion of climate scientists, that’s not a reason to doubt the observation that materials absorb those wavelengths.
Unfortunately, nothing in what you write is true.
Bodies do not have “low frequency” or “high frequency” energy inside. They simply have energy.
Radiation emitted by a body does have a frequency.
The only way in which that frequency matters is any given type of matter absorbs different frequencies to a different extent, as determined by the material’s absorptivity at that frequency. The solids and liquids that make up the Earth’s surface have been measured to absorb radiation at nearly all frequencies, including the frequencies emitted by greenhouse gases.
Once radiation has been absorbed, its frequency no longer matters. It’s just energy.
You’ve apparently been taken in by the bizarre idea that the radiation emitted by gases can’t be absorbed by solids and liquids. This belief is inconsistent with what scientists and engineers have known for around 150 years. I’ve written a detailed debunking of this idea elsewhere.
Ironically, you seem to be believing pseudo-science.
I think that’s pretty close, Philip, but I would write it like this: radiation does not travel from colder bodies to warmer ones. There is a defined relationship between temperature and EM frequency, so your statement isn’t that much different, but I think it is clearer and less confusing when written based on temperature. (Lots of people, like Willis, get confused anyway, but there’s no help for them.) And no, the datasets he is using do not represent a valid measure[d estimation] of the downwelling longwave infrared. They are inferred instead, because no one has been able to measure them, because that radiation does not exist.
Willis, you should note that when people measure DWLWIR with a pyrgeometer on the ground at night, which indeed they do, they get negative numbers (i.e. upwelling, not downwelling). You seem to be trying to sell us the idea that those negative numbers are actually positive numbers. (I do acknowledge that you are not the only one doing this, all the pyrgeometricians do it, because none of them seem to understand quantum physics. Makes sense, they’re all climate “scientists” after all.) Are you sure you’re paying attention? Does this sound like The Team’s upside-down Tiljander proxies? They got away with that, too, somehow…
I only found one reference to a team that managed to get a positive number for their nighttime measurement, and they did that by cooling their sensor to liquid nitrogen temperatures. (It’s a very expensive sensor.) That is not the same radiation that you will see if your sensor is at room temperature, which is why the room-temperature-sensor people don’t see it. (Yes, quantum physics is a hoot.)
Also in case anyone tries to claim that I am saying that daytime DWLWIR doesn’t exist: it does, but it’s coming from the much hotter sun of course.
And sure, Willis, feel free to go ahead and censor me if you can’t cope with the actual argument, and if it makes you feel better. Or, you can just keep on being wrong, whatever suits you… Hahaha “do your homework”, says the guy who is so proud of never having studied any more physics than Physics 101. Really Willis? Really? Maybe you should do *your* homework? Just a thought? Homework isn’t just for other people… and you’re still in your middle youth, you have lots of time to learn at least all of undergraduate physics, and get started on grad physics too. Without that, you have little to no chance of even understanding, never mind winning, an actual physics argument. And no, physics is not something that most people can derive in their heads from first principles, it’s going to take a lot of studying. And no, it’s not about “proofs” either. That would be math, not physics.
Steve Keppel-Jones May 10, 2021 1:57 pm
Here are the specs for a typical stand-off infrared thermometer. Right on the side, it says “Infrared Thermometer”, and states that it can measure down to a temperature of -58°F (-50°C).
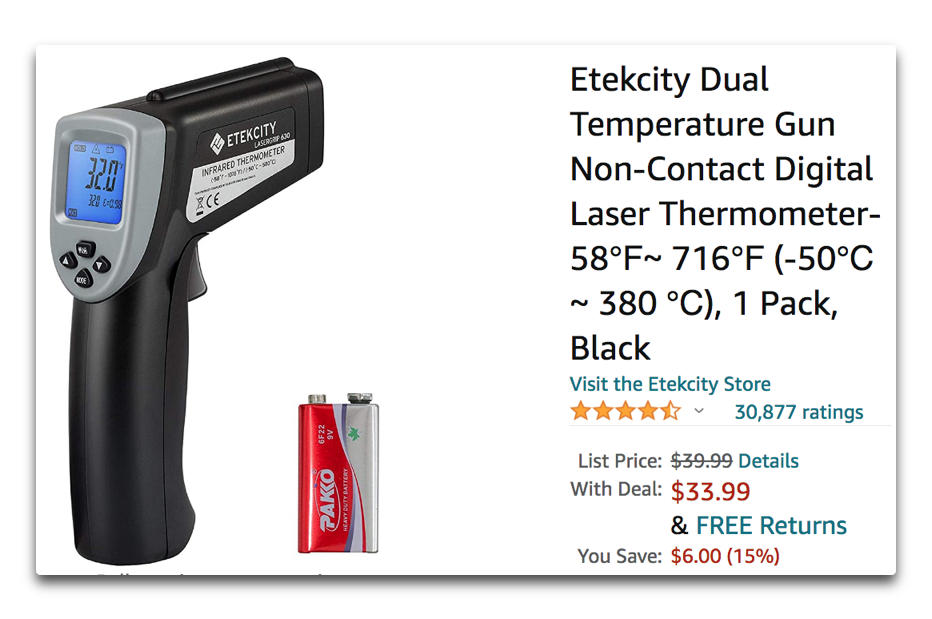
Now, it can do that when the infrared thermometer is at room temperature. And it does it by measuring the infrared radiation coming from the object and being absorbed by the sensor in the thermometer. The more IR absorbed, the warmer the object being measured.
But you claim that infrared radiation “does not travel from colder bodies to warmer bodies”.
So perhaps you can explain to us all just how the infrared thermometer can possibly do what according to you is an impossible feat, to measure the infrared radiation coming from an object far colder than the thermometer sensor?
w.
PS—The “laser” part of the description just refers to a built-in laser pointer that lets you see where the thermostat is aimed. Nothing to do with the temperature measurement.
PPS—You go on to try to bite my ankles, viz …
My advice? You might want to emulate the rooster, and wait until it’s actually dawn before you start crowing …
For people interested in real-world measurements of what some folks say doesn’t exist, the US maintains an entire network of SURFRAD stations. SURFRAD is an acronym for surface radiation, and that’s what they measure. Here’s a typical 24-hour record of downwelling longwave radiation from the atmosphere, you know, the stuff that some folks claim is just a fantasy.
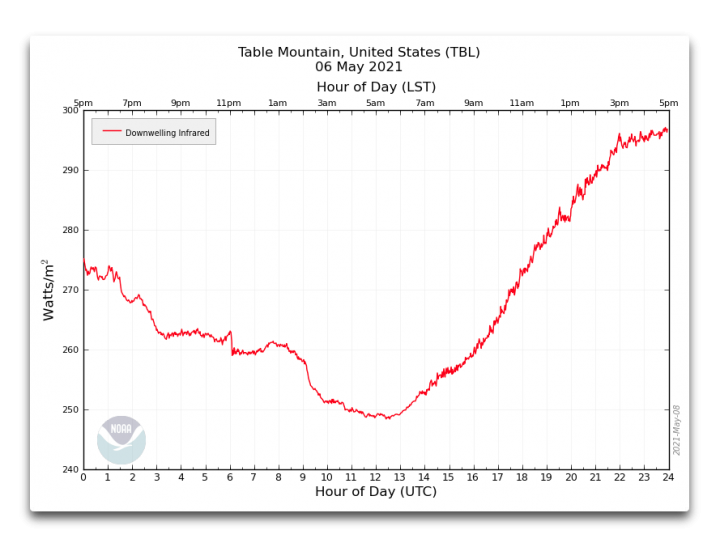
You can find a host of up- and downwelling shortwave and longwave SURFRAD records here. The idea that these radiation flows don’t exist is childish nonsense.
w.
Childish nonsense? Well… you should see how they come up with those measurements using pyrgeometers. I have no idea how the device you pointed me to works, but what it is probably doing is detecting negative energy flow (from the device to the cold object, because there isn’t going to be any going the other way) and reporting that as negative temperatures. That’s what the Eppley pyrgeometers do, the ones SURFRAD uses, and then do you know what those crafty devils do next? They simply add a completely fictional 320 W/m2 or so to the -70 that the instrument reports at night, and claim that that is your 250 W/m2 downwelling IR. Are you sure that is science? Or is it just science fiction?
I do appreciate that you don’t want to have this argument in this thread, but if that was really what you wanted, you shouldn’t have included incorrect statements in your theory. You can still make your main argument while including correct descriptions of atmospheric energy flows, so you should try that. You will need to include the non-radiative energy capacity and flows though – all of them. Just like Strong and Plass admonished us to do way back in 1950. Clearly, the climate science field has gone in a different direction, for their own reasons, which we know all about here.
Steve Keppel-Jones May 13, 2021 2:35 pm
Pass … when a man tells me he doesn’t understand how an IR thermometer works, but despite that he wants to lecture me about IR works and his claims are in total contradiction to all established physics, there’s no upside in that discussion anywhere.
Pass.
w.
“a type of infrared thermometer—works by measuring the amount of infrared radiation emitted by an object. The emitted IR radiation is focused onto a thermopile using a lens; the thermopile then converts thermal energy into electrical energy, and finally, these electrical signals are used to determine the temperature of the body.”
That’s not heat it’s just energy and that energy has to be converted to fermions to register on the gun. I don’t see that as a cold body sending heat to a warmer body? Unless I missed something.
Radiation isn’t heat. It’s energy.
Steve wrongly claimed a colder body couldn’t radiate to a warmer body.
Your description says that the radiation from the object at -50°F is absorbed by the much warmer IR thermometer, which he says is impossible.
w.
Actually I found out that it’s even more subtle than that. Willis, you and I are both right. Hurray! And both wrong. Drat! And how can that be? So, you are right that all objects/materials above absolute 0 radiate at all times. That’s Planck’s law, and apparently he didn’t get that wrong. But, if two objects are in thermal equilibrium with each other, even though both are radiating photons at each other, and creating a “photon gas”, the chemical potential of all of those photons (ability to do work) is 0. No energy is being transferred, because of course if it were, that would violate the second law. So you can have radiation, without energy transfer/flow. Let that sink in for a minute. (Individual photons still transfer quanta, sure, but in equal amounts in opposite directions.)
Now, once you have accepted that, because apparently it’s true, we can take a closer look at what NOAA did with those SURFRAD measurements. When they take the negative voltage (at night) from the pyrgeometer thermopile, which measures actual energy transfer (upward, because the ground is warmer than the air, or more precisely, than the GHG in the air that is far enough away to be colder while still receiving LWIR directly from the thermopile), that part of the formula represents photons with a chemical potential greater than 0, transferring energy from warm to cold. So far so good. No one’s going to argue with that, least of all me.
But now, they add another term. This term represents the radiation emitted (in all directions) by the air, according to Planck’s law. So they add the downwelling part of the air’s Planck distribution, and add it to what the pyrgeometer is recording. Then they report that sum as “total downwelling LWIR”.
But did you spot the pea under the thimble? Note that the photons emitted downward by the air are being exactly counterbalanced by the same power of radiation emitted upward by the pyrgeometer at the same temperature, using the same law. All of those photons therefore have a chemical potential of 0. But they added the downwelling part of that photon gas to the measured value from the pyrgeometer thermopile, as if all of those photons were doing an equal amount of work (energy transfer) as the ones the thermopile is measuring. They’re not! It’s not that the various photons themselves are different. But these pyrgeometricians have carefully pretended that half of the radiation in the system (the balancing upward part) doesn’t exist for their purposes. They are adding apples and oranges, and hoping you don’t know the difference. That sounds extremely misleading to me, more or less indistinguishable from outright dishonesty.
(It is basically the same as observing that the ground is exerting 600 newtons of force upward on your feet, and therefore you should obviously be accelerating upward at a great rate. What do you mean you’re not? You must be! Physics says so!)
So your homework is to see if you can get SURFRAD to plot the actual raw voltage measurements from the thermopiles, without any extra terms. This is just as scientifically honest as reporting raw measurements from thermometers, without any adjustments or homogenizations.
Mine is to cease trying to claim that atmospheric DWLWIR doesn’t exist, because it clearly does. I was wrong about that. However, it is exactly counterbalanced by UWLWIR, so that the chemical potential of all those photons is 0 when everything is at (local) equilibrium. There is no energy flow in that case. (I had intuitively simplified my mental model without all the extraneous photons, but apparently that just leads to a lot of confusion in these sorts of discussions, so I had better include them.)
So, where does that leave us in terms of radiative energy transfer (a.k.a. flux, a.k.a. heat)? Well, it is always from warmer to colder, in accordance with the second law, of course. Note that this is not the same as photon direction! Photon gas is all over the place, but not all of it is doing anything useful or measurable. The part that is, always follows the second law. No exceptions, no excuses. And the IR thermometer gun mentioned above is, just like the pyrgeometers, capable of measuring negative energy flow, and reporting the temperature of a target object being below the temperature of the gun due to this negative flow. That doesn’t violate the second law. Heat flowing from colder objects to warmer ones does violate it. (heat being a measure of energy transfer) Photons can flow that way, yes, but heat can’t.
TL;DR: Energy flows from hot to cold, but photon direction is not the same as energy flow.
(Of course, this whole discussion could probably be simplified to the first half of that TL;DR. But people keep bringing up Planck’s law, which sounds to the untutored ear like it is describing energy flow the other way too, so it has to be accounted for somehow. That’s what I’ve tried to do here.)
Do not mean to rock your boat Willis,
but you seem to make the cardinal mistake of confusing the potential with forcing.
Yes there is a connection there, always,
but still one is not the other… in the end of the day.
One of them is not measured or addressed directly by the mean of ‘w’,
wat(s), either in relation of time or space… or both.
Variation in potential either in proposition of observations or otherwise, does not necessarily mean a force variation in relation to it.
The G force to you, does not varie or depend in consideration of your weight…
your G potential…
and it is not measured etheir in wat(s) or kg.
cheers
Whiten, it may be that English isn’t your first language, or for some other reason, but I have no clue what you mean when you say “you seem to make the cardinal mistake of confusing the potential with forcing”.
w.
Sorry man,
No my fault that you fail basic physics.
cheers
I take it that you don’t know the difference either.
Ok,
Whatever you or I may say or think, regardless of the actual language,
or specific favourite definitions or terminology there,
as far as my understanding permits;
“There could not be variation in forcing, delta forcing, outside of the clause of acceleration.
With no chance of variation or delta in motion or velocity, there no chance of acceleration.”
Last time I checked,
basically the basic physic’s still firmly considers the speed of light as a constant, as per the means of General Relativity.
No any chance, according to basics of General Relativity, for a variation or delta of RF…
as there no chance of acceleration in the speed of radiation.
Oh well, unless one marry do with the IPCC post modern astrology.
Hopefully this is good enough English for you.
cheers
Sorry, but like your first comment, I fear that one also is not understandable.
w.
Was not actually a reply to you Willis, even as it being in the same thread.
Thank you anyway…
but still my understanding is that we not in the same page when it comes to what RF is.
Let’s leave it at that… maybe time will assist!
cheers
I do have a degree in Physics. Another in Math. A 3rd (a PhD) in Nuclear Engineering (fusion emphasis). What you wrote is completely unintelligible. It’s just gobbledygook. Unfortunately for you, anyone can easily see that, even people who know nothing about the subject. If you had a real point you would have tried an alternate explanation, perhaps with easily understood examples but you, instead, responded with an insult.
Are your degrees somehow telling you that the delta G force you be under in consideration of a delta motion producing acceleration will be different if your
G potential was 400 kg instead of 100 kg?
Man, you got to go back to your blackboard.
You see, neither the G force or delta G force are measured in Kg.
RF is not measured in wats… or more precisely it can not be measured in wats.
Simple as that.
cheers
You OBVIOUSLY don’t know what forcing is in the current context. Hint: it has nothing to do with the G force. You can’t even spell “Watts”. You’re clearly a pretender who is deluding himself into believing that you’re able to fool anyone. ROTFLMAO at you.
Yes prof,
is not G force… it is R force… difference;
One of them no subject by default to variation, as it no subject to acceleration.
Maybe your PhD may assist you there to figure it out… fingers crossed.
cheers
No such thing. I have two possible explanations for your nonsense 1) you’re a precocious little 12 year old snot, or 2) you stopped taking your meds. Whichever it is, I’m done with you.
Too many meds rather than too few!
You’re absolutely right Meab. I’m a PhD in Chemistry with a CAS in Physics (cristallography). What this guy is saying is just absolute nonsense, and has nothing to do with “real” physics, but resides in the realm of low-level science fiction.
I ask for an explanation, and you reply with an insult?
Pass.
w.
Thanks for explaining your position regarding this particular argument, between us,
at last.
No offense taken though in my part… simply, most, just a little frustration due to English been not my first language.
cheers
whiten:
You display the confusion typical of a weak first-year undergraduate who is not going to make it in a STEM field.
In a mechanical system, the “forcing” on an object is force, measured in Newtons. And a given force acting on a 100kg object will indeed result in higher acceleration than the same force acting on a 400kg object — 4 times greater to be precise.
From Newton’s second law we have:
Sum(F) = m*a = m*(dV/dt)
dV/dt = Sum(F) / m
Your gravitational example is not appropriate here because the gravitational force on a 400kg object is 4 times larger than the gravitational force on a 100kg object, so the accelerations are the same.
In a thermal system, the “forcing” is the power flow into or out of the object, and the potential is stored energy (of which temperature is a key measure).
From the 1st Law of Thermodynamics (in differential form):
Sum(PowerFlows) = dE/dt
For a simple system where the only storage is temperature-based:
Sum(PowerFlows) = m*Cp*(dT/dt)
dT/dt = Sum(PowerFlows) / (m*Cp)
Willis understands this, even if he does not use this terminology. You obviously do NOT!
Allow me to do a “silly” correction there;
“And a given force acting on a 100kg object will indeed result in higher acceleration than the same force acting on a 400kg object — 4 times greater to be precise.”
“And a given potential acting on a 100kg object will indeed result in higher acceleration than the same potential acting on a 400kg object — 4 times greater to be precise,
but still in both cases of ether 100kg or 400kg, under the same (*motion-velocity”), under the same acceleration the force will still be the same”
cheers
Truly silly! Not even close to being actually correct, or even coherent.
You know that the force of gravity in a free fall is the same for both cases, ether the 100kg or 400kg, correct?
Incorrect—it is the acceleration due to gravity that is constant.
Of course I do (if you are talking about acceleration, not force — once again you can’t express yourself accurately)! But you don’t appear to realize, even after it is explained to you, that the gravitational force (in Newtons) on the 400kg object is 4 times larger than the gravitational force on the 100kg object.
This makes your example not at all analogous to Willis’ thermal system.
your reply bothers me for two reasons. First, you display ignorance of the famous Galileo Leaning Tower of Pisa gravitational experiment. Second, you miss the logical flaw I have challenged Willis on below. Neither is a good credibility sign.
Rud:
Huh? I just agreed that the acceleration due to gravity is the same for objects of different mass (as Galileo observed). But that is because the gravitational force on each object is proportional to that object’s mass.
So mathematically speaking:
Fgrav = m*g
a = F / m = (m*g) / m = g (for any m)
And what particular “logical flaw” do I share with Willis?
Ed Bo says:”dT/dt = Sum(PowerFlows) / (m*Cp)”
The issue as I see it is that as m increases with CO2 the dT/dt goes down not up as claimed.
We’re talking about the energy balance at the surface (liquid or solid) and the change in energy content/temperature of the surface from changes in power flows.
Any change in atmospheric mass from 100 ppm CO2 replacing 100 ppm O2 is absolutely trivial anyway.
By the way, what ever you mean or talk about, fooling us into believing you have knowledge in physics, learn first, W = Watt you use to write in several comments constantly wrong.
Thank you for the correction and clarification.
At lest you get it, when it comes to the “real” errors.
Thank you, appreciated.
cheers
Please don’t feed the troll, it thrives on attention. The best way to deal with it is call it what it is, a troll not worthy of your time to reply and this website should enforce troll spiking.
Oh for heavens sake kids — Whiten is obviously not a native English speaker and there is a great deal of confusion of terms and with near-identical words in English which have differing and specific meaning under different circumstances.
Why you all go on and on is the big mystery to me.
Just let it go – – he knows it is a basic language problem he just can’t find he right words.
Personally, I think it may be the confusion between force and a forcing.
What a magnificent and elegant analysis! Many many thanks.
What the heck are those guys at the CMIP5/6-program doing? Can someone please stop the junk science over there and let Willes give them proper instructions. The required data to determine ECS is available, as Willes have shown among others. Nobody can tell me GCM models can do better.
Thanks. Good luck with the well.
Willis,
“The slope of the LOWESS curve is the change in temperature resulting from a 1 W/m2 change in downwelling radiation.”
The curve actually shows the association between temperature and downwelling at a whole lot of different places (some hot, some cold) around the Earth. Correlation is not causation. It is actually more plausible that the radiation results from the temperature. There is an established law about that. The temperature is affected by horizontal transport of heat as well as radiative heat input.
Sorry Nick, your comment is both obscure and not convincing.
The actual sensitivity value has to be positive, of course, but your comment adds nothing to understanding what the actual sensitivity is. Willis is trying to understand. Seems to me you are not at all trying to understand. I am not sure what to make of that, but I doubt it is good.
Who said it is sensitivity to downwelling IR? All it is is an observed association between downwelling IR and surface temperature, as it varies over location. That doesn’t imply the varying IR is causing the temperature variation; there is a stronger case for temperature determining the thermal emission of IR. Sure, something is causing the spatial variation of temperature; latitude variation of insolation is one very big factor.
All it is is an observed association between downwelling IR and surface temperature
=======!!
Congratulations. You have proven that increased CO2 is not warming the Earth. Rather as the Earth warms from the LIA it is increasing outgassing of CO2 from the oceans.
Nick Stokes you said: “All it is is an observed association between downwelling IR and surface temperature”
But Willis states: “Figure 1. Change over a 20-year period in the temperature due to the change in downwelling longwave (LW) plus shortwave (SW) at the surface.”
ie BOTH downwelling black body IR “PLUS shortwave (SW)” = incident net SOLAR “Insolation” through the atmosphere and clouds onto earth’s surface.
Yes, sorry, I should have said net LW=SW radiation. But that doesn’t change the causality issue.
If A correlates with B then
Maybe A causes B, maybe B causes A, or
Maybe C causes both A and B
I think here a version might be that T is primarily affected by SW, which then induces LW, which in turn affects T again in a sort of feedback. Not simple.
In case more water vapor fills the air (for whatever reason) more surface emissions will be absorbed and both air and surface will warm. Perhaps that extra water vapor is caused by more advection, or by irrigation, or by a decennium with more CO2 in the air causing more plant growth leading to higher evapotranspiration etc. The assumption that a higher forcing leads to warming is made under the [implicit] condition ‘everything else remaining the same’.
A higher forcing normally will lead to more water vapor in the air but there might be many more causes for a higher water vapor content like a more effective redistribution of tropical heat over latitudes. At colder places (often the higher latitudes) more water vapor has a warming effect, above oceans with 25+ degrees water vapor enhanced convection leads to cooling. The water and water vapor (and cloud) regulated temperature system of the Earth has the tendency to search for ‘a middle temperature’. The system will rearrange ‘something’ as soon as that middle temperature gets further out of sight (on both sides of the temperature range) but also will adapt itself when the local and regional temperatures get closer to that ‘middle temperature’.
“That doesn’t imply the varying IR is causing the temperature variation; there is a stronger case for temperature determining the thermal emission of IR. ”
Varying IR not causing temperature increase? You just disowned greenhouse theory!
I believe Dr. Lindzen has found that a doubling of CO2 should lead to about 0.6C increase in temperature – very close to your finding. Is there any similarity between your method and his?
IMO, Willis’s is far superior. Hopefully Dr Lindzen will post in agreement, or not..
Actually, that specific 2011 paper has since been thoroughly debunked on methodological grounds. They did try a reposte, and that for shot down also. I covered it in the Climate Chapter of Arts of Truth, and in the day he spent reviewing the book he never challenged my analysis of that specific paper.
Lindzen RS, Chou MD, Hou AY. Does the earth have an adaptive infrared iris?. Bulletin of the American Meteorological Society. 2001 Mar;82(3):417-32. Cited 475 times https://journals.ametsoc.org/downloadpdf/journals/bams/82/3/1520-0477_2001_082_0417_dtehaa_2_3_co_2.pdf See Lindzen & Choi’s review Lindzen RS, Choi YS. The Iris Effect: A Review. Asia-Pacific Journal of Atmospheric Sciences. 2021 Apr 1:1-0. https://link.springer.com/article/10.1007/s13143-021-00238-1 ; “At this point, the strong areal reduction of cirrus with warming appears very clearly in both climate models and satellite observations. Current studies found that the iris effect may not only come from the decreased cirrus outflow due to increased precipitation efficiency, but also from concentration of cumulus cores over warmer areas (the so-called aggregation effect).” From 2015: “It’s nice to see that our ‘discredited’ theory doesn’t seem to go away. – Richard Lindzen “Missing iris effect as a possible cause of muted hydrological change and high climate sensitivity in models” Thorsten Mauritsen* and Bjorn Stevens Nature 20 April 2015 https://www.nature.com/articles/ngeo2414.epdf
Maybe I missed something after having read your post now three times. But I cannot see mathematically how your second method is ‘long term’. It is clear that the first method is ‘short term’—20 years. But the second method uses the same data, and produces a similar result to ‘short term’. How did it get ‘long’, since your look up tables are produced from the ‘short term’ data? The fact that the two are similar suggests to me that they are both ‘short term’. If the second were ‘long term’ it should NOT be similar.
And from first principles (or Monckton’s equation), the no feedback ECS is between 1.1C(AR4) and 1.2C (Lindzen 2012, address to UK Parliament). Monckton’s equation yields exactly 1.16C using his own input parameters. There cannot be a net negative feedback of the magnitude your method 2 infers. Cloud feedback is zero (Ceres clear versus all sky Dessler 2010) to a bit negative (May, here, 2021). But the water vapor feedback is significantly positive (my guesstimate with reasoning given in several previous comments like to May’s recent post on cloud feedback is about half of AR4 because CMIP3 models understate rainfall by about half so have WVF too high—also an explanation for the modeled but observationally missing tropical troposphere hotspot. And plugging Bode cloud ~0 plus Bode WVF ~0.25 into Linzen’s no feedback 1.2C Bode f/(1-f) feedback curve results in ECS about 1.7C, just like the energy budget models or Guy Callendar’s 1938 curve. So an ECS ~1.7C cross check from three completely different methods.
Perhaps you could explain a bit more?
BTW, good luck with the well. If this didn’t happen in the last drought, then it isn’t the drought this time. Its the well. A short story. One year early 1990’s between Christmas and New Years the Wisconsin farm well went out. Bad Flapper valves on the end of the sucker rods, 120 feet down, on a reciprocating arm pump well dating back several decades. The well guy and I had to pull the whole pipe/internal sucker rod string in 0F snowy weather to repair. Ruined two days of my holiday. That summer we tried to put down a submersible, but the old well had a kink about 14 feet down—quarter inch too narrow. Fit the old 3 inch pipe fine, but not the new 4inch submersible. So we plugged and abandoned then drilled a new well about four feet uphill, since we knew the water was good and how far down it was. Blew mucho dollars to avoid future frostbite.
“Cloud feedback is zero”….Rud, how does an otherwise intelligent person like yourself believe such nonsense. Clouds are responsible for half of the planet’s Albedo of 0.304
100% cloud cover would give the same Albedo as Venus or about 0.75. Without any clouds the Albedo would be similar or lower than the Moon, less than .12.
Work out Q per sq.m=So/4(1-albedo) and consider how that can possibly work out to zero….It only works out to zero at the balance point of cloud cover and water vapour generated by mostly SST.
Well this otherwise intelligent person does NOT confound the base albedo about 0.3 whatever with its first derivative change, aka delta cloud albedo given delta T. You do.
We’re on a dAlbedo/dT and dQ/dT tangent. For Q, using So= 1360 and Albedo .12 to .75, calculate T. Then calc dQ/dT…zero won’t be the answer…
Rud, first, the long-term result is twice the short term result, so I don’t understand what you mean when you say the results are “similar”. A 12-foot tall man is not “similar” to a 6-foot tall man.
Next, it’s “long term” because using a 20-year average, each gridcell on the globe is near it’s steady-state average. It’s had thousands of years to get there, and that’s where it is. And so is the next gridcell over.
The same is true about the downwelling radiation. And this is borne out by the close relationship between the two (temperature and radiation) shown in Figures 2 and 3.
So if we increase the radiation on gridcell a to the radiation on gridcell b, and leave it there for a hundred years, the temperature of gridcell a will be the same as that of gridcell b.
And ∆T between the two gridcells divided by the ∆F between the two gridcells times 3.7 is the long-term temperature response at that point on earth to the amount of increased radiation theoretically coming from a doubling of CO2.
Next, you say:
Don’t know about Monckton or Lindzen. But from the derivative of the S/B equation (dTemp/dWatts) applied to the surface radiation, I calculate the following (emissivity = 0).
Average downwelling surface radiation = 509 W/m2
dTdW = 16.2/(W^.75) = 0.15 °C per W/m2 * 3.7 W/m2 / 2XCO2 = .56 °C / 2XCO2
That’s what we’d expect from “first principles”. Here’s how that plays out with respect to the downwelling surface radiation:
I’ve added this information to Figures 2 & 3 in the head post.
Next you say:
Cloud feedback is zero (Ceres clear versus all sky Dessler 2010) to a bit negative (May, here, 2021).
Sorry, but that’s not true. CERES shows the following regarding surface Cloud Radiative Effect wrt temperature:
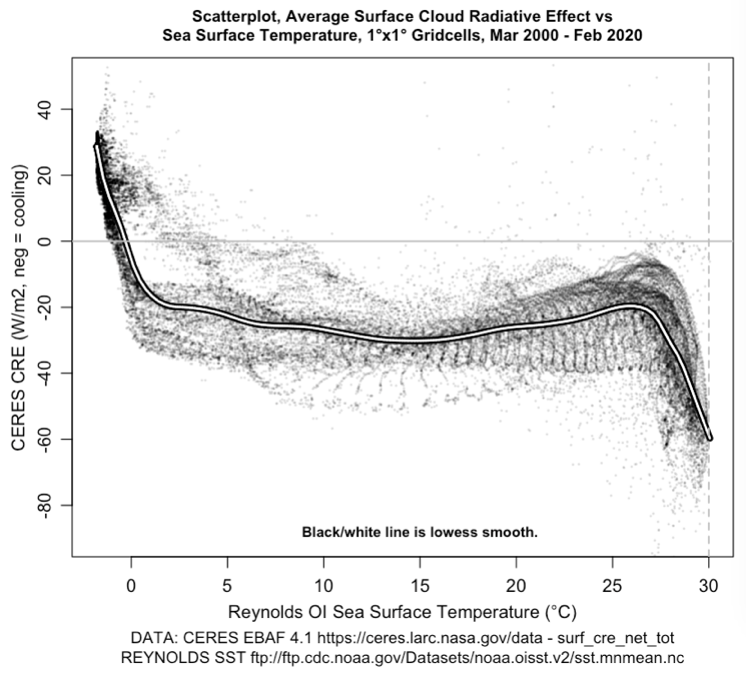
Both at the cold end, and more importantly at the hot end, the derivative of that is strongly negative.
In addition, the surface loses heat via convection and conduction,
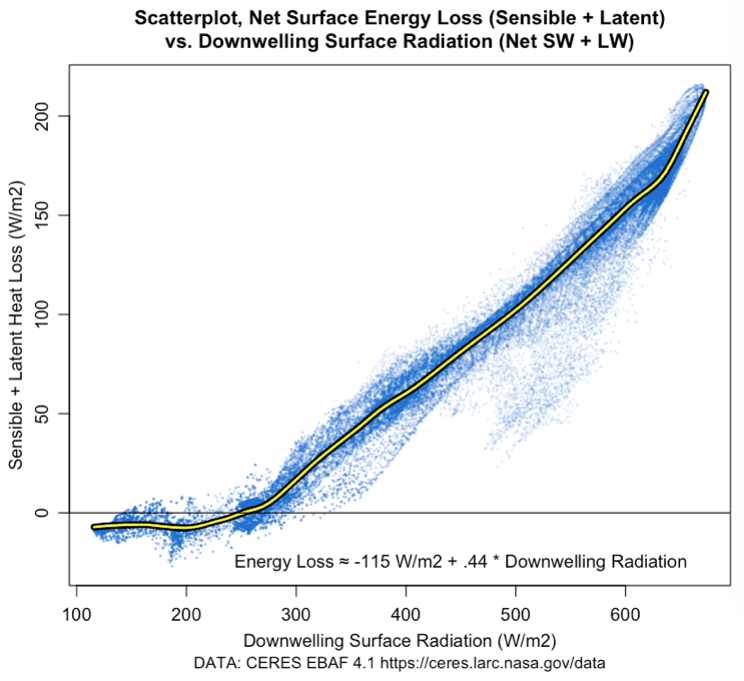
Note that over most of the planet, for every additional W/m2 of downwelling surface radiation, 44% of it goes into sensible and latent heat loss … not shown in a “first principles” analysis.
So yes, the response can absolutely be less than expected per Stefan-Boltzmann.
My best to you, thanks for the detailed objections. Far too often folks just wave their hands and say “Willis, you’re wrong”, but you specified where and how you thought I was wrong.
w.
Willis, much thanks for your detailed reply. But unless I am still missing something, your methodological reply (now read twice) did not address my basic methodological question about how the same underlying data supposedly gives two results when you yourself say it gives one.
Nor does your reply address the fact that your new result is at significant variance (~1\3) to three other independent methods for estimating the same ECS value. They do agree; you don’t. Explain.
Rud, in one method, I’m looking at the changes in monthly temperature and monthly radiative forcing of each individual gridcell over 20 years. Short term.
In the other method, I’m looking at the differences in 20-year average temperature and average radiative forcing between different gridcells. Since they are at some kind of long-term equilibrium with impinging radiation, and they cluster tightly in a line when put into a scatterplot, this is long-term.
As to the fact that my result is different from other ECS results, seriously? Here are past estimates of the same ECS value.

Are you truly faulting me for disagreeing with that? Or are you talking about some theoretical “no-feedback” value?
It seems you’ve picked two sensitivities by Monckton and Lindzen that you call “no-feedback” sensitivities, and you wonder why my result is different. I’ve explained what I call the “no-feedback sensitivity”, which is simply the derivative of the S/B equation. I gave you the equation for that, and showed how it plays out on the earth. That’s the no-feedback sensitivity as I understand it, and you haven’t said why that’s wrong.
I have no idea which Monckton or Lindzen “no feedback” value you’re talking about or how it was derived. Give me two links and we can talk about it.
Here’s what I find from Monckton:
I can’t find anything from Lindzen regarding a no-feedback sensitivity.
Links?
Best regards,
w.
Willis Re: “Energy loss ~ -115 W/m2 + .44 * Downwelling radiation” Please explain what that straight line refers to. i.e. is that to the relatively straight line between ~ 270 and 630 W/m2 Downwelling Surface Radiation? (PS Recommend adding a Zero before .44 to show “0.44” as the dot is easily missed.)
David, the black/yellow line is a LOWESS smooth of the data. The linear regression is of the entire data, but it’s weighted by area so the left-hand end has little effect. And yes, sorry, I left out the 0 in the 0.44 …
w.
Willis, the blue map in your comment above seems to represent the higher temperature response at the low range of water vapor concentrations. At the lowest concentrations extra absorption of surface radiation by small extra quantities of water vapor is very high and so the warming effect.
Wim, that map is the calculation of dTdW, the derivative of temperature with respect to total surface downwelling radiation, using the Stefan-Boltzmann equation. As such, water vapor doesn’t enter into it much. Here’s downwelling radiation.
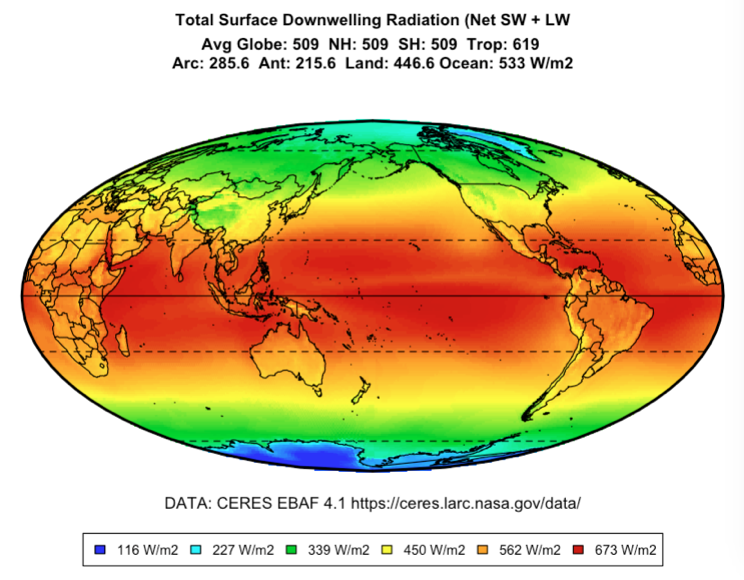
Note that the higher the radiation the smaller the change in temperature per additional watt, which is why the Pacific is blue in the map above.
w.
Willis: “Note that the higher the radiation the smaller the change in temperature per additional watt, which is why the Pacific is blue in the map above.”
WR: Thanks Willis. In my previous comment I was thinking about this graphic from your hand: ?w=605&ssl=1
(source: https://wattsupwiththat.com/2010/03/08/the-logarithmic-effect-of-carbon-dioxide/)
At the lowest concentrations, water vapor must show the same high warming effect as the first CO2 molecules.
The very low concentrations of greenhouse gas water vapor found at very low temperatures (at high elevations, Antarctic, Greenland) make that at those locations a very small quantity of extra water vapor gives a very high secondary warming effect. That is what I think to see in your ‘blue graphic’ – but not in the blue part. The Antarctic and Greenland give the highest temperature response for the same 3.7 W/m2 of forcing. What must be happening is that a non-solar radiative effect (by CO2) enables a little bit more water vapor in the air. That little bit more water vapor is causing a relatively high extra absorption of spaceward directed surface emission, at/near the surface resulting in a relatively high change in temperature for the same initial 3.7 W/m2 (CO2) forcing.
How much extra initial warming do we need to get an extra 400 ppm of water vapor over the coldest (highest) parts of the poles? And how many ppm of water vapor do we actually find at an elevation of 3000 meters and at a temperature of minus 50 degrees Celsius? (I nowhere saw the numbers)
I think: at very low concentrations, water vapor must be multiplying the CO2 greenhouse effect, especially near the surface. At the poles under the driest conditions, a relatively high percentage of surface emissions is able to reach space – a relatively high radiative heat loss results. After the first little bit of CO2 warming, extra water vapor in the air will disproportionally enhance absorption and so cause extra local warming.
(and this is one of the many H2O mechanisms that make surface temperatures propagate into the direction of a certain ‘middle temperature’)
Surely, if that is so why estimate it at all? We could just see how much warmer the tropics are than the temperate regions. Any warming should produce a water vapour feedback.
The tropical hotspot would show that to be the case, if it is significant.
Based on this analysis, an increase in the forcing of 3.7 W/m2 would result in a global average temperature increase of 0.36 C at the surface, averaging 0.30 W/m2 over oceans, 0.50 W/m2 on land, 0.20 W/m2 in the tropics, 0.61 C in the Arctic, and 1.01 C in the Antarctic.
For the oceans, does this refer to the temperature of the air immediately above the ocean, or the temperature of the water immediately below the surface? For a deep area of the ocean, some of the additional radiation that is not reflected may warm the ocean surface, but much of the heat would be conducted downward into the depths at about 4 C, and would have a lesser effect on ocean surface temperatures.
It appears that the temperature-increase calculation was performed assuming that the forcing function was evenly distributed over the globe at a constant 3.7 W/m2. But, for a given increase in CO2 concentrations, wouldn’t the forcing function itself vary with latitude and whether the surface is land or water?
The “downwelling” infrared radiation represents a fraction of the infrared radiation emitted from the Earth’s surface, which depends on the surface temperature via the Stefan-Boltzmann law. The surface temperature would tend to be lower near the poles than in the tropics, resulting in less infrared energy available to be absorbed by CO2 or water vapor and possibly re-emitted toward the earth at high latitudes than at low latitudes. Also, water vapor concentrations tend to be higher over oceans than over land, resulting in more IR being absorbed by water vapor, and the CO2 would have less incremental effect over the oceans than over land.
If the forcing radiation is higher in the tropics than at the poles, this would tend to smooth out the dependence of temperature increase on latitude. If the forcing radiation is higher over land than over water, this would tend to accentuate the difference between temperature increases over continents and over oceans.
If the forcing function could be calculated as a function of location on the globe, this could be the subject of another excellent article by Willis!
Hi Willis,
Very nice post. I am glad you separated the land and water effects… much more clear. The negative feed-back of PM thunderstorms is diminished over land, as expected, so you do not see the drop-off in net sensitivity over land at high net down welling levels. The global average ‘climate sensitivity’ (about 0.33 to 0.5C per doubling of CO2) looks about right to my eye.
.
However, it is prudent to keep in mind that there is constant ocean heat uptake of about 0.4 to 0.5 watt/M^2 of Earth’s surface area, so the final sensitivity value will likely be a bit higher…. maybe 0.6C – 0.7C or so per doubling of CO2. Even at an outside value of 1C per doubling, this is not going to be a catastrophe. Which of course means we are laboring under some crazy assumptions about future warming. These assumptions will end up costing humanity, and especially the poorest of humanity, a fortune for no good reason.
It could also mean all of humanity losing freedom… which is the most “costly” thing of all…
We have to unfortunately bring the battle to their terrain, instead of staying in our “confort zone”. Isolate one or two “key arguments” which are easy to understand, and bring this to the public, also using our adversary’s “weapons”: repeating mantras, priming and framing methods, against them if necessary, even though it’s disgusting. One thing is sure, we can’t afford to let these people win. We already have lost access to most of the media. One has to use efficiently what is left…
“the difference in the two radiation levels is a valid measure of how much the additional radiation heats the planet.”
you means slows down the cooling of the planet … cooler air can never heat up the warmer planet …
This whole thing about cooler air not being able to heat a warmer planet is a canard that is all too common. It reflects a basic misunderstanding of heat.
It is wrong in two ways…..
IR is not heat. It is electromagnetic energy and this so, no matter which way it flows. Outgoing IR is energy flowing out. Downwelling IR is energy flowing in.
Heat is the net flow of energy that results from these opposing flows and it flows from hot to cold.
Having said that, the often heard argument against this statement is that low frequency energy (cooler) can not be accepted by the higher frequency (warmer) object. Proponents of this justification forget that the temperature of an object reflects the AVERAGE of all the energies of the particles in the object. Hot objects have very hot particles bumping around with very cool particles. There are plenty of cool particles to get excited by incoming IR.
More importantly, even knowing nothing at all about the quantum effects in the object, there is a more glaring, easily observable refutation of the canard. To accept it, is to say that the albedo of an object is a function of temperature difference of the source and receiver. If the source is colder than the recipient, the albedo is 1. If it is greater than the recipient it is less than 1.
There’s a Nobel prize for the scientist that can show this step change temperature dependent albedo.
Paul, you are correct that hot objects contain cooler atoms, and cooler objects contain warmer atoms. There can easily be an overlap, and a hotter atom in a cooler object could radiate a photon to a cooler atom in a warmer object. But when I thought carefully about this, I observed that the hotter atom in the cooler object is surrounded by a whole lot of cooler atoms right near by, so why would it radiate preferentially to the cooler atom much farther away? It could, sure, nothing to stop it, but that’s not the way the probability lies… photon wavefunctions are effectively spherical as far as I can tell, and they will normally collapse at the first opportunity. Not the last. Right?
Willis has discovered a remarkable effect of Negative response (cooling), to positive 3.7W CO2 forcing, in the hottest tropical ocean regions. i.e., its fascinating to see:
1) The slope declining in upper right Fig. 4 over oceans that is not in Fig. 3 over land.
2) The Negative slope at the highest surface forcing in ocean regions in Fig. 6 (>~ 650 W/m2) that is not in Fig. 5 over land; and
3) The red/white contour line of 0 warming per 3.7W increased “forcing” outlining blue regions of Cooling with positive forcing in Fig. 7. Which do Not appear in the land response.
This clarifies and expands his previous “emergent thermostat” request for feedback post.
Is this emergent thermostat a major part of the “missing physics” in climate models?
PS How can the horizontal heat flow question be addressed?
Would the transverse temperature gradient normal to the the zero response boundary help indicate the magnitude and provide a way of estimating it?
Yes, he has. I agreed with him on this back in 2014. But, you make a logic error. Theemoregulation would say the world is not warming. But it is; by how much we only know qualitatively. Tree srumps emerging from glaciers, alpine glaciers retreating, that sort of thing. So, we know that there are climate forces much greater than CO2 also at work.
Rud Istvan Re: “Thermoregulation would say the world is not warming”. Your interpretation, not what I said. Willis shows thermoregulation with DECREASING sensitivity to warming with higher net radiation, transitioning to NEGATIVE sensitivity over oceans at the highest net downwelling shown in Fig 4, 6 and 7. That results in REDUCED thermal variation, NOT NO variation. Reminder: Earth has been cooling since the Holocene Optimum, including a Minoan, Roman, Roman and Modern warm periods and a Little Ice Age. The current challenge is that most “climate models” predictions are running about 2X too hot. Willis’ analyses appear to be discovering some of the missing physics.
There are two powerful temperature dependent processes. One is sea ice formation that insulates water and reduces heat loss. The other is convective cloud formation that regulates the upper limit of ocean surface temperature around 30C.
Cloudburst propels water into the atmosphere. It forms cumulus cloud during cloudburst and cirrus cloud as the water vapour above freezing solidifies. At 32C the clouds becomes persistent and the surface loses heat. They regulate to 30C because there is convergence from slightly cooler zones bringing in moist air that cools the surface during cloudburst.
Water is a net cooling agent in the atmosphere; specifically the ice it forms above freezing. It rejects 4W/sq.m/cm on average in July when the ocean surface is warm. Annually it rejects 1.4W/sq.m/cm. In the three cooler months it becomes a heating agent. So it does have a regulating feature all to do with convective instability.
The area of warm pools this century were a minimum in 2008 and a maximum in 2016. There is an upward trend so far this century.
On the other hand the Nino34 region has averaged the same 27C for the last 40 years.
Yes in a nutshell the world has an upper-temperature buffer. The emergency is based on the hypothesis that the world will be too warm to live in yet we came from there and go there in our holidays. Willis has shown we are in very good shape, thank god.
Willis. I have a conceptual problem especially as radiation physics is not my forte. I read and understand the back-radiation principal but have never seen any mention of this being applied to the solar radiation. Surely, if the CO2 concentration increases then a proportion of solar radiation absorbed by that CO2 will be subsequently re-radiated back into space and therefore fail to be incident on the Earth’s surface. Does this not mitigate the forcing from that CO2?At night, however, the forcing from that that CO2 will be effective.
As an aside, given the intensity of solar radiation how is it that during the daytime the ability of atmospheric CO2 to absorb IR emitted by the Earth’s surface isn’t virtually negated (already near ‘saturation’)? Enlightenment would be welcomed if you have the time or the inclination.
John:
CO2 absorbs virtually none of the incoming shortwave solar radiation. It absorbs a significant amount of the outgoing longwave terrestrial radiation. This is the reason for the “greenhouse” metaphor (but it is JUST a metaphor).
And CO2’s absorption of outgoing longwave terrestrial radiation is not affected by the presence or absence of incoming shortwave solar radiation.
What Ed said, beat me to it.
w.
Willis. This is my response to Ed’s comment with which you were in agreement. Any thoughts on my response would be welcome…….
Hi Ed. I’m not sure I would agree with you here as the solar emission spectrum extends up to at least 2mm in wavelength so I should imagine that the intensity of say a mere 15um solar radiation is possibly, therefore, quite significant at the Earth’s orbit. I was hoping to find how this intensity compares with that from the Earth’s surface at different altitudes. If they are indeed comparable then an increase in back-radiation of incident Solar radiation with an increase in CO2, all things being equal, cannot safely be dismissed. Obviously, other factors would come into play principally atmospheric CO2 distribution, CO2 absorption saturation profile, nature of surface, angle of incidence and obviously illumination but first I would like to calculate relative intensities to see if back-radiation of incident Solar radiation would be insignificant as you suggest. As a scientist, you will understand why I like to see the figures.
Less than 1% of solar radiation has a wavelength longer than 4 microns. As a result, CO₂ has very little interaction with incoming solar radiation. It’s really a negligible effect.
It’s probably worth mentioning, just in case Harrison didn’t know, that the different behavior is caused by the difference in the frequency (wavelength) of the incoming vs. outgoing IR. They are not the same wavelength (even though both fall in the range of “IR” radiation)… and thus, CO2 responds to them differently.
“It absorbs a significant amount of the outgoing longwave terrestrial radiation.”
Ridiculously ignoring the incoming LWIR already saturates the molecules.
Willis be pissed I’m still not convince on this; there’s been no actual observations of LWIR downwelling despite his claim. The closest paper made a claim based on satellite observation after clouds left an area that there was an increase of lapse rate temperature which ‘proved’ downwelling.
I guess anytime convection is observed it’s really proof of downwelling.
Ruleo:
There is virtually NO LWIR in the incoming solar radiation. 99+% of solar radiation is in wavelengths shorter than 4 um.
And 99+% of terrestrial radiation is in wavelengths longer than 4 um. And this is known through direct measurements of this radiation. We know its magnitude and its spectrum very well.
No.
“ In terms of energy, sunlight at Earth’s surface is around 52 to 55 percent infrared (above 700 nm),…”.
mkelly – We were specifically talking about LONGWAVE (LW) IR. I even specified the (commonly used) cutoff of 4 um wavelength.
CO2 absorbs IR and LW wavelengths according to the absorption spectrum of this molecule. This absorbed energy is then translated into various vibrational modes of the bonds in the molecule. This has been quantified (Schwarzschild equations) across the main absorption bands (thousands of them) by Rex J.Fleming (Fleming, Rex J._Env. Earth Sci (2018)), and in even more detail by Wijngaarten & Happer. You can find a lot of information there.
Hi Ed. I’m not sure I would agree with you here as the solar emission spectrum extends up to at least 2mm in wavelength so I should imagine that the intensity of say a mere 15um solar radiation is possibly, therefore, quite significant at the Earth’s orbit. I was hoping to find how this intensity compares with that from the Earth’s surface at different altitudes. If they are indeed comparable then an increase in back-radiation of incident Solar radiation with an increase in CO2, all things being equal, cannot safely be dismissed. Obviously, other factors would come into play principally atmospheric CO2 distribution, CO2 absorption saturation profile, nature of surface, angle of incidence and obviously illumination but first I would like to calculate relative intensities to see if back-radiation of incident Solar radiation would be insignificant as you suggest. As a scientist, you will understand why I like to see the figures.
The issue I have is not what CO2 absorbs directly from the sun, but what H2O absorbs from the sun in the “near” IR. It is vastly more than what CO2 absorbs from far IR radiated by the earth. To think that CO2 can raise humidity through a measurable feedback to water is crazy considering the emissivity of CO2 at atmospheric temperature is almost 0.
Jim. I couldn’t agree more but you know that alarmists are focussed entirely on CO2 so considerations of water vapour, except as a positive feedback, are totally ignored. Mann’s latest is that without CO2 water vapour concentrations would plummet along with global temperatures ergo CO2 alone is responsible for sufficient warming to maintain the water vapour concentrations at present levels. One gas to rule them all it seems…… Lunacy!
John:
Checking the reference tables in my old heat transfer textbooks, I confirm that 1% of solar radiation power has wavelengths longer than 4um. The last entry in the table corresponds to 9.6um, and less than 0.1% of the power has wavelengths longer than this. The table doesn’t go further because there is nothing significant after this.
But doing some extrapolation past the end of the table, it looks like less than 0.01% has wavelengths longer than 14um.
With total ToA power flux density of 1368 W/m2, there is 13.7 W/m2 with wavelengths longer than 4um, 1.37W/m2 with wavelengths longer than 9.6um, and 0.137 W/m2 with wavelengths longer than 14um.
So the solar power flux density in the 14-16um absorption band of CO2 is around 0.1 W/m2, which is insignificant.
Ed. Thank you very much for checking the figures, a comprehensive analysis. A great deal less than I anticipated even with the rapid decline from the peak value. As you say insignificant but worth a look.
It absorbs a specific spectrum of the outgoing longwave terrestrial radiation, it does not cover a wide spectrum. Absorbs and scatters a specific spectrum would be more precise.
Terrific analysis Willis! Makes me feel content to wait out alarmist projections!
One question, One comment:
1) Is that a CO₂ atmospheric component doubling from 400 to 800?
I understand a doubling is a doubling regardless of the CO₂ levels with a logarithmic caveat.
I’m just inquiring as to the starting point and perhaps when that start occurs to fix in mind how much CO₂ increase is supposed to affect location temperatures.
Why? Because CO₂ atmospheric proportion has yet to double from the questionable 280 ppm. Double that is 560 ppm, whereas we’re currently around 415 ppm.
A point that places the alleged CO₂ caused temperature increase as incredibly overblown by the incompetent government and alarmist CO₂ trackers.
2) Back on March 20, 2015, Dr. Robert G Brown, at Duke stated:
Following the concept that any temperature increase caused by a CO₂ doubling is logarithmic places the 3.7 W/m2 into context as to which CO₂ doubling is evident in your direct observation and calculations.
Which suggests that for Earth to reach a 0.3°C increase due to atmospheric CO₂ increases, means Earth fourfold increase; 415ppm > 830ppm 1st doubling for 0.15°C increase and 830ppm > 1,660ppm for the second doubling.
Allegedly, Earth has increased from 280ppm since the 1880s to 415ppm currently, a 135ppm increase.
Yet, we’re supposed to be exercised by the effects of a fourfold CO₂ increase.
At 135ppm per 100 years, to reach fourfold CO₂ concentration places that desperate moment well into the future, if the alarmists are correct. Which they have yet to demonstrate.
1,660ppm minus 415ppm leaves a 1,245ppm increase that should take well over 9 centuries to achieve.
Back to the CO₂ doubling question, a current 415ppm doubling to 830ppm should take hundreds of years to reach that 0.15°C increase.
That the rub, certain people call it a climate emergency for something which is well within temperature change that have occurred in the past. With a little luck and a lot of CO2 we might get back to the temperatures that we had at one time. In the past real scientists call those temperatures the climate optimum.
w – I’m interested that your charts show most theoretical warming in the Antarctic (in line with the IPCC and climate models) yet the Antarctic overall has not been warming and the Southern Ocean has cooled. I take this to mean that other factors are at least as strong, which in turn supports your assessment of a low ECS. Reasonable?
Mike, my analysis doesn’t include any allowance for elevation of the surface. In addition, circumpolar winds tend to isolate Antarctica from the rest of the planet. I suspect that those factors change the situation for Antarctica.
w.
The question is not of downwelling radiation, but of gradients and heating, thus the efficacy of the so-called radiative “greenhouse” effect that is not the greenhouse effect.
Nice posting. 1/3rd of a degree C is about in line with what I have been expecting. In any case it is not something that is going to destroy the world as we know it…but the Green response may be.
Water: You probably already know this but check the pressure tanks for silting as well. Sand gets into mine and eventually causes problems if I don’t blow it out. Gotta love water wells.
Surface radiation includes the net solar or “shortwave” forcing plus the downwelling “longwave” infrared thermal radiation from the atmosphere. On a global 24/7 basis, the sum of these two averages about half a kilowatt per square metre.
Just for the hell of it why not work with real fluxes at the top of the atmosphere rather than the contrived nonsense of downwelling short wave and surface insolation.
Consider only the outgoing long wave and the reflected short wave in response to water vapour or ocean surface temperature.
If you want to get the net into the system then it is easy enough to work out the ToA solar input for any time of the year at any location or just use CERES ToA.
Downwelling short wave is unphysical claptrap. It is contrived. Use measurable ToA data.
Attached chart shows the response to SW and LW energy fluxes with respect to ocean surface temperature. This is using real fluxes not contrived claptrap.
Anybody who tells me after 20 years of intense study of the field that what I’m doing is “contrived nonsense” and “unphysical claptrap” has just canceled their own vote. Sorry, after that, I’m not interested in anything you have to say.
w.
There is so much unphysical nonsense in this “field” that it is easy to get the religion unless you understand the basics.
For your own education, do the ToA analysis. You might learn something.
Well Dr Fauci has been an epidemiologist for over 20 years in “intense study”. Think about how you just replied…
Rick, I don’t care. You’ve canceled your vote with me.
Ruleo, I have no idea what Dr. Fauci’s level of study has been, and neither do you. Not a clue. You’re just making things up. Pass.
You guys don’t seem to get it. I’ve been wrong many times, and I’m more than willing to discuss what anyone thinks are my errors. It’s how I move forwards, by folks quoting what I said and pointing out where it’s incorrect.
But someone who comes in raving about how I believe “contrived nonsense” and “unphysical claptrap”, doesn’t quote what they think I said is wrong despite my asking them to do that exact thing, and then claims that downwelling thermal radiation from the atmosphere doesn’t exist AFTER I SPECIFICALLY REQUESTED PEOPLE TO TAKE THAT BOVINE EXCREMENT ELSEWHERE?
After Rick storms in like that full of bluster and bogus accusations, you two think I should blow in his ear, tickle his tummy, make nice to him, and pretend like he’s making sense?
Not gonna happen. If you want to talk to me, don’t come in the door accusing me of being an idiot who believes in contrived nonsense. Even if you’re right and I’m wrong about something I’ll still kick your sorry okole out the door for being an arrogant jerk.
w.
If you had looked you would have seen the specific quote – sorry I missed the quotations in that post!
And the downwelling long wave radiation is contrived nonsense. It does not happen. The energy cannot travel from low temperature to higher temperature. It is the EM field and energy goes from high temperature to low temperature. Same as a power line, high voltage to low voltage. Goes out at the characteristic impedance until the field equilibrates – takes 16 minutes for Sun and Earth to equilibrate.. Exactly the same as the gravity field.
The cloud absorbs radiation and re-emits it at a lower temperature. You can see that at ToA. The downwelling long wave is nonsense – it is contrived. It is unmeasurable (granted there are quasi measurements that are just working on the cloud temperature). There is less cooling because the clouds are higher temperature than space. If you work with radiation data at the ToA then all that goes on below that is irrelevant to the energy balance.
I suggested you work at the ToA rather than the surface for the radiation balance so you avoid all that goes on in between. Just for your own education.
I don’t really know if you can say this. Just look at the GHG molecules: they absorb energy at let’s say IR wavelengths, and then reemit vibrational energy at higher wavelengths e.g. LW. These emissions will send photons (waves) in any direction, which means also downwards…
That’s not quite true Eric, it’s an oversimplification to say that emissions send photons (waves) in any direction. Technically that part is true, but when do those wavefunctions collapse? They’re not going to collapse when they intersect a higher-energy atom. Only when they intersect a lower-energy one, i.e. higher up.
(Not all lower-energy atoms are higher up than all higher-energy atoms, but that’s the general distribution, and the general flow of radiant energy. Exceptions will be miniscule, not the rule, and small enough that we can’t actually measure them.)
Rick:
As usual, you make absolutely no sense. You claim that (downwelling solar) radiation at ToA is “real flux”, but downwelling solar radiation at the surface is “contrived nonsense”.
Both can be and have been measured. By your logic in suggesting use only of ToA values, the amount of cloud reflection is irrelevant to surface temperatures. Nonsense!
ToA is all that matters. Nothing in between the ToA and surface matters to the energy balance.
The ToA energy balance is highly responsive to the surface temperature.
Ice in the sky absorbs OLR and re-emits its temperature between 273K and 220K. It reduces the heat loss in that way. The same ice also reflects incoming insolation. It reduces heat uptake by this process.
The fact is that more water in the atmosphere results in less energy incoming through the ToA. No need for looking at the surface other than how it gets water into the atmosp[here.
Downwelling IR ONLY occurs where there is a temperature inversion and it makes no difference to the ToA.
If you are only considering the surface then you are omitting any radiation absorbed or emitted by the atmosphere. All energy balances should be done at ToA not the surface.
Rick:
You say: “All energy balances should be done at ToA not the surface.
No! If you had ever taken a real thermodynamics course, one of the first things you would have learned is the strategy of performing energy balance calculations on key subsystems as well as the whole system.
The 1st LoT is universal, so it holds for all of these subsystems. The key in analysis — which some students never master — is to select meaningful and analyzable subsystems.
The earth at its surface is certainly such a meaningful and analyzable subsystem. It MATTERS. And we have measurements that it emits around 500*Aearth Watts. This is far more than the 168*Aearth that solar provides. (“Aearth” is the surface area of the earth in m2.) But the surface is not more than a tiny bit out of balance.
You also say: “Downwelling IR ONLY occurs where there is a temperature inversion”.
WRONG! It is always present and easily measured. We know its magnitude and spectrum. You can even detect it with your simple kitchen infrared thermometer.
Brilliant!
Willis, I have a possible article for you. The UAH Data shows no warming what so ever if you select the proper data set chosen to control for the UHI and Water Vapor.
Steps to perform the experiment:
1) Download this Data:
https://www.nsstc.uah.edu/data/msu/v6.0/tlt/uahncdc_lt_6.0.txt
2) Sort the Data by Month and then Year
3) Select the South Pole Data, it is the data set controlled for the UHI and Water Vapor.
4) Create a graphic for each month.
What you will find is that there is 0.00 warming in Antarctica. CO2 increased by over 30% and caused no warming what so ever since 1979. You can also choose desert stations and you will find over 500 weather stations with no warming, some going back to 1880.
Anyway, the above experiment tasks 15 minutes, and it would be great if you published the graphics for each month. Then ask the simple question, do the laws of physics cease to exist in the South Pole. Why does CO2 not cause warming?
BTW, you can see the discussion regarding that experiment on Dr. Spencer’s blog. It has really irritated the alarmists.
http://www.drroyspencer.com/2021/05/uah-global-temperature-update-for-april-2021-0-05-deg-c/
This is not unknown. From Nature magazine:
w.
Yes, that is true, but they explain it away as somehow due to CO2. If you create the graphics, it becomes undeniably clear that if you remove Water Vapor and the UHI Effect you get no warming. I’ve also posted over 500 weather stations that show no warming. Unless the laws of physics cease to exist in places where there is no UHI or Water Vapor Effect, or there is a serious flaw in this CO2 drives temperature theory.
Willis,
Eventually it will become evident that a proper analysis of errors and uncertainty willbe needed before the observations and deductions are fuly understood. This is not a criticism. You have been busy enough to get this far.
For example, that “forcing increases by 3.7 W/m2 when the level of atmospheric CO2 doubles” is prominent in your deductions, but the outcome is sensitive to it. Maybe some effects cross the negative/positive line if it is another value.
Calculations of TOA energy imbalance so often used elsewhere are IMO on very unstable ground. In general, where the difference between 2 or more large numbers is the sought effect, error analysis has to be quite stringent, but you would know this.
Geoff S
Geoff, you say:
That’s the IPCC and NOAA version, that CO2 forcing is 5.35 * log(C/C0) = 3.7
There are other formulations, but for CO2 they are typically within about 0.05° to 0.10 / 2XCO2. So that gives a possible error of a couple percent, well within spec for this kind of analysis.
w.
Willis, how uneven would the 3,7 Wm-2 on average be distributed over the earth’s surface?
The IR-radiation is temperature dependent so there must be a gradient, I would say.
My question is this: If there’s a (significant) gradient, what would it qualitatively mean for your results?
Can it be that a higher latitudes forcing is significant less than average?
Good question. I don’t know of any studies directly bearing on the subject. The problem is disentangling downwelling IR that results from
I don’t think it would make a lot of difference, because the polar areas are not a lot of the earth’s surface. Antarctica is less than 3% of the world’s surface area.
w.