By Christopher Monckton of Brenchley
This is a long and technical posting. If you don’t want to read it, don’t whine.
The first scientist to attempt to predict eventual warming by doubled CO2, known to the crystal-ball gazers as equilibrium doubled-CO2 sensitivity (ECS), was the Nobel laureate Svante Arrhenius, a chemist, in 1896. He had recently lost his beloved wife. To keep his mind occupied during the long Nordic winter, he carried out some 10,000 spectral-line calculations by hand and concluded that ECS was about 5 C°.
However, he had relied upon what turned out to be defective lunar spectral data. Realizing this, he recalculated ten years later and, in 1906, published a second paper, in which he did what climate “scientists” refuse to do today: he recanted his first paper and published a revised estimate, this time in German, which true-believing Thermageddonites seldom cite:

His corrected calculation, published in the then newly-founded Journal of the Royal Nobel Institute, suggested 1.6 C° ECS, including the water-vapor feedback response.
Guy Stewart Callendar, a British steam engineer, published his own calculation in 1938, and presented his result before the Royal Society (the Society’s subsequent discussion is well worth reading). He, too, predicted 1.6 C° ECS, as the dotted lines I have added to his graph demonstrate:

Then there was a sudden jump in predicted ECS. Plass (1956) predicted 3.6 C° ECS. Möller (1963) predicted a direct or reference doubled-CO2 sensitivity (RCS) of 1.5 C°, rising to as much as 9.6 C° if relative humidity did not change. He added an important rider: “…the variation in the radiation budget from a changed CO2 concentration can be compensated for completely without any variation in the surface temperature when the cloudiness is increased by +0.006.” Unsurprisingly, he concluded that “the theory that climatic variations are effected by variations in the CO2 content becomes very questionable.”
Manabe & Wetherald (1975), using an early radiative-convective model, predicted 2.3 C° ECS. Hansen (1981) gave a midrange estimate of 2.8 C° ECS. In 1984 he returned to the subject, and, for the first time, introduced feedback formulism from control theory, the study of feedback processes in dynamical systems (systems that change their state over time). He predicted 1.2 C° RCS and 4 C° ECS, implying a feedback fraction 0.7.
In 1988, in now-notorious testimony before the U.S. Senate during a June so hot that nothing like it has been experienced in Washington DC since, he predicted 3.2 C° per century (broadly equivalent to ECS) on a business-as-usual scenario (and it is the business-as-usual scenario that has happened since), but anthropogenic warming is little more than a third of his predicted business-as-usual rate:

In 1988 the late Michael Schlesinger returned to the subject of temperature feedback, and found that in a typical general-circulation model the feedback fraction – i.e., the fraction of equilibrium sensitivity contributed by feedback response – was an absurdly elevated 0.71, implying a system-gain factor (the ratio of equilibrium sensitivity after feedback to reference sensitivity before it) of 3.5 and thus, assuming 1.05 RCS, an ECS of 3.6 C°.
Gregory et al. (2002) introduced a simplified method of deriving ECS using an energy-balance method. Energy-balance methods had been around for some time, but it was not until the early 2000s that satellite and ocean data became reliable enough and comprehensive enough to use this simple method. Gregory generated a probability distribution, strongly right-skewed (for a reason that will become apparent later), with a midrange estimate of 2 C° ECS:

Gregory’s result has been followed by many subsequent papers using the energy-balance method. Most of them find ECS to be 1.5-2 C°, one-third to one-half of the 3.7-4 C° midrange that the current general-circulation models predict.
In 2010 Lacis et al., adhering to the GCMs’ method, wrote:
“For the doubled-CO2 irradiance forcing, … for which the direct no-feedback response of the global surface temperature [is] 1.2 C° …, the ~4 C° surface warming implies [a] … [system-gain factor] of 3.3. … “
Lacis et al. went on to explain why they thought there would be so large a system-gain factor, which implies a feedback fraction of 0.7:
Noncondensing greenhouse gases, which account for 25% of the total terrestrial greenhouse effect, … provide the stable temperature structure that sustains the current levels of atmospheric water vapor and clouds via feedback processes that account for the remaining 75% of the greenhouse effect.
Unfortunately, the above passage explicitly perpetrates an extraordinary error, universal throughout climatology, which is the reason why modelers expect – and hence their models predict – far larger warming than the direct and simple energy-balance method would suggest. The simple block diagram below will demonstrate the error by comparing erroneous (red) against corrected (green) values all round the loop:

Let us walk round the feedback loop for the preindustrial era. We examine the preindustrial era because when modelers were first trying to estimate the influence of the water-vapor and other feedbacks, none of which can be directly and reliably quantified by measurement or observation, they began with the preindustrial era.
For instance, Hansen (1984) says:
“… this requirement of energy balance yields [emission temperature] of about 255 K. … the surface temperature is about 288 K, 33 K warmer than emission temperature. … The equilibrium global mean warming of the surface air is about 4 C° … This corresponds to a [system-gain factor] 3-4, since the no-feedback temperature change required to restore radiative equilibrium with space is 1.2-1.3 C°.
First, let us loop the loop climatology’s way. The direct warming by preindustrial noncondensing greenhouse gases (the condensing gas water vapor is treated as a feedback) is about 8 K, but the total natural greenhouse effect, the difference between the 255 K emission temperature and the 287 K equilibrium global mean surface temperature in 1850 is 32 K. Therefore, climatology’s system-gain factor is 32 / 8, or 4, so that its imagined feedback fraction is 1 – 1/4, or 0.75 – again absurdly high. Thus, 1 K RCS would become 4 K ECS.
Now let us loop the loop control theory’s way, first proven by Black (1934) at Bell Labs in New York, and long and conclusively verified in practice. One must not only input the preindustrial reference sensitivity to noncondensing greenhouse gases into the loop via the summative input/output node at the apex of the loop: one must also input the 255 K emission temperature (yellow), which is known as the input signal (the clue is in the name).
It’s the Sun, stupid!
Then the output from the loop is no longer merely the 32 K natural greenhouse effect: it is the 287 K equilibrium global mean surface temperature in 1850. The system-gain factor is then 287 / (255 + 8), or 1.09, less than a third of climatology’s estimate. The feedback fraction is 1 – 1 / 1.09, or 0.08, less by an order of magnitude than climatology’s estimate.
Therefore, contrary to what Hansen, Schlesinger, Lacis and many others imagine, there is no good reason in the preindustrial data to expect that feedback on Earth is unique in the solar system for its magnitude, or that ECS will be anything like the imagined three or four times RCS.
As can be seen from the quotation from Lacis et al., climatology in fact assumes that the system-gain factor in the industrial era will be about the same as that for the preindustrial era. Therefore, the usual argument against the corrected preindustrial calculation – that it does not allow for inconstancy of the unit feedback response with temperature – is not relevant.
Furthermore, a simple energy-balance calculation of ECS using current mainstream industrial-era data in a method entirely distinct from the preindustrial analysis and not dependent upon it in any way comes to the same answer as the corrected preindustrial method: a negligible contribution from feedback response. Accordingly, unit feedback response is approximately constant with temperature, and ECS is little more than the 1.05 K RCS.
Why, then, do the models get their predictions so wrong? In the medium term (top of the diagram below), midrange projected anthropogenic medium-term warming per century equivalent was 3.4 K as predicted by IPCC in 1990, but observed warming was only 1.65 K, of which only 70% (Wu et al. 2019), or 1.15 K, was anthropogenic. IPCC’s prediction was thus about thrice subsequently-observation, in line with the error but not with reality.

Since the currently-estimated doubled-CO2 radiative forcing is about the same as predicted radiative forcing from all anthropogenic sources over the 21st century, one can observe in the latest generation of models much the same threefold exaggeration compared with the 1.1 K ECS derivable from current climate data (bottom half of the above diagram), including real-world warming and radiative imbalance, via the energy-balance method.
The error of neglecting the large feedback response to emission temperature, and of thus effectively adding it to, and miscounting it as though it were part of, the actually minuscule feedback response to direct greenhouse-gas warming, is elementary and grave. Yet it seems to be universal throughout climatology. Here are just a few statements of it:
The American Meteorological Society (AMS, 2000) uses a definition of feedback that likewise overlooks feedback response to the initial state –
“A sequence of interactions that determines the response of a system to an initial perturbation”.
Soden & Held (2006) also talk of feedbacks responding solely to perturbations, but not also to emission temperature–
“Climate models exhibit a large range of sensitivities in response to increased greenhouse gases due to differences in feedback processes that amplify or dampen the initial radiative perturbation.”
Sir John Houghton (2006), then chairman of IPCC’s climate-science working party, was asked why IPCC expected a large anthropogenic warming. Sir John replied that, since preindustrial feedback response accounted for three-quarters of the natural greenhouse effect, so that the preindustrial system-gain factor was , and one would thus expect a system-gain factor of
or
today.
IPCC (2007, ch. 6.1, p. 354) again overlooks the large feedback response to the 255 K emission temperature:
“For different types of perturbations, the relative magnitudes of the feedbacks can vary substantially.”
Roe (2009), like Schlesinger (1988), shows a feedback block diagram with a perturbation ∆R as the only input, and no contribution to feedback response by emission temperature –

Yoshimori et al. (2009) say:
“The conceptually simplest definition of climate feedback is the processes that result from surface temperature changes, and that result in net radiation changes at the top of the atmosphere (TOA) and consequent surface temperature changes.”
Lacis et al. (2010) repeat the error and explicitly quantify its effect, defining temperature feedback as responding only to changes in the concentration of the preindustrial noncondensing greenhouse gases, but not also to emission temperature itself, consequently imagining that ECS will be times the
degree direct warming by those gases:
“This allows an empirical determination of the climate feedback factor [the system-gain factor] as the ratio of the total global flux changeto the flux change that is attributable to the radiative forcing due to the noncondensing greenhouse gases. This empirical determination … implies that Earth’s climate system operates with strong positive feedback that arises from the forcing-induced changes of the condensable species. … noncondensing greenhouse gases constitute the key 25% of the radiative forcing that supports and sustains the entire terrestrial greenhouse effect, the remaining 75% coming as fast feedback contributions from the water vapor and clouds.”
Schmidt et al. (2010) find the equilibrium doubled-CO2 radiative forcing to be five times the direct forcing:
“At the doubled-CO2 equilibrium, the global mean increase in … the total greenhouse effect is ~20 W m-2, significantly larger than the ≥ 3initial forcing and demonstrating the overall effect of the long-wave feedbacks is positive (in this model).”
IPCC (2013, p. 1450) defines what Bates (2016) calls “sensitivity-altering feedback” as responding solely to perturbations, which are mentioned five times, but not also to the input signal, emission temperature:
“Climate feedback: An interaction in which a perturbation in one climate quantity causes a change in a second, and the change in the second quantity ultimately leads to an additional change in the first. A negative feedback is one in which the initial perturbation is weakened by the changes it causes; a positive feedback is one in which the initial perturbation is enhanced … the climate quantity that is perturbed is the global mean surface temperature, which in turn causes changes in the global radiation budget. … the initial perturbation can … be externally forced or arise as part of internal variability.”
Knutti & Rugenstein (2015) likewise make no mention of base feedback response:
“The degree of imbalance at some time following a perturbation can be ascribed to the temperature response itself and changes induced by the temperature response, called feedbacks.”
Dufresne & St.-Lu (2015) say:
“The response of the various climatic processes to climate change can amplify (positive feedback) or damp (negative feedback) the initial temperature perturbation.”
Heinze et al. (2019) say:
“The climate system reacts to changes in forcing through a response. This response can be amplified or damped through positive or negative feedbacks.”
Sherwood et al. 2020 also neglect emission temperature as the primary driver of feedback response –
“The responses of these [climate system] constituents to warming are termed feedback. The constituents, including atmospheric temperature, water vapor, clouds, and surface ice and snow, are controlled by processes such as radiation, turbulence, condensation, and others. The CO2 radiative forcing and climate feedback may also depend on chemical and biological processes.”
The effect of the error is drastic indeed. The system-gain factor and thus ECS is overstated threefold to fourfold; the feedback fraction is overestimated tenfold; and the unit feedback response (i.e., the feedback response per degree of direct warming before accounting for feedback) is overstated 30-fold at midrange and 100-fold at the upper bound of the models’ predictions.
The error can be very simply understood by looking at how climatology and control theory would calculate the system-gain factor based on preindustrial data:

Since RCS is little more than 1 K, ECS once the sunshine temperature of 255 K has been added to climatology’s numerator and denominator to calm things down, is little more than the system-gain factor. And that is the end of the “climate emergency”. It was all a mistake.
Of course, the models do not incorporate feedback formulism directly. Feedbacks are diagnosed ex post facto from their outputs. Recently an eminent skeptical climatologist, looking at our result, said we ought to have realized from the discrepancy between the models’ estimates of ECS and our own that we must be wrong, because the models were a perfect representation of the climate.
It is certainly proving no less difficult to explain the control-theory error to skeptics than it is to the totalitarian faction that profiteers so mightily by the error. Here, then, is how our distinguished co-author, a leading professor of control theory, puts it:
Natural quantities are what they are. To define a quantity as the sum of a base signal and its perturbation is a model created by the observer. If the base signal – analogous to the input signal in an electronic circuit – is chosen arbitrarily, the perturbation (the difference between the arbitrarily-chosen baseline and the quantity that is the sum of the baseline and the perturbation) ceases to be a real, physical quantity: it is merely an artefact of a construct that randomly divides a physical quantity into multiple components. However, the real system does not care about the models created by its observer. This can easily be demonstrated by the most important feedback loop of all, the water vapour feedback, where warming causes water to evaporate and the resulting water vapour, a greenhouse gas, forces additional warming.
Climatology defines feedback in such a way that only the perturbation – but not also the base signal, emission temperature – triggers feedback response. The implication is that in climatologists’ view of the climate the sunshine does not evaporate any water. In their models, the 1363.5 W m-2 total solar irradiance does not evaporate a single molecule of water, while the warming caused by just 25 W m-2 of preindustrial forcing by noncondensing greenhouse gases is solely responsible for all the naturally-occurring evaporation of water on earth. This is obvious nonsense. Water cares neither about the source of the heat that evaporates it nor about climatology’s erroneous definitions of feedback. In climatology’s model, the water vapour feedback would cease to work if all the greenhouse gases were removed from the atmosphere. The Sun, through emission temperature, would not evaporate a single molecule of water, because by climatologists’ definition sunshine does not evaporate water.
Heat is the same physical quantity, no matter what the source of the heat is. The state of a system can be described by the heat energy it contains, no matter what the source of the heat is. Temperature-induced feedbacks are triggered by various sources of heat. The Sun is the largest such source. Heat originating from solar irradiance follows precisely the same natural laws as heat originating from the greenhouse effect does. All that counts in analysing the behaviour of a physical system is the total heat content, not its original source or sources.
Climatology’s models fail to reflect this fact. A model of a natural system must reflect that system’s inner workings, which may not be defined away by any “consensus”. The benchmark for a good model of a real system is not “consensus” but objective reality. The operation of a feedback amplifier in a dynamical system such as the climate (a dynamical system being one that changes its state over time) is long proven theoretically and repeatedly demonstrated in real-world applications, such as control systems for power stations, space shuttles, the flies on the scape-shafts of church-tower clocks, the governors on steam engines, and increased specific humidity with warmer weather in the climate, and the systems that got us to the Moon.
Every control theorist to whom we have shown our results has gotten the point at once. Every climatologist – skeptical as well as Thermageddonite – has wriggled uncomfortably. For control theory is right outside climatology’s skill-set and comfort zone.
So let us end with an examination of why it is that the “perfect” models are in reality, and formally, altogether incapable of telling us anything useful whatsoever about how much global warming our industries and enterprises may cause.
The models attempt to solve the Navier-Stokes equations using computational fluid dynamics for cells typically 100 km x 100 km x 1 km, in a series of time-steps. Given the surface area of of the Earth and the depth of the troposphere, the equations must be solved over and over again, time-step after time-step, for each of about half a million such cells – in each of which many of the relevant processes, such as Svensmark nucleation, take place at sub-grid scale and are not captured by the models at all.
Now the Navier-Stokes equations are notoriously refractory partial differential equations: so intractable, in fact, that no solutions in closed form have yet been found. They can only be solved numerically and, precisely because no closed-form solutions are available, one cannot be sure that the numerical solutions do not contain errors.
Here are the Navier-Stokes equations:

So troublesome are these equations, and so useful would it be if they could be made more tractable, that the Clay Mathematics Institute is offering a $1 million Millennium Prize to the first person to demonstrate the existence and smoothness (i.e., continuity) of real Navier-Stokes solutions in three dimensions.
There is a further grave difficulty with models that proceed in a series of time-steps. As Pat Frank first pointed out in a landmark paper of great ingenuity and perception two years ago – a paper, incidentally, that has not yet met with any peer-reviewed refutation – propagation of uncertainty through the models’ time-steps renders them formally incapable of telling us anything whatsoever about how much or how little global warming we may cause. Whatever other uses the models may have, their global-warming predictions are mere guesswork, and are wholly valueless.
One problem is that the uncertainties in key variables are so much larger than the tiny mean anthropogenic signal of less than 0.04 Watts per square meter per year. For instance, the low-cloud fraction is subject to an annual uncertainty of 4 Watts per square meter (derived by averaging over 20 years). Since propagation of uncertainty proceeds in quadrature, this one uncertainty propagates so as to establish on its own an uncertainty envelope of ±15 to ±20 C° over a century. And there are many, many such uncertainties.
Therefore, any centennial-scale prediction falling within that envelope of uncertainty is nothing more than a guess plucked out of the air. Here is what the uncertainty propagation of this one variable in just one model looks like. The entire interval of CMIP6 ECS projections falls well within the uncertainty envelope and, therefore, tells us nothing – nothing whatsoever – about how much warming we may cause.

Pat has had the same difficulty as we have had in convincing skeptics and Thermageddonites alike that he is correct. When I first saw him give a first-class talk on this subject, at the World Federation of Scientists’ meeting at Erice in Sicily in 2016, he was howled down by scientists on both sides in a scandalously malevolent and ignorant manner reminiscent of the gross mistreatment of Henrik Svensmark by the profiteering brutes at the once-distinguished Royal Society some years ago.
Here are just some of the nonsensical responses Pat Frank has had to deal with over the past couple of years since publication, and before that from reviewers at several journals that were simply not willing to publish so ground-breaking a result:
Nearly all the reviewers of Dr Frank’s paper a) did not know the distinction between accuracy and precision; b) did not understand that a temperature uncertainty is not a physical temperature interval; c) did not realize that deriving an uncertainty to condition a projected temperature does not imply that the model itself oscillates between icehouse and greenhouse climate predictions [an actual objection from a reviewer]; d) treated propagation of uncertainty, a standard statistical method, as an alien concept; e) did not understand the purpose or significance of a calibration experiment; f) did not understand the concept of instrumental or model resolution or their empirical limits; g) did not understand physical uncertainty analysis at all; h) did not even appreciate that ±n is not the same as +n; i) did not realize that the ± 4 W m–2 uncertainty in cloud forcing was an annual mean derived from 20 years’ data; j) did not understand the difference between base-state error, spatial root-mean-square error and global mean net error; k) did not realize that taking the mean of uncertainties cancels the signs of the errors, concealing the true extent of the uncertainty; l) did not appreciate that climate modellers’ habit of taking differences against a base state does not subtract away the uncertainty; m) imagined that a simulation error in tropospheric heat content would not produce a mistaken air temperature; did not understand that the low-cloud-fraction uncertainty on which the analysis was based was not a base-state uncertainty, nor a constant error, nor a time-invariant error; n) imagined that the allegedly correct 1988-2020 temperature projection by Hansen (1988) invalidated the analysis.
Bah! We have had to endure the same sort of nonsense, and for the same reason: climatologists are insufficiently familiar with relevant fields of mathematics, physics and economics outside their own narrow and too often sullenly narrow-minded specialism, and are most unwilling to learn.
The bottom line is that climatology is simply wrong about the magnitude of future global warming. No government should pay the slightest attention to anything it says.
Models can predict anything. Whether they are accurate or not is another question.
I would have to disagree, I’m afraid. Models are unable to predict anything. They can, however, project anything the programmer wants them to.
GIGO
Garbage in Garbage out
or
FIFI
Fantasy In Fantasy Out
FIGO, Fantasy in, garbage out
MANN > Multiple Arbitrary Nonsense Numbers
Garbage in, gospel out.
Semantics disagreement largely, but there are process models that are used widely within engineered systems that become so good in their “projections” that they are crucial in making decisions about those processes because they are accurate. In fact, such models are allowed to control systems automatically.
We would agree that that is not the case in climate “science.”
Just to put models into perspective with an example – In finite element analysis of car body structures where the science is extremely well defined and understood and we have incredibly good structural analysis tools – we still find on physically testing a prototype car body – via modal analysis – in order to validate the model – we invariably find that such practical testing invariably invalidates the model and we end up tweaking the design or the model to get them to align – this in order to perform extreme but non-destructive tests on the computer model rather than expensive prototypes or production vehicles.
https://en.wikipedia.org/wiki/Modal_analysis#:~:text=Modal%20analysis%20is%20the%20study,when%20excited%20by%20a%20loudspeaker.
Similar problems exist with airframes, boats (from racing yachts to supertankers), gas turbines etc. etc. in spite of the fact that the physics, engineering, thermodynamics etc. etc. are well understood and we have plenty of prior working models – we still find problems between models and actuals when simply changing designs for new smaller or bigger variants – with greater variations expected on completely new designs.
Modelling has its limits even in the well-defined realm of engineering – As an engineer I know this, so you will have a hard time convincing me of the veracity of any model containing dozens of ill-defined and poorly understood parameters for variables whose influences are also poorly understood and equally ill-defined.
Climate models are no more than crystal ball gazing but using a computer.
Good comment.
And the bigger and more complex the model, the bigger the error can be. Multi-parts assemblies, made of mixed of materials, with various elasticity modulus and friction coefficients, are extremely difficult to analyze.
We have similar experience with our models…and we spend inordinate amounts of time and money on them. Basically, we can’t take credit for models unless they’ve been empirically validated on test stands, and then we can only assume they’re valid over very short durations. (Think flow through a nuclear fuel assembly.) Changing the geometry of the grid straps to more effectively perturbate the flow requires some level of revalidation. And again, I can’t stress this enough, it’s only valid over relatively short durations.
The idea that a model can be allowed to simply run out, like they do with the climate models, is just beyond me. Without more direct knowledge I can only assume that Pat Frank’s analysis MUST be true – the uncertainties must totally swamp the results.
I view the models as toys. They produce a pretty result (in the visualizations I’ve seen) but that’s pretty much all they do.
rip
Mr. Page: I also disagree. Psychiatrists say models could show cooling, but they have to want to do.
Just because a prediction is wrong doesn’t mean it’s not a prediction.
That’s perfect!
“The biggest problem with computer models is getting them to match-up with reality.”
Yes. In fact, climate scientists only call them “projections” when they fail to match reality.
The do say they make “predictions” when they’re trying to persuade, e.g. this quote from the below link. “Essentially, climate models are an extension of weather forecasting. But whereas weather models make predictions over specific areas and short timespans, climate models are broader and analyze long timespans. They predict how average conditions will change in a region over the coming decades.”
https://news.climate.columbia.edu/2018/05/18/climate-models-accuracy/#:~:text=But%20whereas%20weather%20models%20make,region%20over%20the%20coming%20decades.&text=Scientists%20use%20climate%20models%20to%20understand%20complex%20earth%20systems.
They aren’t even projections. You can’t even use them to get a ball park figure of the effect of one small change to one variable because of the uncertainty in many others that put the ball in a different country.
Tosh! The problem is to get reality to match up to the computer models. The models are fine. It is reality that fails.
Predictions are hard, especially about the future. YB
The past, too, where we invariably indulge assumptions/assertions to characterize and predict processes and states. Science is, with cause, a philosophy and practice in a limited frame of reference relative to the observer.
What is truly funny is that the so-called “climate scientists” can’t even agree on what past temperatures were, when we have actual instrument readings of it!
It is a collaboration. All models need to cool the past to get a steady warming trend that achieves the present day temperature. The keepers of the historical records have obliged by cooling the past.
The situation becomes sticky where there are reliable temperature measurements that are significant for global weather like the Nino 34 region.
How can any reasonable person accept the drivel produced by climate models?
Climate models are based on the fantasy that there is a “Greenhouse Effect”. They cannot possibly produce meaningful projections. In fact they have taken real climate “science” backward to the dark ages. It is now a fundamental religion devoid of reality.
Good point Rick, and I would suggest that this is an important point to add to the list of fundamental, large, egregious errors that Lord Monckton points out already. Even back in 1950, Plass and Strong admonished us to take into account non-radiative energy flows when calculating these balances, especially in the troposphere. But how much time has modern climatology spent calculating (or even trying to understand) non-radiative energy content and flows? Approximately 0? Not that it’s a trivial problem to understand and solve, but it would appear to my physics mind at least that the non-radiative energy content and flow in the troposphere dwarfs the LWIR component.
Of course pointing this out (or any of the other errors) would eliminate the rich gravy train that the climatologists live on, and no one wants that. Except us taxpayers.
Ken Irwin’s is a most excellent comment. I have similar experience with a computation fluid dynamics model. My guess, based on real-world experience, was twice as good as the model’s answer, which took two days for two co-processing super computers to compute.
RGHE theory’s assumption that GHG molecules absorb/emit LWIR energy seems to be rooted in Einstein’s photo-electric effect & equation except the Work Function has been dis-platformed.
A minimum level of energy is required, i.e. the WF, to initiate the photo-electric effect heat conversion process: Incident Photon = WF + Emergent Photon.
The efficiency of the conversion is Emergent/Incident and must be less than 100%.
High energy cosmic and X-ray heat radiation particles deliver that minimum.
Low energy IR particles do not.
In his lecture notes of 1913 Planck observed that the linear dimensions of the space considered must be large compared to the wave lengths of the heat radiation. (or wavelengths sorter than target substance)
High energy cosmic and X-ray SHORT wave lengths meet this criterium.
Low energy IR LONG wave lengths do not.
Atmospheric energy moves around on the kinetic level not the molecular level.
There is no incident/emergent heat radiation from GHG molecules.
LWIR does not have the requisite minimum energy or short wave length.
RGHE theory has that wrong, too.
Reference
“The Theory of Heat Radiation”, Max Planck, translation by Morton Masius, 1914, Dover Publications.
It’s true that IR acts on relatively long wavelengths, but there would be some ratio between radiative vs other heat transfer mechanisms. I think you are probably correct about the dominance of kinetic transfer but I wonder if this has more to do with flux.
Nick, the “work function” applies to metals and the photo-electric effect, which is emission of electrons. Radiative gases absorb and emit photons at specific frequencies, or sometimes reflect, or sometimes allow the photon to pass, or absorb and emit pus jiggle or spin or translate faster thereby getting warmer in random ways that we keep quantum statistics to explain and predict results.
So explain the IR bands. As another poster pointed out, you are confusing electron emission with photon emission.
But the alarmists tell me they are scenarios, so you cannot test them.
However, they made one mistake. They claim that sea levels have risen, but it’s hard to measure.
The problem is there are at least two independent checks. First is the rotation speed of the earth, which is independently measured. That shows the rotation speed has increased, which means sea levels have fallen and/or the land-based ice hasn’t melted. The second check is GPS where they make adjustments to keep GPS accurate. That shows the same for rotation speed.
ie. Theory, prediction test – more evidence for the theory or falsification of the theory.
It’s been falsified.
It does seem entirely reasonable that the same phenomena that produced the baseline temperature would also produce any changes in that temperature. Assuming otherwise would be quite remarkable.
Some crucial numbers missing in the sections titled Sir John Houghton and Lacis
(Will wait for his proposed corrections) SUNMOD
Slight typo in one of the sums too. 287 / (255 + 32) should read 287 / (255 + 8).
Side question: if this proposed mechanism is true, then it must be true too that if I make a new Earth and stick it further from the sun, then sensitivity to CO2 goes up, while if I move my imaginary Earth closer in, sensitivity goes down. True or false?
Do you mean that if Earth_X is nearer the Sun it would be hotter any way and so any extra trapped heat would have less of an impact?
And that if Earth_Y is further from the Sun it would be colder any way and so extra trapped heat would have more of an impact?
If that’s what you are saying it sounds like it makes sense.
At about 7-10 km up, you get a 50% per km reduction of ppmv for water vapour and 10% per km for C02, because of condensation. Feed back due to condensing gases is hardly going to be independent of insolation.
Feed back will be practically zero at 373 K. Feedback around 273 K would be extremely complex. Absolute humidity will be almost a constant 3 ppmV in areas below 273 K, independent of temperature and altitude.
Both approaches seem wrong.
How does that work for the planet Mars which has an atmosphere of nearly all CO2 and is further away from the Sun?
Mods, please fix: this one was my fault
Is the CO2 a “control knob”? Very unlikely. There may be many others – clouds, for example. I still have to see a calculation of temperature of a rotating planet. Aren’t days warmer than nights? What is the albedo of the night side of the planet? Aren’t we warming up many weeks after the summer solstice?
Negative?
Well, now that you mention it, someone did take a look at this issue a while back:
CG
Rotating planet calc and spreadsheet here:
https://www.drroyspencer.com/2016/09/errors-in-estimating-earths-no-atmosphere-average-temperature/
Excellent. Some numbers are missing in the quotations of the Houghton and Lacis papers.
Moderators, please insert the missing numbers, which were present in my original text but (mea culpa) were written using Word’s notoriously rickety equation editor, which doesn’t work in WordPress.
(No numbers in your original text, remains unfixed) SUNMOD
Likewise, in the second sentence after “It’s the Sun, stupid”, please state the system-gain factor as 287 / (255 + 8) rather than 287 / (255 + 32). That was also my fault. Many thanks!
(Fixed) SUNMOD
I didn’t see a reference to the Pat Frank article, which I found at this link
https://journals.sagepub.com/doi/pdf/10.1260/0958-305X.26.3.391?casa_token=V9oTUOBCioIAAAAA:NgLscH_guCFh5HwJfb2TDe_p4fbM_faS2P4DJ4tErTE6sm65vvjsxVuwuCyW9wnzlRW3UPnNs4k
Thanks, Lance.
Here’s the paper discussing climate model projection uncertainty:
https://www.frontiersin.org/articles/10.3389/feart.2019.00223/full
Great paper, Pat, that now is now marked ”read again” on my link list.
If you want to analyse a feedback loop, the first step is to analyse the open loop transfer function.
In response to Mr Vallee, it is simpler to take the open-loop amplification out of the feedback loop and simply feed in the emission temperature and any perturbations to a summative input-output node in the loop, as shown in the block diagram. The output is exactly the same either way.
The emission temperature is 255 K if you believe climatology, 271 K if you realize there would be no clouds and thus far less albedo in the absence of greenhouse gases. The directly-forced warming by preindustrial noncondensing greenhouse gases is about 8 K. So one simply feeds 263 K into the loop, and we know that 287 K was the equilibrium temperature in 1850. All the other values – feedback fraction, feedback response, system-gain factor, unit feedback response – can then be swiftly and simply derived.
GIGO computer gamers aren’t climatologists. Many “climate scientists” aren’t even scientists. Gavin for instance is a math grad. But even those consensus alarmists with degrees in scientific disciplines aren’t real scientists, since they don’t practice the scientific method.
Late, great Father of Climatology Reid Bryson and Father of Hurricanology Bill Gray were climatologists. CACA witch doctors Hansen, Schmidt and Mann, not so much.
Richard Lindzen stated that people embarking on the study of Climatology (paraphrasing) aren’t the sharpest knives in the drawer at a hearing before the House of Commons Energy and Climate Change Committee a few years ago. Watch about three minutes of the following exchange with members of the committee (the video should start at 2:49:15):
Nor are they the brightest bulbs on the tree, and their elevators do not go all the way to the top.
Too many are mathematicians or employ same. They have statistics as their go to solution. What they are really dealing with are continuous functions that are coupled. Can you imagine Maxwell using statistics to develop his equations? Or Bode using statistics to develop his feedback results.
GCM’s are being developed to meet a statistically developed Global Average Temperature anomaly. What a joke!
Maxwell Boltzmann statistics
I worked out Callendar’s ECS from his original 1938 paper. It was precisely 1.68C, remarkably close to the first and second (responding to trivial criticisms of the first) Lewis and Curry energy budget papers. And those have no long high tail.
There is a third way to derive this ECS value using Lindzen’s Bode f/(1-f) curve assuming zero feedback ECS is 1.2C (Using Monckton’s equation and his inputs calculates 1.16C. Lindzen just rounds up to 1.2, close enough given uncertainties.) If, as IPCC AR4 said, the best ECS estimate is ~3, then using Lindzen’s curve f/(1-f) is ~0.65. Now directly from AR4 water vapor feedback is ~0.5 (‘doubles the no feedback value by itself’) so the only other main feedback, clouds, must be ~0.15 since Bode is a sum of all feedbacks.
As early as 2010 Dessler published an all sky/clear sky analysis erroneously concluding cloud feedback was positive. (McIntyre was not kind.) In fact, his paper showed it was 0. (All in essay Cloudy Clouds in ebook Blowing Smoke.) Separately, it was observed in a peer reviewed paper that CMIP3 produced about half the observed ‘actual’ precipitation. That was a bit shakey because of unobserved Ocean precipitation. But with ARGO salinity compared to CMIP5, the model/observed precipitation discrepancy about holds. That means the WVF is overstated by about 2x, so the Bode value should be about 0.5/2 or ~0.25.
Plug ~0.25 into Lindzen’s curve, and out pops ECS ~1.7C.
Should have been a bit clearer on the WVF reasoning. No feedback 1.2C times 2X for WVF alone per AR4 produces 2.4C ==> f/(1-f) per Lindzen curve Bode 0.5. Then actual precipitation half of modeled means 0.5/2 ==> 0.25 to plug into Lindzen’s 2012 (speech to UK Parliament) curve.
A much easier way to see the errors is to recognize that W/m^2 of forcing are linear to W/m^2 of emissions and the only purpose of making the output a deltaT is to circumvent the linearity requirement of the feedback analysis by claiming approximate linearity around the mean. This is wildly insufficient since the linearity requirement for applying linear feedback analysis explicitly requires that deltaR/deltaT = R/T for all valid R and T with ABSOLUTELY NO EXCEPTIONS. When this linearity relationship no longer applies, which happens when the required output exceeds the capacity of the implicit power supply, the amplifier starts to distort and linear feedback analysis no longer applies.
What Schlesinger assumed (he even told me so) and Roe seem to have erroneously accepted is that the forcing not accounted for by the incremental analysis is the power supply, which is the other precondition for applying linear feedback amplifier analysis. This could not be more wrong, as the forcing not accounted for by the incremental analysis is already completely consumed maintaining the average temperature which is also not accounted for.
The bottom line is that the internal, implicit power supply that doesn’t actually exist is the source of the massive amount of extra energy required to maintain the claimed temperature increases that are otherwise precluded by COE and the SB Law.
Without an explicit power supply capable of supplying additional energy the gain must be ≤ 1. Subtracting energy to flow through the feedback path also decreases the output. When summed you simply end up with what you started with.
Jim,
Exactly. This is the COE violation that broke climate science at the inception of the IPCC and that alarmists don’t want to understand because it they did, their heads would explode.
The apparent gain of the climate system (1.62 W/m^2 of surface emissions per W/m^2 of forcing) is the result of delay between atmospheric absorption of surface emissions and when this energy is either returned to the surface or emitted into space. The 620 mw per W/m^2 of surface emissions in excess of the forcing is replaced by the return of previously absorbed surface emissions.
Bode’s feedback amplifier model does not conserve power between the input and output owing to the assumption of an implicit power supply. The climate feedback model must conserve W/m^2 between the input forcing and the incremental emissions corresponsing to a temperature change at its output, but it does not.
Models look great in swimsuits and skin tight leather, predicting weather just ain’t their bag, babee!
Climate models aren’t used to predict future climates; they’re used to scare the brainwashed masses into policies that create worldwide supra-national socialism.
Regards,
Bob
Whatever the climate’s system gain factor is, the system gain factor for climate alarm is quite a bit higher.
The gain factor is readily predicted and measured to be 1.62 W/m^2 of surface emissions per W/m^2 of solar forcing (0.3C per W/m^2). At a surface temperature of 288K, this is equal to 1/(4eoT^3), where o is the SB constant and e is the ratio between the emissions of an ideal BB at T=288K and the emissions at TOA (0.62). You might notice that the gain, g=1.62, is equal to 1 + e and g = 1/e, where is the effective emissivity of 0.62. This is no coincidence and is readily predicted by the math that quantifies the steady state solutions of chaotic self organized systems like the atmosphere where the clouds provide the chaos that drives the self organization towards its most likely solution.
http://www.palisad.com/co2/chaos2gold.pdf
Relative to the 2×2 transfer function explained in the above document, the atmosphere is what’s represented by the transfer function where the two inputs are the solar input at TOA and the surface BB emissions at its temperature while the 2 outputs are the emissions at TOA and the energy returned to the surface to replace its emissions.
But supercomputer! AI, AI, Woe! Scientists! So much words, so big scare! Apostate! Burn the witch! Death to unbelievers!
More like mercantilism or fascism, since the early adopters think they are getting a pass and sinecure. Next stop: gulag or work camp, where labels don’t matter.
/s/ warning
Well, Mr. Tisdale, you obviously don’t understand the Climate. Global socialism is needed to fix the Climate. In fact, if we had global socialism, we wouldn’t even need the Climate.
Yep, but the statists have learned and have gone the fascist route. With fascism, you keep scapegoats around to blame for the collapse. With socialism, you get the blame for the collapse.
Insofar as AGW via CO2 is accepted as an axiom by too many, postings such as this only occasionally reach and change a mind. A good informational post, so good luck.
I suggest those of you with the means, contact important (or soon to be) people and try to engage using an informed and charming skeptic. I suggest Elise Stefanik. Note that unless a person lives in the district of USA politicians it is difficult to contact them.
Good luck, again.
You say that the equilibrium temperature of the Earth surface heated by the sun mostly can be assumed to be about 255K
Then there is an additional effect from so called Greenhouse gases and a feedback.
Then you criticize, that the feedback should be applied to the heating from the Sun.
In which case the obvious answer is that according the current science that additional radiation from Earth will not affect the sun much and you are wrong!
People are fallible, but it takes a computer to really foul things up. Bot?
hmm.. if you do really nothing to contribute to the discussion then you can only attack the person, right?
Radiation from the Earth affecting the Sun? This is nonsense.
You have completely misunderstood the Greenhouse Effect. The energy comes from the Sun to the planet…obviously.
This is very basic. You need to get the basics before even attempting to challenge the science.
Actually, I wrote exactly the same thing, that is the next Sagan discussion point.. Loudly contradict something which wasn´t said!
But have a look at the 3rd diagram in this article, it clearly shows a feedback parameter multiplied to 255K trying to change the sun!
You called it nonsense, I call it nonsense, we are on the same side here..
Laws of Nature is confused. It is the Sun that drives the 255 K emission temperature, which in turn drives the large emission-temperature feedback response. The larger the emission-temperature feedback response, the smaller the greenhouse-gas feedback response, and therefore the smaller the final warming.
>> Laws of Nature is confused.
Not in the slightest, but why the ad hominem, is your argument that weak?
>> It is the Sun that drives the 255 K emission temperature, which in turn
>> drives the large emission-temperature feedback response.
Indeed, and is within a few K to an equilibrium over the last milenia.
>> The larger the emission-temperature feedback response,
Right, the emission feedback response, where what happens on Earth changes how the sun heat the Earth to about 255K, your writing seems clear enough, but you should read again, what M Courtney had to say to that!
>>the smaller the greenhouse-gas feedback response, and therefore the
>> smaller the final warming.
Sure.
I remember our discussion in one of your last articles here “How much global warming should IPCC’s next report predict?”Where you had a series of divisions of almost similar numbers.
That one was about the uncertainties blowing up when you do such divisions.
You claimed you were aware about these, did you finally find them?
It´s just that the article seems quite worthless without showing these uncertainties your results are meaningless.
What astonished me most back then was your claim that this math has convinced some other climate scientist..
This time you seem to calculate an impossible feedback.
Looks like two strikes.
If I had a nickel for everything you have said that made a lick of sense, I would still be wondering where I am gonna find my first nickel.
Maybe I can find some old cans.
Well, just for you I repeat myself:
hmm.. if you do really nothing to contribute to the discussion then you can only attack the person, right?
Several points: If the mild criticism I offered feels like an “attack” to you, I suggest your hide is way too thin to be commenting about controversial matters on the internet.
More specifically, there is a difference between finding no sense in what someone has said, and remarks directed at a person.
Besides for all of that, you will find I comment widely and often, and although people may disagree with me, my comments have not been said to contribute nothing.
But you seem fond of making incoherent, poorly punctuated, inordinately dismissive, and generally badly constructed, criticisms yourself. You are given to being rude and mean, and to do so without any compensatory humor, wit, or indications of intelligently derived disagreement.
However, since you see any criticism of your remarks as an unwarranted ad hominem attack, and I stand accused of having made such, I shall give you an actual and richly deserved ad hominem to try on for size:
No one likes a whiney thin-skinned crybaby, and most especially not a pissant one who never seems to have anything intelligent, interesting, of funny to say. So stop being one, step up your efforts, or get used to the results of your lazy weak tea comments. This is not your safe space, and it is not a forum where one can act the buttmunch, as you are so wont to do, and then cry foul when someone gives you what-for.
Grow up son, and put on your big boy panties, or step out of the kitchen.
It gets hot in here.
Capisce?
I fail to see any facts of criticism in your nickel talk and now you show a real ugly face..
Nobody wants ad hominem attacks on this board I am surprised the mmoderator let that slip!
How about for a change you focus on the arguments, if you find them flawed or non understandable, we can work on that.
It seems rather obvious that the Earth temperature is close to an equilibrium from the heating from the sun and there is some heating effect and likely feedback from anthropogenic CO2.
Agreed so far? If that was too complicated for you, please let me know where you get overwhelmed, we can work slower and get you there! No reason for cheap insults!
Now only the question remains if that feedback affects the elevation from the equilibrium temperature for a surface without atmosphere or also changes the heating from the sun.
M Courtney said it quite clearly, assuming the later is non-sensical, whatever happens on Earth has no effect for the sun and assuming so is a mistake the author of the article made and proudly defends..
A detailed summation of all that is wrong with climate models.
My favorite part is the complete lack of understanding of error propagation.
Pat Frank has nailed that.
Pat Frank’s paper is one of my favorites. Roy Spencer didn’t get it. He argued that the models are turned to produce a constant temperature over a century, then CO2 is added to see what affect that has. He missed the point that tuning a model to give a constant temperature over a century, does not stop errors from propagating. But it does show the absurdity of the IPCCs argument, that we know CO2 is the cause of most of the warming because when we leave it out of our models, there is no warming. If you tune a model to show no warming without CO2, and it warms with CO2, all you have proven is that you models warms when CO2 is added. If we presume the model is correct, then the arguments because, “all things else being the same, CO2 causes warming.” But Earth’s atmosphere, oceans and bopshere, are the most complex dynamic system in the known universe, so “all things else” are never the same.
Another important finding in Pat Frank’s paper is that the GCMs are pretty much just linear functions of the CO2 content.
True.
The other thing to underscore is that the entirety of CO2’s supposed “effect” on temperature is predicated on “all other things” being “held equal.” Without that, there is no effect, because the Earth’s feedbacks are demonstrably negative, offsetting feedbacks, and there is no empirical evidence that atmospheric CO2 has ever, is now, or will ever “drive” anything.
Great article. I’m no scientist but I can see that ECS is at the heart of climate science.
And if you look at the “ice core” reconstructions, which understate historic CO2 levels but show the “ups and downs,” there is repeated episodes of reverse correlation, which show the real “ECS” to be zero.
When the temperature “trend” reverses direction, CO2 levels follow the reversal with a similar time lag, which shows temperature driving atmospheric CO2, not the other way around.
The fact that temperatures consistently start to RISE when CO2 levels are falling, AND near their low point, and consistently start to FALL when CO2 levels are rising, and near their high point, also tells anyone with the ability to think logically that CO2 isn’t the “driver” of anything.
The feedback fraction graphic’s “corrections” assume that the feedback fraction does not vary with temperature from absolute zero to 287 K. That is not true.
Mr Klipstein is incorrect. The corrections in the block diagram assume that the feedback fraction does not vary with direct temperature from 255 K to 263 K. It is climatology that assumes that invariance: Lacis et al. say that a quarter of the entire greenhouse effect is directly driven by noncondensing greenhouse gases, that the other three-quarters is feedback response thereto, and that, therefore, the feedback fraction is 75%, implying a system-gain factor 1 / (1 – 0.75) = 4 and thus equilibrium doubled-CO2 sensitivity of about 4 K in response to about 1 K warming directly forced by doubled CO2. Today’s models predict about 4 K equilibrium doubled-CO2 sensitivity. Not much variance there, then.
However, our approach is not to derive today’s system-gain factor from the preindustrial data but to derive it by an entirely distinct method, the energy-balance method, from the industrial-era data. That indicates a feedback fraction about an order of magnitude below climatology’s manifestly absurd 0.75, and a system gain factor of about 1.1, giving ECS of about 1.1 K.
We examine the preindustrial position because the error by climatology, very explicitly stated in the Lacis paper, for instance, is how climatology first came to the notion that feedback response is very large when in fact it is very small. Once one has disposed of the notion that the preindustrial position necessarily implies a system-gain factor as large as 4, one can appreciate that the energy-balance method, which in paper after paper since Gregory first described it in 2002 has been bringing down ECS to less unrealistic values, is sound.
As it happens, the corrected preindustrial system-gain factor (255 + 32) / (255 + 8) is about 1.1, if one assumes invariance of feedback response with temperature across the interval [255, (255 + 8)] K. It is no great surprise that unit feedback response should thus have proven, by two distinct methods, to be close to invariant in an essentially thermostatic dynamical system such as the climate. It would be a much greater surprise to imagine that it could possibly be as great as 30 times the value ~0.1 that is derivable from both methods.
30 years ago Hansen’s model did very well:
.
Only if you ignore reality by, for example, adjusting data and throwing out other predictions. The West Side Highway is only under water in Hansen’s mind.
Hansen’s model did very badly.
https://wattsupwiththat.com/2021/04/20/hansens-1988-global-warming-prediction-was-thrice-observation/
LOL @ur momisugly Toland, scenario C was spot on.
You obviously didn’t read the article. Scenario C assumed net zero carbon was achieved by 2000. Clearly this didn’t happen. In the future, please think before speaking. It is better to be thought a fool than speak and remove all doubt.
You pretty much laid bare Jay’s ignorance for all to see. Good comment.
Mr Hendon: Welcome to the site, you are evidently a first-time visitor. Keep reading, and that ignorance you display will fade away.
Excellent! We have obviously already achieved Nett Zero, crisis averted, we can all carry on exactly as we are now!
Haha, Jay Herndon…you so funny!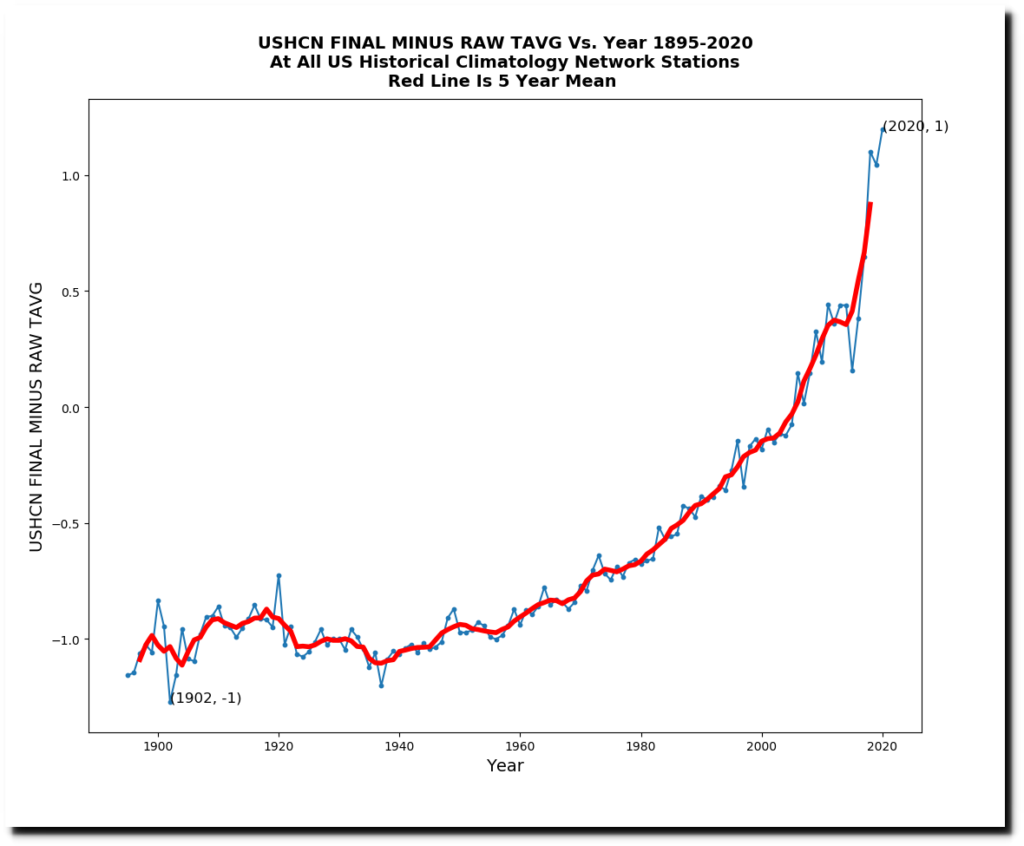
The truth is Jay, that CO2 production has exceeded the top end of what Hansen considered in his “worst case” scenario, and the actual amount of warming has been less than 1/3 of what he guessed it might be. ?resize=849%2C479&ssl=1
Also, he knew we would likely have several decades of warming from his starting point, because he was well aware of the approximate 30 years of warming followed by thirty years of cooling that had long been apparent at that point in time.
Last month was was no warmer than it was 40 years prior.
There is not enough lipstick in world to pretty up this pig.
Ruh Roh!
It was shear luck that Scenario C came close because he posited two significant volcanic eruptions that didn’t happen. That is, he subjectively manipulated Scenario C to get something that looked like the world would be saved through “Draconian reductions.” It wasn’t science, it was personal opinion.
No uncertainty bars, Jay. Your graphic is physically meaningless. So are Hansen’s projections.
Even GISSTemp has ±0.5 C uncertainty from systematic measurement error. (870KB pdf)
It’s like clockwork – Climate alarmist attempts to resuscitate failed climate model by grafting data-tampered temperature series onto “projections”.
Here’s an example from last week that attempts to discredit Cristy’s analysis of CMIP-5:
https://wattsupwiththat.com/2021/05/02/uah-global-temperature-update-for-april-2021-0-05-deg-c/#comment-3238632
Also, that graphic uses the modern version of the GIST record, it has been cooled in the past, so it fits the model. And who was in charge of the GIST record when that cooling was performed? Hansen!
James Hansen…THE climate chiropractor!
Hansen – The Climate Chiropractor | Real Science (wordpress.com)
Since when does adjusted data count as “observations”?
Only since this Catastrophic Anthropogenic Global Warming nincompoopery has come into vogue.
I never thought I would see the day when so-called scientists managed to make the old fashioned kind of End-of-the-world Doomsday Mongers appear to be the calm and rational type.
And yet, here we are.
Even if you accept the erroneous GISTEMP (satellite data makes it worse), if we use actual CO2 emissions, which is basically Scenario A, the temperature anomaly is over 50% high according to your chart. This is actually a demonstration of the errors in feedback calcs that Lord Monckton has pointed out.
A single graph does not tell the whole story. However, were I to be asked to evaluate Hansen’s predictions, with a single graph, I’d use the one that shows that a simple extrapolation of a linear regression of historical data between 1964 and 1988 does a better job than any of Hansen’s computer ‘projections.’
https://wattsupwiththat.com/2018/06/30/analysis-of-james-hansens-1988-prediction-of-global-temperatures-for-the-last-30-years/
This is really quite simple. I was building models of commodity markets back in the early 90s, and it was frustrating. Every time I came up with what looked like a promising model, it failed in real time. Then, I came across James Gleick’s excellent book “CHAOS: Making a New Science” and it explained why.
Climate modeling is merely curve fitting. And if that isn’t bad enough, the data used both for dependent and independent variables is poor quality. It has only the remotest chance of ever being accurate running in real time.
“Then the output from the loop is no longer merely the 32 K natural greenhouse effect: it is the 287 K equilibrium global mean surface temperature in 1850.”
=======
Infinite series, which include feedback, do not start at some arbitrary point in the series, they start with the first element. Otherwise you would get a different resuly for the exact same forcing, depending upon using 10,000 BC or 1850 AD for example as your starting point.
CO2 ECS and resulting feedback starts at 0ppm, not 200ppm or 300ppm. Any calculation that doesnt allow for this is going to be in error.
This lack of skill is comparable to the intrinsic limitations of locating prime numbers. We have knowledge of some relative shortcuts, but their absolute performance is innately constrained.
That is essentially how I, as a non-scientist, have understood the situation. You cannot pick an arbitrary figure, which may be the global temperature at some arbitrary pre-industrial revolution date or some arbitrary CO2 concentration when there is evidence of much higher concentrations in the past and then try to build a reliable structure on such shifting foundations.
A similar misunderstanding among the scientific illiterati is the idea that 10°C is “twice as warm” as 5°C. Understandable perhaps for non-scientists but wrong for exactly the same reason. Any calculation of change, whether height, weight, length, duration …. must start from the datum point — ie zero.
“A similar misunderstanding among the scientific illiterati is the idea that 10°C is “twice as warm” as 5°C.”
Right, the correct value of the ratio is 283.15 / 278.15 = 1.018.
It’s why anomalies are used. 0.01 to 0.02 is a 100% increase, right?
Does Ahrennius’ correction reflect Knut Angstrom’s findings, or did they yet disagree?
Thanks for this post. As usual, detail and correct usage of technical terminology are exquisite. Thanks also for “Thermageddonites,” as a term I don’t remember encountering before.
Arrhenius made no such correction
Mea culpa: I shall not make that mistake again.
In my view, Monckton of Brenchley, your otherwise accurate exposure of the conceptual error concerning feedback is simply not well served by reference to Arrhenius or Callendar. It is not necessary. To make the point more defensibly, it seems to me that the observation-based estimates of ECS suffice. Please keep the pressure on the unsound exaggeration of the feedback response.
Nick,
You have not been able to refute what you describe as a “fake claim”, but rather that Arrhenius made “no such correction”.
You have pointed out that he made another correction, 5-6C down to at most 4C.
As Lord Monckton’s “mea culpa” indicates,it is true that the 1906 paper did not categorically state that halving and doubling CO2 give respectively – 1.5C and + 1.6 C because he then embarked on a discussion of the impact of water vapour in the atmosphere working off the values of 2 other scientists and concluded its impact might be +2.4C taking the final doubling figure up to 3.9C( rounded to 4.0 C).
Now where is the 4C commonly quoted figure you refer to?
Here is Sir John Houghton in Global Warming:The Complete Briefing (2015) Fifth Edition under the Section “Model Projections”-
“The global average temperature rise under steady conditions of doubled carbon dioxide concentration is known as the climate sensitivity.
The IPCC in its 1990 Report gave a range of 1.5C for the climate sensitivity with a best estimate of 2,5C; the IPCC 1995 and 2001 reports confirmed these values.The 2007 Report stated:”it is likely to be in the range of 2 to 4.5 C with a best estimate of 3C and is very unlikely to be less than 1.5C” while the 2013 Report states that ‘it is likely to be in the range of 1.5C to 4.5C.’
Cloud feedbacks remain the largest source of uncertainty.
The projections presented in this chapter follow the IPCC WG1 2013Report.”
Sir John does not mention there is no best estimate in the WG1 2013 Report because of a lack of agreement in published papers and across a range of observations.
Nor does he mention that Arrhenius (and Calendar) thought global warming was beneficial as delaying a new Ice Age.
Sir John continues-
“An estimate of climate sensitivity can also be obtained from paleoclimate information over the last million years that connects variations of global average temperature with variations of climate forcings arising from changes in ice cover, vegetation and greenhouse gas concentration.The estimate of 3 +/- 0.5 C obtained in this way reported by James Hansen agrees very well with the model estimates mentioned above.”
So it seems we are left with Arrhenius accepting the figure of -1.5C and +1.6 C for halving and doubling of CO2 but then with admittedly rudimentary observations and no possible experimentation he speculated on a total of 4C after combining CO2 forcing with feedback of water vapour.
Earlier in a segment and a Box on the history of climate science mentioning Fourier, Tyndall and Arrhenius, Sir John expressly quotes the 1896 figure of Arrhenius of 5-6 C for a doubling of CO2.
That appears to be misinformed when at best the 1906 paper gives 4C as the final estimate.
Perhaps he was unaware of what Lord Monckton highlights.
“Now where is the 4C commonly quoted figure you refer to?”
Wikipedia
“In his first paper on the matter, he estimated that global temperature would rise by around 5 to 6 °C (9.0 to 10.8 °F) if the quantity of CO2 was doubled. In later work, he revised this estimate to 4 °C (7.2 °F).”
EOS (AGU)
“In later works, Arrhenius revised the estimates mentioned above. It is not clear exactly how he derived his values, but these later values are much closer to modern estimates than most think. For example, in the 1906 book, Worlds in the Making: The Evolution of the Universe [Arrhenius, 1906], Arrhenius wrote that “…any doubling of the percentage of carbon dioxide in the air would raise the temperature of the Earth’s surface by 4°C… “”
Any more links will put me in moderation.
Nick,
Thanks.
The two passages you give concerning the commonly quoted figure of 4C confirm what I have pointed out above, namely that adding the first assessment of 1.5C ( halving) or 1.6C ( doubling) of CO2 to what is little more than a ‘guesstimate’ of 2.4C for the effect of water vapour gets you to 4C ( rounded up from 3.9C).
Obviously so.
That is a significant reduction from 5-6C and does not justify Sir James Houghton,Dr.Myles Allen,Michael E. Mann and countless others presenting 5-6C as established fact.
However as Gaia author and climate scientist James Lovelock ( Guardian article of 29 March 2010) so clearly puts it,”the great science centres of the world are well aware how weak their science is.”
”If you talk to them privately,they are scared stiff of the fact that they don’t know what the clouds and aerosols are doing.They could be absolutely running the show.
We haven’t got the physics worked out yet.”
Without any greenhouse effect, as I understand it, the average surface temperature of the earth would be 255K or -18C. This would be the case if the atmosphere consisted entirely of oxygen and nitrogen. Presumably, all water would be frozen, although given temperature variation from the poles to the equator and seasonal variations, and other factors, I can’t say this for sure (it would have to be modeled:-)). This brings me to me question. Should climate models be able to model the earth’s climate in the absence of any greenhouse effect at all. The earth’s temperature and climate would be relatively static since the greenhouse gases are not present, but, using the models, we could start adding greenhouse gases up to the point of the present-day composition. Has this ever been done or attempted?
And, thank you for another interesting post.
Without atmosphere the surface (as it is) would take on a temperature of ~280K.
Many thanks to Tom for his kind remarks. It is in fact very difficult to obtain agreement among climatologists even about what the emission temperature would be in the absence of greenhouse gases. Professor Lindzen rightly points out that with no greenhouse gases there would be no clouds and thus albedo would fall from 0,3 to about 0.1, giving emission temperature of 271 K, halving the natural greenhouse effect and thus halving equilibrium sensitivities. And that’s before taking account of climatology’s error in assuming that emission temperature, whatever it is, does not engender a feedback response.
Not quite! As in the linked video below Dr. Lindzen suggests 272K (5min into the vid). However he got the radius of the sun wrong?! It is not 659,900km but some 696.340km. Adjusting for this flaw the result is 279K, which at least is not far off.
here it is..
Temperature isn’t amplified, energy is, and as you know the relation is Q=constant*T^4.
Using T^4 instead of T you will find that the feedback factor is actually 0.3 in this setup.
It is not entirely clear that Igl is talking of the feedback fraction. I suspect he is talking of the Planck or zero-feedback sensitivity parameter, which is the first derivative of the Stefan-Boltzmann equation: thus, today’s 288 K global mean surface temperature divided by four times the top-of-atmosphere incoming radiative flux density 241 Watts per square meter is 0.3 K/W/m^2.
The feedback fraction is the fraction of equilibrium temperature represented by feedback response. Thus, climatology assumes that the equilibrium temperature is the same as the equilibrium sensitivity (ignoring the fact that the Sun is shining), and gets a feedback fraction of (32 – 8) / 32 = 0.75. It is a priori impossible that in a stable system the feedback fraction could be anything like that large.
No, I am talking of the B here: https://en.wikipedia.org/wiki/Positive_feedback
In this case G=1/(1-B). Your input is (255+8) resulting in 287. i.e closed loop gain G=287/263=1.09
In another comment you wrote:
“However, our approach is not to derive today’s system-gain factor from the preindustrial data but to derive it by an entirely distinct method, the energy-balance method, from the industrial-era data.”
which is what you should have done but you haven’t. Perhaps we can call it a ‘temperature-balance metod’. Using ‘energy-balance’ G=287^4/263^4=1.4 and then B=0.3
… And there are additional issues. Since the sun is radiating energy, not temperature, I’m switching to using energy flows directly and using these approx values (W/m²):
Solar at ToA: 340
Solar reflected: 100
Solar absorbed by the atmosphere: 80
Solar absorbed by the surface: 160
LW from the surface: 400
Total to/from the surface: 500
Some of the 80 watts does not enter the amplification loop and can not be included as input. If we assume only 40 watts reaches the surface the input is 160+40=200.
G=400/200=2 => B=0.5
One could also argue the initial 200 is amplified to 500, the total energy flow at the surface. Then G=2.5 and B=0.6