New paper at Nature Communications
Abstract
Data availability and temporal resolution make it challenging to unravel the anatomy (duration and temporal phasing) of the Last Glacial abrupt climate changes. Here, we address these limitations by investigating the anatomy of abrupt changes using sub-decadal-scale records from Greenland ice cores. We highlight the absence of a systematic pattern in the anatomy of abrupt changes as recorded in different ice parameters. This diversity in the sequence of changes seen in ice-core data is also observed in climate parameters derived from numerical simulations which exhibit self-sustained abrupt variability arising from internal atmosphere-ice-ocean interactions. Our analysis of two ice cores shows that the diversity of abrupt warming transitions represents variability inherent to the climate system and not archive-specific noise. Our results hint that during these abrupt events, it may not be possible to infer statistically-robust leads and lags between the different components of the climate system because of their tight coupling.
Introduction
Paleoclimatic records of the Last Glacial reveal a series of abrupt warming events occurring in the North Atlantic region, known as Dansgaard-Oeschger (D-O) events, with counterparts in lower latitudes1 and Antarctic climate archives2,3. Oxygen isotope (δ18O) profiles from Greenland ice cores provide master records of this climate variability4,5, illustrating fluctuations between Greenland Stadial (GS) phases with full glacial conditions and milder Greenland Interstadial (GI) phases (Fig. 1). The D-O climate variability is commonly linked to changes in the intensity of the Atlantic meridional overturning circulation (AMOC), resulting in heat transport changes from the low to the northern high latitudes6,7. However, no consensus exists yet to explain what triggers the abrupt warmings, characterized by Greenland surface temperature increases of 5–16 °C within a few decades to centuries8. Among the proposed paradigms, mechanisms involving changes in Nordic Seas sea-ice cover9, atmospheric circulation10, or the collapse of ice shelves11 have been investigated. Recent studies suggest that abrupt climate variability can result entirely from unforced12 or noise-induced oscillations of the coupled atmosphere-ice-ocean system that alter poleward energy transport (ref. 13 and 14 for reviews).
Fig. 1: Abrupt climate variability recorded in Greenland water isotopic records.
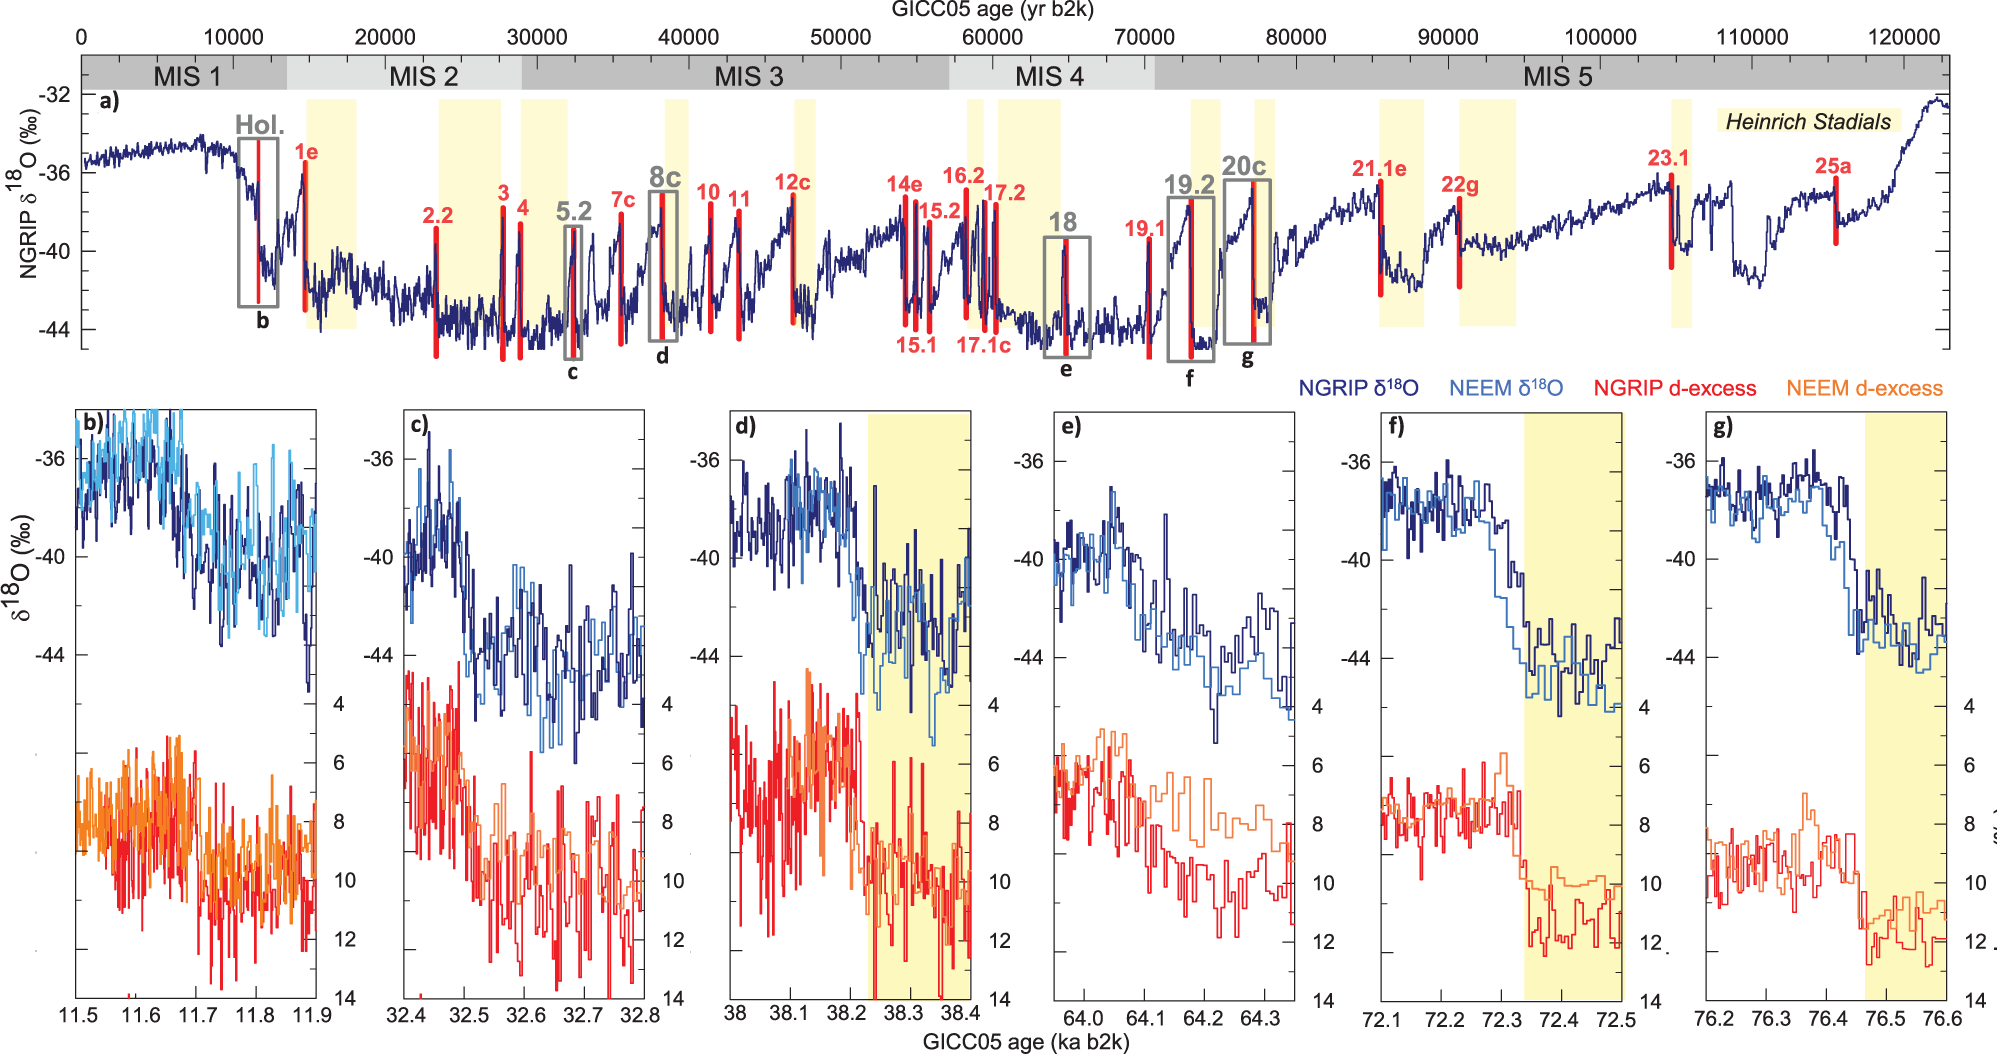
The mechanisms proposed to explain D-O event dynamics can be confronted with annual-to-decadal-scale observations of climatic changes across the globe over the GS–GI transitions. Indeed, such data sets provide a basis to map out the sequence of events, infer possible causal relations and evaluate hypothetical sets of governing mechanisms by comparing model output with the spatial expression and relative phasing of the observed changes, hereafter referred to as the “anatomy” of the changes. However, looking at the anatomy of abrupt events in paleoclimate data is challenging because it requires a high temporal resolution not attainable in most climatic archives, and because of relative dating uncertainties between paleoclimate records from different archives. Records of annual or close-to-annual resolution from Greenland ice cores overcome this challenge since they contain tracers recording conditions in different parts of the Earth System with each year’s precipitation, all in one archive. The δ18O value of Greenland ice is mainly affected by local surface temperature changes, past changes in precipitation seasonality, the temperature at the moisture source regions, and elevation changes15,16,17,18. Hence, although δ18O is not a direct temperature proxy, it can be used as a qualitative tracer of local Greenland surface temperature changes. The second-order parameter d-excess (d-excess = δD−8·δ18O) is commonly interpreted as a record of past changes in evaporation conditions or shifts in mid-latitude moisture sources17,19,20, whereas Ca2+ concentrations ([Ca2+]) in Greenland ice cores reflect both source strength and transport conditions from terrestrial sources, which are mainly the mid-latitude Asian deserts21,22. Finally, changes in Na+ concentrations ([Na+]) can be interpreted as qualitative indicators of the sea-ice cover extent in the North Atlantic at the stadial-interstadial scale23, whereas relative site accumulation rate changes can be estimated from the annual-layer thickness (denoted λ)24. Hence, ice-core multi-tracer studies are well suited to evaluate the precise phasing and duration of changes between different regions without relative dating uncertainty as all records come from the same core.
This approach was initially applied to characterize the sequence of events at the onsets of the Holocene, GI-1e (Bølling), and GI-8c25,26. For each of those transitions, a lead of a few years in changes in terrestrial aerosol concentrations, accumulation rate, and mid-latitude moisture sources relative to the changes in marine aerosols and the isotopic temperature was found. Such results suggest that the Greenland surface warming was preceded by changes in the conditions at the dust sources or changes to the transport to Greenland (e.g., rainfall-driven changes in aerosol washout). In parallel, the phasing between the high- and lower-latitude climate responses was investigated using ice-core gas-phase measurements: the δ15N of N2 as a tracer for Greenland surface temperature changes27,28 and the methane concentration (CH4) as a proxy for tropical climate change29,30. Although the first studies29,31 estimated a lag of a few decades of tropical CH4 emissions behind δ15N at the onset of the abrupt warmings, a more recent study32, focusing on the Bølling transition and using 5-yr-resolution δ15N and CH4 records, estimated that high- and low-latitude climate changes occurred essentially synchronously at that time, with Greenland surface temperature leading atmospheric CH4 emissions by 4.5+21−244.5−24+21 yrs, in agreement within errors with ref. 25.
Benefiting from the new NGRIP and NEEM high-resolution ice-core data sets, recent work extended the multi-tracer approach developed by ref. 25 and 26 to all transitions back to 60 ka b2k (thousand years before 2000 C.E.) and derived an average sequence of changes characteristic of the GI onsets by combining the estimated leads and lags for all studied transitions23. Based on the assumption that the relative timing differences between different tracers at all GI onsets are the result of the same underlying process, it was found that changes in both local precipitation and terrestrial dust aerosol concentrations led the change in sea-salt aerosol concentrations and δ18O of the ice by about a decade. Event-stacking-based approaches are often applied to extract the common signal from highly variable climatic records33,34,35,36. Although this is useful, it is also worth looking into the details of the sequence of changes over each event, especially considering the high diversity observed in the amplitude of the warming8, the shape and duration of GS and GI37,38 (Fig. 1), and the evolving climatic background state throughout the Glacial (orbital configuration, global ice volume, and atmospheric greenhouse gas concentrations). Taking this view, we observe that the results from ref. 23 illustrate a decadal-scale range in leads and lags from one event to the next when considering the onset of each individual transition. These differences can be interpreted as coming from different realizations of the same set of underlying mechanisms owing to noise processes in the archive and internal variability in the climate system, or alternatively as a suggestion that one common set of mechanisms or sequence of events may not adequately describe the processes of all rapid warming transitions.
The aim of this study is twofold. First, we investigate the anatomy of the D-O warming transitions down to 112 ka b2k using a multi-tracer approach relying on new and existing records from the Greenland NEEM (77.45°N, 51.08°W) and NGRIP (75°N, 42.3°W) ice cores. Having so many highly resolved ice-core records from two different locations over numerous D-O events provides the most comprehensive opportunity so far to assess the geographical representativeness of single ice-core records. Second, the anatomy of D-O warmings inferred from Greenland ice-core data is compared with new simulations from the coupled Community Climate System Model Version 4 (CCSM4) as the basis for discussing the processes involved in D-O warmings.
We use here new and existing water isotope measurements (δ18O, d-excess) at high resolution (5 cm) from the NGRIP ice core5 (Supplementary Data 1). The temporal resolution of the measurements corresponds to 1, 3, 4, 5 yr per sample at 10, 45, 80, and 105 ka b2k, respectively. We also include in our analysis, sections from the recent NEEM high-resolution water isotope records39 for which the 5 cm resolution corresponds to 1, 4, 7, 18 yr per sample at 10, 45, 80, and 105 ka b2k. We also present high-resolution NGRIP and NEEM [Ca2+] and [Na+] records annually interpolated and extended back to ~108 ka b2k (Methods, Supplementary Data 2). Finally, we use the NGRIP λ record back to 60 ka b2k obtained from the GICC05 annual-layer counting based on aerosol and visual stratigraphy records (Supplementary Data 3). We restrict our λ analyses to the last 60 ka as λ is modeled from the stable water isotope record below this age and, therefore, is not independent of δ18O. The GICC05 chronology is applied to NEEM by means of interpolation between reference horizons of mainly volcanic origin40. The NEEM annual-layer thicknesses are only available as averages between these unevenly spaced reference horizons, rendering the NEEM λ record unsuitable for this study. The NGRIP and NEEM data sets are reported on the GICC05 chronology back to 60 ka b2k and on the flow model-extended GICC05modelext chronology below this40,41. Age interpolation uncertainties limit the direct comparison of the absolute timing of changes between cores40.
We use a probabilistic characterization of the transitions to infer the timing, duration, and amplitude of the local and regional changes associated with each studied D-O warming. Following refs. 23,25, we determine the relative phasing of changes in the different data sets by fitting a ramp (i.e., a linear change in the raw or logarithmically-transformed data between two stable states) to each data series within a prescribed search interval across each GS–GI transition (Supplementary Figure 1, Supplementary Table 1, Supplementary Data 4). We describe the ramp by the temporal midpoint of the ramp, the duration of the transition, the data value before the transition, and the amplitude of the change. Our probabilistic model also accounts for additive noise with autocorrelation (Methods). Note that our method is conceptually similar to ref. 23 with only minor differences in the parameter priors, whereas the uncertainty estimation is different from that employed by ref. 25, which used the RAMPFIT method42. In the following, we only display results for transitions where the ramp-fitting technique provides an unequivocal solution, i.e., the timing and duration of the identified onset and end of the transitions do not change by more than a decade when the width of the search time window is varied (Methods, Supplementary Figure 3).
You mean it’s not our fault?
Lack of deep pockets is a crisis.
Are they sure that volcanoes up there had nothing to do with it?
Just askin’ on behalf of my cat. We like to be informed.
I bet your cat is purrsuasive.
Puns…. 🙂
BUT Mann’s latest paper just said there is no internal climate variability. Those rascally Greenland ice cores. How dare they show Mann wrong again.
The ice cores taken at the Isle of “Mann” certainly do not show any climate variability!
You have to flip them upside down.
Maybe Mann needs to sue Greenland Ice Cores in court.
How dare you – prove that the political narrative is not about climate and never was…
A huge crater was discovered in northern Greenland recently….when are they going to date it? It obviously would have had a tremendous effect on any ice.
I believe it was dated at about 18,000 years ago. If we’re thinking of the same crater.
There is only one huge crater – dating requires drilling holes and taking samples. There is no blip in temp at 18000 years…..and it would have deposited material over Greenland at a minimum. There has been traces of lead found in Greenland ice cores that came from the Mediterranean area silver mines during the Roman Empire….a known volcanic eruption dates the cores precisely enough to gauge how well the economy was doing – more lead meant more silver and good times.
“Our results hint that during these abrupt events, it may not be possible to infer statistically-robust leads and lags between the different components of the climate system because of their tight coupling.”.
That statement goes nicely with the IPCC’s “The climate system is a coupled non-linear chaotic system, and therefore the long-term prediction of future climate states is not possible”.
I’m sure their models can explain all of these “abrupt” changes, right?
/snark
Of course they can! These models, like ALL computer models/modelling, are infinitely tunable to produce any output the programmer wants it or them to!!! I’ve done the same when designing a simple garden retaining wall, the design kept failing on factor of safety rules with a required F.o.S. of 3, there was no health & safety issues, it was a garden wall, not adjacent to or bordering a public highway (road/footpath, etc.), so no need to adhere to strict rules & settled for a F.o.S of 2.5!
Quote:”Our results hint that during these abrupt events, it may not be possible to infer statistically-robust leads and lags between the different components of the climate system because of their tight coupling”
“abrupt events”
Isn’t that another way of saying ‘weather‘ Depends on your expectations of course.
“may not be possible to infer statistically-robust leads and lags between the different components of the climate system”
Oh, so there’s more to Climate than just a ‘temperature’ component
Well blow me down with a jet-stream.
In fact, blow anybody down with one of them muvva-fuggaz and they get just everywhere these days. I’ll wager Germany’s got one right now. why?
“robust leads and lags between the different components of the climate system because of their tight coupling”
Errrr, but surely Shirley, that’s really rather arse-over-tit innit?
If there was ‘tight coupling‘ then it would be much more obvious as to what-caused-what than if there was loose coupling in either or both space and time.
Not least, in loose coupling ‘something else’ might have snook in and done-the-biz
Tight coupling means Cause & Effect are much more obvious, e.g. the villain was seen/caught red-handed or in flagrant-deflector
(deflector haha – as my spell checker insists. It may have a robust coupling there doncha tink…Certainly good enough for Climate Science and Monty Python. And there is a Robust Coupling if ever there was)
Has anyone looked at tectonic plate movements and thermal activity under the Arctic Ocean during these rapid changes?
If we understand that ice ages are modulated by ice-sheet albedo, then we may have a very different reason for these sudden increases in temperature.
Other papers have demonstrated that these warming events are all associated with combustion products. So it may well be that warming was caused by soot from global forest fires settles upon the northern ice-sheets, reducing the ice-albedo, increasing insolation absorption, and causing very rapid warming.
But because this is only a very thin layer of soot, it can be ‘rapidly’ washed out, and the ice-albedo returns to its normal high value within a few decades, and so the world cools once more.
See: Modulation of Ice Ages by Dust and Albedo.
https://www.sciencedirect.com/science/article/pii/S1674987116300305
Ralph.
Believe it or not, cool is not the natural state of the planet. In fact it is quite rare for Earth to be cold.
We highlight the absence of a systematic pattern in the anatomy of abrupt changes as recorded in different ice parameters. This diversity in the sequence of changes seen in ice-core data is also observed in climate parameters derived from numerical simulations which exhibit self-sustained abrupt variability arising from internal atmosphere-ice-ocean interactions.
Not CO2 driven. Not solar driven or any other astrophysical clock.
Internal oscillations from chaotic-nonlinear dynamics.
The system is “flickering” between two attractors – glacial and interglacial.
Salute!
Been a long time such I read that much goobledeegook!
I feel they could have just stated that they didn’t know what the hell caused all the changes.
Gums sends…
This study kind of confirms what we already knew about the D-O events in the last glacial.
That the Bolling Allerod abrupt warming and subsequent cooling into the Younger Dryas are simply the last of 20 or so D-O events in the glacial interval.
Therefore the YD doesn’t really exist as a phenomenon in its own right.
Efforts to “explain” the YD are a waste of breath only serving to explain one’s ignorance of chaotic climate dynamics and the D-O events.
It raises a question though.
If half a century of high technology climate science cannot explain apparently spontaneous abrupt warmings (and coolings) of up to 10 degrees C – the D-O events – then what possible basis can there be for there being anything unusual about 1 or 2 degrees of warming (or cooling) in the last century?
Yep. If any of the Dansgaard–Oeschger/Heinrich events are truly anomalous, it’s the Bølling–Allerød interstadial.
People make emphatic statements which are not supported by the evidence. Unfortunately these beliefs have become urban legends which are also repeated by CAGW pushing climate scientists.
It is an observational fact, that there is a pattern (geomagnetic field strength changes, temperature changes, cosmogenic isotope changes, and so on) that has been discovered that correlates with the climate changes.
You guys need to know what the pattern is. There needs to an explanation for the pattern. Temperature follows the forcing of the geomagnetic field change.
There needs to be an explanation as to why the geomagnetic field strength is suddenly changed in the past and suddenly changed in the mid 1990s correlating with the sudden warming and with sudden unexplained changes to the sun.
So what is needed, to explain a very large cyclic event that can terminate an interglacial period or cause the Younger Dryas abrupt climate change, is something that can change the geomagnetic field’s, strength and orientation. A mechanism that can do that, can explain cyclic climate change.
About 10 years ago, a Japanese geophysicist, issued a series of papers that proved the geomagnetic field strength is peaking in intensity, on a 100,000 year cycle. Why? Makes sense in that a increase in geomagnetic field strength will cause the planet to warm, because the geomagnetic field strength and orientation controls the amount of cloud forming galactic cosmic rays (GCR, mostly protons, dumb name) that strike the atmosphere. And create cloud forming ions.
Every 100,000 years, based on Japanese researcher’s analysis of ocean sediment in the Pacific ocean, the geomagnetic field intensity is increasing by a factor of about 2 to 4 during the interglacial period and then decreasing in the glacial period. In the current Holocene interglacial, the geomagnetic field strength increased by a factor of three to four, from its strength in the glacial period.
About 7 years ago, a group of French researchers found by analyzing clay fired tiles, that were dated when fired, to determine the geomagnetic field strength at the time of firing, that the geomagnetic field has abruptly changing on short periods roughly every 500 years. The North geomagnetic field pole’s location suddenly changed and there was a sudden reduction in geomagnetic field strength.
Another group on researchers found the sudden geomagnetic field changes correlate with sudden changes in climate.
There is a geomagnetic excursion that occurs at the same time that Younger Dryas abrupt drop in planetary temperature occurred.
The YD event occurred 12,900 years ago, at a time when solar summer insolation at 65N was maximum. The Northern Hemisphere went from interglacial warm to glacial cold, 12,900 years ago, with 70% of the cooling occurring in less than decade, and the return to glacial conditions lasting for 1200 years. That is a Heinrich event.
Another example is the geomagnetic excursion, that has been found to concur in time, with the termination of the last interglacial period.
“New age for the Skálamælifell excursion and identification of a global geomagnetic event in the late Brunhes chron
Rather, the Skálamælifell excursion likely corresponds to the post-Blake excursion at 94 ka, which coincides with a globally observed low in paleointensity. These findings highlight the potential shortcomings of K–Ar dating of young (b100 ka), low-K basalts, and reinforce the need for multiple independent chronometers when determining ages for geologic events throughout Earth’s history.”
So based on the paleo record….
Greenland ice temperature, last 11,000 years determined from ice core analysis, Richard Alley’s paper…..
There have been 9 warming and cooling periods in the last 11,000 years. This warming is the same as the past warmings…. Except it appears this D-O will be followed by a Heinrich event, as the sun was unexplainably suddenly changed and the geomagnetic field strength and North pole drift velocity abruptly changed at same time the D-O warming occurred.
http://www.climate4you.com/images/GISP2%20TemperatureSince10700%20BP%20with%20CO2%20from%20EPICA%20DomeC.gif
Does the Current Global Warming Signal Reflect a Recurrent Natural Cycle.
http://wattsupwiththat.files.wordpress.com/2012/09/davis-and-taylor-wuwt-submission.pdf
http://www.agu.org/pubs/crossref/2003/2003GL017115.shtml
Timing of abrupt climate change: A precise clock by Stefan Rahmstorf
Many paleoclimatic data reveal a approx. 1,500 year cyclicity of unknown origin. A crucial question is how stable and regular this cycle is. An analysis of the GISP2 ice core record from Greenland reveals that abrupt climate events appear to be paced by a 1,470-year cycle with a period that is probably stable to within a few percent; with 95% confidence the period is maintained to better than 12% over at least 23 cycles. This highly precise clock points to an origin outside the Earth system (William: Solar changes (more complicated than just a change in the solar magnetic fields/sunspots) cause the warming and cooling); oscillatory modes within the Earth system can be expected to be far more irregular in period.
William Astley posted:
“It is an observational fact, that there is a pattern (geomagnetic field strength changes, temperature changes, cosmogenic isotope changes, and so on) that has been discovered that correlates with the climate changes.” (my bold emphasis added)
From the Abstract of the scientific paper referenced above:
“We highlight the absence of a systematic pattern in the anatomy of abrupt changes as recorded in different ice parameters.” (my bold emphasis added)
Maybe Greenland ice is not a good proxy for global climate?
From the above-quoted Introduction of the referenced paper: “However, no consensus exists yet to explain what triggers the abrupt warmings, characterized by Greenland surface temperature increases of 5–16 °C within a few decades to centuries.” (my bold emphasis added)
Yet current AGW alarmists would have us believe that computer model-projected warming rates as high as 5 °C per century would be unprecedented and catastrophic for Earth.
It’s along the lines of “Don’t confuse me with the facts, my mind’s made up.”
Still think we need to be more concerned about abrupt cooling.