Guest post by Willis Eschenbach
In my last post, The Sun Also Sets, I looked at a study that I’ll continue to call L2021. It claimed a correlation between what they called a “termination” in each sunspot cycle on the one hand, and on the other hand, El Nino/La Nina alterations as shown by the Oceanic Nino Index. Although their claim seemed at least possible, I didn’t think they’d shown it to be valid.
I wanted more data to see what I could find out. We have plenty of sunspot data. But I didn’t have access to any more of their “termination” dates. So I looked at their “terminations”, and they occurred at an average of 15% of the way through the sunspot cycle. Not only that, but the error using 15% was never more than a little over half a year. So I took 15% of the way into the complete sunspot cycle as a good approximation of the time of their “termination”.
Next, I needed more El Nino data. I compared the much longer NINO34 El Nino Index with the Oceanic Nino Index that they’d used, and found extremely good agreement. Here’s the comparison.
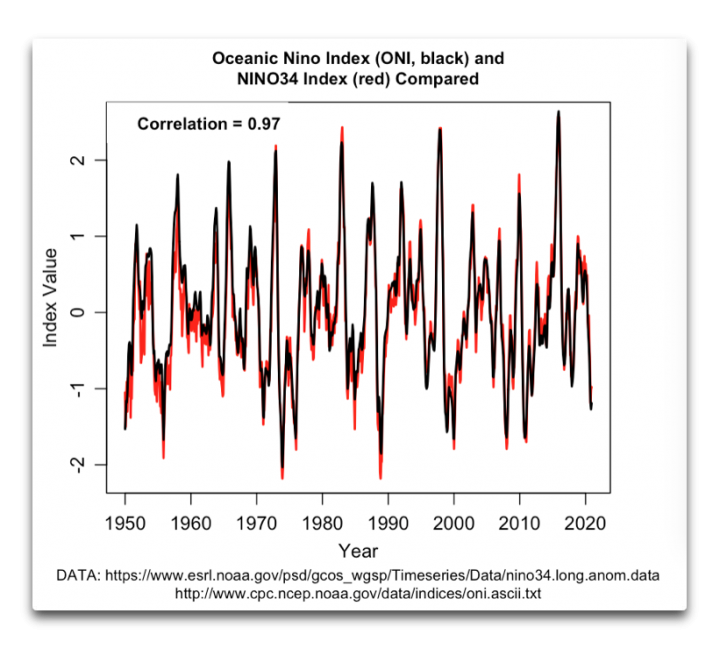
Figure 1. Comparison of the ONI and the NINO34 indices of El Nino during the period of their overlap, 1950 to 2020.
In practical terms for what I wanted to do, there’s no difference between the two. This was very good news, since the NINO34 index goes back to 1870.
So here was my plan of attack. I’d standardize all of the 13 sunspot cycles that have occurred since 1870 by adjusting them to be the same length as the average cycle over that period, which is 10.85 years. Then I’d stack them all up and average them.
Then I’d take the NINO34 data for the exact same time periods, set them all to 10.85 years like the sunspots, and average them.
This should show if there is any actual correlation between sunspot cycles (or their “terminations” as described in L2021) and El Ninos. Figure 2 below shows the result, with sunspots in red, NINO34 Index in yellow, and the uncertainty in the NINO34 average in gray.
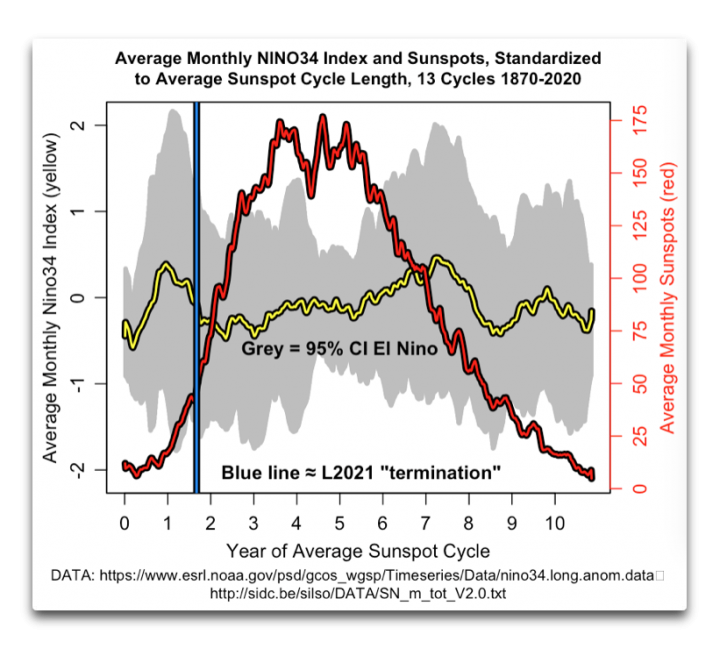
Figure 2. “Stacked” averages of sunspots and NINO34 El Nino index, all for identical time spans.
Now, this is both interesting and frustrating. It’s frustrating because of the wide size of the gray area that’s showing the uncertainty in the NINO34 averages. The problem is that when the confidence intervals of two values overlap, we can’t say that two are statistically different. And they overlap everywhere. No bueno. Just as in their study, this means we can’t draw any firm conclusions from this analysis.
However, it’s interesting in that there’s indeed a drop in the NINO34 average at the approximate time of the L2021 “termination”. And it’s more interesting that there is an equally large drop in the NINO34 average about 8 years into the average sunspot cycle … which is far from their termination. IF they are real and not an artifact of the short length of the records (only 13 cycles), they most probably are from different causes. Curious.
Finally, it’s interesting in that the gray area showing the uncertainty at about the four or five-year mark is only about half as wide as it is earlier and later in the cycle … again, this may or may not be an artifact of the short data length. I can see no obvious reason for this.
One last analysis. I use a method called Complete Ensemble Empirical Mode Decomposition to reveal the underlying cycles in any time-varying signal. There’s more information about the method here.
So I looked at the CEEMD analysis of both the sunspot data and the NINO34 data. These used the raw underlying data from 1870 to 2020, not the standardized 1970-2020 data in equal-length cycles used in Figure 2 above. Here is that result.
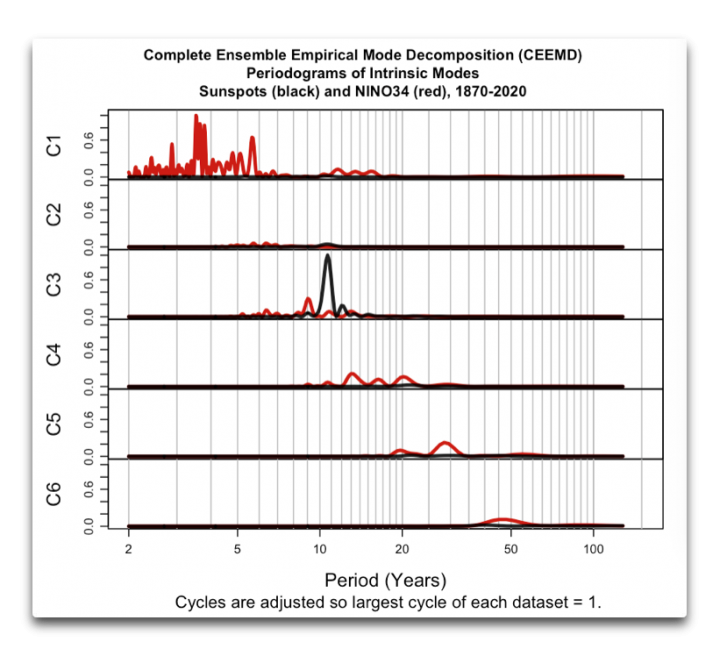
Figure 3. CEEMD analysis, sunspots (black) and NINO34 El Nino Index (red), 1870-2020
Now, the lengths of the sunspot cycles in that time period ranged from 10 years to 12 years 4 months … and looking closely you can see those cycles, along with the CEEMD showing the average of 10.8 years.
But the NINO34 Index data contains nothing of any strength at those lengths.
Here’s another view, this time of just the cycles of Empirical Mode C3 for each of the two datasets.
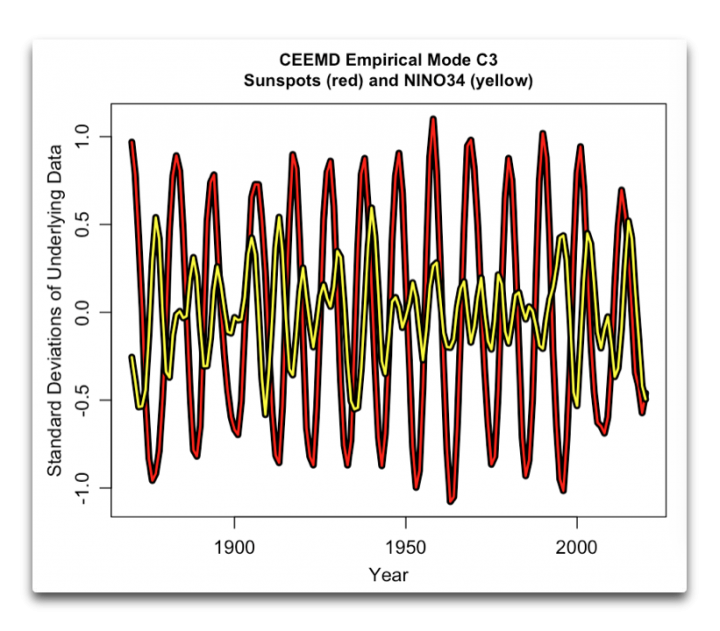
Figure 4. Underlying cycles that fall into CEEMD Empirical Mode 3 for the sunspot (red) and NINO34 El Nino Index (yellow).
Call me crazy, but I see very little in the NINO34 data (yellow) in the way of regular cycles related to the sunspots … it’s all over the map and it goes into and out of phase with the sunspots.
And that’s about as far as I can take their hypothesis about the “termination” times of sunspot cycles affecting the El Nino … with the small amount of data available there’s nothing certain, but I’m still not seeing it.
My best regards to all, skeptics and others equally,
w.
W.,
Thanks for the great assessment.
In Figure 4, the La Nina (negative El Nino) events appear more cyclical than El Nino events. It looks like there is a major La Nina event about every 20ish years, with some more major than others, and several missing completely.
For the five most major La Nina events: The first two precede the negative sunspot cycle. The second two follow the negative sunspot cycle, and the current one coincides. Not much correspondence there.
It would be interesting to perform a regression of the El Nino data and see what cycles it may be a composite of. Do any have a 22 year period? What are the amplitudes of the elements? How long are the periods of the greatest ones?
Jeff Cook-Coyle
Fort Collins, CO
It should be noted that the sun spot cycle is about 11 years while the sun magnetic cycle is about 22 mars. Also the largest El Nino’s occurs about every 20 years. The coronation between el Ninos the solar magnetic cycle might be stronger.
In science speak, L2021’s hypothesis on “terminator” occurrence and a La Nina, there is no predictive power. None whatsoever. Another hypothetical dead end for a pet hypothesis.
It doesn’t matter how beautiful your theory is, it doesn’t matter how smart you are. If it doesn’t agree with experiment, it’s wrong.
The ENSO cycle is now estimated to be around 65 years long and we have not been aware of it in any detail for that length of time so much past data is unreliable.
There is an additional disruptor in that each ocean basin has its own internal cycle with a different periodicity to the others so there is a constant phase switching between the ocean basins that would frustrate any obvious correlation with solar cycles.
Consequently, I look at the 1000 year timescale involving the Mediaeval Warm Period, the Little Ice Age and the current warmth. Given that the oceans are in control of the atmosphere I cannot envisage a Mediaeval Warm Period with less strong El Ninos than the recent past nor can I envisage the LIA with El Ninos as strong as the recent past or during the MWP.
This is a case where the evidence we require is missing and we have to make broader assumptions based on a variety of other phenomena. Ships logs during the LIA show greater storminess and meridionality of the jet streams and depression tracks at that time.
Thus I consider Willis to be correct in his findings as regards an absence of proof but do not accept that as a conclusive determinant.
Regarding the paper which Willis criticises I do see it as a reasonable attempt to try and nail down a causative association despite the woolliness of the available data.
Maybe that isn’t science but it is all we have at present.
The late 20th century saw a reduction in global cloudiness and the past 20 years have seen a stabilisation. Along with that we had high solar activity and several decades of El Ninas stronger than La Ninas.
The reduction of cloudiness was associated with more zonal, equatorward jets and the stabilisation is associated with more meridional and less poleward jets.
I take Willis’s point that the data we need is currently unavailable but that does not prove the absence of the proposed relationships.
A period of watching and waiting is called for and the recent drop in satellite recorded global temperatures is an interesting development.
I can’t gather evidence there are invisible, highly advanced space aliens all around us every day on Earth watching us. The evidence is still missing, well because they are invisible to our current technology. They’re smart that way ya’ know.
That’s a bad path to start down.
There is plenty of circumstantial evidence but work is needed to collate the underlying data.
Stephen Widle
May l suggest you pay close attention to how the jet stream is currently behaving over the North Atlantic.Because its showing how northern blocking was able to increase and remain in place longer during the cold LIA winters.
I….I… I’m speechless….
Okay, then, you just sunk a very interesting hypothesis. But wouldn’t it have been so cool! On the other hand, have you taken into consideration the quasiperiodic orbital disturbances of Uranus ?
That was a poor joke, but if we are going to consider things like sunspots, we really should add the other planets as well, it IS one system. In other words, sunspots are but the beginning of the long haul to convince the climastrologist that our planet is affected by more than the carbon leaking from Theiranus.
If, than Jupiter and suns angular momentum. 😀
Jupiter orbits the sun every 11.8 earth years. I wonder how that corresponds, or not, to the sunspot cycle and/or sun magnetic cycle.
Really a dawning-age effect when Jupiter aligns w/Mars.
ht/The 5th Dimension
This is not about the end and beginning of the solar cycle, but about the decline and rise of solar wind activity. Since some increase in solar wind magnetic field activity can be predicted, I expect a second La Niña peak.
Solar wind changes are a by product of the solar cycle changes. Almost all of the non coronal wind stream related storms have been from filament eruptions. A pretty good percentage of the higher winds the past 8-12 months were the extension of the polar crown. So you think the La Nina’s rebounds in 2021 like 2008. Curious as to Why. Solar wind increase ?
Sunspots are extremely faint, but we are already in a new solar cycle. If activity were to increase as the solar cycle progresses the solar wind would reach speeds of over 600 km/s.
https://www.swpc.noaa.gov/products/real-time-solar-wind
http://www.solen.info/solar/images/AR_CH_20210407.png
It already has been reaching 600 km/sec. Obviously more frequent and larger CME’s will produce a stronger Forbush decrease. Cycle 24 showed this GCR wise. Weaker.
An increase in the sun’s magnetic activity will result in a strengthening of the velocity of the stratospheric polar vortex on the south.
As you can see in the graphic, the decrease in solar wind in March caused the south polar vortex to weaken.
I follow the North more closely. Since I forecast weather patterns based on it’s state. I have previously written about the solar – stratosphere relationship before. Solar Cycle polarity and GCR & Forbush based.
Willis if you are saying that trying to find a link between El Ninos and sun spot activity is abit of a waste of time, then l fully agree with you. l consider it a side issue at best.
What l consider is far more important is the effect that the current low sun spot activity appears to be having on the jet stream. For me its opened a window on what was going on across the globe during the LIA. So that’s where all my interest is focused.
And I ask again, what units are used to measure the changes in the jet stream? Because without those, I fear it’s just handwaving.
w.
To be honest for me it would be abit of a waste of time trying to measure the changes of the jet stream. Because l am learning far more from looking at the effect its having on the weather patterning and how that helps explain what was going on during LIA. Then l ever would by trying to measure the jet stream.
You can measure whether the jet current is more or less meridional. Just measure the latitudinal component of the wind speed at 300 hPa.
Thanks, ren. Link to a data source? And measure it where? Over the US? The Arctic Circle?
w.
I think there is enough over the US at the 55th parallel.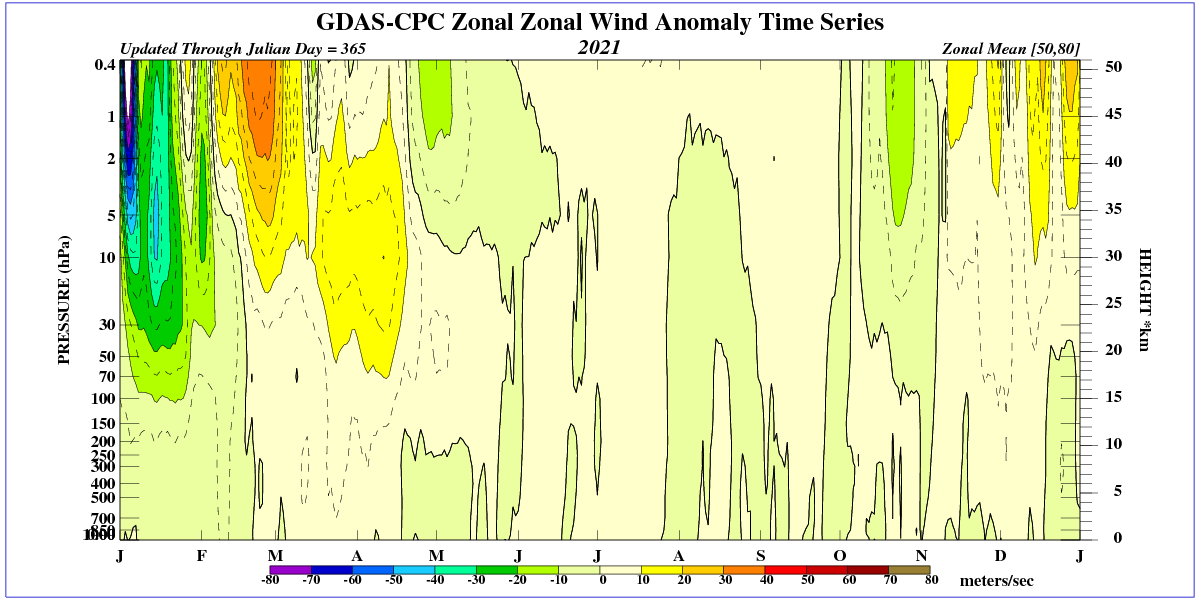
Sorry.
I think , at the 50th parallel over North America.
Link to a data source?
w.
Zonal wind speed data for the 50 – 80 degree north latitude band is on the following page:
https://www.cpc.ncep.noaa.gov/products/stratosphere/strat-trop/
Currently the Peruvian Current is very cold and only a latitudinal circulation in the South Pacific is needed for La Niña to return.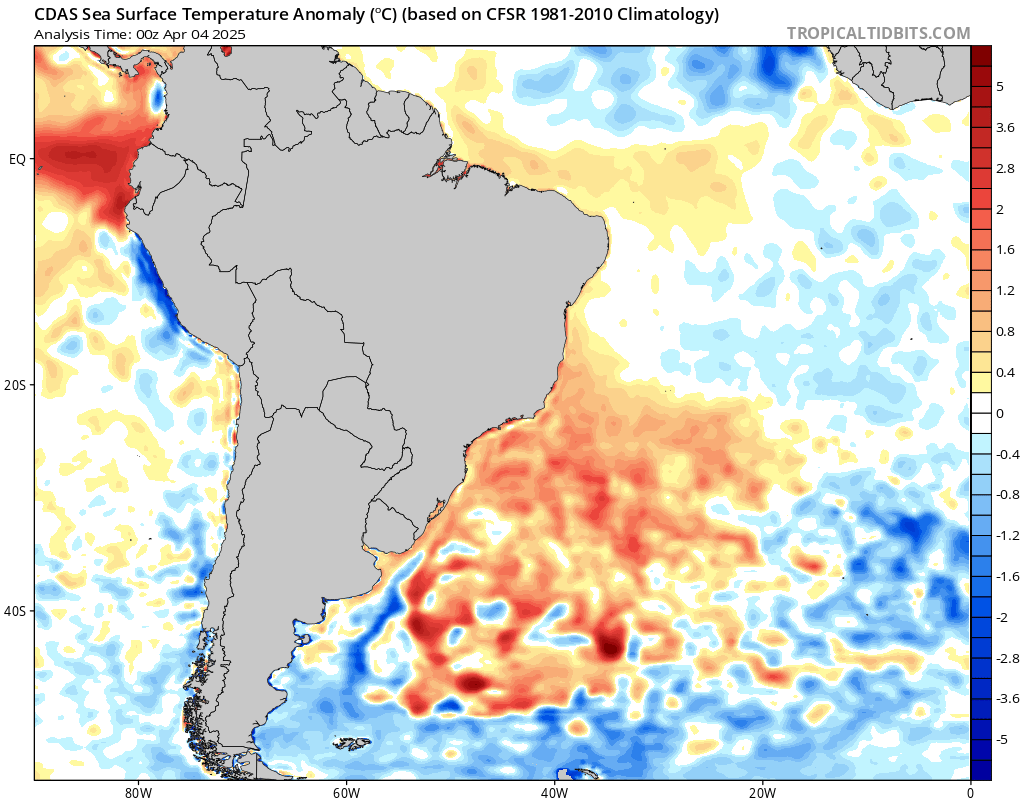
Ren
That warm pool of water in the Atlantic is interesting. Because it suggests that there has been a static area of high pressure sitting over that area for sometime.
I didn’t think there was a relationship between El Nino and the sun to begin with, so I’m glad Willis put that to rest. Nice job, W
Thanks, Zoe, appreciated.
w.
Multi-Variant Enso
Hypothesis formulated in 2012: Multivariant Enso is driven by volcanic eruptions in the East Pacific with a delay of one year.
MV-Enso data: NOAA
Volcanic Eruption count data: Number of websites consulted, but here is one of the better comprehensive sites: http://volcanolive.com/indonesia.html
List of volcanic eruptions: Bagana, Balbi, Tuluman, Rabaul, Bamus, Ulawun, Ritter, Langila, Dakataua, Garbuna, Pago, Karai, Mt Lamington, Mt Victory, Waiowa, Manam, Karkar, Long Island, Kavachi ?, Tinakula ?
Number of eruptions starting in 1939 ending in 2011 in numerical order
1 2 2 4 2 1 1 3 0 0 0 3 1 4 4 2 3 3 5 4 5 4 5 5 3 2 3 3 3 1 3 2 3 3 5 1 1 0 1 1 2 0 0 2 4 2 0 0 0 1 0 0 0 2 2 2 0 0 1 0 2 0 4 1 1 1 2 2 3 2 3 0
Attached is composite of three images:
Top: Volcanic area of East Pacific (that Mr. Eschenbach may be well familiar with)
Middle: Number of eruptions in any year moved forward by one year
Bottom: Composite graph, data normalised. Since the MV-Enso has negative values the volcanic data has been moved downward symmetrically in respect of x-axis.
Correlating R^2 > 0.8
Note: I might eventually write a short paper, but you may consider this as a ‘peer review’ opportunity, hence anyone is welcome to have a go including Mr. Eschenbach of course.
Publishing data, method and result here on WUWT is note to any climatier out-there that I do not take kindly to plagiarism.
Images refereed to in the above text, zoom in to enlarge for clear view.
On average, since 1870 there’s been an eruption in Indonesia every 2.2 months …
w.
Mea culpa, volcano live link should be http://volcanolive.com/png.html
Vuk: the idea that volcanic activity might be the cause of the Niño/Niña events has appealed to me as well.
However, I’m inclined to think that island-arc volcanic eruptions in the Indonesian archipelago are not likely to have that much of an effect on the Pacific basin as a whole. I’m thinking more about submarine volcanism around the East Pacific Rise, and hydrothermal vents – everywhere. Which we know essentially nothing about, so that research project is a non-starter.
BTW what feat of geographical analysis places the Solomon Sea in the “East Pacific”?
The eruptions are cause of large oscillations in atmospheric pressure in the East Pacific altering direction of trade winds that drive Enso.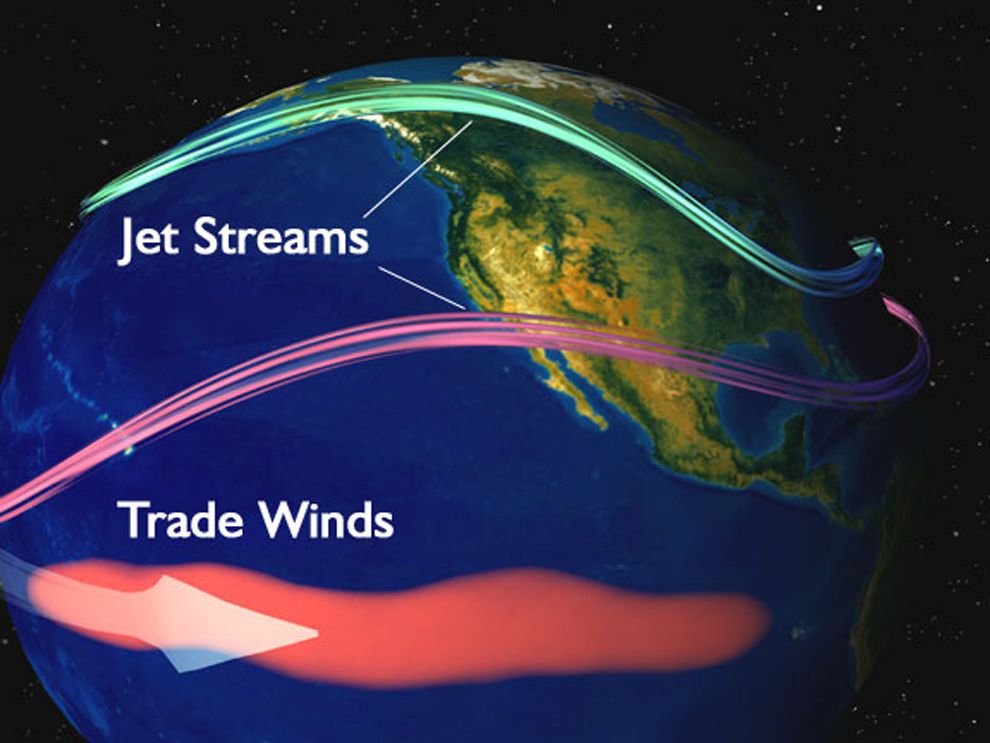
Steady trade winds normally force water from the coast of South America out into the Pacific. During an El Niño event the winds force warm water flows toward America.
“East Pacific” depends where you are looking at it from. Since I don’t live in the middle of Pacific, I’m on 0.2145° W, so the Asian continent Pacific coastline end is “east” and American Pacific coastline end is “west” or have it another way: my sunrise comes from direction Japan and sunset is in direction of California, and as you can see on the map I attached to my main comment all longitudes are “E”. If you and for that matter everybody else prefer it the other way, that is fine with me.
Vuk, did you miss my comment where I pointed out that on average, Indonesia has an eruption every 2.2 months? That’s over five eruptions per year. Every year since 1970 there’s been at least one eruption in Indonesia.
How you connect that to El Nino or any other phenomenon is a total mystery. Here are the dates of such Indonesian eruptions along with the NINO34 El Nino Index.
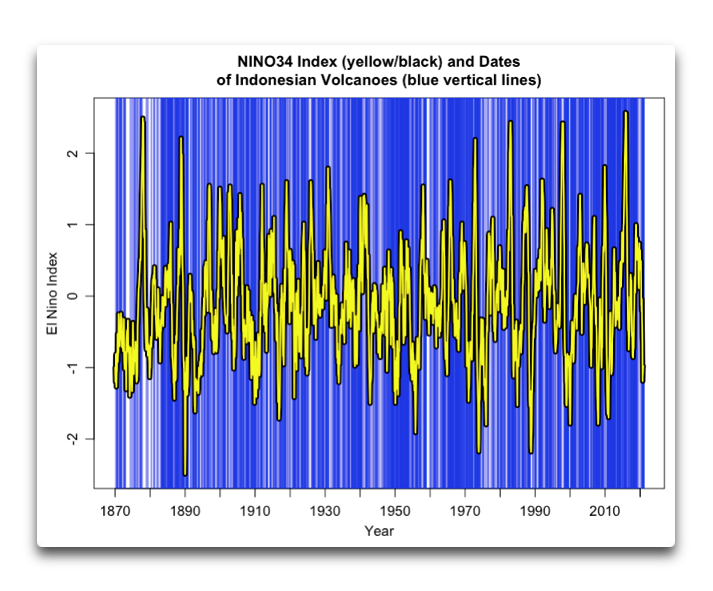
You’ll have to explain to me how those relate … eruption data is here.
w.
Thanks for the effort and taking time for looking into it.
I did see your comment, and realised that made a wrong link, and corrected it with
“Mea culpa, volcano live link should be http://volcanolive.com/png.html”
looks like some 8 min after your comment, but you may have not seen it, hence my most sincere apologies.
Following may not be of any further interest to you, so sorry and thanks again.
…………….
For the benefit of anyone interested I’ll mention following
I have looked only at volcanoes surrounding Solomon seas basin prompted by http://www.vukcevic.co.uk/Solomon%20Seas.pdf
Further Google Scholar searches revelled rich deposit of abstracts and free available papers on the subject of the Solomon Sea circulation. After reading number of them I thought it’s worth a look at all eruptions surrounding the basin since it has not been researched into.
Furthermore, according to the number of papers the Walker cell atmospheric circulation western end point is also above the archipelago, so two may be closely connected.
Willis,
In reply to: The Feynman quote.
It doesn’t matter how beautiful your theory is, it doesn’t matter how smart you are. If it doesn’t agree with experiment, it’s wrong.
Willis what physical theory are you talking about? Analyzing graphs is purposeless when there is no correlation. Obviously there must be physical explanation for cyclic abrupt climate change and the past abrupt changes to the geomagnetic field.
You select a ‘theory’ (paper) which is not correct…. The implicit assumption is that sunspot changes captures how the sun can and does change and that sunspot/solar magnetic field changes cause El Ninos. That ‘theory’ is not correct.
Sunspot changes do not cause El Nino events. The sun can still cause El Nino events. The mechanism is not sunspots, so counting sunspots and plotting sunspots does not help ‘solve’ the physical problem… How does the sun change to cause what is observed.
We need a explanation for the recent change and past changes in temperature. Is that your goal?
And then you triumphantly show the incorrect theory is incorrect. That is not science. That is sort of a game.
A scientific physical analysis would look at other observations in peer reviewed papers…..
About physical things that are changing, on the earth, at the same time that we experienced the recent warming that started in 1996.
A scientific physical analysis would look at past temperature changes in the last 11,000 years. The data shows the planet warms and cools cyclically.
Surreally the warming that we are experiencing now, has the same pattern as the warming the paleo record on the Greenland Ice Sheet. The nine abrupt warming periods, after which the temperature fell.
And because you do not feel comfortable looking at paradoxes… You do not look for them and you wave them away.
We know from the paleo record that geomagnetic field abruptly changes at the same time that there are abrupt climate change events occur on the earth. And recently it was found that the geomagnetic field is changing with a periodicity of 500 years and this small fast past changes in the geomagnetic field correlate with small climate changes.
There are geomagnetic excursions at all of the large climate change events.
That finding/discovery was about 15 years ago. Also we know the geomagnetic field intensity drops by a factor of three during the glacial period and then recovers during the interglacial period.
And we know that it is a fact the geomagnetic field abruptly changed in the mid 1990 correlating with the start of this warming period.
The Southern Atlantic Geomagnetic field anomaly suddenly started to increase in size and strength and the North Pole drift velocity increased from 15 km/year to 55 km/year.
The sun is changing/causing things to happen in the solar system which lay person are not aware of.
This graph shows the cyclic warming and cooling in during the interglacial period.
Greenland ice temperature, last 11,000 years determined from ice core analysis, Richard Alley’s paper. William: As this graph indicates the Greenland Ice data shows that have been 9 warming and cooling periods in the last 11,000 years.
http://www.climate4you.com/images/GISP2%20TemperatureSince10700%20BP%20with%20CO2%20from%20EPICA%20DomeC.gif
What is the physical ‘theory’ to explain the past cyclic warming and cooling on the Greenland Ice Sheet that correlates with the rise and fall of ancient civilizations?
These warming and coolings are periodic and maintain the same periodicity in both the interglacial and glacial period which supports the assertion that the changes are caused by something external to the earth.
The sun is the suspect as to what is forcing changes in the solar system. There are paradoxes, today in the solar system measurements which lay person are not aware of.
There are no other explanations. And there is more observations to help figure out of the sun is causing what is observed on the earth.
Satellite radar system have identified a hard paradox in our solar system. The orbits of the planets are changing (the planets are moving closer to the sun)….
Which is most ‘simply’ explained by the sun is gaining mass.
https://arxiv.org/pdf/1401.4056v1.pdf
Anomalous post-newtonian terms and the secular increase of the astronomical unit
In the last decade a major debate has emerged on the astrophysics community concerning the anomalous behaviour of the astronomical unit, the fundamental scale of distances in the Solar system.
Several independent studies have combined radar ranging and optical data from the last four decades to concluded that the astronomical unit is increasing by several meters per century.
It is abundantly clear that General Relativity cannot account for this new effect, although a still undefined (no physical mechanism to transfer the amount of moment required. Not physical possible) angular momentum transfer mechanism could provide the simpler and more conventional explanation.
This is not the only unexplained anomaly in Solar System dynamics that have appeared in the last decade: Firstly, as reported by Krasinsky and Brumberg in 2004, the Astronomical Unit, the fundamental distance scale in the Solar System, increases by 15 ± 4 meters per century [14]. Including more recent measurements by JPL, Standish gave the corrected value of 7 ± 2 meters per century [26].
However, rather than increasing, the AU should be decreasing, mainly as a result of loss of mass to solar radiation, and to a much lesser extent to the solar wind.
The total solar luminosity is 3.845 × 10^ 26 W (Livingston 1999). This luminosity divided by c ^2 gives an estimated mass loss of 1.350 × 10 17 kg yr −1 . The total mass of the Sun is 1.989 × 1030 kg (Livingston 1999), so the fractional mass loss is 6.79 × 10^ −14 yr −1 .
Again with the factor of three from Eq. 2.1, the expected fractional decrease in the AU is 2.26 × 10⁻¹⁴ yr −1 , or a change in the AU of − 0.338 cm yr −1 .
A change this small is not currently detectable, and it introduces an insignificant bias into the reported measurement of an AU increase (Krasinsky & Brumberg 2004).
If the reported increase is absorbed into a solar mass increase, and not into a changing gravitational constant G, the inferred solar mass increase is (6.0 ± 1.6) × 10 ^18 kg yr −1 .
This is an unacceptable amount of mass accretion by the Sun each year. It amounts to a fair sized planetary satellite of diameter 140 km and with a density of 2000 kg m −3 , or to about 40,000 comets with a mean radius of 2000 m.
If the reported increase holds up under further scrutiny and additional data analysis, it is indeed anomalous.
William Astley April 7, 2021 1:46 pm
“Willis,
In reply to: The Feynman quote.
It doesn’t matter how beautiful your theory is, it doesn’t matter how smart you are. If it doesn’t agree with experiment, it’s wrong.
Willis what physical theory are you talking about?”
I have no clue what you are referring to. My analysis is of the L2021 theory that a “termination” in the solar magnetic field triggers El Ninos. What did you think my two posts were about?
“Analyzing graphs is purposeless when there is no correlation. Obviously there must be physical explanation for cyclic abrupt climate change and the past abrupt changes to the geomagnetic field.You select a ‘theory’ (paper) which is not correct…. The implicit assumption is that sunspot changes captures how the sun can and does change and that sunspot/solar magnetic field changes cause El Ninos. That ‘theory’ is not correct.”
Well, gosh, it’s so great to have someone who can sit back and tell us which theories are “not correct without a single scrap of evidence, a single bit of logic, or a single scrap of math.
You say “Analyzing graphs is purposeless when there is no correlation” … but unless you do the analysis, with or without graphs, how on earth could you possibly know there is no correlation?
Me, I’m not an all-seeing deity like you. Me, I have to actually do the hard yards to see if some theory is correct or not.
“Sunspot changes do not cause El Nino events. The sun can still cause El Nino events. The mechanism is not sunspots, so counting sunspots and plotting sunspots does not help ‘solve’ the physical problem… How does the sun change to cause what is observed.We need a explanation for the recent change and past changes in temperature. Is that your goal?
And then you triumphantly show the incorrect theory is incorrect. That is not science. That is sort of a game.”
I “show the incorrect theory is incorrect”? What are you smoking? The authors think it’s correct. The peer-reviewers think it’s correct. The public buys it. How would you know if it is correct or not, since you didn’t have the albondigas to actually dig in and do the work?
Unlike you, I actually did my homework. I looked at their theory and demonstrated, not claimed but demonstrated, that the data is far from sufficient to support their theory.
I’m practicing science here, my friend, and the fact that you think that I’m playing some kind of game tells me you don’t have a clue about science. I’m done with this. I’m done with you. You think you sit on some celestial throne and have the power to decree which theories are valid and which aren’t? That’s not science in any form.
Go bother someone else. You’ve burned your bridges with me. And don’t bother whining about how I’m all wrong. Talk to the hand, ’cause the head is done with listening to you bitching about me. I do the tough stuff. I actually investigate. I spend the endless hours writing the code to test the theories. I take the chance of being shown 100% wrong in public. Go whine to some soiboi who will believe you.
Because from where I sit, you asking for an apology and claiming I’m playing some kind of game just marks you as an arrogant ignorant anti-scientific jerk … and my life is far too short to deal with yet another of those.
w.
Willis.
“I have no clue what you are referring to. My analysis is of the L2021 theory that a “termination” in the solar magnetic field triggers El Ninos. What did you think my two posts were about?”
I must be missing something Willis.
I do not understand your emotional negative response. It does not make sense. Are you in pain or not feeling well. We are just talking about scientific stuff. This is not politics.
What I provided is relevant to your ‘study’. I assume your goal is to find out what does cause El Ninos.
I provided a link to scientific papers and provided comments about them as to why there were physically relevant to the discussion as to what is happening now on the earth and to the cause of what is called El Nino and La Nina.
I.e. Earth’s magnetic field has abruptly change now. There is currently no physical explanation for the recent abrupt changes to the geomagnetic field. And the geomagnetic field has abruptly changed in the past correlating with small and large climate change.
There is a pattern of warming followed by cooling the paleo record which I provide a link to your last post. Some caused the past warming/cooling spike. What we are experience now has the same pattern.
That comment is just an observational fact.
The termination of solar cycle (not the solar magnetic field) is a not a trigger for El Nino.
But what does cause the El Ninos? What did cause the warming in the last 30 years?
Why did the sunspot groups change?
It appears you have no clue how arrogant and insulting you come across. I truly have no interest in dealing with you, you are unpleasant and condescending.
Please go work out your issues with someone else. Sorry, but I was serious when I said you’ve burned your bridges with me. We’re done.
w.
It is stupid/bury the head in the sand, to talk about the sun and to ignore physical changes that have happened to the sun in the last 10 years for which there is no explanation.
It is weird, not scientific to not look at the pictures of the sunspots groups that shows the difference. The difference …. how the sun has changed is unbelievable.
If the climate wars were not going on…. This (the sudden unexplained change to the sun and the observation that the solar mass increasing where it should be decreasing, see my above comment) would have led to a breakthrough.
See figure 1 in this paper.
https://agupubs.onlinelibrary.wiley.com/doi/epdf/10.1029/2009EO300001
Look at the picture. The large sunspot groups that were seen during past solar cycles has been replaced by tiny little spots. That is what we are ‘seeing’ on the solar surface now. Tiny spots that cannot be seen visually.
This site has daily ‘pictures’ of the sunspot groups on the surface of the sun.
https://www.solen.info/solar/
For past cycles 21 and 22, past, the pictures, included an optical picture of the sun which clearly showed the large long lived sunspots.
That practice has stopped because it was no longer possible to visually see the large sunspot groups which have powerful magnetic fields. What is now used to ‘see’ the tiny pores… is a magnetic technique that can ‘see’ the tiny weak pores.
Why plot sunspot numbers if what we are counting …. The sunspots themselves have changed?
No one predicted that the sunspots would change or could change.
And when the sun is changing in an unexplained manner the geomagnetic field of the planet is also changing rapidly in an unexplained manner.
There is correlation in time between to very unusual physical events. And we know that the geomagnetic field changes have in the past correlate with climate changes. All of the large abrupt climate changes have in the last 15 years been connected to geomagnetic excursions.
For example the Younger Dryas Abrupt climate change correlates with the Gothenburg magnetic excursion.
The Gothenburg magnetic excursion is an unexplained large region of the earth’s surface where the geomagnetic field polarity reversed suddenly, reversed at the same time the planet abruptly cooled for 1200 years.
Physically there needs to be an explanation as to how it possible a large region of the earth could change magnetic polarity very rapidly, in the past…. and now.
http://www.sciencedirect.com/science/article/pii/003358947790031X
The Gothenburg Magnetic Excursion
http://link.springer.com/article/10.1134%2FS0016793212050076#
Manifestation of the gothenburg geomagnetic field excursion in sediments on the northwestern Central Russian Upland
Abstract
The Gothenburg Magnetic Excursion in a broad sense ranges from 13,750 to 12,350 years BP and ends with the Gothenburg Magnetic Flip at 12,400−12,350 years BP (= the Fjärås Stadial in southern Scandinavia) with an equatorial VGP position in the central Pacific.
The Gothenburg Magnetic Flip is recorded in five closely dated and mutually correlated cores in Sweden. In all five cores, the inclination is completely reversed in the layer representing the Fjärås Stadial dated at 12,400−12,350 years BP. The cores were taken 160 km apart and represent both marine and lacustrine environments.
During the transition from Solar Cycle 23 to 24… Sunspots started to change.
The large powerful sunspots long lived groups have disappeared. These large sunspots could be seen visually on the sun, if it was safe to look at the sun. The large sunspot groups had an average life time of 22 days.
And have been replaced by tiny short live pores that have a life of one to three days.
And this is the interesting part…. The large long lived sunspot groups have not returned for solar cycle 25.
“Are Sunspots Different During This Solar Minimum?”
“Yet although the Sun’s magnetic polarity has reversed and the new solar cycle has been detected, most of the new cycle’s spots have been tiny “pores” without penumbrae (see Figure 1); in fact, nearly all of these features are seen only on flux magnetograms and are difficult to detect on white-light images.”
.
Fig. 1. (left) An image of a sunspot group near the maximum of the last solar cycle, cycle 23, taken at the McMath-Pierce telescope, Kitt Peak, Ariz., on 24 October 2003.
The sunspots clearly show a dark central umbra surrounded by a brighter, filamentary penumbra. The magnetic fields range from 1797 to 3422 gauss. (right) An image consisting only of pores—weak sunspots with no penumbral structure—taken from the Michaelson Doppler Imager (MDI) instrument on the Solar and Heliospheric Observatory (SOHO) spacecraft on 11 January 2009; this is an example of what is observed today at solar minimum. The lower pore (seen as the dot in the center of the black circle) had a magnetic field of 1969 gauss; the others were not measurable. Presently, the solar surface is mostly devoid of spots. Both images have the same spatial scale and are roughly 250,000 kilometers across.
The geomagnetic field is suddenly changing in the same time period that the sun abruptly changed. And the changes to the geomagnetic field,….. are extraordinary large and fast.
Theoretically impossible, so as per Feynman, the geomagnetic field theory is not correct.. For
The magnetic field intensity was dropping at 5%/century, it is now dropping at 5% per decade. Why now?
Could there be a connection between the solar changes and the geomagnetic field changes?
https://www.nature.com/articles/d41586-019-00007-1
Earth’s magnetic field is acting up and geologists don’t know whyErratic motion of north magnetic pole forces experts to update model that aids global navigation.
First, that 2016 geomagnetic pulse beneath South America came at the worst possible time, just after the 2015 update to the World Magnetic Model. This meant that the magnetic field had lurched just after the latest update, in ways that planners had not anticipated.
Second, the motion of the north magnetic pole made the problem worse. The pole wanders in unpredictable ways that have fascinated explorers and scientists since James Clark Ross first measured it in 1831 in the Canadian Arctic.
In the mid-1990s it (William, the North magnetic pole drift speed, increased by a factor of 5) picked up speed, from around 15 kilometres per year to around 55 kilometres per year.
Core questions
In the meantime, scientists are working to understand why the magnetic field is changing so dramatically.
The South Atlantic Anomaly refers to an area where our protective shield is weak. White dots on the map indicate individual events when Swarm instruments registered the impact of radiation from April 2014 to August 2019. The background is the magnetic field strength at the satellite altitude of 450 km.
https://dlmultimedia.esa.int/download/public/videos/2020/05/028/2005_028_AR_EN.mp4
The big question is whether the pole will ever return to Canada or continue heading south.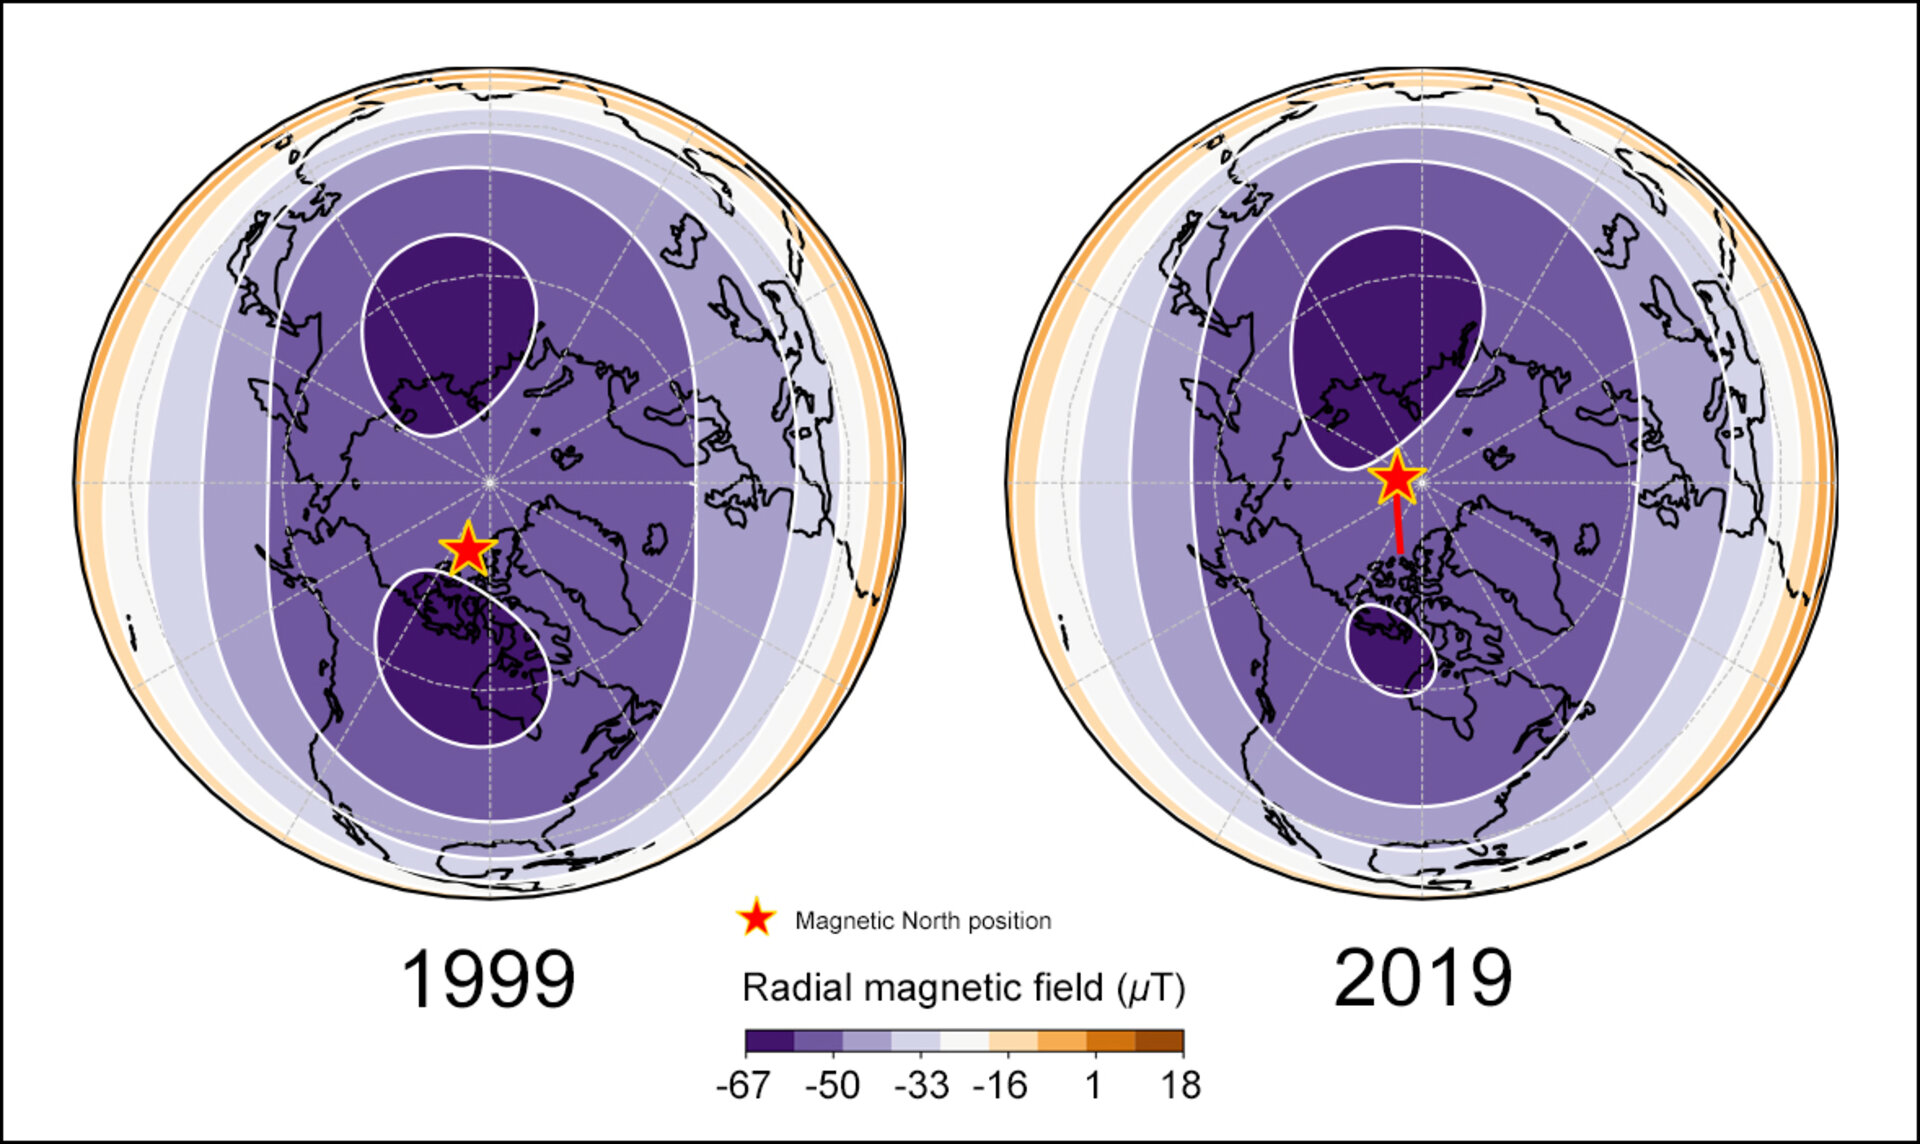
https://www.esa.int/Applications/Observing_the_Earth/Swarm
About three decades ago two magnetic poles were on the opposite sides of the globe, in about decade or two, the N (renamed S) will be firmly in Central Siberia, where currently is already peak of intensity. Both poles will be in the same (eastern) hemisphere and getting closer together than ever before since the last magnetic poles flip.
The latest measurements also confirm the movement of magnetic North towards Siberia.
These changes are based on the magnetic signals stemming from Earth’s core. Over the coming months, scientists will analyse the data to unravel the magnetic contributions from other sources, namely the mantle, crust, oceans, ionosphere and magnetosphere.
This will provide new insight into many natural processes, from those occurring deep inside our planet to space weather triggered by solar activity. In turn, this information will yield a better understanding of why the magnetic field is weakening.
https://www.esa.int/Applications/Observing_the_Earth/Swarm/Swarm_reveals_Earth_s_changing_magnetism
Observing the rapid changes in the magnetic field in Canada, I believe this will cause extremely harsh winters in North America during periods of weak Sun.
TL;DR.
Willis. Please cosnider adding a short summary at the beginning.
Thanks, Walter. It’s 963 words … about two typewritten pages. If that’s too long, perhaps you might consider politics. I hear 30-second sound bites are all the rage these days.
And what’s the summary going to say? “I looked at the study using stacked sunspot cycles, found some interesting things, but not enough data to conclude statistically that it’s wrong”?
Not sure how that would help, but I’ll give it some thought on my next post.
However, I write for effect as much as for science … would you want to have a “summary” at the start of an O. Henry short story that revealed the upcoming plot and the final twist? Seems more like a spoiler than a summary.
My best to you,
w.
“Every year following a minimum number of solar sun spots is an El Nino year…”
http://nexialinstitute.com/climate_el_nino.htm
Ulric, this is the same thing that their “termination” theory claimed. On average, the “termination is about a year and a half after the minimum number of sun spots.
So I’ve just been through this. Not gonna do it again.
w.
“What happens, and WHY? The sun spots appear to be associated with more energy reaching earth, and solar minima are associated with less heat, or global cooling. The oceans are vast reservoirs of heat for earth and by Le Chatelier’s principle will try to react so as to minimize any change in solar heating. Thus the oceans and weather react to release heat from the oceans to the continental masses at minima.”
During La Niña, the Pacific takes in solar energy. The more of it it takes in, the more it can release during El Niño.
Willis, I am impressed with the time you put into all of this. You seem to be unbiased and you only seek the truth with any theory. I do not believe enough good solar data goes back far enough to satisfy everyone without knowing the true mechanism. I have some ideas but these would not help me fill a thimble.
With that I wrote up something in 2006. Which has been out there for 15 years now. Key cycle dates in regards to stratosphere and POL changes. 5/66, 3/78, 6/88, and 6/98.
I obviously noticed the cooling of the SST’s and no El Nino’s present. Talked about this at the now defunct Eastern Weather forum where it was originally posted. This is all indirectly related to what it is now called the Terminator. I have been an astute solar space weather follower for the past 26 years. So I have noticed different changes within the cycle. And researched prior solar cycles thoroughly.
This paper has foundation. Their “clock” term is valid. If you are waiting on the 8am train to arrive you will most likely be using a clock to tell you how long until it arrives. But we know the clock does not move the train. I believe this might be the same thing. I noticed very early on, back in the 90’s, that changes in Jupiter’s Red Spot and Saturn’s White Spot showed (What I had read) changes during similar ENSO times. Coincidence? Maybe.
I will talk more openly about my theory if my El Nino forecast for 2021 comes to be true. But I also know very well that it may be worthless if it can not meet your standards. Regardless of the outcome.
Jim, you say:
“I will talk more openly about my theory if my El Nino forecast for 2021 comes to be true. But I also know very well that it may be worthless if it can not meet your standards. Regardless of the outcome.”
I’ve given a clear definition of my standards for what I consider to be an “El Nino Event” above— starts around November, ends around one year later, starts in the red, ends in the blue, involves a drop of at least a couple of index units.
So … what are your standards, so we can tell if your prediction is correct?
Willis, I have always considered the ONI monthly reading by the CPC. As you probably already know. No event is technically classified as a El Nino or La Nina until it has been five consecutive months. This method does not allow for temporary rebounds, like 2008, to be considered important. The latest ONI, JFM, was quite chilly still. -.90 . I would even be willing to say the 1st official month must be present by OND. Is this ok with you?
Climate Prediction Center – ONI (noaa.gov)
You have not just been through it, and it should be done at an event level rather than by averaging the periods.
Ulric, this is a great example of why I ask people to quote what you are referring to. Who is the “you” you’re referring to? What is the “it” that according to you this unknown person hasn’t been through?
Seriously, folks, I don’t ask that for fun. I ask so we can all follow what is often a long and convoluted discussion.
w.
Ridiculous, my reply is to your comment and obviously concerns your claim: “So I’ve just been through this”. You are the one now making things long and convoluted,
Ulric, clearly it is “obvious” to you. To me, it’s totally opaque.
QUOTE WHAT THE HELL YOU’RE TALKING ABOUT!!!
w.
The El Nino forms around the flattening of the current sheet’s tilt angle. Smoothed geomagnetic data shows this relationship indirectly as well. Per my 1/10/2020 tweet.
Jim Hughes windweather sun and stratosphere on Twitter: “An El Nino (red dots) has formed during the past five solar minimums while the current sheet tilt angle was very low. Another proxy to consider is when the smoothed ap index value falls below 9.0. This was seen in March 1997, 3/2006, and 3/2018. The latest is June 2019, 6.5 value https://t.co/Jr0hCm2I4e” / Twitter
The issue I see with this type of analysis is that it is trying to show correlations between two different data types. Nino anomaly data cannot be directly compared to raw solar activity data. Nino anomaly data would need to be represented as a cumulative integral, particularly for long term analysis. Alternatively, raw nino area temperature series can be used.
Huh? Science is inter alia about showing correlations between two very different data types … say cigarette smoking and cancer. Or sunspots and long distance ham radio communications.
Next, I see no reason to use a cumulative sum of an El Nino Index for this kind of data. It is useful, but not for looking at El Nino vs sunspots.
Best regards,
w.
Your writing is thought-provoking on many subjects but I detect that you’re on a mission to dispel any relationship between ocean swings and solar activity, and so you present the data in a way that supports your view. It is important that we all check our confirmation bias from time to time. The authors simply point out that solar activity does appear to “stack up” which is visible in cumulative ONI index values. The swings from warming periods to cooling periods in the ONI are visible in cumulative plots. The authors state that “just as we [are] not trying to explore every bump and wiggle, we do not try to predict or understand the magnitude of that swing, just that it exists.” The authors may have erred in using the language of “swings from El Nino to La Nina states”. What they demonstrate is a swing from increasing ONI index values to decreasing ONI index values over several ENSO cycles. The data supports the view that solar variability does appear to be related to variability of ONI mode over periods of decades.
JCM, I’m not on any kind of “mission”. I started out a true believer in the theory that sunspots affected surface weather. When I started out looking for data to support that I expected it would be easy to find … instead, I couldn’t find a single example that stood up to scrutiny. There are links to my many attempts here.
And I’m still looking.
Now, you say that “the authors” say that solar activity appears to “stack up”, and that is visible in cumulative ONI values. I have no clue which “authors” you are referring to, or how the cumulative sum of ONI is related to the cumsum of solar.
Since the ONI is short and agrees well with the NINO34 index, I just looked at the correlation of the cumulative sums of the sunspots and the NINO34 index … r^2 = 0.07.
And the nature of cumulative sums is that they are horribly autocorrelated, so we can’t say anything about the statistical properties of the relationship between the two.
w.
My apologies – this is in response to your critique of “Termination of Solar Cycles and Correlated Tropospheric Variability”, Leamon et al
I see this isn’t going to be a productive discussion. – but I would note that cumulative sums of sunspots should not be compared to NINO index values. This is not logical. I suggest the opposite by integrating the index and comparing to raw solar variables. It is wise to think of autocorrelation though, considering variables like temperature are exactly that, a cumulative sum of energy imbalances. This is an important consideration that is too often overlooked in statistical regression analyses.
One final note – the authors have already provided empirical evidence of their claim with the modified Superposed Epoch Analysis (mSEA). I am only suggesting a more easy to digest visualization. Nobody expects super strong correlations or anything like that. It is only one variable that appears to have a faint relationship which may or may not be amplified or attenuated by numerous other factors..
Hi Willy
Well done on your research. However, you may have missed the obvious through plain sight.
There is a relationship between the Moon (oceans, atmosphere) and the Sun (temperatures). I have been watching the moon for 48 years. It appears to me that one grand moon cycle =133 years =7 metonic cycles (19yrs)
133 years=12 Sunspot cycles, =29 El Ninos, =4.6 Saturn cycles.
One Saturn cycle = 6 El Ninos
2 Sunspot cycles = 5 El Ninos
1 decade = 2 El Ninos
1 El Nino = 1 quarter (4.6yrs) of moon declination cycle.
1 El Nino = 1/6 Saturn cycle, 2/5 Sunspot cycle, ¼ lunar cycle. The important equation that ties the Sun to the moon, is that 60 years (Sun)=13 El Ninos (Moon).
60 years is the well-known drought cycle, ref Inigo Jones work. But that’s why in the ancient cultures 13 was always known as the ‘moon’s number’, because 13 features so much in the moon’s orbits.
There are 13 full and new moons each year, 13 declination cycles, 13 perigees and apogees, and the moon moves 13° per day through space in its monthly orbit around the earth.
Lesser known are orbit anomalies that occur at roughly 13 weeks and 13 years. Every 13 years the phases recur (just over a week later). Every 26 years the opposite phase and apse occur about the same time.
Every 31 years (18+13) the opposite phase of the Moon occurs about two days later. Every 5 years (18-13) the opposite phase occurs (about 3 weeks later).
I think that looking for solar and lunar factors coinciding, holds more promise in the long run for the future of successful meteorological predictions. Lunar declination is the key to El Nino, but El Nino is only a hindsight look at the weather, whereas declination is known years in advance. Having something that is only called off-on at the end of a year, after 6 months sitting in a differential negative, is not a useful measure.
This is not a new idea, but it will, I believe, be confirmed as more data becomes available. The last El Nino was early on in 2020. It was barely noticed. Since then we have had a neutral readout. The period between solar minimum and solar maximum is typically about 6 years, and 2026 is the next expected solar maximum year which will probably be rather weak.
More of the El Nino phenomenon occurs around the peaks and troughs of the solar cycle, whereas the in-between years are notably wetter and have been called La Ninas, as if this some new weather thing. It is like giving the 30 June a brand new name, like the Semi-Year, and claiming new hitherto unknown weather feature has been “discovered”.
The next major standstill of the moon will be in 2025. It will not be vague, it will be fact. There will be no “condition” followed by an “episode”. Nor will there be “fizzers” or “powerful” lunar maximums. It will simply be the next to occur since 2006. Then we have to wait until 2043. It is simply what the moon does, and has done for many thousands of years.
Can’t remember the name for those always inferring some correlation of something (ENSO) w/some kind of cycle (in this case, solar cycles). Cyclomists? Cyclometrists? Cyclologists? Cyclastrologists? Cyclops?
It appears to me that finding correlations is the essence of science, and assuming them at the outset and then hunting for them using empiricism makes one a working scientist. Relying on luck, chance, probability and coincidence to explain things, is the language of the gambler. The casino needs to win and profit, so its mission is to destroy science. That is what is currently happening and they want you to believe that weather is unpredictable and chaotic, and not able to be predicted. I do not go near casinos for their influence is anti-science.