Spot the blip – any impact on CO2 from the Covid-19 shutdown is all but lost in the noise of natural variation
Guest essay by Eric Worrall
Proof that ongoing expensive CO2 reduction efforts are utterly futile. Green hopes that the Covid-19 lockdown would have a significant impact on global CO2 have been dashed.
World Meteorological Organization data crush hopes that lockdowns across the world would have pushed emissions to a record low.
Carbon dioxide levels hit new highs last year and are expected to keep growing in 2020, despite coronavirus-related restrictions that forced a global industrial slowdown.
The alarming patterns were published on Monday by the World Meteorological Organization (WMO), crushing hopes that lockdowns across the world would have pushed emissions, the main driver to climate change, to a record low.
…
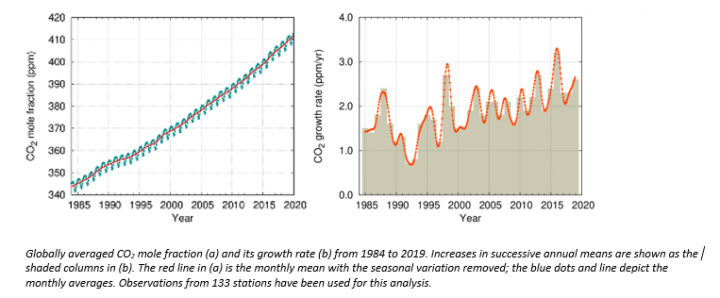
The WMO said the change in carbon dioxide concentrations – the result of cumulative past and current emissions – is, in fact, no bigger than the normal year-to-year fluctuations in the carbon cycle and in the amount of carbon being soaked up by vegetation and oceans.
Carbon dioxide levels continue at record levels, despite COVID-19 lockdown
23 November 2020 Press Release Number: 23112020
Geneva, 23 November 2020 (WMO) – The industrial slowdown due to the COVID-19 pandemic has not curbed record levels of greenhouse gases which are trapping heat in the atmosphere, increasing temperatures and driving more extreme weather, ice melt, sea-level rise and ocean acidification, according to the World Meteorological Organization (WMO).
The lockdown has cut emissions of many pollutants and greenhouse gases such as carbon dioxide. But any impact on CO2 concentrations – the result of cumulative past and current emissions – is in fact no bigger than the normal year to year fluctuations in the carbon cycle and the high natural variability in carbon sinks like vegetation.
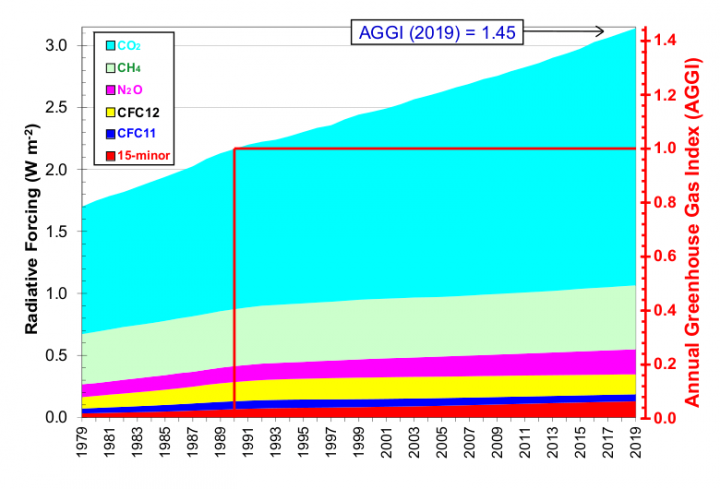
Carbon dioxide levels saw another growth spurt in 2019 and the annual global average breached the significant threshold of 410 parts per million, according to the WMO Greenhouse Gas Bulletin. The rise has continued in 2020. Since 1990, there has been a 45% increase in total radiative forcing – the warming effect on the climate – by long-lived greenhouse gases, with CO2 accounting for four fifths of this.
“Carbon dioxide remains in the atmosphere for centuries and in the ocean for even longer. The last time the Earth experienced a comparable concentration of CO2 was 3-5 million years ago, when the temperature was 2-3°C warmer and sea level was 10-20 meters higher than now. But there weren’t 7.7 billion inhabitants,” said WMO Secretary-General Professor Petteri Taalas.
“We breached the global threshold of 400 parts per million in 2015. And just four years later, we crossed 410 ppm. Such a rate of increase has never been seen in the history of our records. The lockdown-related fall in emissions is just a tiny blip on the long-term graph. We need a sustained flattening of the curve,” said Prof Taalas.
“The COVID-19 pandemic is not a solution for climate change. However, it does provide us with a platform for more sustained and ambitious climate action to reduce emissions to net zero through a complete transformation of our industrial, energy and transport systems. The needed changes are economically affordable and technically possible and would affect our everyday life only marginally. It is to be welcomed that a growing number of countries and companies have committed themselves to carbon neutrality,” he said. “There is no time to lose.”
CO2
Methane
Nitrous oxide
2019 global mean abundance
410.5±0.2 ppm
1877±2 ppb
332.0±0.1 ppb
2019 abundance relative to year 1750a
148%
260%
123%
2018-19 absolute increase
2.6 ppm
8 ppb
0.9 ppb
2018-19 relative increase
0.64%
0.43%
0.27%
Mean annual absolute increase of last 10 years
2.37 ppm yr-1
7.3 ppb yr-1
0.96 ppb yr-1
2020 Trends
The Global Carbon Project estimated that during the most intense period of the shutdown, daily CO2 emissions may have been reduced by up to 17% globally due to the confinement of the population. As the duration and severity of confinement measures remain unclear, the prediction of the total annual emission reduction over 2020 is very uncertain.
Preliminary estimates indicate a reduction in the annual global emission between 4.2% and 7.5%. At the global scale, an emissions reduction this scale will not cause atmospheric CO2 to go down. CO2 will continue to go up, though at a slightly reduced pace (0.08-0.23 ppm per year lower). This falls well within the 1 ppm natural inter-annual variability. This means that on the short-term the impact of the COVID-19 confinements cannot be distinguished from natural variability, according to the Bulletin.
New records in 2019
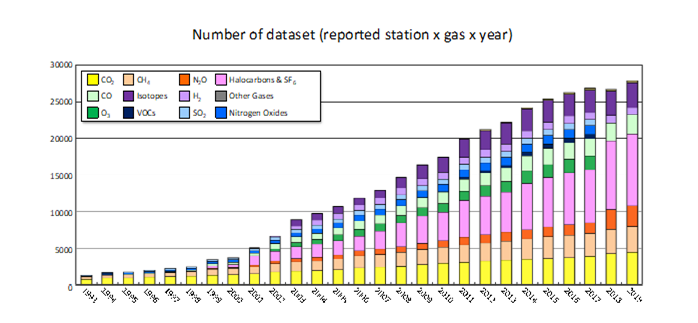
The Greenhouse Gas Bulletin – one of WMO’s flagship reports – provides details on atmospheric abundance of the main long-lived greenhouse gases: carbon dioxide, methane and nitrous oxide.
The Bulletin is based on observations and measurements from WMO’s Global Atmosphere Watch and partner networks, which includes atmospheric monitoring stations in remote Polar regions, high mountains and tropical islands. These stations have continued to function despite COVID-19 restrictions hampering resupplies and rotation of staff in often harsh and isolated locations.
Atmospheric radiative forcing, relative to 1750, of long-loved greenhouse gases and the 2019 update of the NOAA Annual Greenhouse Gas Index
CO2
Carbon dioxide is the single most important long-lived greenhouse gas in the atmosphere related to human activities, contributing about two thirds of the radiative forcing. The annual globally averaged level of carbon dioxide was about 410.5 parts per million (ppm) in 2019, up from 407.9 parts ppm in 2018, having crossed the 400 parts per million benchmark in 2015. The increase in CO2 from 2018 to 2019 was larger than that observed from 2017 to 2018 and also larger than the average over the last decade.
Emissions from combustion of fossil fuels and cement production, deforestation and other land-use change pushed 2019 atmospheric CO2 to 148% of the pre-industrial level of 278 ppm, which represented a balance of fluxes among the atmosphere, the oceans and the land biosphere. During last decade about 44% of CO2 remained in the atmosphere, while 23% was absorbed by the ocean and 29% by land, with 4% unattributed.
The Greenhouse Gas Bulletin is based on global average figures for 2019. Individual stations have shown that the upward trend continues in 2020. Monthly Average CO2 concentrations at the benchmark station of Mauna Loa, Hawaii, were 411.29 ppm in September 2020, up from 408.54 ppm in September 2019. At Cape Grim in Tasmania (Australia), the respective figures were 410.8 ppm in September 2020, up from 408.58 ppm in 2019.
Methane, a powerful greenhouse gas which remains in the atmosphere for less than a decade, was 260% of pre-industrial levels in 2019 at 1 877 parts per billion. The increase from 2018 to 2019 was slightly lower than that observed from 2017 to 2018 but still higher than the average over the last decade.
Methane contributes about 16% of the radiative forcing by long-lived greenhouse gases. Approximately 40% of methane is emitted into the atmosphere by natural sources (e.g., wetlands and termites), and about 60% comes from anthropogenic sources (e.g., ruminants, rice agriculture, fossil fuel exploitation, landfills and biomass burning).
Nitrous Oxide, which is both a greenhouse gas and ozone depleting chemical, reached 332.0 parts per billion in 2019, or 123% above pre-industrial levels. The increase from 2018 to 2019 was also lower than that observed from 2017 to 2018 and practically equal to the average growth rate over the past 10 years.
Several other gases are also presented in the Bulletin, including the ozone depleting substances regulated under the Montreal protocol.
Notes for Editors
The WMO Global Atmosphere Watch Programme coordinates systematic observations and analysis of greenhouse gases and other atmospheric constituents. Greenhouse gas measurement data are archived and distributed by the World Data Centre for Greenhouse Gases (WDCGG) at the Japan Meteorological Agency which celebrates its 30thanniversary in 2020.
A separate and complementary Emissions Gap Report by UN Environment will be released on 9 December. The Emissions Gap report assesses the latest scientific studies on current and estimated future greenhouse gas emissions; they compare these with the emission levels permissible for the world to progress on a least-cost pathway to achieve the goals of the Paris Agreement. This difference between “where we are likely to be and where we need to be” is known as the emissions gap.
The Global Carbon Project will release its annual update of the global carbon budget and trends in December.
The World Meteorological Organization is the United Nations System’s authoritative voice on Weather, Climate and Water
For further information contact: Clare Nullis, media officer. Email cnullis@wmo.int. Cell 41797091397
What kind of extreme lockdown would be required to level the curve? No nation would tolerate the medieval privations which would be required to significantly change the trajectory of anthropogenic CO2 emissions.
Greens have repeatedly suggested that the Covid-19 lockdown is a trial run for the coming climate lockdown. I suspect greens were hoping the CO2 curve would respond to the Covid-19 lockdown in a way they could present as proof that a viable path to a dramatically lower CO2 trajectory was within reach.
But now we’ve all seen proof that the kind of extreme cutbacks greens are proposing as part of a permanent solution to climate change don’t make a lot of difference.
00votes
Article Rating
62 Comments
Inline Feedbacks
View all comments
Herbert
November 24, 2020 2:26 pm
Once again, Willis Eschenbach is correct (see “Locking down See Oh Too” (WUWT: November 10, 2020)-
“ Conclusions.
My main conclusion is that despite the huge, almost incalculable cost of the lockdowns,the change in the rate of increase of CO2 is lost in the noise…..which certainly doesn’t prove anything either way about whether the increase is human caused.
My other conclusion is that this should give great pause to those who are blithely recommending restructuring of the global economy to replace fossil fuels…. look at the real world costs of the lockdowns around you and look at the meaningless CO2 benefits in the graph above.Not worth doing on any planet.”
They were never expecting to see the signal, human emissions, their answer goes like this.
Problem human emission 30GT natural emissions 750GT … the only way they build the alarm case is have the CO2 hang around for 100 years and then make the human CO2 molecules special and account for them differently all of which the IPCC does. So for them if you had 0 emissions today the CO2 levels don’t come back to todays level until year 70 from now so no you won’t see it on a 1 year shutdown you need a 70 year shutdown. So they would say it’s is vindication of their model.
There is a more problematic answer which is forbidden to discuss within the stupidity of climate science that the natural emissions are increasing or natural sinks are decreasing.
So where is the “barely visible” change? I can’t see it.
There was more outgassing from the oceans during strong El Nino years: 97/98 and 2016. The current bump looks just like any of the other bumps in between those two dates.
So we are supposed to do not just the same but even more of the same each year every year ?
At least we now see what they are really trying to sell us.
Perhaps it is the Red/Greens solutions that are causing CO2 emissions and the Nitrous Oxides, as well? After all, no solar plants were shut down during the COVID Lockdowns.
Duke Energy application points finger at solar for increased pollution http://bit.ly/2qU0grH
…“After committing $2 billion in tax credits, and more than $1 billion in electricity overpayments for solar power, we now learn from Duke that nitrogen oxides have actually increased, and that CO2 may be headed in the wrong direction.”
Carl Friis-Hansen
November 24, 2020 2:31 pm
Just hope the Green elite will accept the findings considering it comes from their warmist friend, the WMO.
On the other hand, the Greens appear to be unaffected by facts.
Just hope the Green elite will accept the findings considering it comes from their warmist friend, the WMO.
Good luck with that
Ant
November 24, 2020 2:47 pm
Therefore rising CO2 levels cannot be caused by human activity. Therefore if rising temperatures are correlated with increasing CO2, temperatures aren’t caused by human industrial activity.
Does this mean that Natural Variability isn’t science denial?
DMA
November 24, 2020 3:04 pm
“Carbon dioxide remains in the atmosphere for centuries and in the ocean for even longer. The last time the Earth experienced a comparable concentration of CO2 was 3-5 million years ago, when the temperature was 2-3°C warmer and sea level was 10-20 meters higher than now.”
Wrong on both counts!
Human emissions hardly change atmospheric CO2. Read “Climate Miracle” and it has an e-fold time of about 4-7 years. Multiple sources show CO2 concentration as high as today in the last 10K years.
Author Dr. Edwin Berry demolishes the IPCC’s very-scary catastrophic man-made global warming hypothesis. Ed proves from basic principles that the growth of CO2 in the atmosphere is primarily natural, not man-made. Berry’s analysis is consistent with my 2008 publication that atmospheric CO2 cannot significantly drive temperature, because changes in CO2 lag temperature changes in the modern data record, as they do in the longer-term ice core record. Kuo et al (1990) and Keeling (1995) made similar observations in the journal Nature, but have been studiously ignored by global warming propagandists. “The future cannot cause the past.”
AM, I’ve followed your comments for a long time, and this one was also spot on. I’ve also followed Ed’s site and agree. CO2, at .0415% of the global atmosphere, does not control the global atmospheric temperature. I ask James Hansen, Al Gore, Greta, AOC, and many others including, Joe Biden again, where is the scientific evidence that atmospheric CO2 is the main controller of the temperature? Even the established Green Brigade including Michael Moore with “Planet of the Humans, Michael Schellenberg with “Apocalypse Never” have perhaps come to their senses. Again, nice comment Allan.
Pan.. I believe 415 PPM is a ratio of 415/1000000,, or as a decimal, 0.000415. As a percent that would be expressed as .0415%, is that not correct?
Chris Hanley
November 24, 2020 3:09 pm
“Carbon dioxide levels continue at record levels, despite COVID-19 lockdown”.
That is only the raw data as yet to be corrected.
Steve Taylor
November 24, 2020 3:14 pm
May want to edit “Atmospheric radiative forcing, relative to 1750, of long-loved greenhouse gases and the 2019 update of the NOAA Annual Greenhouse Gas Index”
Ahh!! Stopping human industrial processes that produce CO2, makes no difference to global levels of Co2. It carries on growing regardless of what we do?
Perhaps we should engage a new strategy. Let all processes that produce and increase CO2 in the atmosphere party on and increase their efforts. That should bring the CO2 count tumbling down according to the Green logic we are seeing currently. Actually bin that last sentence there is no such thing as Green logic there is just green dogma.
Throw another prawn of the barbie.
Glenn Vinson
November 24, 2020 3:17 pm
Remember that the war on CO2 is not about CO2, its about control. If the CO2 levels does not respond to the China Virus shutdown, they will continue their well-funded attacks on the Western economies. I would expect the CO2 levels to be adjusted the way NOAA did the CONUS temperature records.
Yes, industry, travel, aviation may have shut down but..
Tillage, ploughing, paddy fielding, lo-till, (nitrogen) fertiliser use, slashing burning, forest/bog.moss drainage al Did Not Shut Down
Considerable numbers would starved and huge numbers would be currently be starving to death had those things shut down
Did they?
Are they?
YMMV but I (me, the handsome one in the mirror) would *not* put those things down to ‘Natural Variation’
What I’ve been saying on here since I first ever was allowed to comment.
Read all about it in David Montgomery’s book: Dirt: The Erosion of Civilisation
Even worse, a double whammy.
The tillage is what’s causing the observed twitching of thermometers but also, the consumption of the (fake haha) food that comes from the tilled soil is what’s causing the current train-wrecks that are science, politics, social & mainstream media
Sugar (cooked starch) destroys everything – minds, brains, bodies & souls and as we see, The Planet
Even before you top it off with alcohol and cannabis
We really are in a LOT of trouble here
I suppose that arguing about phlogiston and discussing the Emperor’s Clothes does distract somewhat.
But that’s all……
Perhaps at a time of thanksgiving no less, a bit of caution will suit a balanced view of the quality of life that most of us have enjoyed beyond any levels formerly known only by royalty. Thus we might temper one more cause for panic by noting that despite all the processing of originally harvested foodstuffs, average longevity in the developed world has increased an unprecedented 50% over the past century. And anyone who has experienced an insulin overdose can assure you that the brain that registers all such verities obligately relies upon an adequate blood sugar level for which there are simply no alternative fuels, in a dependence even more rigorous than our recent prosperity from fossil fuel use. Anyway I’ll understand if you decline either a slice of pumpkin pie tomorrow or of my birthday cake that by now bears up under such a profusion of annual candles.
“Carbon dioxide remains in the atmosphere for centuries”
The crenulated trace of the CO2 curve and the lack of a discernible Covid effect on the curve shows a couple of things:
1) that CO2 is readily pulled out of the atmosphere in days and weeks by spring/summer plant growth, largely from the magnitude of NH growth and pulling back.
2 this informs us that the Great Global Greening (and ocean plankton increase), which is an exponential process, similarly is affecting the trajectory of the curve more and more – could it not logically flatten the curve during coming even with business as usual ff burning at some equilibrium between emmissions and sequestration?
3) that with the global lockdown showing no detectable blip in the curve, the human caused CO2 emissions we are planning to eliminate would reduce partial pressure of CO2 in the atmosphere, stimulating increased out-gassing from the ocean.
4) there likely is a dampening feedback effect on bacterial growth with atmospheric rise in CO2. It’s removal could well stimulate increased bacterial activity.
Le Châtelier’s Principle acts in exactly these ways, resisting imposed changes, either in increasing CO2 or in reducing it. The more variables in, and complexity of the system processes, the more degrees of freedom Monsieur Le Châtelier has to confound puny intentions. Ask an activist climate scientist if he is aware of this powerful principle.
A comment below suggests that China did not really shut down. That is not accurate.
The orbiting CO2 observer OCO2 satellite https://www.nas.nasa.gov/SC20/demos/demo24.html#demo-1 shows the relative amounts of CO2 produced by each of the four main industrial areas of the world from January through August in: U.S., Western Europe, Russia and China. The anomalous decline of CO2 during the last year is shown against the averages in each of those countries over the last four years.
When the Chinese first became aware of the epidemic spreading out of Wuhan, the government shut down travel in and out of that city. That was around the end of January. Over the next three months, as their lockdown was deepened and extended into May, June and July, their CO2 production declined by .3 ppm.
The drop in CO2 due to industrial and travel inactivity is comparable in each of the four areas. U.S. anomaly also dipped more than .3 ppm in April and June. Russia’s contraction seems to have been the most pronounced, as it’s CO2 production declined .6 ppm in June before leveling at – .3. W. Europe’s CO2 production is – .5 going into August, the lowest of all the areas.
The breadth and depth of China’s national shut-down, which was covered extensively in all the papers here in the U.S., is born out by a corresponding decline in GDP. Quarterly figures released by China’s National Bureau of Statistics show China GDP averaging about 6.5 % going into the pandemic, but dropping to – 6.8 % in first quarter of 2020. Unlike Western countries, China has recovered to 3.2 and 4.9 % quarterly growth in the last two quarters. This does not lessen the draconian nature of China’s shut-down. By April half its citizens were under orders to stay at home. All city-to-city transportation networks were cut as was international air travel. The streets were virtually empty in many photos of the country.
The point of this is to remind us that, China, the second largest economy in the world, did indeed shut down during it’s own pandemic, making Earth’s “experiment”, such as it was, complete and unique in modern industrial history. It’s inconceivable that there will ever be another opportunity to gauge the effects of such a massive contraction of all human industry and its concomitant “pollution” by CO2. And what did it show?
There was no measurable decline in atmospheric CO2 beyond the expected seasonal bottom of the Keeling curve. The new U.S. administration and its leftist ambitions premise their favorite meme on the deadly rise of CO2. No more elegant proof need be provided that they are promoting a fiction.
Carbon dioxide is the single most important long-lived greenhouse gas in the atmosphere related to human activities, contributing about two thirds of the radiative forcing
That’s 100% bullshit. Once again, water vapor is ignored. As if the phrase “long-lived” means something. As if water vapor isn’t constantly replaced. This is one of many big lies and bullshit that the climate mafia regurgitates over and over again.
Don’t human activities, such as farming, irrigation, damming of rivers, etc., affect the amount of water vapor in the atmosphere? How could carbon dioxide contribute “two thirds of the radiative forcing” when water vapor is a much more powerful GHG? Apparently, if they don’t know how to measure the human influence on water vapor, it must be totally ignored.
You must remember that the purpose of the alarmist has never been about reducing CO2; it has always been about destroying capitalism. Why is communist China always given a free pass by the majority of the alarmist? Because it already has the type of government these people want. The COVID-19 lockdowns are based on lies just like the climate change narrative.
These lockdown and mask mandates have never ever been about your health or saving grandma (P.S. Grandpa doesn’t count, apparently.) I have been convinced since April it was always about retraining people to accept more government control and less liberty, with a secondary goal of removing the non-politician, non-globalist Donald Trump. It is amazing how many state governors are issuing un-Constitutional mask mandates with no pushback. My governor just decreed when masks may be worn inside my private property, a clear violation of the 4th and 5th Amendment.
tygrus
November 24, 2020 4:32 pm
Australia had a large release of CO2 last summer (2019/20) because of bushfires. Large areas coming out of draughts and moving from El Nino to La Nina and forrest recovery to see large amounts of CO2 absorbed over the next 2 years in our region. Although car & plane travel has reduced in most areas, many factories & domestic use has continued. Overall, the reductions from lockdowns have not been globally significant “Preliminary estimates indicate a reduction in the annual global emission between 4.2% and 7.5%.”
We would need 50 to 60% reduction to flatten the curve. The impact of same or more CO2 on temperatures & climate are still debatable. Filtering the natural noise and cycles of climate can make anything appear you want.
What would Inspector Clouseau do if his prime suspect had an ironclad alibi?
Maybe Biden’s new ‘Climate Czar” John Kerry and the IPCC (really Clouseau and Cato in clever disguise) will devise a clever plan that will keep us amazed at their – you know, the thing . . .
BARRY HOFFMAN
November 24, 2020 4:41 pm
About 57% of atmospheric CO2 coming from the oceans and 38% from animal respiration, all that is really left from an industrial contraction is guaranteed to be lost in the noise. Societies did not cease to exist. Only zealots would expect a significant result.
Latitude
November 24, 2020 4:42 pm
stupid…that’s because the lock down didn’t effect the main emitters
china didn’t lock down
Somehow China gets blamed for nothing….and all the countries that are in direct competition with China are the sole fault…have to destroy their economies
res
November 24, 2020 4:50 pm
I feel like if a super intelligent alien swung by our galaxy, they would say “it’s the ocean stupid”
As my gigantic Polish friend Dr Tadeuz used to say, “Vere do zey get zese IDIOTS?”
markl
November 24, 2020 5:17 pm
“The Great Reset” …… a Marxist ploy to control Western civilization coming to your country soon …. makes specific reference to Covid #19 as proof we can live comfortably without cars, bars, restaurants, movie theaters, concerts, etc. It’s like an extension of the GND and is the brainchild of the World Economic Forum (Davos) elite movers and shakers. It suggests we/West should learn to live without and give our excess to underdeveloped countries to raise their standard of living. Kind of an Agenda 21 redux. Like the Paris Disagreement it shames Capitalism as the root of all evil.
Tom
November 24, 2020 5:19 pm
What more proof do you need that further lockdowns are needed.
“The industrial slowdown due to the COVID-19 pandemic has not curbed record levels of greenhouse gases which are trapping heat in the atmosphere, increasing temperatures and driving more extreme weather, ice melt, sea-level rise and ocean acidification, according to the World Meteorological Organization (WMO).”
It just hit me that starting with “record levels”, the statement is seen everywhere AGWers are to be found from the media to governments to “scientific orgs. and beyond. It has become like a favorite bible verse at the start page in religious publications or a favorite quote in publications of any group on a mission. The issue is that all other publications favorite mantras probably have some to a lot of truth in them while with the AGWers and their mantra, it contains no truth and only contains provable lies.
Personally, I am very tired of reading the AGWers’ Big Lie. I wish they would just stop.
I know, I know, I might as well wish for world peace or for a unicorn for Christmas.
Bjarne Bisballe
November 24, 2020 10:29 pm
according to Wijngaarden & Happer (this year) forcing per extra molecule added is 31 times larger for CH4 than for CO2, so 8 ppb extra CH4 a year make the samme forcing as 0.25 ppm CO2 and that is 10% of 2.5 ppm CO2 – not 16% as mentioned.
Once again, Willis Eschenbach is correct (see “Locking down See Oh Too” (WUWT: November 10, 2020)-
“ Conclusions.
My main conclusion is that despite the huge, almost incalculable cost of the lockdowns,the change in the rate of increase of CO2 is lost in the noise…..which certainly doesn’t prove anything either way about whether the increase is human caused.
My other conclusion is that this should give great pause to those who are blithely recommending restructuring of the global economy to replace fossil fuels…. look at the real world costs of the lockdowns around you and look at the meaningless CO2 benefits in the graph above.Not worth doing on any planet.”
They were never expecting to see the signal, human emissions, their answer goes like this.
Problem human emission 30GT natural emissions 750GT … the only way they build the alarm case is have the CO2 hang around for 100 years and then make the human CO2 molecules special and account for them differently all of which the IPCC does. So for them if you had 0 emissions today the CO2 levels don’t come back to todays level until year 70 from now so no you won’t see it on a 1 year shutdown you need a 70 year shutdown. So they would say it’s is vindication of their model.
There is a more problematic answer which is forbidden to discuss within the stupidity of climate science that the natural emissions are increasing or natural sinks are decreasing.
And it only takes a small % change in those NATURAL emissions, to totally SWAMP any human contribution.
So the solution is simple.
We must destroy Nature in order to save it.
Gets my vote. Allez le bulldozers.
So where is the “barely visible” change? I can’t see it.
There was more outgassing from the oceans during strong El Nino years: 97/98 and 2016. The current bump looks just like any of the other bumps in between those two dates.
So we are supposed to do not just the same but even more of the same each year every year ?
At least we now see what they are really trying to sell us.
Perhaps it is the Red/Greens solutions that are causing CO2 emissions and the Nitrous Oxides, as well? After all, no solar plants were shut down during the COVID Lockdowns.
Duke Energy application points finger at solar for increased pollution
http://bit.ly/2qU0grH
…“After committing $2 billion in tax credits, and more than $1 billion in electricity overpayments for solar power, we now learn from Duke that nitrogen oxides have actually increased, and that CO2 may be headed in the wrong direction.”
Just hope the Green elite will accept the findings considering it comes from their warmist friend, the WMO.
On the other hand, the Greens appear to be unaffected by facts.
No, doesn’t match the narrative, the truth is, the CO2 decrease is hidden, the data are wrong, because it can’t have been in vain.
Just hope the Green elite will accept the findings considering it comes from their warmist friend, the WMO.
Good luck with that
Therefore rising CO2 levels cannot be caused by human activity. Therefore if rising temperatures are correlated with increasing CO2, temperatures aren’t caused by human industrial activity.
Sssh, you’ll spoil the surprise.
Lockdowns x 10 will do it.
Not enough. I want to get back to 1250 not just 1750. So I will double your lockdowns
Tonyb
Does this mean that Natural Variability isn’t science denial?
“Carbon dioxide remains in the atmosphere for centuries and in the ocean for even longer. The last time the Earth experienced a comparable concentration of CO2 was 3-5 million years ago, when the temperature was 2-3°C warmer and sea level was 10-20 meters higher than now.”
Wrong on both counts!
Human emissions hardly change atmospheric CO2. Read “Climate Miracle” and it has an e-fold time of about 4-7 years. Multiple sources show CO2 concentration as high as today in the last 10K years.
https://wattsupwiththat.com/2020/11/14/climate-sensitivity-estimates-declining-or-not/#comment-3125290
I recommend Ed Berry’s new book “Climate Miracle: There is no climate crisis Nature controls climate”
https://www.amazon.ca/Climate-Miracle-climate-crisis-controls-ebook/dp/B08LCD1YC3/
My review:
5 Stars.
An excellent, readable book that destroys the scary global warming / climate hypothesis.
Reviewed in Canada on November 11, 2020
Verified Purchase
https://www.woodfortrees.org/plot/esrl-co2/from:1979/mean:12/derivative/plot/uah6/from:1979/scale:0.22/offset:0.14
Author Dr. Edwin Berry demolishes the IPCC’s very-scary catastrophic man-made global warming hypothesis. Ed proves from basic principles that the growth of CO2 in the atmosphere is primarily natural, not man-made. Berry’s analysis is consistent with my 2008 publication that atmospheric CO2 cannot significantly drive temperature, because changes in CO2 lag temperature changes in the modern data record, as they do in the longer-term ice core record. Kuo et al (1990) and Keeling (1995) made similar observations in the journal Nature, but have been studiously ignored by global warming propagandists. “The future cannot cause the past.”
AM, I’ve followed your comments for a long time, and this one was also spot on. I’ve also followed Ed’s site and agree. CO2, at .0415% of the global atmosphere, does not control the global atmospheric temperature. I ask James Hansen, Al Gore, Greta, AOC, and many others including, Joe Biden again, where is the scientific evidence that atmospheric CO2 is the main controller of the temperature? Even the established Green Brigade including Michael Moore with “Planet of the Humans, Michael Schellenberg with “Apocalypse Never” have perhaps come to their senses. Again, nice comment Allan.
Think that’s .000415% a tree gas, unless I’m missing something. At .0415%, that’s 41,500ppm
.000415% a TRACE gas.
Pan.. I believe 415 PPM is a ratio of 415/1000000,, or as a decimal, 0.000415. As a percent that would be expressed as .0415%, is that not correct?
“Carbon dioxide levels continue at record levels, despite COVID-19 lockdown”.
That is only the raw data as yet to be corrected.
May want to edit “Atmospheric radiative forcing, relative to 1750, of long-loved greenhouse gases and the 2019 update of the NOAA Annual Greenhouse Gas Index”
I THINK that should be long-lived….
Plants have always LUV’d CO2 emissions. 🙂
Me love your greenhouse gases long time.
Ahh!! Stopping human industrial processes that produce CO2, makes no difference to global levels of Co2. It carries on growing regardless of what we do?
Perhaps we should engage a new strategy. Let all processes that produce and increase CO2 in the atmosphere party on and increase their efforts. That should bring the CO2 count tumbling down according to the Green logic we are seeing currently. Actually bin that last sentence there is no such thing as Green logic there is just green dogma.
Throw another prawn of the barbie.
Remember that the war on CO2 is not about CO2, its about control. If the CO2 levels does not respond to the China Virus shutdown, they will continue their well-funded attacks on the Western economies. I would expect the CO2 levels to be adjusted the way NOAA did the CONUS temperature records.
Yes, industry, travel, aviation may have shut down but..
Tillage, ploughing, paddy fielding, lo-till, (nitrogen) fertiliser use, slashing burning, forest/bog.moss drainage al Did Not Shut Down
Considerable numbers would starved and huge numbers would be currently be starving to death had those things shut down
Did they?
Are they?
YMMV but I (me, the handsome one in the mirror) would *not* put those things down to ‘Natural Variation’
What I’ve been saying on here since I first ever was allowed to comment.
Read all about it in David Montgomery’s book: Dirt: The Erosion of Civilisation
Even worse, a double whammy.
The tillage is what’s causing the observed twitching of thermometers but also, the consumption of the (fake haha) food that comes from the tilled soil is what’s causing the current train-wrecks that are science, politics, social & mainstream media
Sugar (cooked starch) destroys everything – minds, brains, bodies & souls and as we see, The Planet
Even before you top it off with alcohol and cannabis
We really are in a LOT of trouble here
I suppose that arguing about phlogiston and discussing the Emperor’s Clothes does distract somewhat.
But that’s all……
Peta of Newark,
“In the long run, the greatest weapon of mass destruction is stupidity.”
Thomas Sowell
Perhaps at a time of thanksgiving no less, a bit of caution will suit a balanced view of the quality of life that most of us have enjoyed beyond any levels formerly known only by royalty. Thus we might temper one more cause for panic by noting that despite all the processing of originally harvested foodstuffs, average longevity in the developed world has increased an unprecedented 50% over the past century. And anyone who has experienced an insulin overdose can assure you that the brain that registers all such verities obligately relies upon an adequate blood sugar level for which there are simply no alternative fuels, in a dependence even more rigorous than our recent prosperity from fossil fuel use. Anyway I’ll understand if you decline either a slice of pumpkin pie tomorrow or of my birthday cake that by now bears up under such a profusion of annual candles.
“Carbon dioxide remains in the atmosphere for centuries”
The crenulated trace of the CO2 curve and the lack of a discernible Covid effect on the curve shows a couple of things:
1) that CO2 is readily pulled out of the atmosphere in days and weeks by spring/summer plant growth, largely from the magnitude of NH growth and pulling back.
2 this informs us that the Great Global Greening (and ocean plankton increase), which is an exponential process, similarly is affecting the trajectory of the curve more and more – could it not logically flatten the curve during coming even with business as usual ff burning at some equilibrium between emmissions and sequestration?
3) that with the global lockdown showing no detectable blip in the curve, the human caused CO2 emissions we are planning to eliminate would reduce partial pressure of CO2 in the atmosphere, stimulating increased out-gassing from the ocean.
4) there likely is a dampening feedback effect on bacterial growth with atmospheric rise in CO2. It’s removal could well stimulate increased bacterial activity.
Le Châtelier’s Principle acts in exactly these ways, resisting imposed changes, either in increasing CO2 or in reducing it. The more variables in, and complexity of the system processes, the more degrees of freedom Monsieur Le Châtelier has to confound puny intentions. Ask an activist climate scientist if he is aware of this powerful principle.
LCP is also busy resisting ocean “acidification”!
A comment below suggests that China did not really shut down. That is not accurate.
The orbiting CO2 observer OCO2 satellite https://www.nas.nasa.gov/SC20/demos/demo24.html#demo-1 shows the relative amounts of CO2 produced by each of the four main industrial areas of the world from January through August in: U.S., Western Europe, Russia and China. The anomalous decline of CO2 during the last year is shown against the averages in each of those countries over the last four years.
When the Chinese first became aware of the epidemic spreading out of Wuhan, the government shut down travel in and out of that city. That was around the end of January. Over the next three months, as their lockdown was deepened and extended into May, June and July, their CO2 production declined by .3 ppm.
The drop in CO2 due to industrial and travel inactivity is comparable in each of the four areas. U.S. anomaly also dipped more than .3 ppm in April and June. Russia’s contraction seems to have been the most pronounced, as it’s CO2 production declined .6 ppm in June before leveling at – .3. W. Europe’s CO2 production is – .5 going into August, the lowest of all the areas.
The breadth and depth of China’s national shut-down, which was covered extensively in all the papers here in the U.S., is born out by a corresponding decline in GDP. Quarterly figures released by China’s National Bureau of Statistics show China GDP averaging about 6.5 % going into the pandemic, but dropping to – 6.8 % in first quarter of 2020. Unlike Western countries, China has recovered to 3.2 and 4.9 % quarterly growth in the last two quarters. This does not lessen the draconian nature of China’s shut-down. By April half its citizens were under orders to stay at home. All city-to-city transportation networks were cut as was international air travel. The streets were virtually empty in many photos of the country.
The point of this is to remind us that, China, the second largest economy in the world, did indeed shut down during it’s own pandemic, making Earth’s “experiment”, such as it was, complete and unique in modern industrial history. It’s inconceivable that there will ever be another opportunity to gauge the effects of such a massive contraction of all human industry and its concomitant “pollution” by CO2. And what did it show?
There was no measurable decline in atmospheric CO2 beyond the expected seasonal bottom of the Keeling curve. The new U.S. administration and its leftist ambitions premise their favorite meme on the deadly rise of CO2. No more elegant proof need be provided that they are promoting a fiction.
That’s 100% bullshit. Once again, water vapor is ignored. As if the phrase “long-lived” means something. As if water vapor isn’t constantly replaced. This is one of many big lies and bullshit that the climate mafia regurgitates over and over again.
As usual Steve, you are correct.
As my gigantic Polish friend Dr Tadeuz used to say, “Vere do zey get zese IDIOTS?”
Don’t human activities, such as farming, irrigation, damming of rivers, etc., affect the amount of water vapor in the atmosphere? How could carbon dioxide contribute “two thirds of the radiative forcing” when water vapor is a much more powerful GHG? Apparently, if they don’t know how to measure the human influence on water vapor, it must be totally ignored.
Beat me to it. I saw red when I read that.
You must remember that the purpose of the alarmist has never been about reducing CO2; it has always been about destroying capitalism. Why is communist China always given a free pass by the majority of the alarmist? Because it already has the type of government these people want. The COVID-19 lockdowns are based on lies just like the climate change narrative.
These lockdown and mask mandates have never ever been about your health or saving grandma (P.S. Grandpa doesn’t count, apparently.) I have been convinced since April it was always about retraining people to accept more government control and less liberty, with a secondary goal of removing the non-politician, non-globalist Donald Trump. It is amazing how many state governors are issuing un-Constitutional mask mandates with no pushback. My governor just decreed when masks may be worn inside my private property, a clear violation of the 4th and 5th Amendment.
Australia had a large release of CO2 last summer (2019/20) because of bushfires. Large areas coming out of draughts and moving from El Nino to La Nina and forrest recovery to see large amounts of CO2 absorbed over the next 2 years in our region. Although car & plane travel has reduced in most areas, many factories & domestic use has continued. Overall, the reductions from lockdowns have not been globally significant “Preliminary estimates indicate a reduction in the annual global emission between 4.2% and 7.5%.”
We would need 50 to 60% reduction to flatten the curve. The impact of same or more CO2 on temperatures & climate are still debatable. Filtering the natural noise and cycles of climate can make anything appear you want.
What would Inspector Clouseau do if his prime suspect had an ironclad alibi?
Maybe Biden’s new ‘Climate Czar” John Kerry and the IPCC (really Clouseau and Cato in clever disguise) will devise a clever plan that will keep us amazed at their – you know, the thing . . .
About 57% of atmospheric CO2 coming from the oceans and 38% from animal respiration, all that is really left from an industrial contraction is guaranteed to be lost in the noise. Societies did not cease to exist. Only zealots would expect a significant result.
stupid…that’s because the lock down didn’t effect the main emitters
china didn’t lock down
Somehow China gets blamed for nothing….and all the countries that are in direct competition with China are the sole fault…have to destroy their economies
I feel like if a super intelligent alien swung by our galaxy, they would say “it’s the ocean stupid”
I’d be more willing to bet that they would turn around and leave will telling those on the home planet that “There’s no intelligent life here.”
I recall Ed Caryl’s post a few years ago on NTZ
https://notrickszone.com/2013/10/08/carbon-dioxide-and-the-ocean-temperature-is-driving-co2-and-not-vice-versa/
linking most of the changes to degrees K of the sea, (not citizens burning )
As usual Steve, you are correct.
As my gigantic Polish friend Dr Tadeuz used to say, “Vere do zey get zese IDIOTS?”
“The Great Reset” …… a Marxist ploy to control Western civilization coming to your country soon …. makes specific reference to Covid #19 as proof we can live comfortably without cars, bars, restaurants, movie theaters, concerts, etc. It’s like an extension of the GND and is the brainchild of the World Economic Forum (Davos) elite movers and shakers. It suggests we/West should learn to live without and give our excess to underdeveloped countries to raise their standard of living. Kind of an Agenda 21 redux. Like the Paris Disagreement it shames Capitalism as the root of all evil.
What more proof do you need that further lockdowns are needed.
And yet, changes in the rarer NO2 are documented!
https://scitechdaily.com/nasa-model-reveals-how-much-pollution-levels-changed-due-to-covid-19-lockdowns/
“The industrial slowdown due to the COVID-19 pandemic has not curbed record levels of greenhouse gases which are trapping heat in the atmosphere, increasing temperatures and driving more extreme weather, ice melt, sea-level rise and ocean acidification, according to the World Meteorological Organization (WMO).”
It just hit me that starting with “record levels”, the statement is seen everywhere AGWers are to be found from the media to governments to “scientific orgs. and beyond. It has become like a favorite bible verse at the start page in religious publications or a favorite quote in publications of any group on a mission. The issue is that all other publications favorite mantras probably have some to a lot of truth in them while with the AGWers and their mantra, it contains no truth and only contains provable lies.
Personally, I am very tired of reading the AGWers’ Big Lie. I wish they would just stop.
I know, I know, I might as well wish for world peace or for a unicorn for Christmas.
according to Wijngaarden & Happer (this year) forcing per extra molecule added is 31 times larger for CH4 than for CO2, so 8 ppb extra CH4 a year make the samme forcing as 0.25 ppm CO2 and that is 10% of 2.5 ppm CO2 – not 16% as mentioned.