Guest “Go ahead, make my day…” by David Middleton
Charleston sues ‘Big Oil’ for flooding in SC Lowcountry caused by global warming
By Mikaela PorterSep 9, 2020 Updated Sep 11, 2020The city of Charleston filed a lawsuit Wednesday in state court against two dozen major oil and pipeline companies, alleging their products and the spread of misinformation about fossil fuels have caused climate change and repetitive, disastrous flooding in the city.
The lawsuit demands those companies — some of the biggest names in the industry — pay for the cost of trying to keep the city dry. But it doesn’t specify a dollar amount.
It was the second assault on the oil industry in two days. On Tuesday, President Donald Trump announced a moratorium on drilling off the coasts of South Carolina, Georgia and Florida.
[…]
The Post and Courier
First “Assault” – The Moratorium
Firstly, President Trump did not impose a moratorium. A moratorium was already in place. The President extended it.
Secondly, the area of the extension (off the Atlantic coast) is the South Atlantic Planning Area…

This is the Atlantic planning area with the least oil & gas potential.

I would have preferred that he not extend the moratorium… But the President doesn’t always do what I would want him to do. And, if an area of the Atlantic OCS had to remain closed, the South Atlantic was the right choice.
The first “assault” on the oil industry rates a Christoper Walken Award.

Second “Assault” – The Junk Lawsuit
The city of Charleston filed a lawsuit Wednesday in state court against two dozen major oil and pipeline companies, alleging their products and the spread of misinformation about fossil fuels have caused climate change and repetitive, disastrous flooding in the city.
The lawsuit demands those companies — some of the biggest names in the industry — pay for the cost of trying to keep the city dry. But it doesn’t specify a dollar amount.
The Post and Courier
Form the junk lawsuit’s introduction:
Defendants, major corporate members of the fossil fuel industry, have known for nearly half a century that unrestricted production and use of fossil fuel products create greenhouse gas pollution that warms the planet and changes our climate. They have known for decades that those impacts could be catastrophic and that only a narrow window existed to take action before the consequences would be irreversible. They have nevertheless engaged in a coordinated, multifront effort to conceal and deny their own knowledge of those threats, discredit the growing body of publicly available scientific evidence, and persistently create doubt in the minds of customers, consumers, regulators, the media, journalists, teachers, and the public about the reality and consequences of the impacts of their fossil fuel pollution.
Junk Lawsuit
“They have known for decades…”
This cartoon appears on page 62 of this, and nearly every other, junk climate lawsuit:

The exact same image, including the caption is in Delaware’s recent junk lawsuit. The graph is from what is known as the “Black presentation” and supposedly reveals Exxon’s secret knowledge of climate change, which was being withheld from the public. The “infamous” 1978 Black presentation was derived from government and academic publications and conferences on the so-called greenhouse effect.
Here’s what Exxon knew in 1978…


Black’s allegedly proprietary climate model was just a cartoon based on publicly available literature. I overlaid HadCRUT4 (Northern Hemisphere) on the Black cartoon:

If HadCRUT4 is right (it isn’t), it’s now only slightly warmer than the “approximate range of undisturbed climate in past few centuries.” Just like the models of today, the observations track at or below the 95% confidence band. Way back in 1977, Exxon Knew that the climate models overestimated warming!
What’s even funnier? The “Black presentation” was made during the height of That 70’s Climate Crisis Show. If the climate models are correct (they aren’t), ExxonMobil and other purveyors of fossil fuels saved the world from this:

Just imagine the lawsuit if Exxon and all of the other purveyors of fossil fuels had stopped producing and selling fossil fuels back when they first learned “that unrestricted production and use of fossil fuel products create greenhouse gas pollution that warms the planet and changes our climate,” and this actually occurred:

“Repetitive, disastrous flooding in the city”
From page 2 of the junk lawsuit:
Anthropogenic greenhouse gas pollution, primarily in the form of CO2, is far and away the dominant cause of global warming, resulting in severe impacts including, but not limited to, sea level rise, disruption to the hydrologic cycle, more frequent and intense extreme precipitation events and associated flooding, more frequent and intense heatwaves, more frequent and intense droughts, and associated consequences of those physical and environmental changes.
Junk Lawsuit
The worst flooding in recent history was in 2015…
South Carolina Flood Frequency Q&A
In 2015, Dr. Robert Holmes, USGS National Flood Hazard Coordinator, took time to discuss some issues related to the flooding in South Carolina following the Appalachian Floods and Hurricane Joaquin.
[…]
Is this flood due to climate change?
USGS research has shown no linkage between flooding (either increases or decreases) and the increase in greenhouse gases. Essentially, from USGS long-term streamgage data for sites across the country with no regulation or other changes to the watershed that could influence the streamflow, the data shows no systematic increases in flooding through time.
A much bigger impact on flooding, though, is land use change. Without proper mitigation, urbanization of watersheds increases flooding. Moreover, encroachment into the floodplain by homes and businesses leads to greater economic losses and potential loss of life, with more encroachment leading to greater losses.
USGS
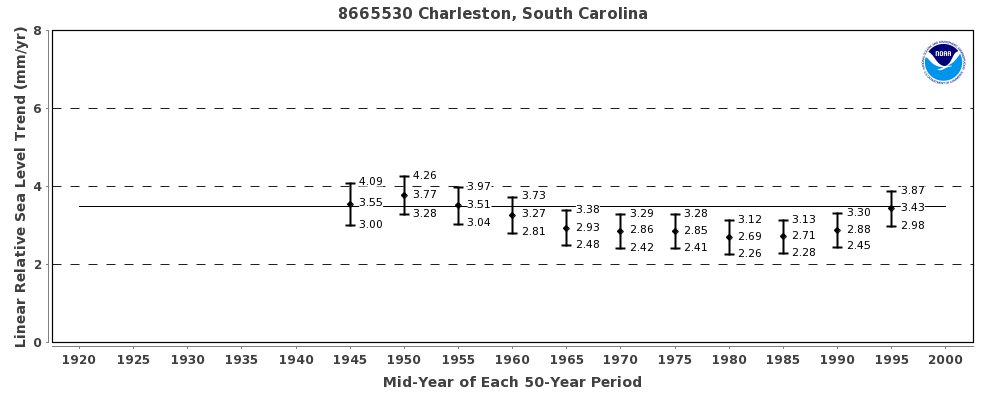
The USGS says that there is “no linkage between flooding (either increases or decreases) and the increase in greenhouse gases.” The Mark I human eyeball tells us that there is no linkage between the rate of sea level rise and the increase in greenhouse gases. There has been no change in the rate of sea level rise in Charleston over the past 120 years.


Variations of the word, “flooding,” appear over thirty times in this junk lawsuit, mostly in terms of future speculation.
For instance, average sea level has already risen and will continue to rise substantially along Charleston’s coast, causing flooding, inundation, erosion, and beach loss; extreme weather, including hurricanes, drought, heatwaves, and other extreme events will become more frequent, longer-lasting and more severe…
Junk Lawsuit
Now… I’m not a lawyer, nor have I ever played a lawyer on TV… But, I don’t think speculation about future damages establishes “standing” in court.

But, then again, with the Climatariat and the lamestream media, model-based prognostications about the future are often regarded as established facts.
That said, flooding is a serious issue in Charleston and a rising sea level certainly won’t improve the situation. But, Charleston doesn’t flood *because* climate change.
JUNE 24, 2014
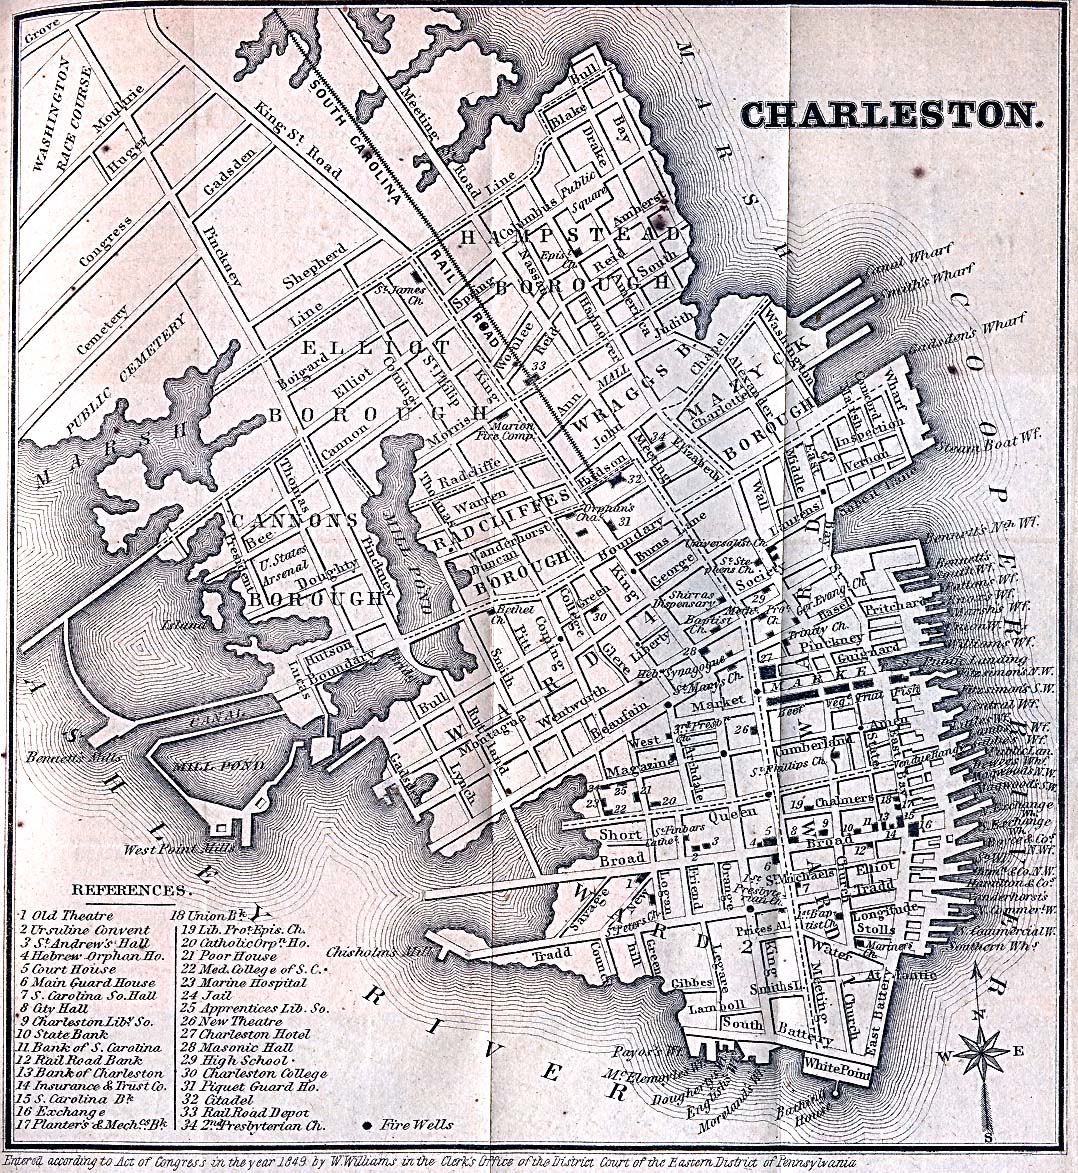
The History Behind Flooding in Charleston, South CarolinaFor many the idea of sea level rise and its associated impacts are thought of as future events. But, here in Charleston it’s already a part of life. Coastal flooding is a major issue that the city faces. All it takes is just the right tide, or even worse, an extreme high tide paired with a torrential downpour during rush hour, and Charleston’s streets become fingers of the Atlantic Ocean that no car can ford. It’s not hard to fathom that these flooded streets will one day become creeks and marshes. And in many cases that is what they once were.
As far back as the 18th century, Charlestonians have made a practice of expanding the city’s footprint by filling creeks and marshes. Alfred O. Halsey’s Historic Charleston on a Map provides an amazing illustration of the change to the peninsula’s landscape (Preservation Society of Charleston [PSOC]). The map shows that many areas that frequently flood are atop man made land.
The aptly named Water Street in the South of Broad neighborhood was originally Vanderhorst Creek, until it was filled in 1792. Many are familiar with the images of kayakers paddling through the City Market after wayward bands from Hurricane Isaac flooded the city. This could have been a common sight if what was once Governor’s Creek wasn’t filled in to create Market Street in first decade of the 19th century. Both the Charleston Village and Cannonborough neighborhoods were filled in during the mid 1800s and both are notorious for their flood problems. The city has continued to alter the coastline as late as the 1960s. During this time, Lockwood Boulevard was constructed which resulted in cutting off the Charleston Municipal Yacht Basin from the Ashley River and converted it into a placid pond (Thompson 2013).
[…]
Geozone (NOAA Office for Coastal Management)
I put together a comparison of Halsey’s 1949 historical map (Preservation Society of Charleston) and an 1869 Charleston street map (University of Texas):

Charleston floods because they built much of the city in the Atlantic Ocean. And… let’s not forget subsidence.
The Defense Rests
About the Author
David Middleton is a proud member of the “climate wrecking industry” since 1981. He has been a geophysicist/geologist in the oil & gas industry for just under 40 years, working for companies you probably have never heard of. He normally doesn’t speak of himself in the third person.
“There has been no change in the rate of sea level rise in Charleston over the past 120 years.”
Uh, ok.
Projected change from now to 2100, using pre 1980 data, extended to 2100, acceleration included – ~0.15 meters.
Projected change from now to 2100, using post 1980 data, extended to 2100, acceleration included – ~1.43 meters.
And BTW, per either the freeware workup, or that available in PSMSL, the P5’s and P95’s don’t bail you out, either.
Feel free to goal post move all you like, but this is YOUR data….
Hey, how’s those hedges werkin’ fer ye? Don’t know who you work for, but most of the class of companies you describe have lost over 80% of their market cap in the last 5 years, and their current CAPEX budgets hardly cast a shadow. And they also all have weasel words in their quarterly reports that essentially say that if a’lOrange didn’t give them indefinite breaks on realistic asset retirement bonding, they would face an immediate cash crunch. Love that corpo welfare, David. But it DOES give you more time to post….
The EverReady Bunny is back.
Horst schist. For sea level to rise over 1 meter over the rest of this century, it would have to accelerate to a rate twice that of the Holocene Transgression.
The rate from 2081-2100 would have to average 20 mm per year, twice that of the Holocene Transgression. This is only possible in bad science fiction movies.
Try to follow along.
There have been at least three recent peer-reviewed papers asserting an anthropogenic acceleration in the rate of sea level rise (SLR): Church & White, 2006 (CW06), Church & White, 2011 (CW11) and Nerem et al., 2018 (N18). N18 only covers the satellite era (since 1993) and might actually be correct, albeit irrelevant. The primary culprits in the SLR acceleration scam are CW06 and CW11. Two other recent peer-reviewed papers clearly shoot down the notion of a recent anthropogenic acceleration: Jevrejeva et al., 2008 (J08) and Jevrejeva et al., 2014 (J14). This post will focus on CW11 (updated through 2013) and J14.
J08 and J14 indicate that the acceleration, to the extent there is one, started 150-200 years ago, consistent with the end of neoglaciation and that a quasi-periodic fluctuation (~60-yr cycle) is present. CW06 and CW11 also note the 19th Century acceleration; but also assert a more recent acceleration, presumably due to anthropogenic global warming. This SLR acceleration is, at worst, innocuous.
310 mm from 1990-2100 is less than 3 mm/yr… Not much of an acceleration.
Here’s a comparison of Jevrejeva et al., 2014 (J14) and Church & White, 2011 (CW11):
J14 vs CW11. 310 mm is less than the length of an Estwing rock pick. The green curve is CW11’s pentadal (5-yr) average. The red curve is J14’s pentadal average. The CW11 y-axis is shifted up 100 mm to tie J14.
J14 starts 60 years earlier than CW11, capturing the falling sea level at the end of neoglaciation and the Little Ice Age. We can see that J14 and CW11 match up pretty well from 1880-1930 and then again from about 1993 onward; but they are very different from 1930-1993. J14 exhibits an acceleration to 3.2 mm/yr from 1929-1963 and then a deceleration to less than 1 mm/yr from 1963-1993, after which it accelerates back to about 3.2 mm/yr.
https://wattsupwiththat.com/2019/12/09/sea-level-rise-acceleration-jevrejeva-vs-church-white/
What’s the current rate of SLR?
However you slice it, the rate yields far less than 1 meter of SLR this century.
You must have worked for the sh!ttiest companies in the oil patch to become so bitter.
I actually have more time to post when I’m in the office than when I’m working from home.
“Horst schist. For sea level to rise over 1 meter over the rest of this century, it would have to accelerate to a rate twice that of the Holocene Transgression.”
But that’s not what I referred to. I referred to the ACTUAL trends, including the acceleration that you conveniently ignore. I showed you, using your own example, that you are incorrect w.r.t physically significant time periods.
“You must have worked for the sh!ttiest companies in the oil patch to become so bitter.”
Interesting. No dispute over my accurate info. Just invective
No, not “bitter” at all. Oil biz, ben bery, bery, gud tu mi, starting out way before you, pulling slips in the Sooner Trend, under age. After my first “Mines” degree, all mid sized Indies, all very good employers. They even paid thru the nose for USC grad school. But unlike you, I got out of my comfort zone and went international, rotational, in conflict areas, in the late ’90’s and aughts. As you might have heard, hyper lucrative, which enabled me to fade away from it 8 years ago, as it all started flaming out. My larger view woke me up to the upcoming financial and environmental fiasco in E&P, without even a mention of AGW. One can only hope that, unlike most of us, you’ve saved up.
Kids are teaching, software engineering. I.e. out of the patch, for which I thank the Imaginary Guy In The Sky every day…..
You engaged in arm waving. I posted actual trends from actual data, demonstrating that your arm waving was horst schist.
The actual, post “acceleration” trend is ~3.3 mm/yr. It’s been ~3.3 mm/yr since at least the mid-1990’s. Even with Nerem’s bogus asserted acceleration rate, 21st SLR still falls short of 1 meter.
https://www.pnas.org/content/115/9/2022
What “accurate info”? Just more speculation and arm waving. Our market cap has cratered ~80% since January. Down-cycles suck. But it creates a lot of buying opportunities.
There’s no need to invoke climate change to explain the flooding of the Charleston peninsula:
1. Approximately half of the Charleston peninsula (where the flooding occurs) consists of filled in marshes and sawmill ponds.
2. Until the 1970’s, artesian fountains flowed throughout the city. Groundwater withdrawal has lowered the groundwater level to the point that they no longer flow.
3. Charleston is seismically active. The last great earthquake was in 1886, but small quakes occur regularly. One result of the tectonic activity is that some areas of the SC lowcountry are slowly rising, while others are slowly subsiding.
Case dismissed.
“There’s no need to invoke climate change to explain the flooding of the Charleston peninsula:”
There is, but I didn’t. FYI, if you assume that the sea level data does not take into account the ~5″/century of subsidence, and then subtract that from the pre and post 1980 rise data, the projections from now to 2100 change hardly at all.
The deniersphere is apparently allergic to actually evalauting the data….
Where did you come up with your BS number of ~5″/century of subsidence?
Answer the following:
How many inches/year do the landfilled marshes in Charleston subside?
How many inches/year does the artesian aquifer beneath the lowcountry subside due to dewatering?
How many inches/century does tectonic activity cause different areas of the lowcountry to uplift or subside?
FYI: these are rhetorical questions for now, because at the moment, no one knows the answers.
And FYI: numbers pulled from your bunghole neither qualify as ‘data’, nor do they make you look smart.
“Where did you come up with your BS number of ~5″/century of subsidence?”
https://sealevelrise.org/states/south-carolina/
” In Beaufort County, SC, the ground is sinking approximately 1 inch lower every 20 years.”
“Answer the following:”
Why? It’s already been done, per my link. But if you have a different post 1900 schedule of subsidence, feel free to post it, with it’s link. Then. we’ll apply that schedule to PSMSL data, and do those pre and post 1980 projections from now to 2100, to see how they change those from the PSMSL data. I already showed you that the published 5″/century value makes not a whit of difference, but feel free to keep on diggin deeper…
I am sure that the city is a major purchaser of fossil-fuel-derived energy. The first question i would ask as the lawyer defending against this law suit is why?They are willingly buying the very product that they claim will destroy their city.
Nice to know Charleston has so much (taxpayers’) money to toss down the drain. Y’all are welcome to throw some my way. 😀
Your Figure 11 is not quite right. It shows relative sea level rise, not true sea level rise. Land subsidence at the Charleston gauge is available from PSMSL.org and shows a subsidence of about 2 mm/yr. When corrected for subsidence, Charleston’s true sea level rise is about 1.3 mm/yr which is consistent with Larson at [https://meridian.allenpress.com/jcr/article-abstract/22/4%20(224)/788/28512/A-Search-for-Scale-in-Sea-Level-Studies?redirectedFrom=fulltext] which shows a true sea level rise of about 1.6 mm/yr on the US East coast for the past 6,000 years. Why is Charleston sinking this much? Perhaps it is due to fresh water extraction as is the cause for Norfolk, Virginia – sinking even faster. Perhaps it is due to movement of geologic faults in the area. It seems that the question of Charleston’s sea level rise requires more study.
Read the last sentence in the post…
Okay I’ll ditch my prelim ideas for vacations to Hilton Head, not because of flooding or global warming but because of local, Official idiocy. The phrase “out of an abundance of caution” works both ways.
If “corporations” are responsible for global warming, how come it is only western – mostly US – corporations that are in the dock? Any large fossil fuel producer will have been aware of the climate “science” since the late 1980s.
In 2017 the Guardian reported on the top 100 corporations by contribution to global emissions in the period 1988-2015. Maybe silly stats, but still relevent to who should be prosecuted.
https://www.theguardian.com/sustainable-business/2017/jul/10/100-fossil-fuel-companies-investors-responsible-71-global-emissions-cdp-study-climate-change
The top 5 with % of global greenhouse gas emissions were
1 China (Coal) 14.32%
2 Saudi Arabian Oil Company (Aramco) 4.50%
3 Gazprom OAO 3.91%
4 National Iranian Oil Co 2.28%
5 ExxonMobil Corp 1.98%
The top 4 are state-controlled corporations. If “Exxon knew” then so did the states of China, Saudi Arabia, Russia & Iran. They must, in fairness, also be in the dock. But fairness has nothing to do with it. These lawsuits are inspired by those who revile capitalist wealth creation and, by implication, the high living standards of the United States.
David M nailed it. I am from Charleston and lived there for most of my life until about 7 years ago. Downtown, peninsular, Charleston lies pretty much at sea level at the confluence of the Ashley and Cooper rivers. These two rivers meet to form Charleston harbor which empties into the Atlantic ocean. The stormwater drains empty into the adjacent rivers and harbor and during high tides, especially King Tides, there is simply no place for the run-off from rain storms pto drain. Even the slightest rainfall during a high tide can cause flooding in the low lying areas. To make matters worse, as indicated by David, much of the peninsula is built on filled in creek beds and marshland and these areas are subsiding.
I recall an event some years ago, when driving through one of the filled in areas, encountering an intersection that was covered by a large puddle maybe 120 feet across and perhaps 8-10 inches deep at the center. What was surprising about this was that it was a clear spring day without a cloud in the sky. As I crossed the intersection I noticed a small ‘geyser’ of water perhaps one inch in diameter shooting up about 4-5 inches above the surface of the water at the center of the puddle. As I drove by I examined the ‘geyser’ and saw that it was emanating from the lifting hole in a manhole cover over a stormwater drain. I later determined that we were experiencing an unusually high tide that day and concluded that the puddle and the ‘geyser’ resulted from water from the river flowing back through the stormwater drain onto the street; the water in the river was apparently significantly higher than the street level at the point of the puddle.
The mandate EVs should work fine in that.