Over in the Tweetosphere, where I’m @WEschenbach, I read that we’re in for rainy times:
The atmosphere cools and shrinks when the Sun gets sleepy. Rain is wrung out of it like a sponge. We have been entering a solar grand minimum since 2008. The bottom of it will be around 2035.
There are two parts to that claim. One is that in times of low solar activity (signified by low sunspots) the atmosphere, in particular the troposphere where the weather occurs, will cool down. The other is that when the troposphere cools down, we’ll get significantly more rain as the water is “wrung out of” the troposphere. So let me look at the parts separately.
First, does the troposphere cool down during times when low sunspots signify low solar activity? If so, nobody told the troposphere. If temperatures actually dropped when sunspot numbers dropped, then temperatures and sunspot numbers would be positively correlated … but here’s the reality:

Figure 1. Correlation between UAH MSU monthly lower tropospheric temperature anomaly in various areas of the planet and monthly sunspots, Dec 1979 to June 2020. Blue is positive correlation, red is negative. Latitude bands as follows: Global -85 to +85 latitude
Hemispheric 0 to +/- 85 latitude
Extratropics +/- 20 to +/- 85 latitude
Polar +/- 60 to +/- 85 latitude
Note that there are no negative correlations between tropospheric temperatures in different parts of the world. When the world warms or cools, it seems the motions of the troposphere and ocean must move the heat around the planet fairly rapidly. The only area in Figure 1 where the troposphere is relatively uncoupled from the rest of the planet is the South Pole.
But not one part of the troposphere is positively correlated with sunspots as the claim would require.
Now, the absence of evidence is not evidence of absence. So all I can say is that once again, I find no evidence that sunspots and atmospheric temperatures are significantly positively correlated as the theory requires. This agrees with my previous research on the subject as put forth in the 24 or so posts listed here …
Next, let’s examine the claim that we’ll have lots more rain because it would get “wrung out of” the cooler troposphere. I’ve not run the numbers yet, but that seems highly improbable. The amount of rainfall is a function of the amount of water leaving the surface, passing through the clouds, and returning to the surface. It’s not so much a function of the amount that the atmosphere can hold at a given instant.
Here’s a way to envision it. If you think of the hydrological cycle as a giant waterwheel lifting water from the surface to the clouds and then returning the water back to the surface as rain, the amount of rain is a function of how fast the waterwheel is turning, not just the size of the buckets.
So, having considered what I might expect to find, I ran the numbers. Virtually all atmospheric water is in the troposphere, the lowest level of the atmosphere. The amount of water in the troposphere is called “total precipitable water” or “TPW”, with units of kilograms of water per square metre (kg/m2) of surface area. Globally, the average TPW is about 28 kg/m2.

Figure 2. Distribution of total precipitable water.
(Unfortunately, I can’t find numbers for global TPW. However, TPW above the ocean is bound to be greater than TPW above the desert or in the mountains. So the values above represent a maximum possible value for the global TPW.)
Now, the metric system is lovely. One liter of water weighs one kilo. And one millimetre of rainfall over one square metre is one liter of rainfall. So if every drop of the 28 kg/m2 of precipitable water were squeezed out of the sky, we’d get 28 mm (about an inch) of rainfall. And since the global average rainfall is about 1 metre (39 inches) per year, the atmosphere only holds water to the amount of about 2.8% of average annual rainfall. A small amount. As I said, the amount of rainfall is not a function of atmospheric capacity.
But wait, that’s converting all 28 kg/m2 of the precipitable water to rain. The amount squeezed out by a temperature change is far less than that. Per the discussion here, the change in TPW at the global mean temperature of about fifteen degrees C is on the order of one kg per degree.

Figure 3. Scatterplot, Remote Sensing Systems (RSS) total precipitable water (TPW) versus the ReynoldsOI sea surface temperature data.
So if the troposphere were to cool by say 2°C, it might squeeze 2 kilos of water per square metre, which is 2 mm of rain, out of the atmospheric sponge … and that’s a one-time 2 mm increase spread out over the entire 15-year period of projected cooling. So it would be much less than a millimetre per year.
And that’s a change in annual rainfall of much less than a tenth of one measly percent—not even detectable.
Conclusions? The claims that decreasing solar activity
- will bring tropospheric cooling, and that
- the cooling will “wring” a significant amount of water out of the troposphere,
both fail to find any observational or theoretical support in the tropospheric temperature and TPW datasets considered above.
Best to all, stay safe, stay well,
w.
PS—When you comment, please quote the exact words you are discussing, so we can all understand just exactly what and who you are referring to.
What happens is, the thermosphere is cooling down in solar minimum, it’s published as TCI, Thermosphere Climate Index.
Explanation text by Dr.Tony Phillips.
Correlation with an offset, perhaps something more chaotic.
“TCI, Thermosphere Climate Index.”
“climate”? There is no “climate” in the thermosphere, in the usual ‘terrestrial’ sense. Because the thermosphere is essentially “outer space”, i.e., the home of the ISS and many other space vehicles.
Sure, there is a very tiny bit of ‘atmosphere’ there, many thousands of molecules per cubic meter or so. But the notion of ‘kinetic temperature’ on our human scale does not exist. The molecules are so far apart that collisions are neglible, so the usual atmospheric hydrostatic pressure laws no longer hold.
“We see a cooling trend” [during solar minima]
Of course we do, because the thermosphere is where virtually all of the solar extreme-ultraviolet (EUV) is absorbed, which does indeed directly raise the kinetic energy (‘temperature’) of the molecules in the thermosphere. In fact, the TCI is almost perfectly correlated to sunspot activity because of this absorption. Look at the TCI plot and you can see that it faithfully reproduces solar activity plot.
So does that mean that our weather, down in the troposphere, is similarly correlated to solar activity? Not at all. In fact, in the troposphere, there is really no compelling evidence of global temperature correlation to solar activity, as you see in the thermosphere. There are a lot of hypotheses, hand-waving and cherry-picking, but (so far) no convincing evidence of any consistent 11-year periodic signal found in the global temperature record.
No observable connection between ‘space weather’ in the thermosphere to ‘terrestrial weather’ in the troposphere has been found. (Not counting stratospheric intrusions into the polar vortices, that is a different color of horse).
Not my idea to name it as it’s named, but look at the left side of the plot indicating from coldto hot, and there you have your “climate” 😀 It’s only a name, not more
Btw the ISS and other vehicles have their problems with the cold and shrinked thermosphere.
From the linked text.
Sorry, I was not blaming you for the confusion caused by space science, which has appropriated meteorological terms to describe “space weather”: wind, precipitation, convection, storm etc
https://en.wikipedia.org/wiki/Space_weather
https://en.wikipedia.org/wiki/Solar_wind
https://en.wikipedia.org/wiki/Electron_precipitation
https://en.wikipedia.org/wiki/Magnetospheric_electric_convection_field
https://en.wikipedia.org/wiki/Geo_storm
How “hot” is a single collision-less molecule moving in the thermosphere? The temperature T depends on the kinetic velocity, which depends on the reference frame. Is it T=0 if you are moving with the molecule?
It is like asking: how “wet” is a single molecule of water?
:-]
Sorry, I was not blaming you for the confusion caused by space science, which has appropriated meteorological terms to describe “space weather”: wind, precipitation, convection, storm etc
https://en.wikipedia.org/wiki/Space_weather
https://en.wikipedia.org/wiki/Solar_wind
https://en.wikipedia.org/wiki/Electron_precipitation
https://en.wikipedia.org/wiki/Magnetospheric_electric_convection_field
https://en.wikipedia.org/wiki/Geo_storm
How “hot” is a single collision-less molecule moving in the thermosphere? The temperature T depends on the kinetic energy velocity, which depends on the reference frame. So would it be T=0 if you are moving with the molecule?
It is like asking: how “wet” is one molecule of water?
:-]
Did you ever read Lockwood ? Or Joanna D. Haigh ?
Yes, but do not recall any convincing findings they have made that show climate temperatures to be highly correlated with solar activity.
Obviously there must be a tiny solar forcing, due to the 0.1% increase in TSI at solar max. That is 2 watts out of the 1362 watts per m^2 at TOA. But that kind of increase in temperature would be too small to reliably measure against the “noise of nature”.
Above and beyond the “noise of nature”, there are natural cycles of great significance.
Before worrying about the 0.1% increase* in TSI between solar minimum and solar maximum, one should first address the 6.9% annual variation (from 1.412 kW/m² in early January to 1.321 kW/m² in early July) in solar irradiance at the top of the atmosphere due to the Earth’s varying distance from the Sun (Earth’s orbital eccentricity). That’s a variation of 91 watts per m^2.
January is the middle of winter for Earth’s northern hemisphere whereas early July is the middle of winter for Earth’s southern hemisphere. So, to first-order this variation in energy input (seasonal tilt + TSI, both integrated over time)** explains why the NH is on average 1.9 C (3.5 °F) warmer than the SH, at least for an interval of time over which the Milankovitch cycles can be considered to be relatively unchanging (i.e., many thousands of years in the past, and many thousands of years into the future).
Currently (per http://profhorn.aos.wisc.edu/wxwise/AckermanKnox/chap14/climate_spatial_scales.html ):
Winter
NH 8.1 C (46.6 °F)
SH 9.7 C (49.5 °F)
Summer
NH 22.4 C (72.3 °F)
SH 17.0 C (62.6 °F)
Yearly Average Temperature
NH 15.2 C (59.4 °F)
SH 13.3 C (55.9 °F)
Worst case, if we simply ratio the 2 watts attributed to active-vs-quiet Sun conditions to the 91 watts due to perihelion-vs-aphelion conditions and apply that ratio across the above winter, summer and average NH-vs-SH temperature differences, we conclude the active-vs-quiet Sun conditions would perhaps cause changes of 0.06 F, 0.21 F and 0.08 F, respectively.
Bottom line: I concur that these inferred temperature changes are too small to measure reliably.
*A June 2020 paper cast doubt that the commonly asserted 0.1% increase in TOA TSI active/quiet Sun can be this high; see “Placing limits on long-term variations in quiet-Sun irradiance and their contribution to total solar irradiance and solar radiative forcing of climate” at https://royalsocietypublishing.org/doi/10.1098/rspa.2020.0077
**It is recognized that the effect of energy input on developed temperatures is moderated by the thermal inertia of the “system” under consideration: the NH is 39% land and 61% ocean whereas the SH is 19% land and 81% ocean. This largely explains why the SH winter average temperature is actually warmer than the NH winter average temperature.
Gordon,
Thanks for the additional information on natural cycles and the link to the Lockwood paper on TSI:
“A June 2020 paper cast doubt that the commonly asserted 0.1% increase in TOA TSI active/quiet Sun can be this high”
https://royalsocietypublishing.org/doi/10.1098/rspa.2020.0077
This is a comprehensive TSI survey paper, authored by Mike Lockwood and Wm. Ball, which investigates several methods of reconstructing historical TSI from regression data and internal parameter models. Twenty-six pages, but well worth reading if you want to understand more about the “quiet Sun” irradiance (“Q”) and its multi-faceted influence on TSI since the Maunder Minimum.
I think the paper shows that Lockwood is somewhat skeptical of a large climate influence due to variations in solar irradiance:
Gordon A. Dressler July 10, 2020 at 10:02 am
Thanks, Gordon. There’s one missing part of your interesting analysis.
When the Earth is nearer the sun, it gets more radiation, and because it is moving faster, it spends less time nearer the sun.
When the Earth is further from the sun, it gets less radiation, and because it is moving more slowly it spends more time further from the sun.
And here’s the beauty part—the two phenomena cancel each other out exactly. This is because both total irradiance and planetary speed are “inverse square” functions.
Net result? Less energy times more days is exactly equal to more energy times less days. So over the course of the year, the total power delivered to each hemisphere is exactly the same.
Best regards, and I do like someone who runs the numbers for himself … no other way to the answer.
w.
Willis, thanks for your comments and compliment.
Actually, I was aware of Kepler’s second law: a radius vector joining any planet to the Sun sweeps out equal areas in equal lengths of time . . . which directly means that planets travel slower at aphelion than they do a perihelion. This is the reason that I put in the parenthetical statement “(seasonal tilt + TSI, both integrated over time)”.
I believe that I read somewhere a long time ago that some scientist(s) actually did the integration for TSI over the (365.25/2) days the Earth is farthest from the Sun and compared it to the TSI integral over the other (365.25/2) day the Earth is closest to the Sun and showed that the two did not balance each other.
I can’t remember the exact reason(s) for this . . . and darn if I can find that reference right now by Web search . . . but I believe it relates to received solar radiation being proportional to 1/r^2 whereas, by Kepler’s third law, Earth’s instantaneous orbital velocity is not proportional to 1/r^2 but instead to SQRT((2/r)-(1/a)), where “a” is the semi-major axis of Earth’s elliptical orbit around the Sun.
I will post the reference specifying the associated calculations if I can locate it.
BTW, thanks 10^6 for your above article thoroughly debunking the two stated claims from the Tweetosphere. Well done!
The size of a comet’s tail varies with time because from the perspective of the comet the solid angle of the sun changes during the course of its orbit. The sun is not a point source.
Haven’t yet found that reference I discussed, but I did set up my own spreadsheet for doing the integration of TSI over time for Earth’s elliptical orbit (eccentricity = 0.0167086). I find that for the (365.25/2) days the Earth is nearest the Sun, the total accumulated solar energy incident at TOA is 3.4% larger than the (365.25/2) days the Earth is furthest from the Sun.
This percentage is about half the perihelion versus aphelion difference of 6.9%, and says to me that the impact of Kepler’s second law (Earth moving slower at aphelion compared to perihelion) is not a significant factor compared to just the 1/r^2 scaling of radiation.
Earth orbital velocity at aphelion (r = 1.0167 AU) is 29.295 km/sec versus orbital velocity at perihelion (r = 0.9833 AU) of 30.290 km/sec. So, orbital velocity definitely does not follow a 1/r^2 dependence law.
@Willis
“When the Earth is nearer the sun, it gets more radiation, and because it is moving faster, it spends less time nearer the sun.
When the Earth is further from the sun, it gets less radiation, and because it is moving more slowly it spends more time further from the sun.”
I think you are forgetting that the Earth’s temperature is based on an equilibrium balance of radiation received vs. radiation re-emitted. So the length of time in orbit tends to have little effect. And it is this equilibrium temperature which is the basis for climate temperature (plus or minus albedo, GHE etc)
For example, Mars receives roughly half (590W/m^2) the irradiance that Earth does (~1000W/m^2), but spends roughly twice as much time in orbit around the Sun as Earth (687 vs 365 days). But Mars is much colder (210K vs 288K).
The equilibrium temperature T of a planet at distance D from the Sun is (in theory)
T = (L(1-a) / (16πσD^2))^1/4
where
L = Solar luminosity = 3.846*10^26 W/(m^2* K^4)
σ = the Stefan-Boltzman constant = 5.6704 * 10^-8 W
So the amount of time exposure does not really enter into the equation.
On July 11 at 2:41 am, Johanus posted: “I think you are forgetting that the Earth’s temperature is based on an equilibrium balance of radiation received vs. radiation re-emitted.”
Sorry, but that is just not correct.
First, the Earth has a large amount of thermal inertia, so this basically means that it is never in equilibrium as it orbits the Sun and receives varying amounts of TSI.
Second, the absorptive and radiative properties of Earth’s atmosphere are neither symmetric nor constant. This is partly due the spectral absorption and radiation properties varying between the UV/visible portions of the solar spectrum (0.3 to 3 micron range for incoming solar radiation, a portion of which reaches Earth’s surface) and the middle- and far-infrared portions of the EM spectrum that Earth radiates in (4 to 70 micron range for average land/sea/atmosphere temperatures in the range of 210-310 K, a portion of which actually reaches space). The other significant factors here are that Earth’s albedo continuously changes with ground snow/ice cover and with percent of cloud coverage, while at the same time the ability of Earth’s lands and oceans to radiate/convect energy through/to the atmosphere and thence to deep space varies significantly due to Earth’s atmosphere having continuously varying water vapor content, continuously varying convection conditions, and continuously varying cloud coverage.
Lastly, but perhaps most importantly, the Earth has water—wonderful water—that decouples energy input and output from sensible temperature by two very important physical mechanisms: (a) the enthalpy of vaporization/condensation of water, and (b) the enthalpy of freezing/thawing of water. These enthalpies are also know as “latent heats” (associated with phase changes) and are significantly large energy sinks/source that act at constant temperature for a given pressure . . . fortunately for us, both occur within the normal range of environmental temperatures on Earth.
Take a look at the comparison of winter, summer and yearly average temperature differences between the northern and southern hemispheres of Earth, which I provided in an earlier post . . . it shows that there is no temperature equilibrium achieved between hemispheres nor during orbital travel.
Good comment.
“the Earth has a large amount of thermal inertia, so this basically means that it is never in equilibrium as it orbits the Sun and receives varying amounts of TSI. ….”
Gordon,
Sorry if I confused the issue by bringing up equilibrium (though, on a planetary scale, the energy budget is close to equilibrium).
I interpreted Willis’ comment to mean that the annual 7% ‘wobble’ in TSI is somehow canceled by Kepler’s law of ellipses because of the dwell times.
I was just pointing out that the equilibrium temperature is just a function of distance, luminosity and albedo.
If there is space weather, why not space climate?
The term “climate” has been used metaphorically for centuries. No problem with that. Poetic license.
But metaphors are not literally true. The “cooling down” of the thermosphere is being interpreted as a precursor for cooling down of the entire terrestrial climate. But they are completely different phenomena and do not link together in a common “climate”.
I’m not sure that the temperature of startosphere, mesosphere, ionosphere and thermosphere don’t affect the troposphere. I don’t know, but the hypothesis at least seems plausible.
If nothing else, the expansion and contraction of the atmosphere during the solar cycle could reasonably be expected to have climatic effects, via processes such as air pressure.
https://eos.org/research-spotlights/the-thermosphere-responds-to-a-weaker-than-normal-solar-cycle#:~:text=The%20thermosphere%2C%20one%20of%20the,to%20variation%20in%20solar%20activity.&text=As%20the%20Sun%20approaches%20solar,ray%20and%20ultraviolet%20radiation%20decreases.
“But metaphors are not literally true.”
no man is an island
“no man is an island”
You apparently have never seen a fat guy on an inner tube in a pool.
@Mosh
“no man is an island”
John Donne’s aphorism is an “anti-metaphor” which says, in effect, “the metaphor that ‘a man is an island’ is not literally true”. Which is entirely consistent with what I said.
Actually, according to the Oxford Dictionary, the requirement for a metaphor to be not literally true is part of its definition:
met·a·phor
/ˈmedəˌfôr,ˈmedəˌfər/
noun
a figure of speech in which a word or phrase is applied to an object or action to which it is not literally applicable.
Conclusions? The claims that decreasing solar activity
. will bring tropospheric cooling, and that
. the cooling will “wring” a significant amount of water out of the troposphere,
both fail to find any observational or theoretical support in the tropospheric temperature and TPW datasets considered above.
However the referenced post does not mention troposphere it mentions atmosphere —
and is quite correct in saying that the atmosphere has shrunk recently!
Tom, yes, it mentions “atmosphere”. However, he said it in the context of the cooling creating more rain, and since 100% of the rain comes from the troposphere, that has to be the part of the atmosphere he is discussing.
w.
And yet other research finds correlations …
Influence of solar activity changes on European rainfall … from https://www.sciencedirect.com/science/article/abs/pii/S1364682618305273?via%3Dihub
and
Solar forcing over the last 1500 years and Australian tropical cyclone activity from
https://agupubs.onlinelibrary.wiley.com/doi/full/10.1002/2016GL068012
Thanks, Tom. The problem is that most papers in the field have horrendous statistical problems. For example, in your first example they look for a correlation between sunspots and rain in 39 countries in each of 12 months.
Now, think about it. Suppose we flip a group of three coins. The odds of finding three heads are 1/2 * 1/2 * 1/2 =.125.
But suppose we take the group of three coins and flip them ten times. Our odds of finding 3 heads go way up … toss enough groups and you’re bound to find three heads.
Same thing here. They are looking for a correlation in no less than 39 * 12 = 468 different places. There is something called the “Bonferroni Correction” designed to take that into account. What it says is that if you are looking for a p-value of 0.05, to be significant when looking in some number N of multiple places, you need to find a response that is significant at your desired p-value divided by N … which in this case is 0.05 / 468 = 0.0001.
Perhaps you can find something in their study with that small a p-value … I couldn’t. Smallest p-value they list is 0.001, out by an order of magnitude.
The study says, “The 11 year solar cycle influences rainfall in parts of Europe in certain months.” Since that is totally expected somewhere in the 468 combinations of locations and months investigated, color me once again frustrated by bad math.
As to your attempt to dump twenty papers on me, thanks but I’ll pass. If you wish for me to consider them, pick the one that you think is the best and send me the link. The problem is that there are literally hundreds of papers on solar that are total carp, like the first one you listed above where they never heard of Bonferroni. My life is nowhere near long enough to root through all the manure looking for a diamond that may not even exist.
If you think solar influences climate, please let me know the paper that you think best demonstrates that and has the most solid science underpinning it. I’ll be happy to see if they’re any better than the average.
Regards, stay well,
w.
“If you think solar influences climate, please let me know the paper that you think best demonstrates that and has the most solid science underpinning it. I’ll be happy to see if they’re any better than the average.”
No Willis Eschenbach, that is the same logic as the tobacco industry response to the charge that smoking causes cancer.
I have already gave you more than enough. You wish to not see it, and so you don’t.
Tom,
In other words you couldn’t refute the criticisms Willis pointed out in just the first article. Instead of admitting the study has problems you just use the argumentative fallacy of Argument by Dismissal – just reject Willis’ assertions out of hand.
When you can shoot holes in Willis’ post, perhaps someone will listen to you.
Tim Gorman,
I do not say any such thing! Willis may or maybe not correct but I consider his ‘proof’ to be lacking. And his query seems very much just the same at the tobacco industry response re: smoking and cancer.
Things to note —
1. Climate is NOT global, it is local and regional.
2. As the atmosphere cools and shrinks, the jet stream begins to wander more.
From https://wattsupwiththat.com/2018/09/28/essay-solar-cycle-wave-frequency-linked-to-jet-stream-changes/
Now this may be viewed as just weather effects but if it were to continue through a few solar cycle then it will impact with climate effect. We’ll know better when the next solar cycle has completed. Theory yes but IMO it’s as good as Willis’s ideas.
P.S. I’m not such an egotist that I’m bothered about people listening to me or not. I’ll state my case as I see it and you can take it or leave it. Some time in the future, real science will, hopefully, show better insight than we can see now. Till then it’s all just opinion, some basic math (based on assumed measurement and conditions) and little else.
I agree with Willis and Tim. I find the solar cycle/climate link really interesting but Willis has done a great job showing the lack of correlation with current data. Doesn’t prove it doesn’t exist but then if it does we should see some evidence. As a Physician I can confirm there is tons of published literature in medicine that fails the multiple comparisons (Bronferroni) test. As a result people come to believe many things that just ain’t so because of accidental finding of correlation. This is an important standard that must be met before concluding the finding of a correlation is anything other than luck.
tom0mason July 9, 2020 at 12:27 pm
Say what? I ask you to choose what you think is the paper with the solidest support for your claims, and you fatuously accuse me of using tobacco industry tactics? Get real!
Dude, you’re losing it completely. I’ve simply asked you for your best evidence that what you claim is true. Easy enough to do. So you can either give us a link to what you say is solid science that backs up your claims, or you can run for the door … and frankly, Scarlett, I don’t give a damn which one you do.
On what planet is asking someone for the best evidence to support their claims a “tobacco industry response”? That makes zero sense.
w.
Willis, I admire your restraint in dealing with some respondents here. I don’t think I could muster the grace you do. And I agree with you about time wastage. It is bad enough someone should waste my money – that is replaceable. But to waste my time is unforgivable.
@tom0mason
“As the atmosphere cools and shrinks, the jet stream begins to wander more.”
But only the outer layers (thermosphere/exosphere) are shrinking, due to diminished solar EUV/x-ray production, which is all absorbed by these outer layers.
The troposphere is not shrinking. If it was shrinking (or expanding) in any significant way it the definition of “standard atmosphere” would have to be revised, as it is critical to aviation and meteorology.
https://en.wikipedia.org/wiki/International_Standard_Atmosphere
IIRC the last big change was in 1963 to correct the upper atmosphere (90-700km)
https://agupubs.onlinelibrary.wiley.com/doi/abs/10.1029/RG001i001p00057
“Virtually all atmospheric water is in the troposphere…”
As usual, complex phenomena can’t be reduced to simple or simple-minded explanations.
That’s certainly true when complexity is used to make something appear far more complex than it really is. For example, the climate sensitivity whose steady state average can only be the derivative of the Stefan-Boltzmann Law. Anything else requires energy to be created out of thin air, literally.
‘
Indeed as this paper spell out …
Possible association between Indian monsoon rainfall and solar activity
S. Bhattacharyya R. Narasimha
https://doi.org/10.1029/2004GL021044
And note the line “Nevertheless we may note that the regional variations revealed by the present analysis are not inconsistent with the simulations of Haigh et al. [2005], which suggest that a major effect of higher solar activity may be a displacement in the Hadley cell. “
So is it so improbable that solar variation effect on the climate happen globally as Willis appears to try and advance?
IMO solar variation is an obvious big player in how our climate varies. If simplistic statistical methods can not show is it because is it does not exist, or is it a feature of the over simplistic method not being able to show it?
The solar cycle influences tropospheric rainfall patterns, with increased solar activity favoring precipitation north of the equator (for example, the South Asian monsoon) and decreased precipitation both near the equator and at northern mid-latitudes. The impact of the solar cycle on precipitation arises from two different mechanisms: 1) UV changes and 2) total solar irradiance.
The increase of incident solar UV during solar maximum conditions leads to increased generation of stratospheric ozone in the mid-to-upper stratosphere, which ultimately results in greater ozone in the tropical lower stratosphere. This helps warm that region via both short- and long-wave absorption. In response to this more stable vertical profile for tropical tropospheric processes, tropical convection preferentially shifts off the equator, favoring monsoonal effects during Northern Hemisphere summer and on the annual average.
In addition, the solar-plus-ozone change leads to increased tropical stratospheric warming in the mid-to-upper stratosphere during solar maximum conditions. Higher latitudes during Southern Hemisphere winter receive no such augmentation, and the increased latitudinal temperature gradient results in stronger stratospheric west winds. Via the interaction of these wind changes and planetary waves propagating up from the troposphere, the circulation in the stratosphere weakens, a response characterized by greater relative upwelling in the Southern Hemisphere extratropics, and more downwelling in the northern extratropics. This downwelling has a tendency to extend into the troposphere, limiting convection and rainfall during Northern Hemisphere summer at these latitudes, producing drier conditions. This effect is seen in some paleoclimate records and has been attributed to solar influence.
Total solar irradiance changes, though of small magnitude, do appear to affect sea surface temperatures (SSTs), most obviously at latitudes where cloud cover is small and irradiance is abundant, such as the Northern Hemisphere subtropics during summer. The increased SSTs then help intensify circulations spiraling away from the subtropics, again favoring reduced rainfall near the equator and to the south, as well as northern mid-latitudes. Hence, both the UV and TSI forcings produce similar effects, with the latter helping to sharpen the response.
(Edited from link below.)
NASA/GISS modeling “experiments” checked by observations:
https://www.giss.nasa.gov/research/briefs/rind_03/#:~:text=Our%20experiments%20show%20that%20the,equator%20and%20at%20northern%20mid%2D
I still favor disbanding GISS and handing whatever of value its staff might do over to NOAA. Strictly space studies, as opposed to climate can be handled by other NASS organs.
“All models are wrong, but some are useful.”
Results of your many investigations of a variety of “dramatic” climate change propositions seems to be a subset of a main proposition that nothing much is going to happen to worry us in so far as climate is concerned. In this context, do you see any gaps in areas of study of climate that you think might hide something to concern ourselves about?
Gary, the climate has been incredibly stable for the last 8,000 years or so. I see no reason for that to change. The main danger I can see is falling back into another ice age … which hardly anyone is studying.
w.
Right. Seems to be no money in it so far. Wait till someone finds a way to earn cash off protecting us from ice ages – it will be all the rage again like in the 70’s. In fact I am thinking of going into a new business. I should be able to get some of those clever environmentalists on board. We’ll sell reams of solar panels to pave the Arctic and Antarctic with green renewable energy machines that also absorb heat to prevent our decline into the more usual icy conditions of this period of Earth’s history. Might have to rewrite some of the green dogma but no problem: “Save seals from the polar bear population explosion”.
“The main danger I can see is falling back into another ice age … which hardly anyone is studying”
Recording snowfall weather events is a great sport.
I recommend https://www.iceagenow.info/
Ok, pedant alert. We are in an Ice Age. You mean a return to glaciation. I doubt we could do much so I’m buying new skis.
If cooling has no effect on moisture, where is the 3x water feedback on warming?
One example proving something false outweighs all examples proving something true.
ferdberple July 9, 2020 at 10:45 am
Ferd, please quote where I or anyone said that “cooling has no effect on moisture”.
I ask people to QUOTE THE EXACT WORDS YOU ARE DISCUSSING for a reason.
Today, you are that reason.
w.
when the sun goes to sleep for good we all die.
nuff said.
“…when the Sun gets sleepy.” “Rain is wrung out of it like a sponge.”
Yup, science!
@Willis:
What causes the Lissajous patterns in Figure 3?
“What causes the Lissajous patterns in Figure 3?”
It’s likely hysteresis in the seasonal response of the measured cells. If you look at data from single cells, or collections of cells at a constant latitude, Lissajous like patterns are quite evident as they traverse a seasonal path around the mean. This kind of seasonal behavior with hysteresis can be seen in the relationships between many climate related variables.
More interesting to note is the asymptotic rise to nearly infinite precipitable water above 30C. It’s at this point where the latent heat of evaporation matches the incoming solar energy, essentially clamping ocean temperatures to less than 30C (85F), around where Hurricanes form to remove excess energy.
Thanks for the explanation. I have seen several charts like that on WUWT and even saw a cloud formation (Years before I had a cell phone to take a picture) with a sort of swirly, serpentine, Coriolis like effect, three dimensional formation. I am convinced there is some kind of interconnection, like quantum effect, creating these phenomenon.
I’ve seen this so much, I added a -l option to my scatter plotter which connects the dots together. In general, a round pattern means a 90 degree phase shift, or delay, between the 2 variables (1/4 of the period, where a period is generally a year). When they get squared off, it’s delay with hysteresis. Ellipses tend to be phase delays of less than 90 degrees. It’s definitly not a quantum effect and just an effect of delay.
A more interesting one is a scatter plot between emissions at TOA and the surface temperature. Monthly averages show the behavior of a gray body with an emisivity of 0.62 and the monthly variability forms ellipsoid’s centered along the T^4 relationship confirming a sensitivity of 0.3C per W/m^2 (~1C for doubling CO2) and given exactly as the derivative of the SB Law, 1/(4*0.62*o*T^3). where o is the SB constant and T is the average surface temperature of 288K.
Yes, the solar minimum squeezes moisture out of the atmosphere.
Ren,
I always enjoy your short comments, “from the stratosphere”, but this one has me puzzled. 😐
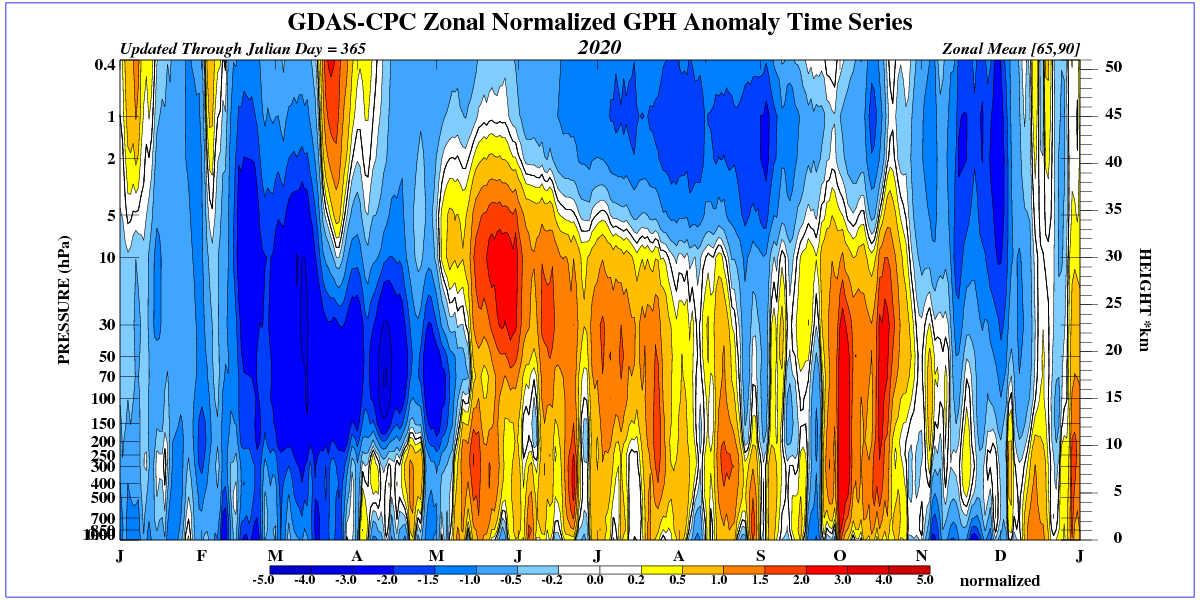
Your chart shows the NHemisphere normalized geopotential height (GH) anomaly for Jan-July 2020, for heights ranging from the surface to the top of the stratosphere (50km).
Meteorologists use GH to characterize the expected altitude of pressure surfaces in the atmosphere. For example, every meteorologist knows that the height of the 500mb layer averages around 5500 meters. But the atmospheric columns of air behave like a thermometer, expanding when they get warm and contracting when they get cold. The difference between the actual and average GH is called the ‘GH anomaly’.
So your chart is plotting the GH anomalies for 2020. And the GH anomaly seems to be behaving normally, contracting (blue) in the winter and expanding (yellow-red) in the summer. At least for the troposphere. Above 2mb (mid-stratosphere) the behavior is a bit puzzling because there is some expansion in the winter and some contraction in the summer.
My question is: why do you think this proves “the solar minimum squeezes moisture out of the atmosphere.”?
Especially since there is very little moisture in the stratosphere, less than 10 ppm. (OTOH, the average moisture in the biosphere is about 25,000 ppm)
This graphic shows ANOMALIES of the geopotential height above the polar circle. Anomalies are very pronounced. They indicate the meridional course of jet stream. This generates strong convection in the northern hemisphere. Strong ionization in the lower stratosphere by GCR during the solar minimum has a large share in this.
Water vapor is forced into the stratosphere over the polar circle.
It can be 95 deg F and a dew point of 80 and not rain here in beautiful North Carolina or 60 deg with a dew point of 55 and rain like a banshee. In fact, most days in the summer are hot and humid and not raining. What matters is the temperature profile from ground to sky if there isn’t much wind or if the wind is blowing off the warm Atlantic into a cold air mass.
You need a trigger to get the water out of the atmosphere. Just cooling it a bit can just raise the relative humidity, not make it rain. Getting cold air aloft over a warm humid air mass is the best way to dry it out, not lower the temperature of the total air mass a couple of degrees C.
There is another way to reach the same conclusion as Willis, using NASA satellite measured total solar irradiance data now covering four sunspot cycles, discussed at NASA.gov. First radiometers flew on Nimbus in 1978.
Sunspots are dark, so logically should reduce irradiance. Paradoxically, the opposite is true because of the adjacent faculae (bright spots) that more than offset the darkening with brightening. The observed variance over the cycle, however, is at most 1.3% for a few very sunspotty weeks/months during the cycle peak, and on average just 0.1% over the entire 11 year cycle.
Too infrequent and/or too small to have anything like the asserted effect Willis disproves yet again.
TSI doesn’t change much, but its spectral composition does. UV, important to climate, varies many fold over solar cycles. The Sun’s magnetosphere also shows substantial variability on decadal, centennial and millennial time scales.
Effect of UV variation, especially at higher latitudes, but also in India. Variation in UV is greater than the quoted 10% at higher energies, ie shorter wavelengths. At 121.6 nm, its a factor of two of more, depending upon cycle:
https://weather.com/en-IN/india/science/news/2019-01-12-what-are-solar-cycles-and-how-do-they-affect-us#:~:text=This%20periodic%20variation%E2%80%94which%20occurs,some%20bearing%20on%20India's%20weather.
Even though many overlooked the impacts of solar cycle on local weather in the past, recent studies have highlighted many connections. Globally, solar activities have much more profound impacts on Europe and North America thorough its impact on the polar vortex.
“One of the reasons that the solar cycle is underappreciated is because there is very little change in the visible radiative output from the sun during the cycle. However, if we look at the ultraviolet radiative output, we observe a nearly 10% change from maximum to minimum! And, since absorption of ultraviolet radiation by ozone generates the heat in the equatorial stratosphere, there is less heat generated during the solar minimum. This reduced heating at lower latitudes reduces the pole-to-equator temperature gradient and weakens the polar vortex”, explains Dr. Todd Crawford, Chief Meteorologist at The Weather Company.
The polar vortex is a whirling cone of low-pressure area near the poles which acts as a wall for cold Arctic winds. A weak polar vortex fails to hold the cold air near the poles, and allows it to spill out into parts of Canada, U.S., and Europe causing events like 2018’s ‘Beast from the East’. Therefore, solar minima usually result in stark winters in these regions.
Even though the polar vortex does not have a direct impact on Indian weather, it influences the cold atmospheric circulations that sweep India during winters. India may experience warm and dry winters due to the approaching solar minima. It has happened before. During 2009, India experienced a warm and dry winter with average winter temperatures up to 1.4°C higher than normal at some places due to the combined effects of El Niño and the solar minimum.
Scientists across the globe are still trying to unravel the missing aspects of the multifaceted relationship between solar cycle and local weather patterns. “We are yet to understand the overall local weather impacts of solar cycle for countries like India. Further research is needed to address this question,” says Dr Nandi.
While we wait for more research in this field, a good way to start is by appreciating the ways in which our modern-day lifestyle continues to depend on the Sun.
https://lasp.colorado.edu/home/wp-content/uploads/2011/07/Woods-Solar-UV-Variability.pdf
Variability factor of 1.5 to 7 times for wavelengths of 65 to 1.0 nm. Below 10 nm is considered X-rays.
Obviously, that’s a small portion of total solar energy, but that extreme UV and the rest of the spectrum under 400 nm have climatic effects beyond just their heating ability, since they can make and break ozone molecules, among other high-energy, ionizing effects.
“The atmosphere cools and shrinks when the Sun gets sleepy. Rain is wrung out of it like a sponge.”
Water vapor is a GHG. Reduce that by 10%. Less GHGs. I think it’s a question of semantics. They claim more water vapor with warming. The opposite would be less water vapor.
It’s not rain. It’s water vapor. The atmosphere dries. Which I think is true. As the South Pole is dry when trying to find water vapor.
I agree that sunspots are a no go.
Must tell you some great news about South Africa. We are not only already carbon neutral, it seems we are now carbon NEGATIVE.
LOL
https://breadonthewater.co.za/2020/07/07/brrr-it-is-getting-colder/
Minima, maxima and means here (where I live) have dropped by about 2 degrees C in May and June. There are two other cold fronts coming up, so I think July is going to be colder still.
So, as I predicted some time ago, you guys in the USA are all set for the big drought time coming up….soon.
Click on my name to read my final report about that.
Willis
We agree!
Must tell you some great news about South Africa. We are not only already carbon neutral, it seems we are now carbon NEGATIVE.
LOL
https://breadonthewater.co.za/2020/07/07/brrr-it-is-getting-colder/
Minima, maxima and means here (where I live) have dropped by about 2 degrees C in May and June. There are two other cold fronts coming up, so I think July is going to be colder still.
So, as I predicted some time ago, you guys in the USA are all set for the big drought time coming up….soon.
Click on my name to read my final report about that.
Henry,
When I graph the monthly heating degree-day values for the past 10 years for Potchefstroom it shows a slight trend downward, meaning the minimum temps are probably slightly higher over the past ten years.
A graph of the cooling degree-days for the same time period it shows a slight trend up, meaning maximum temperatures a probably slightly higher over the past ten years.
This doesn’t necessarily refute your research, the degree-days are an integral of the temperature curve. You can have more “warm” days in a month than a prior month with more “hot” days and fewer warm days and get a higher integral value (i.e. degree-day value).
To me, however, the cooling and heating degree-days are more indicative of the overall climate than any average.
@TimG
I live in Pretoria, so for the current reported drop of 2K in T (during our winter) I looked at a station nearby; I think it was Pretoria Irene.
I only looked at the weather station of Potchefstroom for rainfall, as it has records going back to 1927. I did not look at this weather station for temperatures.
Previously (in 2018), for temperature I randomly selected 10 weather stations with good daily data going back 40 years. I found Tmin dropped by 0.8K on average whilst Tmean stayed more or less the same.
In response to you and others here, IMHO it is not correct to look at the 11 year solar cycle. The full normal solar cycle is the one proposed by Hale & Nicholson. If you sort the results of precipitation into these cycles you get interesting patterns, like the one I made for Potchefstroom. The weather just works like the pendulum of a clock. I also did it recently for Willis, for Ireland, (as he had a post about it) but he does not believe me when I say that you only need 4 points to comprehensively define a function, if the correlation coefficient is high.
See link below.
https://documentcloud.adobe.com/link/review?uri=urn:aaid:scds:US:59a70b3a-8235-4be0-ac78-4169fc61c17f
I predict that in SA we are going to have some 5% less rain in the Hale cycle that is to come. I am not happy about that. In Ireland rainfall will also be dropping. I am sure they will be happy about that…
I think it is a nice method to predict rainfall?
Pretoria Irene only has degree-day data going back over eight years. When I graph the heating degree-day data it shows a definite downward trend, i.e. fewer cold days. However it shows that 2020 has been exceptionally cold reaching a peak so far of 400 heating degree-days last month. That matches only 7/2014 for HDD. It will be interesting to see what happens this month to see if it goes even higher. That would definitely have an impact on the trend line.
Whatever you do, don’t squeeze the Charmin.
It upsets Mr. Whipple to no end (dunno why).
Squeezing the Charmin messes up Mr. Whipple’s display.
There is historic correlation but none in the current era. This is the moment when all science should be looking at the sun – earth relationship. We may then find the definitive answer.
But I doubt it. The climate system is so terribly complex.
https://wattsupwiththat.com/2019/02/17/influence-of-solar-activity-on-european-rainfall/
Comments include studies of the Sun-Earth relationship in recent decades.
The correlation between rainfall and the solar cycle and other solar effects has been known for about a century.
Here’s a study from the Sahel, Africa, 1974:
https://www.nature.com/articles/251594a0
And a 1989 paper on the Indian monsoon:
https://link.springer.com/article/10.1007/BF00867947
Rainfall in Brazil, from 2002:
https://www.researchgate.net/publication/26489907_Rainfall_cycles_with_bidecadal_periods_in_the_Brazilian_region
Solar magnetic phases v. SOI in Eastern Oz, 2008:
https://onlinelibrary.wiley.com/doi/abs/10.1111/j.1745-5871.2008.00537.x
Among dozens if not hundreds of similar studies since at least the 1920s.
I get the impression that a few climate skeptic souls have latched on to this “grand solar minimum” concept and are touting it as evidence that global cooling is just around the corner, and it’s going to get so cold, so quickly that no amount of post-hoc “adjustment” or “homogenization” will be able to hide it, alarmists will hang their heads in shame, and that’s if they don’t all self-immolate in embarrassment.
Two things are wrong with this belief (to be generous, let’s call it a ” hypothesis”). One: there doesn’t seem to be any evidence that it’s getting cooler, even though we’re now well into this GSM cycle. That’s based on UAH LT temps, not on possibly corrupted surface temps. The other is, of course, that alarmists are incapable of feeling shame or embarrassment.
The GSM hypothesis is tied in with the Svensmark hypothesis (which is also an attractively simple idea, but one that doesn’t seem to be holding up very well), and it relies heavily on the fact that the Maunder and Dalton minima occurred during the coldest parts of the LIA. But we don’t have to be reminded that correlation does not prove the existence of a causal link. Do we?
Thanks to Willis for another piece of original research. Carried out without a supercomputer or a generous research grant, or 25 co-authors scattered around the world (but I dare say that those lavish monthly stipends from Exxon Mobil and Koch Industries help to ease the pain).
Here’s a thought. Sunspots are dark because they are cooler than the rest of the sun’s surface. If there were a lot of sunspots, would the earth not be receiving less radiant energy from the sun? Wouldn’t fewer sunspots provide more direct solar heat? Somebody prove me wrong, please.
Search sunspots cosmic rays clouds. The sunspots actually mean a little more total energy output….but low sunspots mean more cosmic rays in atmosphere and more clouds…..lower temps.
See my comment above for technical source. Paradoxically, more dark sunspots increase irradiance (but only a little) because of their associated faculae, which are brighter than normal. It is a (Very) slight positive net effect.
“Wouldn’t fewer sunspots provide more direct solar heat? Somebody prove me wrong, please.”
It seems Rud Istvan anticipated your question, by 30 minutes. Here is his answer:
https://wattsupwiththat.com/2020/07/09/squeezing-the-sponge/#comment-3031945
Insightful discussion, particularly the TPW bits. However I urge caution drawing conclusions from raw statistical correlations in Figure 1, particularly between factors operating at different scales, without considering physical possibilities. The relatively short period of observation recorded in UAH data plunked into monthly pairwise correlations may omit important differences of scale, persistence, or lag in different observed variables. I do not believe the analysis adequately supports your conclusion.
June 9, 2020:
 ?w=676
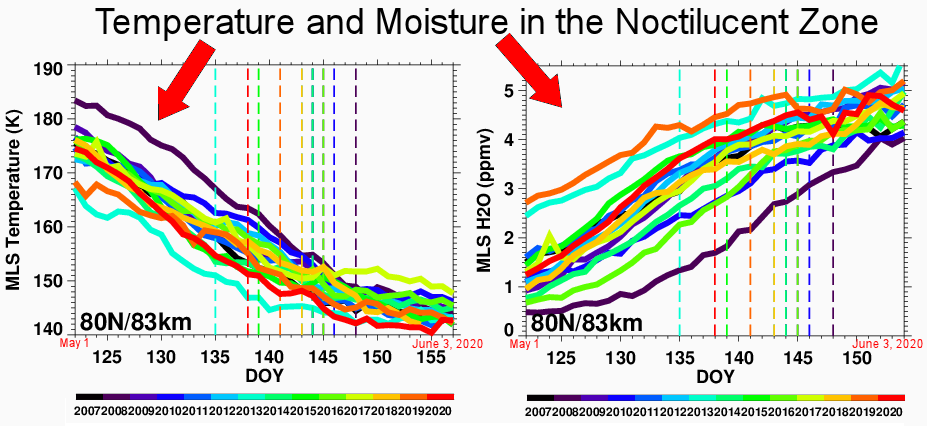
It’s getting cold in the mesosphere. Very cold. “At polar latitudes (60N-80N) temperatures have been breaking 14-year records in the last few days,” reports Lynn Harvey of the University of Colorado Laboratory for Atmospheric and Space Physics. This development is causing noctilucent clouds (NLCs) to spill out of the Arctic to middle latitudes.
https://spaceweatherarchive.com/2020/06/09/record-cold-in-the-mesosphere/
Ren
We can feel the cold here….
https://breadonthewater.co.za/2020/07/07/brrr-it-is-getting-colder/
And cold and wet here.
https://imgur.com/a/4S5OSgL
Willis,
I would think the relationships with precipitation and solar activity are quite complex and linked through equatorial wave activity in the troposphere, a wave activity seen as propagating Kelvin waves and then coupling to the MJO. The intensity of the Kelvin Waves, seen in OLR plots, would be coupled to periods of low solar activity is my thinking based on trying to digest a wide sample of reading on various areas around these topics.
Richard Lindzen and Joe Bastardi could help you through most of this from theoretical (RL) and an operational forecasting (JB) standpoints.
From a 2009 published review on Convectively Coupled equatorial Waves:
“Rain falling from cumulus clouds accounts for the majority of precipitation within the tropics. Without the benefit of spaceborne satellite views, to an observer on the ground, much of this rainfall may seem randomly distributed. In some locations, such as within the monsoon regions, precipitation can appear decidedly episodic, with relatively low frequency variability of around a month or so. In fact, the bulk of this tropical convective rainfall is known to be organized over a wide range of spatial and temporal scales, from mesoscale convective systems (MCSs) to planetary-scale features such as the Madden-Julian oscillation (MJO). At intermediate scales, rainfall is frequently organized by waves that move eastward or westward, either along the equator or within a few degrees of latitude parallel to it within the Intertropical Convergence Zone (ITCZ).”
…
source: https://agupubs.onlinelibrary.wiley.com/doi/pdf/10.1029/2008RG000266
It’s all quite complex stuff and immersed in a lot of mathematics. All the GCMs horribly fail to replicate these globally-encompassing wave behaviors in the troposphere and is the likely reason their predicted tropical mid-tropospheric hotspots are not observed in nature. The heat (mid-tropo warmth) is rapidly dispersed and moved around by these waves that are associated with deep convection in the tropics.
I live near where the “…global average rainfall is about 1 metre (39 inches) per year.” It would helpful if it was normal.
“It’s not so much a function of the amount that the atmosphere can hold at a given instant.”
Right, it’s amount heat in the ocean.
Someone said 1 C increase average temperature of ocean equal 1000 C degree of Atmosphere temperature. I have done that math, but it seems about right. But if want to do math it should be about degrees of C, but rather how water vapor in created. Or ocean warms air via water vapor. As said atmosphere has about 1″ of water, how many inches of water from 1 C of ocean temperature?
The ocean is not going to warm or cool 1 C within 1000 years, as it requires tens of thousands of year to warm or cool by 1 C. Though warm or cool by .01 C within 100 years. And probably warm by at least .01 C within last 200 years.
Of course global warming idea is all wrong.
Of course, we in an Ice Age and have been for millions of years, and probably continue {if nature has anything to do with it} for millions of years.
And “real” global temperature is the temperature of the entire ocean.
The ocean temperature is global temperature’s control knob, and that knob is currently at 3.5 C.
In terms of the global air temperature, the control knob is ocean surface temperature, and global average ocean surface temperature is currently about 17 C and average global land average is about 10 C and the average of the 70% + 30%
area is about 15 C.
What drive global temperature is the tropical ocean surface temperature, also called Earth’s heat engine, which average tropical ocean surface temperature is about 26 C.
The tropical ocean is NOT effected much by entire temperature of all the oceans which is currently about 3.5 C. It’s 60% of the rest of world’s ocean which effected as by control knob, the entire ocean temperature. The tropical ocean not effected because tropical ocean receives most the sunlight energy in the world. Or the 60% of rest of oceans do not receive as much as 1/2 of the sunlight.
Or commonly said tropics receive more 1/2 the sunlight. Everyone knows this and everyone knows we living in Ice Age.
And an Ice Age or also called Icehouse global climate. I like the term icebox climate in sense that icebox is another word for refrigerator. We certainly live in a refrigerated global climate. Anyways, as they say more 90% of ocean is 3 C or colder. And it currently also being claimed that “90% of “global warming” is warming the ocean. Or also everyone seems to think the temperature of entire ocean is important. At same time it appears everyone is dismissing what ocean temperature is, as not important. Denying ocean is cold, denying we in a Ice Age and therefore can talk about how hot the weather might become in the future.
Now will agree the Ice Age do tend to have hotter daytime temperatures. And will also note that Ice Age conditions, results in more deserts on Earth. And that deserts can have very hot temperatures in the daytime. And hottest daytime temperature ever recorded was in a desert {death valley California] just over 1 century ago, during a time of slightly lower global average temperature.
I regard that highest temperature as one of many proofs of “global warming” since that time. But main proof of “real” global warming is the slight increase in the entire ocean temperature.
But to issue of “The Sponge” theory. I think possible a warmer ocean could cause more snowfall at “right” times for glacial build up. And maybe also get more rainfall in the warmer deserts of the world. And generally think Solar Min somehow connected to reducing growing seasons, and having snow on ground reduces growing seasons. Or I think Solar Min is largely about weather, and not much to do with ocean temperature- but nothing short term is going effect the temperature of the ocean.
So after several decades of Solar Grand Minimum, perhaps there will be some evidence of it.
History shows that, on a broad scale, there is a positive correlation of terrestrial global temperatures and sunspots, at least over the long term (century scale). I believe to just say that this correlation is wrong is to be a bit shortsighted. If the correlation is recognized, perhaps it behooves us to try to ferret out whether the correlation is valid or not. Climate alarmists have said that CO2 and temperatures correlate, so CO2 must be the cause. But the only evidence for this is the output of climate models, and this is not evidence (GIGO). Additionally, history proves the theory false (past climates, CO2 lagging temperature increases). Why return to the sun, then, to explain climate warming/cooling? Because it is the source of our energy.
Willis Eschenbach previously frowned upon my (and others’) sunspot hypotheses, but I continue to wonder and “speculate” whether the sunspot effect on Earth’s temperatures is occurring over a more long-term period, not just (an average of ) 11 years. My theory involves groups of not only 3 sunspot cycles (3 x 11 = 33 years), but consecutive groups (2 x 33 = 66 years) to produce the 60-70 year cycle that is often seen in global temperatures. Relating to winter storminess in the northeast U.S., I also saw a 200 year cycle in temperature, meaning 6 groups of 3 cycles, or 18 individual cycles (198 years). I proposed that alternating polarity of sunspot cycles had some effect on Earth’s upper atmosphere. One group of 3 individual sunspot cycles would be dominated (2:1) by an odd polarity, which seems to correlate to a warmer 30-35 year period, and this is followed by the opposite situation (even polarity), which seems to correlate with cooler temperatures. The effect may not filter down to 11 years, but seems to be somewhat noticeable over 65-70 years. What’s obviously noticeable is the about-800 year cycle, which gives rise to the cyclic Warm Periods and (Little) Ice Ages that we know and love (but which some people haven’t seemed to love so much, such that they try to hide them). More speculation, but perhaps there needs to be some kind of threshold boundary for the smaller cycles (65-70 years and 200 years) to manifest into the longer-term 800-year cycle.
Summarizing, I propose that two cycles (~66 yr and ~200 yr) nest within the ~800 yr cycle, and both modulate it. It does not seem apparent to me that we are entering any Grand Solar Minimum; the last sunspot cycle was a bit lower than previous, but not spectacularly so. We should be looking at the overall pattern of global temperatures, which shows that we are still recovering from, and ascending out of, the trough of the LIA. When will our Modern (and naturally-forced) Warm Period peak? To me, if the cycle holds, the peak would be about 2100 to 2150. We would continue to see modulation through then, but temperatures will be comparable if not slightly warmer than currently. After 2100-2150, I would expect a descent of global temperatures into the next LIA (NLIA?), from 2200-2600, troughing about 2400-2500. In any case, I believe that solar cycles and their possible effects on our atmosphere need to be more fully investigated, as their correlation to our temperatures seems a lot more reasonable than the CO2 hypothesis, which is based on faulty inputs and concomitant faulty modeling.
Does your theory correlate to the Wolf Gliessberg Cycle? Think it’s about 80 years isn’t it?
Dan
pompeydano, I’m really not sure that my hypothesis correlates with the Gleissberg Cycle, it doesn’t seem to at first blush. A lot of people don’t see any validity to Landscheit’s theories / Gleissberg cycle, but, intuitively to me, there might be something to them to the extent that they deserve more investigation.
Willis does not believe in the GB cycle
even though the evidence is overwhelming (click on my name0
Henry Pool July 10, 2020 at 8:58 am
It’s not a question of my belief. The problem is that I can’t find evidence for the Gleissberg Cycle. Well, that’s not exactly accurate. I did find this:
I’ve also seen claims that the GB cycle is 102 and 107 years.
Now, think about this. We have a purported cycle, and the people studying it the hardest cannot decide if the length of the cycle is 55, 58, 65, 78.8, 87, 95, 102, or 107 years long … seriously?
This is supposed to be science? This is supposed to be a real phenomenon.
In any case, my prior posts on this matter are The Tip Of The Gleissberg and The Effect Of Gleissbergs “Secular Smoothing”.
Let me suggest that people who are interested in an actual investigation looking for the claimed “Gleissberg Cycle” read those first …
w.
AMO cycle is by around 60 years if I rember well.
Krishna Gans, yes, there has been much research in the literature over the past few decades that oceanic cycles have a strong effect on our lower atmosphere. Perhaps my speculation of a 60-70 year sunspot “cycle” has no validity, and, even if it does, has no correlation at all with oceanic cycles, but it might be worth at least noting if not worthy of further investigation. What drives our ocean cycles, just internal oscillations, as some have suggested, or is there a possible solar connection? Is it possible that UV variations in the upper atmosphere cascade to the lower atmosphere (from van Loon, IIRC) and then to the oceans, via wind/pressure/pattern shifts, which then feed back to the lower atmosphere, possibly with some lag? I’m just throwing that out there. Maybe it should just be thrown out!
4caster July 10, 2020 at 8:47 am
READ THE DAMN POSTS I LINKED ABOVE, 4CASTER! I’ve looked extensively at this very question. If you find problems with my work let me know. In particular:
Sunspots And Sea Level
The New Sunspot Data And Satellite Sea Levels
The Missing 11-Year Signal
Chinese Sunspots
If you’ll read those you’ll have a good start in the question of the sunspots and their curious statistics …
My very best to all,
w.
w.
Willis Eschenbach, I’ve read much material related to sunspots as well as ocean cycles in the past couple of decades in the pertinent literature as well as “online,” so I have more than a “start” regarding the subject of sunspots, formation, cyclicity, and supposed effects. I, too, have found most of the material wanting in scientific validity. Perhaps you disagree, but I tend to think we all need more information regarding the sun, solar processes, and effects on our atmosphere. Just because we haven’t (yet?) found direct fingerprints doesn’t mean they don’t exist, and we would be shortsighted to reject this possible mechanism of effect on Earth’s atmosphere without more fully investigating it. This ought to contrast with the wasted resources already spent, and apparently to be spent, on GHG causes. The history of scientific discoveries is littered with examples where (often serendipitous) observations of effects are correlated to causes, then borne out by fully-fleshed scientific research. To me, the GHG theory has been invalidated and falsified by observation; I do not believe one can say the same for sunspots and terrestrial climate, just because the possible scientific underlying principles or mechanisms have not yet been found. I do not purport to have found them, just that there seems to be a correlation of temperature cycles with sunspot cycles over longer time periods (e.g. several decades).
My question regarding oceanic cycles was more of a rhetorical one. GFDL and WHOI researchers don’t seem to me to have many good answers on oceancic cycles, but at least a few at GFDL (at least previously) believed that internal oscillations were responsible for ocean cycles, including ENSO, although I’ve not had personal communication with any recently. Thanks for your comment.
Thanks, 4caster. You say “just that there seems to be a correlation of temperature cycles with sunspot cycles over longer time periods (e.g. several decades).”
Sorry but that’s just handwaving. I’ve looked for said correlation in lots of places, including in this very post … no joy to date. Doesn’t mean it doesn’t exist, just that I haven’t been able to locate any modern surface dataset (temperature, sea level, cloudiness, lake and river levels, precipitation, etc.) with a significant correlation to sunspots.
w.
Krishna Gans
Look this. https://theearthintime.com/
TSI variability has two components, sunspots darkness and sounding faculae which for most of the time almost neutralise each other’s effect, hence the ~11 year cycle sunspot cycle levees very little of an imprint in the global temperature.
However, looking at the fundamental property of solar activity, i.e. its magnetic cycle with periodicity of ~22 years, strong correlation in the global and hemispheric temperatures is easily demonstrated as shown here
http://www.vukcevic.co.uk/TempSpec.htm
Exactly
Impressive. I did not know that temperatures had a strong 21.5 year periodicity. But periodicity is not the same thing as correlation. Please label your vertical axis.
Hi CG
My Aborigine distant relative from Echuca had no idea how to interpret aerodynamic equations governing his boomerang’s flight, but he knew it works. Same here
http://www.vukcevic.co.uk/GMF-CT4.gif
http://www.vukcevic.co.uk/Echuca.htm
Vuk, can I say how much I hate it when you successfully send me on a snipe hunt? Usually I just ignore your stuff, but this time, like a fool I went and looked at your graph.
Guess what I find?
http://www.vukcevic.co.uk/TempSpec.htm
No data source. No indication of what kind of “temperature” is being measured. No units on the vertical axis. No indication as to what kind of analysis you’ve used to create your “spectrogram”. Perfectly formatted for the Journal of Irreproduceable Results!
Pass. This is exactly why I generally ignore your posts, and why I should have ignored this one.
w.
Oh, yeah, Vuk, did I mention that the alignment of four separate areas in real analyses of this type NEVER line up as neatly as that. The very perfection of the results waves all kinds of red flags for me.
w.
OK, I like this post and the analysis. It essentially sets a “maximum” on the possible effect – it doesn’t pretend to predict the actual effect which might be extremely complex. By arguing in a simple way what the maximum boundary is, we can therefore ignore the complexity as it doesn’t matter.
I keep trying to argue using the same type of logic for a maximum effect on temperature of CO2 doubling in the atmosphere, and I keep coming up with a figure around 0.9 C. Note that is my maximum, not the actual or expected which is likely much lower. I base this on temperature data and some assumptions – such as I allow for heat island effect and temperature data tampering before coming up with my number. If I am even close, then we can ignore the complexities of CO2 impacting temperature as it is irrelevant for a few doublings. We can sit by and actually collect accurate data for 50 years, and then decide if there is a problem. We do not need the computer models for prediction (which they can’t accurately do anyway)
RoT, I think it is about (or a bit less than) 2x 0.9C. There are two lines of thought, one purely empirical and the other mostly theoretical based on some empirical observational constants.
Empirical: the now several energy budget observational models, the best IMO the second Lewis and Curry paper responding to the criticisms of the first, with no meaningful change in result. ECS ~1.65 with likely range 1.5-1.8.
Theoretical: use Monckton’s irreducibly simple equation (Or my mathematical simplification of it), plus Monckton’s referenced parameters to compute ~1.7. You can find both my mathematics and the resulting computations over at Judith’s at the time he posted his paper there.
There is yet another way. TCR is more calculable than ECS—just 70 years at 1% CO2 in rease per year. In both the CMIP5 ensemble and in the energy budget models the ratio TCR/ECS is roughly 0.7. So a Monckton model theoretical plus observational EBM TCR of ~1.3 (off a no Feedback response grey earth ~1.16 per Monckton (Lindzen used 1.2 for simplicity) results in ~1.85. In the same ballpark, about double yours.
Still nothing to worry about if the ‘crisis’ is 2C. Which is why the warmunists recently moved the goalposts to 1.5C. A sign us skeptics are slowly winning.
And what caused the 1910 to 1940 rise? An inconvenient fact?
https://www.pnas.org/content/106/38/16120.full
That study is useful as far as it goes, but what causes the variability in oceanic circulation?
Given slow change in tectonic plate arrangement for the past three million years, solar activity, volcanism and aerosols must play a role in oceanic circulation and climate. The diminshment in Earth’s internal latent heat and radioactive decay on so short a timescale shouldn’t be noticeable.
The seemingly minor changes in orbital and rotational mechanical Milankovitch cycles affecting insolation yield big changes in Earth’s ice sheets and albedo, hence longterm temperature and precipitation, ie climate.
“I keep trying to argue using the same type of logic for a maximum effect on temperature of CO2 doubling in the atmosphere, and I keep coming up with a figure around 0.9 C.”
that would be what we call…..
wrong