Reposted from Dr. Roy Spencer’s blog
June 5th, 2020 by Roy W. Spencer, Ph. D.
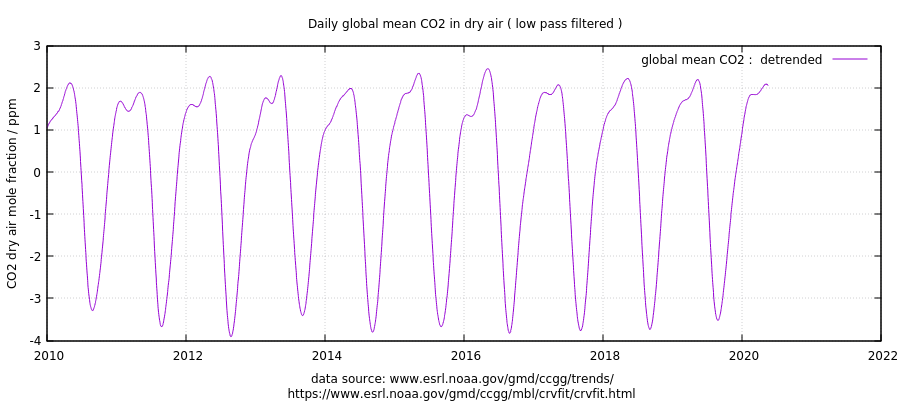
The Mauna Loa atmospheric CO2 concentration data continue to show no reduction in the rate of rise due to the recent global economic slowdown. This demonstrates how difficult it is to reduce global CO2 emissions without causing a major disruption to the global economy and exacerbation of poverty.
After removal of the strong seasonal cycle in Mauna Loa CO2 data, and a first order estimate of the CO2 influence of El Nino and La Nina activity (ENSO), the May 2020 update shows no indication of a reduction in the rate of rise in the last few months, when the reduction in economic activity should have shown up.

I had previously explained why the slowdown would likely not be large enough to affect measured atmospheric CO2 levels compared to natural variations in global sources and sinks of CO2. I calculated that the Energy Information Administration-estimated 11% reductions in CO2 emissions during 2020 would have to be four times larger to stop the rise of atmospheric CO2 over 2019 values (assuming no substantial natural variations in CO2 sources and sinks).
Why am I not surprised!
Many great civilisations collapsed due to catastrophic changes in the climate that dwarf what is attributed to human created greenhouse gases. We should assume that changes in the climate are natural and probably would if Mann hadn’t made the medieval warm period magically vanish.
Our use of fossil fuels provides the ability move grains and foods around the world and thus provides the resilience that can only be destroyed if the fossil fuels are removed.
Very good point. The current locust plague in Africa does not need to cause starvation because we can ship food to them from anywhere on the globe (except North Korea because they don’t have any to spare). We could go one step further and quit turning perfectly good food into ethanol, especially given the low cost of oil. This would reduce world-wide grain prices and make it easier for many people to feed their families.
Spot-on.
Yes, feeding cars before feeding people is one of the typical unintended consequences that plague all these naive, well meaning enviro master plans.
Looking at the magnitude and inter-annual variability of the natural cycle shows why it would take a massive change for it be detectable.
The kind of reduction they are trying to force on the world to use control climate via CO2 emissions is like COVID-shutdown this year; COVID-shutdown^2 next year; COVID-shutdown^3 the year after ….
One thing COVID has shown us is how insanely out of touch with reality their claims are.
Exactly right Eric. The Mayan Civilization is thought to have collapsed (at least in part) due to a series of severe droughts according to some scientific studies. So the thought that we are doomed due some part of the rise in CO2 that we might be responsible for is arguably laughable.
The Mayan civilization die out due to a lack of fossil fuels.
The series of droughts would have been survivable by the Mayan civilization had it not been for the fact that it came at a time when they have already maxed out the carrying capacity of the land for agricultural maize. It was also unfortunate for them that the only grain they are farming is also the one that guzzle water the most.
Are you sure the Mayan Civilization didn’t collapsed do to taxation?
A decline in economic activity sufficient to reduce carbon emissions by 11% also causes mass unrest, riots, and political instability. What would 40% do?
Thank you for this. Friend of mine, married to an astrophysicist, is continually updating me on the case trend line for CV19 in our state (*case* trend has been slightly upward in linear fashion, though she calls it a spike; hospitalization rates steady to falling and a small fraction of capacity; death rate falling). What she and her husband either don’t consider or don’t care about is the *other* devastating impacts that a careful reopening are intended to mitigate – for instance, the 300% spike, year over year, in calls to abuse tiplines (and imagine what that increase must actually be, since those calls depend on the victim’s ability to make a call or send a text undetected).
Seems like no matter what we do the CO2 goes up linearly every single year, year over year over year over year.
We increase CO2 output from 20 Gt per year in 1980 to 37 gt per year in 2018.
Did the rate of increase go from lower to higher?
Nope, stayed the same.
over 90% of all CO2 is in the oceans. The larger part of the rest is in plants and trees. The amount of CO2 exchange between the ocean and atmosphere is about 90 gigatons of CO2. More than double what we burn.
Because the Ocean contains 60 times more CO2 than the Atmosphere, in order for the CO2 to rise 1 part per million in the atmosphere, the amount of CO2 in the ocean has to increase by 60 parts per million.
Anyone noticed that 60ppm increase in the ocean?
There is an interesting science puzzle, concerning sources, sinks, and resident times of CO2.
The creation of the modern Climate crisis. If humans did not cause the rise in atmospheric CO2, there is no CAGW or ocean acidification problem. We can burn as much hydrocarbons as we want.
There are a half dozen peer reviewed papers that show (using independent analysis and different variables) that atmospheric CO2 is tracking planetary temperature, not anthropogenic CO2 emissions.
For that to be physically, true there needs to be a large source of CO2 into the biosphere, that is ‘missing’ and a large sink of CO2 out of the biosphere, that also has been ‘missed’. That is exactly what the observations show.
The large sink of CO2 is particulate organic carbon that sinks to the bottom of the ocean. This is an interesting review paper discusses the science and science politics.
Carbon cycle modelling and the residence time of natural and anthropogenic atmospheric CO2: on the construction of the “Greenhouse Effect Global Warming” dogma.
https://www.co2web.info/ESEF3VO2.pdf
This paper looked at the phase relationship between CO2 emissions, changes, and temperature…
And found CO2 is tracking temperature, not anthropogenic CO2 emissions.
https://www.researchgate.net/publication/257343053_The_phase_relation_between_atmospheric_carbon_dioxide_and_global_temperature/link/56e4581508ae68afa1106148/download
Summing up, our analysis suggests that changes in atmospheric CO2 appear to occur largely independently of changes in anthropogene emissions.
It is interesting that the C12/C13 ratio on a short term basis 2 to 3 years, does not track anthropogenic CO2 emissions.
The C12/C13 ratio is changing in steps. The C12/C13 ratio is also changing before El Nino events.
http://ruby.fgcu.edu/courses/twimberley/EnviroPhilo/SourcesAndSinks.pdf
SOURCES AND SINKS OF CARBON DIOXIDE by Tom Quirk
But the IPCC is not charged with evaluating natural climate change. Their charter states EXACTLY that their job is to identify and ameliorate HUMAN CAUSED global warming, and they chose CO2 as their horse to ride. They could care LESS about any natural climate change BECAUSE we are emitting CO2, and THEY CLAIM that is causing global warming. Nice sidestep around the natural processes.
What’s OCO-2 showing ?
The “parts bin” OCO-3 is up there now too….
I don’t think it is correct to say that the ratio is changing ‘before’ El Niño events. The ratio changes in line with the change in CO2 growth rate. They are directly correlated.
The ratio of the concentrations (partition coefficient) will be relatively constant because of Henry’s law. However, we’re only dealing with sea surface because mixing is slow. So, it takes a while for the masses to equilibrate.
I’d like to get to the bottom of this question. Sorry for the long comment.
As mentioned in previous comments I have made on this topic, I had read that our annual emissions corresponded to 4 ppm of the atmosphere and that we can see an annual increase of about 2 ppm/yr.
Unless I missed a reply, nobody has ever explained how we can emit twice the annual increase in atmospheric CO2 concentration, but somehow not be responsible for that rise, while complying with the law of conservation of mass.
To conclude that we are not responsible for the increase in CO2, either conservation of mass is no longer a thing, or the claim that our annual emissions represent 4 ppm of the atmosphere is incorrect.
So let’s finally check the facts and do the math, shall we?
The total mass of the atmosphere is calculated to be 5.274E18 kg
according to https://math.stackexchange.com/questions/688711/calculate-the-mass-of-the-earths-atmosphere-give-the-density-of-air
5.274E18 kg =5,274,000 Gt (gigatons or billion metric tons)
Current concentration of CO2 in the atmosphere is approximately 415 parts per million
(415/1000000) x 5,274,000 Gt = 2189 Gt CO2 total in atmosphere
How much is atmospheric CO2 concentration increasing each year?
Eyeballing Roy Spencer’s chart it was 399.5ppm in Jan 2015 and 412.5ppm in Jan 2020, which gives us 13 ppm per 5 years or 2.6 ppm/yr
I will use 2.6 ppm/yr
2.6/1000000) x 5,274,000 Gt = 14 Gt added to the atmosphere for each 2.6 ppm annual increase.
In 2019 we emitted 33 Gt of CO2
according to https://www.iea.org/articles/global-co2-emissions-in-2019
33 Gt/5,274,000 Gt = 6.3 ppm
Our annual CO2 emissions are equivalent to 6.3 ppm of the atmosphere
By this calculation, only 14/33 = 42% of our emissions accumulate in the atmosphere and the balance goes to the natural sinks (and any human-induced sinks), such as to the oceans and biosphere.
So to recap, what I have posted several times on prior articles was that we emit the equivalent of 4 ppm per year, and atmospheric concentration rises 2 ppm/yr. I was wrong!
Actually the correct numbers appear to be that we emit the equivalent of 6.3 ppm per year, and atmospheric concentration rises 2.6 ppm/yr. So let me revise my question–How can we emit MORE than twice as much CO2 as the annual rise in CO2 concentration in the atmosphere, but not be responsible for the rise?
Let’s look at the mass balance around the atmosphere implied by conservation of mass.
At a high level: CO2 in – CO2 out = CO2 accumulated
Call CO2 accumulated (A)
CO2 in consists of two terms: CO2 Nat. Emissions (En) + CO2 Hum. Emissions (Eh)
CO2 out likewise consists of: CO2 Nat. Sinks (Sn) + CO2 Hum. Sinks (Sh)
That will give us A = En + Eh – Sn – Sh
Here’s an assumption I’m making: Sh <> Eh, that’s irrelevant here)
The net natural flux is known to be a sink because accumulation is slower than human emissions. Thus the net sink is the difference between the total sink and the natural emissions
Let N = S – En
So A = Eh – N ==> N = Eh – A
In other words, the net sink is human emissions minus the accumulation.
Therefore: N = 33Gt/yr – 14 Gt/yr = 19 Gt/yr
This tells us that the net sink is 19 Gt/yr at current conditions (average ocean temperature, atmospheric CO2 concentration, etc.) The net sink is a function of the forcing, or deviation from the equilibrium concentration.
(I am well aware that this net sink is a function of many variables and not a constant).
The net sink is therefore a function of atmospheric concentration, not directly a function of human emissions. The natural sinks cannot distinguish between naturally-sourced CO2 and fossil-fuel-sourced CO2. It is only affected by human emissions to the extent that human emissions increase atmospheric concentration, driving the partial pressure of CO2 in the atmosphere out of equilibrium with the partial pressure of CO2 in the ocean. (the forcing)
We can therefore safely assume that the driving force won’t immediately change significantly in the event of a sudden drop in human emissions. By that argument about the same 19Gt would be removed in the first year immediately following a sudden elimination of human emissions.
19Gt/5,274,000 Gt = 3.6 ppm/yr
The forcing (or deviation from equilibrium) will decrease toward zero over time in the absence of human emissions, therefore it must go from 19 Gt/yr to 0 Gt/yr. It will not do this in a linear fashion. It will approach equilibrium asymptotically. What is the equilibrium concentration? It should be higher than 280 ppm, because 280 ppm is what it was in pre-industrial times when the oceans were colder.
At least initially, CO2 should drop at a rate of 3.6 ppm/yr in the total absence of human emissions. This rate will drop over time. Here is where you can go down a rabbit hole and talk about e-folding rates, time constants, etc. When centuries and millennia are invoked, that is the time to go all the way back to equilibrium, which is maybe about 290 ppm. But that’s nonsense anyway, since the equilibrium will be dependent on temperature which is always changing. Also we are told by Bill McKibben that 350 ppm is the magic safe level. So at minimum we have a cushion of 60 ppm and we won’t need to get into that long tail where the net sink is approaching zero in order to reach the “safe zone”.
My point is that if we acknowledge that we aren’t really in trouble today, all we would need to do is to stabilize where we are. If we cut back from 33 Gt/yr to 19 Gt/yr, it seems that we would balance the net natural sink. In other words, reduce our emissions by 42% and we hold steady at 415ppm. Cut more and eventually we get back to McKibbens’ safe 350ppm.
Replace those emissions with nuclear power and call it a day. I’ll even go for those MSRs that ColMosby is selling 🙂
But oh by the way, I don’t actually buy the need to stabilize CO2 concentration. CO2 is good. The warming is beneficial. We don’t have enough fossil fuels to raise temperatures to a dangerous level and we can easily adapt to the rising sea levels (unless the Netherlands is a figment of my imagination).
I’ll ask again that any of you who want to make the claim that human emissions are irrelevant to CO2 concentration increasing in the atmosphere, to please point to the error(s) in the above analysis.
Seems correct.
It is correct.
How can we “emit twice the annual increase in atmospheric CO2 concentration, but somehow not be responsible for that rise, while complying with the law of conservation of mass.”
We can’t and all rubbish that the additional CO2 is somehow not ours is at best deluded and tedious, at worst deceitful.
Hi Loydo,
Oh no! We agree 🙂
But I’m sure you’ll disagree heartily when I say that the effect of our contribution to CO2 enhancement is entirely beneficial to mankind and not the slightest bit of a risk. Or that in the event that we were to agree on a precautionary principle that we should limit CO2, then we should do that with a combination of hydroelectric and nuclear.
Oh no! We agree 🙂
I know, crazy times. Having just read down through most of your posts I say well done for the clear way you are describing the mass balance question. It shouldn’t be that difficult to understand, but as you say below:
“Sometimes we can’t have the convenient case just because we wish it were so.
Clinging to an unreasonable hypothesis destroys our credibility and plays into the hands of those who dismiss us as science deniers…”
The consensus is ~3C but you say “I think that ECS is probably 1.34-1.67…” I would argue your “convenient case” comment applies to ECS too because we’ve already done ~1.67C
http://berkeleyearth.org/2019-temperatures/
and we’re only just cranking things up on the path to doubling

“Inconvenient”?
Looks like I made an HTML error there by trying to use two less than symbols for “much less than” and two greater than symbols for “much greater than”.
Here is my post again, but corrected: @MODS, please delete the garbled one? Thanks
I’d like to get to the bottom of this question. Sorry for the long comment.
As mentioned in previous comments I have made on this topic, I had read that our annual emissions corresponded to 4 ppm of the atmosphere and that we can see an annual increase of about 2 ppm/yr.
Unless I missed a reply, nobody has ever explained how we can emit twice the annual increase in atmospheric CO2 concentration, but somehow not be responsible for that rise, while complying with the law of conservation of mass.
To conclude that we are not responsible for the increase in CO2, either conservation of mass is no longer a thing, or the claim that our annual emissions represent 4 ppm of the atmosphere is incorrect.
So let’s finally check the facts and do the math, shall we?
The total mass of the atmosphere is calculated to be 5.274E18 kg
according to https://math.stackexchange.com/questions/688711/calculate-the-mass-of-the-earths-atmosphere-give-the-density-of-air
5.274E18 kg =5,274,000 Gt (gigatons or billion metric tons)
Current concentration of CO2 in the atmosphere is approximately 415 parts per million
(415/1000000) x 5,274,000 Gt = 2189 Gt CO2 total in atmosphere
How much is atmospheric CO2 concentration increasing each year?
Eyeballing Roy Spencer’s chart it was 399.5ppm in Jan 2015 and 412.5ppm in Jan 2020, which gives us 13 ppm per 5 years or 2.6 ppm/yr
I will use 2.6 ppm/yr
2.6/1000000) x 5,274,000 Gt = 14 Gt added to the atmosphere for each 2.6 ppm annual increase.
In 2019 we emitted 33 Gt of CO2
according to https://www.iea.org/articles/global-co2-emissions-in-2019
33 Gt/5,274,000 Gt = 6.3 ppm
Our annual CO2 emissions are equivalent to 6.3 ppm of the atmosphere
By this calculation, only 14/33 = 42% of our emissions accumulate in the atmosphere and the balance goes to the natural sinks (and any human-induced sinks), such as to the oceans and biosphere.
So to recap, what I have posted several times on prior articles was that we emit the equivalent of 4 ppm per year, and atmospheric concentration rises 2 ppm/yr. I was wrong!
Actually the correct numbers appear to be that we emit the equivalent of 6.3 ppm per year, and atmospheric concentration rises 2.6 ppm/yr. So let me revise my question–How can we emit MORE than twice as much CO2 as the annual rise in CO2 concentration in the atmosphere, but not be responsible for the rise?
Let’s look at the mass balance around the atmosphere implied by conservation of mass.
At a high level: CO2 in – CO2 out = CO2 accumulated
Call CO2 accumulated (A)
CO2 in consists of two terms: CO2 Nat. Emissions (En) + CO2 Hum. Emissions (Eh)
CO2 out likewise consists of: CO2 Nat. Sinks (Sn) + CO2 Hum. Sinks (Sh)
That will give us A = En + Eh – Sn – Sh
Here’s an assumption I’m making: Sh is much less than Sn (human-induced sinks are much smaller than natural sinks, or alternatively the human-induced sink is relatively constant and could be treated as part of the natural sink). So let S = Sn + Sh
It makes no difference if I’m wrong about this, unless the human-induced sink is a function of the human-induced emissions and will change in the event of a reduction in our emissions. If you want to fight me on this point, then explain how the human-induced sinks won’t be relatively constant.
That gives us:
A = En + Eh – S
We know A, and Eh, by not En
(I am very well aware that En are much greater than Eh, that’s irrelevant here)
The net natural flux is known to be a sink because accumulation is slower than human emissions. Thus the net sink is the difference between the total sink and the natural emissions
Let N = S – En
So A = Eh – N ==> N = Eh – A
In other words, the net sink is human emissions minus the accumulation.
Therefore: N = 33Gt/yr – 14 Gt/yr = 19 Gt/yr
This tells us that the net sink is 19 Gt/yr at current conditions (average ocean temperature, atmospheric CO2 concentration, etc.) The net sink is a function of the forcing, or deviation from the equilibrium concentration.
(I am well aware that this net sink is a function of many variables and not a constant).
The net sink is therefore a function of atmospheric concentration, not directly a function of human emissions. The natural sinks cannot distinguish between naturally-sourced CO2 and fossil-fuel-sourced CO2. It is only affected by human emissions to the extent that human emissions increase atmospheric concentration, driving the partial pressure of CO2 in the atmosphere out of equilibrium with the partial pressure of CO2 in the ocean. (the forcing)
We can therefore safely assume that the driving force won’t immediately change significantly in the event of a sudden drop in human emissions. By that argument about the same 19Gt would be removed in the first year immediately following a sudden elimination of human emissions.
19Gt/5,274,000 Gt = 3.6 ppm/yr
The forcing (or deviation from equilibrium) will decrease toward zero over time in the absence of human emissions, therefore it must go from 19 Gt/yr to 0 Gt/yr. It will not do this in a linear fashion. It will approach equilibrium asymptotically. What is the equilibrium concentration? It should be higher than 280 ppm, because 280 ppm is what it was in pre-industrial times when the oceans were colder.
At least initially, CO2 should drop at a rate of 3.6 ppm/yr in the total absence of human emissions. This rate will drop over time. Here is where you can go down a rabbit hole and talk about e-folding rates, time constants, etc. When centuries and millennia are invoked, that is the time to go all the way back to equilibrium, which is maybe about 290 ppm. But that’s nonsense anyway, since the equilibrium will be dependent on temperature which is always changing. Also we are told by Bill McKibben that 350 ppm is the magic safe level. So at minimum we have a cushion of 60 ppm and we won’t need to get into that long tail where the net sink is approaching zero in order to reach the “safe zone”.
My point is that if we acknowledge that we aren’t really in trouble today, all we would need to do is to stabilize where we are. If we cut back from 33 Gt/yr to 19 Gt/yr, it seems that we would balance the net natural sink. In other words, reduce our emissions by 42% and we hold steady at 415ppm. Cut more and eventually we get back to McKibbens’ safe 350ppm.
Replace those emissions with nuclear power and call it a day. I’ll even go for those MSRs that ColMosby is selling 🙂
But oh by the way, I don’t actually buy the need to stabilize CO2 concentration. CO2 is good. The warming is beneficial. We don’t have enough fossil fuels to raise temperatures to a dangerous level and we can easily adapt to the rising sea levels (unless the Netherlands is a figment of my imagination).
I’ll ask again that any of you who want to make the claim that human emissions are irrelevant to CO2 concentration increasing in the atmosphere, to please point to the error(s) in the above analysis.
Rich,
you said :- ” In other words, reduce our emissions by 42% and we hold steady at 415ppm”
How on earth do you imagine that that is possible?
Nuclear provides electrcity and could provide more, but electricity is but a small part of the energy bundle. 85% or so of global energy consumption is from fossil fuels. Reducing man’s consumption to acheive the levels you are talking about will significantly reduce all the good that our consumption of fossil fuels provides.
We could go back 100 years, but how many really want to?
Iain,
Can’t blame you if you didn’t read my entire comment, but this is what I said:
If for some reason, we wanted to embark on this fools’ errand, I suppose that it implies first using electricity directly for everything where electricity is feasible, and fracking to make natural gas the primary fossil fuel. I suppose that you can use electricity to provide the heat needed to convert agricultural waste cellulose into methanol for transportation fuels. (Such carbon is primarily derived from CO2 in the air, and methanol can be distributed by repurposing gasoline infrastructure). You’d need a carbon tax that funds the MSRs and/or conventional nukes as well as the vast capital cost of upgrading the grid infrastructure.
You only need an energy source to store chemical energy. Nature uses the sun to drive photosynthesis. We can use electricity from nuclear power. We can make liquid fuels and other chemical feedstocks from the synthesis gas reaction. One day our descendants will be forced to recycle carbon this way, when fossil fuels become too expensive to extract relative to the cost of nuclear power.
Even though I oppose this approach, it would certainly be far cheaper and far more practically achievable than the use of short useful lifetime wind and solar. It would also be much friendlier to the environment than devastating forests to put up hideous bird choppers.
Quick correction
Thanks to Anders, we determined that I had neglected to adjust for molecular weight
The actual amount of fossil fuel emissions that would need to be replaced to halt CO2 rise due to fossil fuel burning would be 63% not 42% as I had previously stated.
2019 figures:
4.1ppm/yr emitted, 2.6 ppm/yr accumulated (63%).
Plug the volcano’s, see problem solved
Rich Davis
Parts per million, ppm, is based upon mole or volume ==>
33 Gt/year to atmos ==> 33/44/(5.274/29)*10^-6 = 4.1 ppm/year.
415 ppm CO2 in atmos ==> 415*5.274/29*44 = 3320 Gt Carbon.
Kind regards
Anders Rasmusson
Sincere thanks for that correction, Anders! Makes sense to me.
So it’s 4.1 ppm/yr added and 2.6 ppm/yr accumulating. It changes only one thing about my argument.
The question becomes “How can we emit more than the amount of CO2 that is accumulating and not be responsible for the increase while still complying with the law of conservation of mass?”
Anders
415 ppm CO2 in atmos ==>
415*5.274/29*44 = 3320 Gt CO2 in atmos ==>
3320/44*12 = 906 Gt Carbon.
Kind regards
Anders Rasmusson
I’m not so sure you’ve gotten to the bottom of it Rich.
A very wrong assumption. ML CO2 increased 5.7X faster than MME, MME lags ML by 2 years, and R=.36 is quite low:
CO2 outgassing can thus be considered as regulated by the size and average temperature of the tropical ocean that is warmer than 25.6C, and by whatever is increasing the overall amount of dissolved CO2 in the ocean that drives increasing underwater pCO2.
The CO2 net flux vector is therefore outward from the ocean surface, making human emissions a minor part of atmospheric CO2, and sinking CO2.
Bob,
This is the part that you all can’t get through my thick skull—
My claims:
1) We know that the total annual Gt of our emissions pretty accurately.
2) We know the total mass of the atmosphere pretty accurately.
3) We know the average molecular weight of the atmosphere pretty accurately.
4) We know the approximate rate of accumulation of CO2 in the atmosphere by the long-term linear trend of MLO (or indeed any other station you wish to use).
Are any of those statements wrong?
You dispute that the absolute number measured at MLO is representative of the actual global average concentration at any given time. That doesn’t matter. We’re looking at average annual fluxes and changes over five or more years.
Based on the above claimed facts, we know the average annual Gt of CO2 increase in the atmosphere from whatever source.
Still with me?
That number is smaller than the Gt of our emissions.
How is it possible for the mass balance around the atmosphere to close unless the sum of every other flux is a net sink relative to the atmosphere?
That is the one question nobody will answer (except by denying that conservation of mass is a requirement)
I never questioned the extreme dynamic and complex nature of sources and sinks in the global system. The fluxes probably all vary spatially, diurnally, and seasonally. There are lags that may go centuries or millennia. All happily granted.
We got off on a tangent of assuming that only the ocean is significant and that the ocean’s only significant flux is due to Henry’s Law, but those assumptions may well be wrong.
My original claim that I return to here is that the mass balance must close, and I don’t need to detail all the fluxes to prove that the net flux must be a sink.
But if the whole ocean over its entire surface over the entire year is a net source as you claim, that only leaves the land area biomass to be an offsetting net sink.
Would you please point out the error in this analysis?
Rich you aren’t being very careful here by misrepresenting what I said.
You dispute that the absolute number measured at MLO is representative of the actual global average concentration at any given time.
But if the whole ocean over its entire surface over the entire year is a net source as you claim, …
This is what I said:
Recent >25.6C warm area can be seen below, and is clearly not the “whole ocean”:
The portion of the ocean >25.6C grew by 2% since 1854, as the portion of the tropics >25.6C grew from 56% to 62% (data: gridded ERRSTv5), to 17.9% of the ocean surface.
That means in 2019, ~82.1% of the ocean surface was in CO2 sinking territory.
From my POV you are the one going off on a tangent. Last year I started with the mass balance method as you have, but quickly moved on to Henry’s Law. What allowance did you make for decades of leaf area growth?
Mauna Loa CO2 rose at a pace 5.7x higher than man-made emissions, therefore MME didn’t drive ML CO2 accumulation.
Lastly, the highest pCO2 occurs where S. America blocks subsurface ocean currents.
Bob,
I certainly do not intend to misrepresent anything that you said. Perhaps I misunderstood it, but why would I want to misrepresent it? I think that you’re saying that the area of the ocean that is outgassing is increasing over time. I don’t really need to consider this for my analysis. It is part of the net flux that is not due to fossil fuel burning.
I do not know how to rephrase this one more time in a different way in the hope that it will click with somebody. The mass balance that I am trying to discuss only requires two pieces of information:
1) the annual fossil fuel CO2 emissions (gigatons)
2) the annual increase in CO2 contained in the atmosphere (gigatons)
I’ve been explicit that it has to be measured in multiples of full years to account for seasonality, and if the total human-induced sink is not nearly constant from one period to the next, then that could introduce some errors.
We know that the gap between the human emissions and the average annual increase in CO2 mass in the atmosphere is large relative to the uncertainty of either number. It is not likely that human-induced annual average fluxes (sources or sinks) vary materially from one period to the next. That is, the possible errors in these terms do not pose a serious risk that the sign of the net flux could be wrong. There are also other human-induced sources than fossil fuel burning, but my logic is again that these fluxes are relatively constant from one period to the next, despite obvious seasonality, and that they are independent of the fossil fuel emissions.
I don’t need to consider ANY of the fluxes other than fossil fuel emissions, because all I am trying to demonstrate is the sign of the net flux summing up ALL other fluxes which are not caused by fossil fuel burning. I can calculate this from the difference between the fossil fuel emissions and the accumulation. I am not estimating any of those fluxes and coming up with the number, it is just 2nd grade subtraction math.
The decades of leaf area growth that you mentioned is just one of the natural sinks that are included in the net flux, I don’t need to make any adjustment for it, or understand how it may interact with other fluxes. I don’t need understand or quantify any of the other fluxes. I would agree that it is driven by the increased level of CO2.
Why is this analysis relevant?
If in fact the net of all fluxes other than fossil fuel emissions is a sink, then it means that fossil fuel emissions, however small a fraction of natural emissions that they may be, are decisive in the increase in the total CO2 content of the atmosphere. It must be so, because the fossil fuel emissions are sufficient to account for all of the increase plus a portion that went to the net sink.
It does not mean that the same CO2 molecules that went into the atmosphere during the period are necessarily still in the atmosphere at the end of the period because of the rapid exchange between much larger natural sources and sinks. What is important is only the number of CO2 molecules at the end of the period in excess of the number that were in the atmosphere at the beginning of the period.
For the same reason, probably most of the CO2 that was ever emitted by fossil fuel burning has already been sequestered and any amount of accumulated CO2 from fossil fuel burning has probably been replaced by an equal amount of naturally-sourced CO2 molecules by the massive natural seasonal exchange. The origin of the CO2 molecules currently in the atmosphere is irrelevant. All CO2 molecules are interchangeable (ignoring isotopes). What matters is that if fossil fuel emissions have been responsible for a net increase in CO2 each year, then there is an accumulated imbalance that is due to fossil fuel burning.
Why do I care to prove that?
Because many of our skeptic friends here deny it, which concerns me because it could discredit their arguments on other topics where I think they are correct. It is not because I think it is a problem for CO2 to be increased by fossil fuel burning or that I am concerned about any possible warming due to that increase. I think that if there is warming, it will be beneficial.
Rich I appreciate your dilemma.
The net natural flux is known to be a sink because accumulation is slower than human emissions.
The rate of ML CO2 is increasing 5.7x the rate of MME, so MME doesn’t drive ML CO2, making the net natural flux still the main source, not a sink.
If in fact the net of all fluxes other than fossil fuel emissions is a sink, then it means that fossil fuel emissions, however small a fraction of natural emissions that they may be, are decisive in the increase in the total CO2 content of the atmosphere.
There weren’t MME before a few hundred years ago, so what caused CO2 to change before in sync with temperature if all fluxes other than MME are negative sinks?
ML CO2 changes shown below are significantly correlated to SST and SLP.
Wake me up when the Alarmist believe CO2 cycle will overcome the hydro cycle.
This is a facile analysis. Natural sinks are dynamic, and expand or contract in response to all forcing. As a result, a portion of natural sink activity is, for all intents and purposes, anthropogenic sinks. It is sink capacity that would not exist but for the anthropogenic forcing.
You’ve made an error of logic. Its the attempt to make a deduction from ignorance.
o let me revise my question–How can we emit MORE than twice as much CO2 as the annual rise in CO2 concentration in the atmosphere, but not be responsible for the rise?
You are arguing that we can think of no other possible mechanism and therefore the one you select, human causation, must be the one.
The other alternative, i have no idea whether its true, is that there is some mechanism which is currently resulting in a rise of 2ppm, which operates independently of the amount of emissions.
For instance, it could be that emissions are absorbed by the ocean in proportion to their amount, but that release from the oceans is constant resulting in 2ppm.
Is that the case? I have no idea. What it shows however is that you cannot reason from the fact that you can’t think of any other way that this can happen to the conclusion that it cannot happen any other way.
An example, if one is needed. We observe that BAME people are dying of Covid more than whites. It must be deprivation and racism, would someone explain what else it could be?
Yes, it could be (and I have no idea whether this is the case either) that they have some genetic susceptibility. It could be that they work more in professions which have a higher risk factor of contagion. It could be that they have higher rates of co-morbidities. It could be due to differerent diets….
Whatever, the fact that you cannot think of any other reason has no bearing on whether the one you happen to have thought of is the right one. Figure out which it is, don’t congratulate yourself on your ignorance.
Michel,
You do not address the mass balance. It is not necessary to know any of the mechanisms of the natural sinks and emissions to calculate the net sink when you know the actual rate of accumulation and the actual rate of our emissions. This is just basic algebra. Every other possible mechanism that you can dream of is included in the net sink. Very large, variable natural emissions offset by very large (but somewhat larger) variable sinks.
N=E1+E2+E3+E4+…+En -S1-S2-S3-S4-…-Sn.
The physical reality is that CO2 is going up more slowly than the rate of our emissions, therefore the sum of all that glorious complication must be a net sink of a magnitude that we can directly calculate, at least to the extent that we can calculate the change of concentration and the quantity of our emissions. That net sink is very much a variable, changing every moment and significantly over time. It must be larger when there is a larger driving force and should tend to zero when there is no driving force.
It is really simple. If you pour more into a bucket than is draining out of a series of holes in the bottom, the water level will rise.
I think the original argument went something like this. CO2pp is rising. We are emitting CO2. I cannot think of any other reason why CO2 should be rising, therefore our emissions are causing it.
I was trying to point out that this is a variant of the argument from ignorance, and is logically invalid.
It is logically possible that there is a system of some sort that means that sinks and sources lead to a constant level of emissions, regardless of variations in the amount emitted by any particular source.
I have no idea whether this is in fact the case. I am just pointing out that the original argument is logically fallacious. You can never argue to the truth of something because of ignorance about alternatives.
I don’t know whether its like a bucket with holes. That is exactly the question.
Michel
It is not that I cannot think of any other reason. It is because there are some things we know about the system such as Henry’s Law, and because
IN -OUT = ACCUMULATION
You’re saying that the rate of accumulation could be a fixed constant which requires that the natural sinks and sources must adjust themselves dynamically by an unknown mechanism in order to increase or decrease and maintain the constant accumulation.
Logically I suppose it’s conceivable, but physically it makes no sense except if we assume that space alien technology or some other deus ex machina is involved.
For the accumulation to be ever-increasing is to imply that nature is compelled somehow to drive itself away from equilibrium rather than toward equilibrium.
The other way that I could be mistaken is if the partial pressure of CO2 in the ocean is actually greater than the partial pressure of CO2 in the atmosphere, so that restoring equilibrium requires CO2 to be emitted. I think we can satisfy ourselves that this case does not apply?
Rich,
There are of course many regions where pCO2 in the surface waters is higher than pCO2 in the atmosphere, just as there are regions where the opposite is true. Also, many of these areas switch between a positive and negative difference along with the seasons due to warming and/or photosynthesis by phytoplankton.
The most recent estimate of the global average difference in pCO2 that I have seen was 5 µatm, with the atmosphere being the higher value. However, this is a tiny amount given the size of local seasonal variations (which are much larger in the surface waters than in the atmosphere) so I would not think that this could be treated as definitive either way.
Also Michel, you are arguing apples and oranges with your example of COVID-19.
The accurate comparison is that you report that COVID-19 deaths are occurring at a rate of 6,300 per day, and that the total population is going down at a rate of 2,600 per day. I tell you that this proves that COVID-19 deaths are responsible for the falling population and that this means that the net of all other causes of death and all births must be a net loss of 3,700. Then you tell me that I’ve made an error of logic. You tell me that maybe there are more births and a different number of deaths. I sigh, and say it’s still a net of 3,700, whether there are 20 million being born and 20,003,700 dying, or 3,700 dying and nobody being born.
You’re absolutely correct that BAME (that’s black, Asian, and Middle Eastern for Americans who may not be familiar with the UK term) people are not necessarily dying at a higher rate than white Europeans due to racism or other social disadvantages. It is very likely that dark-skinned people living in high latitude countries are deficient in Vitamin D. That’s not to say that there could be differences in the proportion of obese, diabetic, asthmatic, immune-compromised, or otherwise at-risk compared with whites as a result of social disadvantages. Both can be true. Just as it could be all one reason or all the other.
D’oh
Getting tired. I meant that there would be a net of 3,700 births and it doesn’t matter if that is 20,003,700 births and 20,000,000 deaths from other causes than COVID-19 or if it is 3,700 births and nobody dying from any other causes.
If the population is dropping by less than the rate of COVID-19 deaths then there has to be an offsetting number of births greater than all other causes of death. In the absence of COVID-19 deaths, the population would have risen.
By analogy, if CO2 is rising by less than the rate of human-caused emissions, then there has to be offsetting natural sinks greater than any other natural emissions. In the absence of human-caused emissions, the CO2 concentration would have fallen.
@Rich Davis
“… COVID-19 deaths are occurring at a rate of 6,300 per day, and that the total population is going down at a rate of 2,600 per day. I tell you that this proves that COVID-19 deaths are responsible for the falling population …”
Be careful how you frame hypothetical remarks. Some readers may conclude, from your remarks, that the total world population is shrinking due to covid-19.
In fact, global births outnumber deaths by more than a factor of two:
https://www.worldometers.info/
Also, covid-19 deaths are roughly the same (order of magnitude) as previous deaths from the so-called “common” flu (which actually comprise a variety of distinct flu bugs, some more virulent than others). So, previously, annual respiratory deaths from influenza ranged from 250,000 to 650,000, without generating much attention. Even from WHO:
https://www.who.int/news-room/detail/14-12-2017-up-to-650-000-people-die-of-respiratory-diseases-linked-to-seasonal-flu-each-year
Ok sure Johanus. It was an analogy. Not based on actual statistics. The numbers mirror the CO2 situation. The analogy was chosen for me by Michel but in a flawed way. I was showing how the two could be made into a valid analogy. I did not intend to provide any actual information about COVID-19 or population changes.
It could be Vit D deficiency which has been identified as a compounding factor in CV-19 illness and is known to be more common in all people with dark skin.
The whole global warming scam was based on “we can’t think of anything else that could be causing global warming, ergo it must be CO2”. Probably the most unscientific piece of science ever. Rich’s hypothesis is no better.
What is driving the desire to deny an obvious physical fact?
Sure if human CO2 could really be irrelevant to the rise of CO2 in the atmosphere, then it would be convenient. Then even if rising CO2 were objectively a problem, it would be a problem that could not be mitigated by any misbegotten Green New Deal.
Sometimes we can’t have the convenient case just because we wish it were so.
Clinging to an unreasonable hypothesis destroys our credibility and plays into the hands of those who dismiss us as science deniers.
michel,
You must be a mind reader. I was about to write this same comment. The alarmists all get caught up in the trap thinking that the earth, including the atmosphere, never changes. So if there is a measured change, it must be due to man. If we shut down the economies of the world completely, the Mauna Loa CO2 data would probably not even show a blip. Rich and Loydo would do well to read some of the great Greek literature about hubris.
Rich,
On the Australian ABC program Q&A in May last year, David Karoly appeared to rebut the assertion that Alan Jones, Radio Announcer and Sceptic had made.
Jones has mounted a “ trace gas” argument in saying Australia produced 1.2% of humankind’s 4% emissions of the Mauna Loa figure and why should we bother with emission reductions when the effect would be minuscule.
Karoly said effectively that ALL of the emissions of CO2 for the last century were human caused (and not just that more than 50% since 1950 were anthropogenic (AR5 claim)).
This is based on a long residence time for CO2 in the atmosphere, I assume.
However he would strongly support your contention on mass balance etc.( as does Loydo here).
Thankfully as you acknowledge, CO2 is a benefice for the world.
As the late Bob Carter wrote in “ Taxing Air”-
“The results indicate that in the recent geological past the earth has been in a state of carbon dioxide starvation compared with most of the previous 500 million years. And this is still true today, even after human sources have helped to add up to (136 ppm) of CO2 to the atmosphere.”
Herbert
Oz energy policy is absolutely delusional and suicidal. Alan Jones is making an argument about cost-benefit, and he’s spot on.
The question of how much is natural vs human-sourced is frankly not meaningful. Residence time is short, sinks can’t distinguish natural-sourced CO2 from human-caused. We emit more than twice the amount that is being accumulated. The natural sources dwarf the human-caused sources, therefore the vast proportion of the actual CO2 molecules currently in the air entered the air from natural sources.
This is a point that bears careful thought and what I just wrote, easily misleads many a skeptic. The relevant question is how far is the system out of equilibrium, not how much of the CO2 currently in the air came from our fossil fuel burning.
Physical processes do not occur instantaneously. When we emit more than the sinks can absorb, CO2 in the atmosphere gets out of equilibrium with CO2 in the ocean. When we do this continuously, we increase the mismatch, creating an ever-increasing “driving force” which actually speeds up the sinks. That is why no matter how much we emit, the sinks dynamically increase to absorb a large portion of it. Although the natural exchange quickly sequesters most of the actual CO2 molecules that we emit, they are replaced with CO2 from natural sources and the mismatch/disequilibrium remains. We are responsible for some large part of the deviation from equilibrium.
The only way to halt the rise in atmospheric CO2 is to let the system catch up.
What equilibrium? Since when has any aspect of our planet been in equilibrium?
Didn’t say it’s ever been in equilibrium. It’s always away from balance and to that extent there’s a driving force toward balance.
Rich,
Thanks. It has taken me a while to grasp your point but I believe you are right.
On residence time, the issue is indeed controversial. Freeman Dyson thought it was some 12 years and had a well known debate with Lord May who argued for the IPCC position of 200 years.
But that is not the central issue to your post as you remark.
How far is the system out of equilibrium?
I trust this is on point.
Dr. Roy Spencer says in “ Global Warming Skepticism for Busy People”-
“Many Scientists claim that the cause of global warming is obvious and can be found in basic physical principles.If basic physical principles can explain all of the global average warming, as the climate consensus claims, then how do we account for the following.
All of the accumulated warming of the climate system since the 1950s, including the deep oceans ,was caused by a global energy imbalance of one part in 600; yet modern science does not know, with a precision approaching one part in 100,ANY of the natural flows in and out of the climate system.
It is simply assumed that the tiny energy imbalance – and thus warming -was caused by humans.”
In Chapter 1.1 “ Not all science is created equal”.
Thanks Herbert
Maybe I didn’t make clear (because of an already way too long comment), that nothing I have posted on this article relates to the slightest concern about possible warming by human-induced CO2 emissions. I think that ECS is probably 1.34-1.67, far too low to become a problem.
I accept that CO2 increases the optical depth of the atmosphere which has the effect of reducing the cooling of the surface at night. Just like working out in a rubber suit, if heat doesn’t escape, skin surface temperature needs to rise.
My purpose has been to convince people on “my side” not to use false arguments that can be used to dismiss us and ignore our correct science. I am most of all concerned that without valid scientific evidence and theory, politicians are leading us over a cliff.
At least one major error: your statement “It is only affected by human emissions to the extent that human emissions increase atmospheric concentration, driving the partial pressure of CO2 in the atmosphere out of equilibrium with the partial pressure of CO2 in the ocean. (the forcing)”
When CO2 enters the world’s oceans, trying to achieve equilibrium per Henry’s Law of partial pressure, the vast majority of the CO2 changes state into both carbonate and bicarbonate ions . . . most of it does NOT remain as dissolved CO2 for very long*. And, to first order, this process is NOT in reversible equilibrium in nature.
Furthermore, many oceanic plants and animals use the bicarbonate to form calcium carbonate shells. When these organisms die, some of the bicarbonate is returned to the water, but a lot of it settles down to the sea bed. This process locks up, for long periods of time, carbon that originated in carbon dioxide in the atmosphere.
Due to this natural breakup of CO2 gas into carbonate and bicarbonate ions, it is a fair statement to say that the world’s oceans are not—and likely never have been—at an atmospheric CO2-to-dissolved CO2 concentration equilibrium implied by Henry’s Law.
*”Dissolved carbon dioxide in the ocean occurs mainly in three inorganic forms: free aqueous carbon dioxide (CO2(aq)), bicarbonate (HCO3−), and carbonate ion (CO32−) . . . The majority of dissolved inorganic carbon in the modern ocean is in the form of HCO3− (>85%) . . .” (in particular, see Figure 1 of this reference)—source: https://www.soest.hawaii.edu/oceanography/faculty/zeebe_files/Publications/ZeebeWolfEnclp07.pdf
Gordon,
You are certainly correct about the buffering reactions in the ocean. I was diverted into this rathole of trying to address specific mechanisms of specific sinks. While you point out a better understanding of how the ocean sinks carbon compounds, it doesn’t touch the main point that we emit more to the atmosphere than the amount accumulating in the atmosphere, therefore there must be a net sink after considering every other source and sink.
Rich, have you considered that maybe our estimates of carbon sinks and emissions are not nearly as accurate as you think? Have you considered the greening of the Earth seen by satellites? Do you really think the bucket with holes in the bottom is a good analogy for the atmosphere?
Gordon A. Dressler June 7, 2020 at 10:39 am
At least one major error: your statement “It is only affected by human emissions to the extent that human emissions increase atmospheric concentration, driving the partial pressure of CO2 in the atmosphere out of equilibrium with the partial pressure of CO2 in the ocean. (the forcing)”
When CO2 enters the world’s oceans, trying to achieve equilibrium per Henry’s Law of partial pressure, the vast majority of the CO2 changes state into both carbonate and bicarbonate ions . . . most of it does NOT remain as dissolved CO2 for very long*. And, to first order, this process is NOT in reversible equilibrium in nature.
Actually it IS reversible
CO2 dissolves in water and reversibly forms carbonic acid:
CO2 + H2O ⇋ H2CO3
which reversibly forms bicarbonate:
H2CO3 ⇋ HCO3^- + H^+
which reversibly forms carbonate:
HCO3^- ⇋ CO3^2- + H^+
In seawater this results in the Bjerrum plot:
https://en.wikipedia.org/wiki/Bjerrum_plot#/media/File:Carbonate_system_of_seawater.svg
If the temperature increases then some CO2 leaves solution and the equilibria shift accordingly.
Thank you for the ideal, theoretical chemical equilibrium equations. However, I specifically noted that “to first order, this process is not reversible in nature”.
The obvious reasons are:
1) There is a depletion in the concentration of the bicarbonate (HCO3-) ions by marine life forms using this ion to form calcium carbonate shells, so that the equilibrium concentrations you imply in your reversible chemical equations are not, in fact, sustained over time.
2) Most importantly, since sea water is naturally basic (typically, and on average, in the range of 8.1-8.2 pH (see https://www.epa.gov/ocean-acidification/understanding-science-ocean-and-coastal-acidification ), there is a distinct unavailability of H+ ions in the actual “equilibrium” conditions in the world’s oceans, unlike what your theoretical equilibrium chemical equations imply . . . you would have seen this clearly if you had actually consulted Figure 1 of the article for which I provided the link (it is the full Bjerrum plot that shows the rolloff in H+ concentration as pH approaches 7.0 . . . but the Bjerrum plot for which you provided a link does NOT show the change in H+ ions). Since H+ ions are not readily available in solution in ocean water, your last two “reversible” equations are factually wrong to describe ocean water chemistry, even though they look nice (a typical result of the real world overriding the theoretical world).
In terms of oceans outgassing dissolved CO2 gas upon slight warming from actual “equilibrium” conditions, it will be minuscule, as the Bjerrum plot shows . . . very little of CO2 absorbed from the atmosphere remains as gaseous CO2 dissolved in ocean water.
Gordon A. Dressler June 10, 2020 at 9:00 am
Thank you for the ideal, theoretical chemical equilibrium equations. However, I specifically noted that “to first order, this process is not reversible in nature”.
Those are the actual, real chemical equilibrium equations which have been accurately tested and quantified and are followed.
The obvious reasons are:
1) There is a depletion in the concentration of the bicarbonate (HCO3-) ions by marine life forms using this ion to form calcium carbonate shells, so that the equilibrium concentrations you imply in your reversible chemical equations are not, in fact, sustained over time.
And if that happened then the concentrations shift until the equilibrium is restored (Le Chatelier’s principle).
2) Most importantly, since sea water is naturally basic (typically, and on average, in the range of 8.1-8.2 pH (see https://www.epa.gov/ocean-acidification/understanding-science-ocean-and-coastal-acidification ), there is a distinct unavailability of H+ ions in the actual “equilibrium” conditions in the world’s oceans, unlike what your theoretical equilibrium chemical equations imply . . . you would have seen this clearly if you had actually consulted Figure 1 of the article for which I provided the link (it is the full Bjerrum plot that shows the rolloff in H+ concentration as pH approaches 7.0 . . . but the Bjerrum plot for which you provided a link does NOT show the change in H+ ions). Since H+ ions are not readily available in solution in ocean water, your last two “reversible” equations are factually wrong to describe ocean water chemistry, even though they look nice (a typical result of the real world overriding the theoretical world).
Wrong, since one of the axes is pH it’s not necessary to plot H+, also H+ is one of the terms in the equilibrium equation.
In terms of oceans outgassing dissolved CO2 gas upon slight warming from actual “equilibrium” conditions, it will be minuscule, as the Bjerrum plot shows . . . very little of CO2 absorbed from the atmosphere remains as gaseous CO2 dissolved in ocean water.
Not true, for example freshwater under an atmosphere of 350ppm CO2 the CO2 content of the water will be 1.18 × 10⁻⁵ mol/l, [HCO3-] 2.23 × 10⁻⁶ mol/l, [CO3–] 5.60 × 10⁻¹¹ mol/l.
Combining the equilibrium equations yields a cubic equation in terms of [H+], however since the [CO3–] is negligible wrt [HCO3-] the equation can be reduced to a quadratic.
[H+]^2 = 10^14 + Kh*Ka*pCO2/kh
Kh is the equilibrium constant for the hydration reaction,
Ka is the equilibrium constant for the dissociation reaction
kh is the Henry’s Law coefficient
[H+]^2 = 10^14 + Kh*Ka*pCO2/kh
Kh is the equilibrium constant for the hydration reaction,
Ka is the equilibrium constant for the dissociation reaction
kh is the Henry’s Law coefficient
Should be [H+]^2 = 10^-14 + Kh*Ka*pCO2/kh
of course.
Your calculations are incorrect. Yes human emissions exceed the increase in CO2 but then natural emissions exceed the increase by many more times the human CO2. So why assume all the increase in CO2 is human derived not natural. I suggest you look up the work of DR Edwin Berry. He explains all this much better than I can here. https://edberry.com/blog/climate-physics/agw-hypothesis/human-co2-not-change-climate/ . If we were to stop all man made CO2 emissions today in 4 years time we would be at 382ppm based on IPCC 2017 figures. That is assuming no increase in natural input. CO2 level would not go below this number. In fact would be higher as natural inputs have been increasing.
I must have mentioned that natural emissions far exceed human-induced emissions five or six times already Michael. But natural sinks exceed natural emissions. Go review the actual calculations and respond there if you see an error.
You numbers are near enough but you left out the alternatives and went straight for the preset answer like all greens do ….. humans must reduce emissions.
Your own answer told you there are other choices
1.) Reduce Natural emissions
2.) Increase Natural sinks
3.) Create new sinks.
4.) Remove heat from the system
The problem in climate change is that climate scientists push only one answer which people will never accept. For humans prohibitions have never worked, can you name one that has ever worked? Some may prefer that answer but it is a dead man walking solution.
The fun part about watching climate change politics is watching it ground piece by piece to inevitable failure.
LdB
I am not suggesting that at all. CO2 is good for our wellbeing. I am only banging on about us not giving alarmists an example of our side denying reality.
“Allen Stoner June 6, 2020 at 2:29 pm
Seems like no matter what we do the CO2 goes up linearly…”
Loydo will be along any minute now to say that the rate of increase in CO2 is exponential.
Allen Stoner
that is beautifully simple and concise. Just right for a dumb layman like me to understand.
I really wish more scientists would express their finding in a concise, straightforward manner, as there is a global population of 90% of people without a higher science qualification.
The climate debate won’t be won by ‘the science’. It will be won by votes. I just wish the sceptical community would realise this, stop pontificating amongst it’s science Guru’s and get on with communicating with the laymen.
My only question arising from your illustration is, where is the CO2 coming from as a steady, relentless increase in the atmosphere.
Maybe they should start the CO2 graph at the end of the little ice age, which they are also trying to eliminate. Or maybe 150 years before the end of the LIA, so we could see that drop and increase. There must be ‘some’ way to do that legitimately, not necessarily tree rings, which are subject to wet seasons, dry seasons, etc.
I know that Co2 follows temperature, not the other way around. It has been demonstrated over and over, but believers eyes gloss over when it is mentioned. But, but, Co2 causes temperature to rise, regardless of what past history shows…
Ya can’t have it both ways!!
I like the idea that the modern rise in atmospheric CO2 is driven by warming oceans and Henry’s law. There’s just this tiny problem.
If I understand it correctly, you think that CO2 levels should have gone down during ”the hiatus” and that the absence of such observation would disprove the theory of higher temperatures controlling atmospheric CO2-concentration in accordance with Henry’s law. I have had the same difficulties with the period 1940-80 when global temperatures dropped. The explanation is that CO2 from natural sources did fall due to temperature but since man-made CO2 was heavily on the rise during those years and thereby ”masking” the decline we failed to see it.
The histus concerned athmospheric remperatures and not SST.
COVID-19 shutdowns and lock-downs were just the trial run for what the Elitist Left, armed with their climate religion divinations and prophecies, envision for all of us. Sort of like Montreal Protocol was the Trial run for the UNFCCC COP process.
Empty store shelves. Tens of Millions thrown out of work overnight. Governors and mayors allowed to get away with ignoring the Constitution’s Bill of Rights and the 14th Amendment in the US with simple Executive-order “emergency declarations.”
Entire sectors of the economy like travel, tourism, cruise line industry, entertainment, sporting event, concerts, … all shutdown for maybe half a year (or more) is just a conservative guess.
All based on flawed models from “experts.” Exactly like the GCM’s from the climate dowsers.
Joel,
I certainly agree that the Montreal Protocol was propped up by crony capitalists who were probably in a symbiotic relationship with politicians like Al Gore and environmentalists trolling for donations, as well as (pseudo-) scientists looking to build their careers. But I can never endorse the concept of an actual conspiracy spanning hundreds or thousands of people. Everyone involved was pursuing their individual interests independently. I very much doubt that there were ever any secret strategy meetings that envisioned the up-and-coming conspiracy to target CO2. Yes, politicians sometimes made speeches at meetings with environmentalist to the effect that pushing global warming would advance socialism, or whatever, but that just reveals their own incentives. It doesn’t confirm that there is some secret society that meets to plot the takeover of the world.
The UNFCCC COP process is just like the Montreal Protocol. Crony capitalists making campaign contributions to politicians who get to champion something that profit-seeking (or capitalism-destruction-seeking) environmentalists market to gullible voters. Scientists get to build comfy careers as long as they keep pumping out proof that the threat is real and OMG, worse than we thought! You do not need to posit a grand conspiracy to see all of those players seeking their own interests independently and seeming to be in active collusion.
You can also make reasonable claims that opportunist crony capitalists, politicians, radical activists, and connected scientists are trying to exploit any of the other crises that we are going through today. I won’t say it’s crazy to think that some pharmaceutical companies would badmouth HCQ to prevent the loss of a potentially lucrative market for patented drugs. I won’t say it’s crazy that those companies might make political contributions to politicians or pay grant money to scientists and bureaucrats who may be in a position to cast doubt on the efficacy of HCQ. I won’t say that some politicians would see it in their interest to reinforce claims that HCQ is ineffective because it makes Trump look bad (rather than being in on the deal with the pharmaceutical companies). I have no doubt that the Democrats might seek to tank the economy to put Trump at a disadvantage. I won’t say that Antifa and other radical groups are not trying to destabilize the country by highjacking peaceful and legitimate protests.
I just won’t say that they are all meeting at some convention center to agree on their conspiracy.
I also won’t say that I’m certain about any of those things, although it is pretty clear that there are some people who know that they are acting in bad faith, some who have rationalized that they believe because it benefits them, and many who are sincere but duped.
Why do I bother to write this? Because I think it hurts the credibility of all skeptics when some of us talk about Elitist conspiracy theories. Yes, there is a Swamp. It is a guild of self-interested elitists, but they are not in a grand conspiracy.
Read the Climategate emails then claim there was no conspiracy. Just because everyone was not in the same room does not mean it was not a conspiracy. Your correct it is not hundreds of thousands of people. It is a small number of scientists in a conspiracy. A small number of beaurocrats at the UN. A small number of crony capitalists like AL Gore. Then you have a large number of rent seekers and opportunistic parasites, eco warrior enviromentalists, malthusians, socialists, virtue signalling businesses etc jumping on the bandwagon because it has some appeal to them, some benefit to be had.
Not entirely inconsistent with what I said. There probably were some Malthusian socialist cranks who dreamt up some of the themes and tried to popularize them. Probably more than one group of them. Then more and more groups saw opportunity knocking and glommed on, but not cooperating formally as partners at least in most cases.
We should not discount honest error by disinterested parties who were acting in good faith and are still acting in good faith. How many of them are likely to say oh you’re right! Now I see the error of my ways. You got me when you pointed out that I’m an anti-human parasite on society. What do you think?
It’s going to wind up just like the 20 year hiatus in global warming. They will throw out all kinds of excuses why the models didn’t track it. “The heat is hiding in the deep ocean” with nary an explanation of how it got there other than by a cloaked Enterprise in orbit “transporting” the heat into deep ocean.
It will be the same with no change in the rate of the CO2 concentration.
Smoke and mirrors and data manipulation. They will fight tooth and nail to keep the money flowing!
I predicted this without benefit of computers.
Well, this is not very convenient, this pesky CO2 molecule. As a preview of the Green Weenie Deal the quarantine/shutdown was traumatic, now we see, re CAGW, no impact. Wonder what the restructure civilization mob will turn to next? Disband police? No, that would be stupid, wouldn’t it?
“(assuming no substantial natural variations in CO2 sources and sinks).”
There you have it! Equilibrium between the atmosphere and oceans as far as CO2 is concerned is very quickly achieved. I’ll explain this in the paragraph below but first, a couple of years ago I was at one of my daughter’s family’s dinner and they had a recent gadget that uses a CO2 capsule to carbonate drinking water. I wanted to try it. I put the bottle into place and pulled down the handle and asked how long do I hold it. She said, oh, its basically done immediately. This blew me away. This gas is almost infinitely more soluble ratewise in water than salt or sugar or whatever! No stirring required.
Now for CO2 and the lockdown. Since the ocean has been heating since the exit from the depths of the Little Ice Age, CO2 has been evolving from it into the atmosphere. Since man began in earnest emitting CO2 in significant quantities from ~1950s, this increase in its partial pressure above the ocean has served to inhibit the rate of evolution of old CO2 from sea commensurate with continued heating. Now, takeaway the human emissions and the ocean plays catch-up and fills in for the missing new CO2. Simply, if we don’t emit, then the ocean can speed up its enrichment of the atmosphere. One other thing. Solution into the sea is quick, while evolution the other way is somewhat slower (have to build up bubbles, they have to rise to the surface and break).
Your observation may be correct but are almost in a completely different regime compared to atmosphere/ocean. I would disagree that equilibrium is very quickly achieved between ocean/atmosphere, other than at the surface.
Your soda device uses essentially pure CO2 injected under pressure into a relatively small vessel. The injection actually creates turbulent mixing throughout the entire vessel. For dissolution of solids, of course solubility plays a more important role and dissolution is a relatively slow process compared to gases.
I generally agree with your second paragraph except that bubbles are not required for exchange of molecules from the liquid to gas phase and back and forth. Surface diffusion is actually quite fast. Of course, wave action that creates bubbles would speed bulk mixing.
The bubbles effectively increase the surface area. They also give access to water that is not at the surface.
Gary
You remarked, “No stirring required.” It is the high pressure that drives it into solution quickly. The pressure replaces the mechanical agitation us required at STP.
Gary
You said, “Now, takeaway the human emissions and the ocean plays catch-up and fills in for the missing new CO2.” I think that you have hit the nail on the head exactly!
Gary,
First of all, we emit about 0.6% of the total CO2 in the atmosphere each year. Not emitting it means that the partial pressure in the atmosphere will be 99.4% of what it was the prior year. Think of a tall pipe that has a small hole at the base, submerged in a pool of water. At equilibrium, the water level in the pipe will be the same as the water level in the pool. If you have been filling the top of the pipe at a rate slightly greater than the rate that water can flow out the hole at the bottom, then the water level in the pipe will rise. If you stop filling the pipe, will the water reverse direction at the hole and fill the pipe back up? Of course not. The water continues to flow through the hole from the pipe into the pool until the level in the pipe drops to the level in the pool.
It is the difference between the partial pressure of CO2 in the bulk atmosphere and the partial pressure of CO2 in the boundary layer of the ocean that is the driving force. There is virtually instantaneous equilibrium between the boundary layer of air at the ocean interface and the boundary layer of water at the ocean interface, especially if both fluids are turbulent. But there is no such instantaneous equilibrium between the bulk of the atmosphere and the bulk of the ocean, nor even between the bulk of the atmosphere and the boundary layer of water at the ocean interface.
Of course it is also an abstraction to talk about a global average. The physical reality is that in some places there is CO2 poor water that has cooled as it flows from the tropics to the poles and it has a strong driving force for CO2 in the atmosphere to dissolve into the water. In the tropics where upwelling currents bring up CO2 rich water (your old CO2), there is a strong driving force from the water into the atmosphere as the sun warms that water.
Ultimately you do not address the mass balance. How can we emit more than twice the amount of CO2 than the rate that CO2 is accumulating in the atmosphere, without the increase being due to our emissions?
In its current state of 170 years of accumulated disequilibrium, the system has a net driving force into the ocean and other sinks on average over the globe and over the year. (The water level in the pipe is substantially higher than the water level in the pool). If we stop emitting for a year, there is still 169 years of accumulated disequilibrium (the water level in the pipe is still higher than the water level in the pool). I’m not saying that all the CO2 ever emitted is accumulated (a lot of the water that you poured into the pipe flowed out the hole at the bottom, but enough of it accumulated to raise the level in the pipe above the level in the pool). I’m saying that some of the CO2 doesn’t get absorbed (current situation is 42%). When you then continue emitting, the level only builds. When you stop or slow down emissions, the level will potentially be able to draw down. The net sink will never reverse to a net source until the driving force is reversed, i.e. until the ocean has too much CO2 relative to the atmosphere at its current temperature (solubility). This would be as if we stopped filling the pipe and started filling the pool so that the level in the pool would now be higher than the level in the pipe. Only then will the water flow through the small hole into the pipe.
But it’s more complex even than that because the many sources and many sinks are not in sync over the course of the year. Sometimes in some places there is net emission. Sometimes in some places there is a net sink. Some times of the year there is net sink globally and falling CO2 levels globally. At some times of the year there is net source globally and rising CO2 levels globally. So the Keeling curve oscillates. On average spatially and temporally there is currently a net sink. The mass balance demands it.
How can we emit more than twice the amount of CO2 than the rate that CO2 is accumulating in the atmosphere, without the increase being due to our emissions?
If we would emit no CO2 at all, and we can’t prove what will happen then, CO2 could also rise in the atmosphere exactly as it’s now. Why not?
Rich,
How would it affect your analysis if all human CO2 emissions were absorbed locally by vegetation (since CO2 is heavier than air) whilst the entirety of the observed increase were attributable to outgassing from sun warmed oceans as a result of the observed reduced global cloudiness of the late 20th Century ?
There is some evidence in favour of that proposition which I discussed here :
https://www.newclimatemodel.com/evidence-that-oceans-not-man-control-co2-emissions/
Michel asked me this in a way. Your hypothesis is that the partial pressure of CO2 in the ocean is actually higher than the partial pressure of CO2 in the atmosphere. I don’t know how to prove that wrong from empirical data that I can reference, but I would need you to demonstrate the fact before I’d consider it because it’s counter-intuitive. The oceans are only slightly warmer than when atmospheric CO2 was at 280 ppm.
Your comment about CO2 being heavier than air is only partly correct. Yes, CO2 is heavier than nitrogen, oxygen, argon, and water vapor. But it is completely miscible in air and diffuses throughout the atmosphere. It does not stratify. We see local variation near sources because diffusion is a physical process that is not instantaneous.
Although it is not instantaneous, it is relatively fast. I suppose that you are describing the complexity of one of the many natural sinks. In other words, trees and crops don’t experience the global average CO2 level, they experience local concentration subject to diffusion rates, mitigated by winds. In still conditions and sunny skies, without nearby sources, CO2 can be temporarily depleted. It’s possible in such conditions that a nearby large human-induced source could replenish CO2. But to imagine that all human-induced sources are fully utilized by plants creating carbohydrates locally is not a reasonable hypothesis.
The ole ‘well mixed’ argument again. Sorry, I cannot accept that.
Virtually ALL of the CO2 comes from the surface. Virtually ALL of the CO2 goes back into the surface, whether by plants, ocean or whatever. The atmosphere is densest at the surface. CO2 is a heavier gas than most others in the atmosphere. There are CO2 ‘domes’ around large cities.
So, I cannot be convinced that the atmosphere at 20000 feet has the same 400ppm as that at the surface. How would it GET THERE? And then, how would it GET BACK to the surface??
It’s only an ‘ole argument’ because it’s been demonstrated repeatedly. It gets there by diffusion. I recognize that you won’t agree so there’s no more to say.
Rich,
I am enjoying your input to this discussion, but I do not think that you have addressed the very reasonable question by Stephen.
“But to imagine that all human-induced sources are fully utilized by plants creating carbohydrates locally is not a reasonable hypothesis.”
Why? How do we know that? We do know that the diurnal variations even in the cities are largely if not totally cancelled out every single day by photosynthesis (or some other mechanism) so please tells us how much of the local emissions do we know are able to ‘escape’ into the free troposphere and what is the evidence for this.
Jim,
Some of the human emissions must be sequestered near the source. Some of the natural emissions must be sequestered far from the source.
I need to give it a rest. The hypothesis that there are independent atmospheric systems, one where local biomass consumes any and all human emissions and another dominated by I suppose primarily the ocean just doesn’t pass the smell test. How is this isolation established and maintained?
If any and all human emissions would be “consumed” how do the trees know to stop? How do they know which molecules to leave behind because they are not fossil fuel CO2? If we didn’t burn any fossil fuel what would they do? How did they exist before we started burning fossil fuels? Do they have some kind of setpoint that makes them stop when they hit the Mauna Loa reading? Do they each have their own IP address?
What about airplane emissions, ships on the high seas, and large power plants with very tall smokestacks? Emissions in deserts and over glaciers? How do they know to get to land biomass to be consumed independently?
Literally nobody is willing to address the simple mass balance formula and give me an answer about how it can be invalid, except by either denying conservation of mass, or invoking separate independent atmospheric systems.
Rich
You said, ” It does not stratify. ” While it rarely does so, it can when it is abundant.
Rich, your mechanical analogy is clever, but not complete enough because chemical has more degrees of freedom. Lets look simply at the CO2 exchange in a different experiment.
1) The ocean has been net outgassing since the LIA driven by the warming from that time.
2) Suppose we jacked up CO2 in the atmosphere suddenly to 4000ppmv. We would pretty quickly, with this spread evenly over the oceans, stop the net outgassing and reverse the ocean CO2 situation to net ingassing.
3) Now suddenly, remove 3590ppmv CO2 from the atmosphere. Ocean again evolves net CO2 pretty much the same as last year. So lets remove 2ppmv more and what happens qualitatively.
4) Now you can argue that it wouldnt be instantaneous. But the measurable change from the cessation of emissions during Cov19 benefits from the same argument. However in whatever time, the ocean fills this gap.
5) Now, lets reduce CO2 to McKibben’s 350ppm. With the reduction of the partial pressure on the ocean’s surface, this atmospheric loss has to effect a change in outgassing on average and, in whatever time, would replace a goodly measure of the quickly removed atmospheric CO2.
We’ve had significant warming up to the end of the last century so outgassing is going to continue to increase for some time (modulated ever so slightly by human emissions).
Let’s stop at #1
If when looking at the whole ocean over the course of the entire year, the ocean is a net source, then by my own logic, you are correct.
Let’s not get confused about some parts of the ocean being net sources all the time while ignoring the parts that are sinks all the time, and those that are sinks some of the time and sources some of the time.
I would be surprised if the tropical ocean is not a net source even when there is a significant imbalance with excess CO2 in the atmosphere. The net zero line would shift toward the equator when the excess is in the atmosphere and toward the poles when the excess is in the ocean.
We both assume that the whole ocean is not in equilibrium with the atmosphere, but your assumption is that that is because the surface water is warmer than in 1850 and the CO2 in the surface water is at a concentration corresponding to a partial pressure significantly higher than the current partial pressure of CO2 in the atmosphere. My assumption has been that at some point in the modern era the balance shifted from excess pp in the ocean, which I agree must be true going from LIA to warmer SST in the absence of significant human-induced emissions, to excess pp in the atmosphere despite warming SST, due to human-induced net emissions to the atmosphere.
How do we check who is correct?
If there was a major change in source(s) from predominantly ocean to predominantly fossil fuels, that should show up as a significant net change in the atmospheric 13C/12C (δ13C) values for the incremental CO2. This can be investigated in more detail using the Keeling plot analysis, provided that you are prepared to accept the Law Dome ice core data for values prior to the late 1970s. For a comparison of long term averages, you can use the mass balance calculation for 13C between the widely-accepted pre-industrial values of 278 ppmv and -6.4 per mil, and early direct observations (334 ppmv and -7.50 per mil), and between these latter values and recent data (404 ppmv and -8.44 per mil). Observations are from https://scrippsco2.ucsd.edu/data/atmospheric_co2/spo.html.
Average δ13C between 1765 and 1979: ((334*-7.50)-(278*-6.4))/(334-278)= -13.0 per mil
Average δ13C between 1979 and 2018: ((404*-8.44)-(334*-7.50))/(404-334)= -12.9 per mil
There is a very minor approximation in the above calculations due to treating 12C as equal to total CO2, but this has no material effect because 12C is 99% of CO2.
Using the intermediate data to fill in the gaps between the three data points shown above, Keeling plots for Law Dome and for the observations at the South Pole both show strong linear relationships between 1/CO2 and δ13C indicative of a consistent net 13C/12C ratio over time for the incremental atmospheric CO2 with δ13C of -13.1 per mil (r-squared 0.96) and -13.0 per mil (r-squared 0.99) respectively.
For anyone unfamiliar with the terminology of δ13C, it is the 13C/12C ratio relative to a standard value. So, negative values mean the the observed ratio is lower than than standard ratio. The units “per mil” are as for % excpet that they represent per 1000 instead of per 100.
Sorry for the typos.
For anyone unfamiliar with the terminology of δ13C, it is the 13C/12C ratio relative to a standard value. So, negative values mean that the observed ratio is lower than the standard ratio. The units “per mil” are as for % except that they represent per 1000 instead of per 100.
“How can we emit more than twice the amount of CO2 than the rate that CO2 is accumulating in the atmosphere, without the increase being due to our emissions?”. Because the natural emissions are many times greater than our emissions. Therefore the bulk of the increase in CO2 accumulation must be due to natural emissions. If our contribution to total CO2 input is only 4% then our contribution to any increase in CO2 can only be 4%. Suggest you read DR Edwin Berry. https://edberry.com/blog/climate/climate-physics/human-co2-not-change-climate/
Pfffft! Are we back to the old Global Warming canard!? Sheesh!
Are there any Mauna Loa type graphs that keep track of the amount of atmospheric CO2 which is comprised of only Carbon-14? — and would there be any way of untangling man-caused sources of such atmospheric CO2 molecules from natural sources of the same? — or is the prevalence of Carbon-14-based CO2 too minute to be a reliable tag? (a molecule or two out of 10^12)
What about Carbon-13?
Yeah: https://scrippsco2.ucsd.edu/graphics_gallery/isotopic_data/global_stations_isotopic_c14_trends.html
Carbon-14 is assumed to be all natural, except for that generated by weapons testing, though a decline in C14 and C13 is believed to support that the increase in CO2 is anthropogenic. C12 is higher in fossil fuels because the life that was the precursor to these fossil fuels favored C12. Fossil fuels don’t contain any C14 because it’s decayed away.
“The Mauna Loa atmospheric CO2 concentration data continue to show no reduction in the rate of rise due to the recent global economic slowdown. This demonstrates how difficult it is to reduce global CO2 emissions without causing a major disruption”
No. It is because atmospheric composition is not responsive to fossil fuel emissions.
And since that assumed responsiveness is the fundamental basis of agw climate change and climate action, it further shows that no empirical evidence exists to support the assumed ability of humans to change atmospheric composition.
And yet that assumed ability of humans is the only basis of the theory of AGW climate change and the call for climate action to fine tune global temperature.
All of that stuff is a statistics fairy tale.
https://tambonthongchai.com/2018/05/31/the-carbon-cycle-measurement-problem/
https://tambonthongchai.com/2018/12/19/co2responsiveness/
This comes as absolutely NO surprise to me.
Here is a good place to start to understand the issue. About forty percent of all human emissions in the NH occur between December and February, and yet the CO2 charts for Cold Bay Alaska flatten out over that period. Look at the wind direction from East Asia straight into that region.
No one bothers to explain this fundamental issue. Until they do all other carbon cycle comment is wasted.
Martin,
What is 100 – 99?
Is 100 < 1?
Think about it. All the sinks and all the sources are out of sync. It's like checking voltage across two phases. Sometimes they reinforce, sometimes they cancel out.
In my thought experiment above, 100 represents human emissions and 99 represents natural sinks to the cold ocean. You want to say that 100 is irrelevant just because the net effect is small after a similar but opposite affect is acting at the same time.
Those numbers are a bit misleading.
AFAIK human emissions account for just a few percent (say 4%) of the total. The rest is natural emissions (say 96%). The natural sinks take up all or most of that (cutting trees for biomass doesn’t help there, not sure how noticeable that is). Currently less is taken up than emitted each year.
The COVID episode seems to confirm that even the seasonal fluctuations are larger than any human emissions.
The (unproven) claim is that the delta between emissions (all: human + natural) and (natural) absorption is always caused by humans. Given that natural emissions & absorption are much larger than human effects, that sounds a bit unlikely. We can’t even see the dip of almost a fifth of yearly human emissions in the charts.
Also when left alone nature seeks equilibrium by increasing sinks: more CO2 is more tree & plantgrowth is more absorption. It is (indirectly) claimed that this doesn’t happen, when in fact it did, or that it’s too small or too slow to noticeable at this moment. Call me a skeptic.
Are human emissions just a rounding error?
I think that I have exhausted my bag of analogies to try to get people to think about the mass balance. Please read my main comments and respond to them if you wish.
The numbers in this response to Martin weren’t intended to be actual data. The point was that all the sources and all the sinks net to some amount. If human sources happen to coincide with a time that there is a net natural sink, then the overall picture is flat.
If natural sources were 10000 +/- 30 and natural sinks were 10000 +/- 50, while human sources are 10 +/- 0.5 then sure human emissions are in the noise and hard to detect whether they went away.
But in the end if you KNOW you put in more than the amount that accumulated, even though you don’t know every detail of the sources and sinks, how can you reconcile the mass balance without admitting that we caused the net rise?
If CO2 responds to temperature, which has been shown to be true numerous times, then this whole mass balance thing is meaningless. It has been warming since the end of the LIA. CO2 was not flat during that time, it too has been following the warming.
You can’t say CO2 causes warming and say warming causes more CO2. Only one of those can be correct. But it can also be neither, thus something that we don’t understand yet. But Co2 has been many times higher than it is now, (8000 ppm) and everything survived just fine.
The fact that increased CO2 makes plants grow better proves that we are in a CO2 deprived state. We used to keep our greenhouse at about 1200 ppm. Plants grew like crazy. And it didn’t bother me to work in the greenhouse either. All this handwringing and wasted money over the paltry amount of CO2 in our air is totally dumbheaded.
“You can’t say CO2 causes warming and say warming causes more CO2. Only one of those can be correct. ”
No, they are both correct.
John Shotsky June 7, 2020 at 10:17 am
If CO2 responds to temperature, which has been shown to be true numerous times, then this whole mass balance thing is meaningless. It has been warming since the end of the LIA. CO2 was not flat during that time, it too has been following the warming.
Except that warming only causes ~15ppm/1ºC increase so this is inadequate to explain the increase. It would still require a mass balance in any case. Rich’s analysis is correct, I’ve presented similar ones here before. According to Jaap “The (unproven) claim is that the delta between emissions (all: human + natural) and (natural) absorption is always caused by humans. Given that natural emissions & absorption are much larger than human effects, that sounds a bit unlikely. We can’t even see the dip of almost a fifth of yearly human emissions in the charts.” If that were so then some years the pCO2 would go down and some it would go up, however it goes up every year.
Because we reduced CO2 emissions owing to Covid, we expect Mauna Loa levels to show something. They don’t. Therefore there has to be some inertia in the system bleeding out more CO2. This inertia should affect the Keeling curves too, specifically the
shape of the seasonal variation curves. You can’t have this inertia—which we all guess is the ocean—maintaining the yearly Keeling curve but not affecting the shape of the seasonal curves. After all CO2 leaving our atmosphere from photosynthesis in the spring is facing the same source of
inertia as our decline in emission CO2 from our decrease in economic activity from Covid.
It would not be responsive on perhaps an annual timescale or even five years, but certainly would be over some number of years. Can you attempt to statistically derive what the anthropogenic contribution is?
Of course the alternative hypothesis is: CO2 is a trace gas in our atmosphere, hence, exerts a trace impact. Any trace alterations in CO2 atmospheric concentration, also exerts a trace effect. Which in turn means: trace reasons for causing catastrophic economic harm.
The experiment has now been performed; hence, no go. Think of something new.
Well said RiHo08, by extension a trace impact on temperature. Appears the something new for the alarmists to solve is social injustice by removing police departments instead of removing fossil fuels.
RiHo08 and Dennis G Sandberg –
Your arguments sound very logical. I used to think that way too, until I realized that the “trace” amount of CO2 was responsible for all plant life on earth, and, since animals depend ultimately on plants for food, all life on earth.
I guess natural sources of CO2 didn’t get the message.
My finding is that the role of fossil fuel emissions is not measurable because nature’s carbon cycle flows are an order of magnitude larger with uncertainties in their flow estimates thst are larger than the flow of fossil fuel emissions.
My position is not that I know the answer and it is not the same as the climate science answer and it therefore proves climate science wrong.
My position is that there is no answer because none can be detected.
Pretty much everyone should agree that burning fossil fuels emits carbon dioxide. Then, it’s a matter of what happens to it.
“Pretty much everyone should agree that burning fossil fuels emits carbon dioxide. Then, it’s a matter of what happens to it.”
Scissor, if I put a small measure of water into a bucket of water I can’t then remove that original measure of water, because I can’t differentiate it from the water that was already there. I would think that it works the same way with CO2 created by fossil fuels and all other forms of CO2, doesn’t it? They are technically the same, so whatever happens to CO2, whatever the source, will continue to happen? The question mark is because as a layman I may be missing something, or maybe I just misunderstood your comment. 🙂 Still learning.
Ignoring isotopes, I agree with your bucket analogy. Of course that is an oversimplification.
A main question is how much of the atmospheric rise in CO2 is due to human emissions? On one side, the alarmists say all of it. In reality, it should be some part of it, perhaps even a significant fraction. It probably isn’t discernible from year to year and over the longer term we need to know what part of the warming or cooling is natural in order to flesh it out.
Thanks Scissor, I guess that’s what my analogy was about. I understand that we have data to tell us, based on the global use of fossil fuels, approximately how much of it is from humans, or human causes. But how accurate is that estimation, and if we aren’t really sure how of how the rest of the CO2 is made up then how can we be sure of the significance of our contribution? This isn’t a physical differentiation is there?
I ask these questions so that I can give answers that makes sense to someone who has little knowledge of the science behind CAGW. Of course that’s usually people who have already been indoctrinated so it’s likely a waste of time.
What I really want to say to them is “Wake up to yourself, this is all BS and really has nothing to do with Climate. It has more to do with how easily manipulated you are!” But I have already alienated too many people so I zip it. I may as well be talking to a zombie.
This comment is somewhat rhetorical so you don’t need to respond. Unless it can add something to the conversation that is.
Or it demonstrates global CO2 is not a function of economic activity!
OOPS!!
The CO2 is coming out of the soil/dirt.
It was = Soil Organic Matter = not especially dead leaves, twigs whatever but actual bacteria
It is caused by tillage = farming / agriculture
i.e. Ploughing, paddy fielding and burning in the main. Anyform of cultivation that leaves bare soil/dirt exposed to sunlight
Also from the use of nitrogenous fertiliser which excessivly stimulates the bacteria to consume soil organics (including themselves) producing CO2 in the process.
Itis why the stomata on almost all plant leaves are on the underside of the leaves – they ‘expect’ their food to be coming up at them, not down from ‘somewhere up in the sky’
Also because nitrogen fertiliser acidifies the soil and where that soil is chalky or limestone based, that extra acidity is naturally neutralised, causing CO2 release.
If the soil is sandy or clay, lime should be added to reduce the acidity.Yet more CO2
If not, plant yeilds decline and toxic heavy metals start mobilising – which makes people unhealthy and susceptible to disease. Especially if they eat a lot of plant material.
In a way, it’s rise represents the conversion of perennial plants (forest & grassland) to annual plants (wheat, sorn, rice etc) – it represents the ever increasing production of food, as required to keep the ever increasing number of people alive. It represents the rising population.
But it is tillage that causes the observed ‘Climate Changes’
All that bare soil lying out in the sun (reduced albedo) but very much also, the reduced water holding capacity of the farmland soils due to the removal of the soil organics.
Causes what are basically Flash Floods also.
The True Definition of a desert = A place with low/zero soil organic material
Deserts have different climates from forests and perennial grasslands.
It is our creation of desert (and city-building) that’s causing the observed climate change (temp rises/changes) and also the rise in CO2.
Both those things have the same cause but, especially, the rising CO2 does not cause the rising temps nor do rising temps cause CO2
And it was the creation of desert that wiped out EVERY previous human attempt at Civilisation.
Yes The Climate Changed and took them all down – THEY changed it by tillage (ploughing, cutting burning) and overgrazing with livestock
Get a clue about conservation of mass.
You can come up with 40,000 different sources and sinks. The bottom line is that on balance the system currently has more sources than sinks and we know that our emissions account for more than twice the amount of the annual increase. It’s just basic algebra. No matter how many stories you want to tell about deserts and agriculture. The CO2 is coming from many different places, not just the soil. The CO2 is going to many different places, not just the ocean.
Rich, I think your ‘mass balance’ argument is wrong, just because human fossil fuel burning is adding twice the increase in atmospheric CO2 does not mean that it is inevitable that the latter is due to the former, that would only be true if you could demonstrate that all other causes of atmospheric CO2 change were otherwise in equilibrium. Every year for about half the year atmospheric CO2 falls precipitously (and rises again in the other half). The huge difference in the immediate gradient of the Mauna Loa curve and the trend curve demonstrate that the processes involved can massively overwhelm the driving force of increase. There are huge and multiple CO2 sinks involved linked in a series of complex equilibria, a relatively small purturbation of one or more (many of which are for instance temperature-dependent) could result in a change in the atmospheric CO2 concentration, indeed every year processes drive the increase backwards despite a constant rate of addition from fossil fuel burning. Now I am not saying that I know if any of these processes are responsible for all or part of the increase, or that fossil fuels are not, but your ‘mass balance’ argument is surely false. Incidentally I am aware that there are no actual true equilibria in the earth system, but I am not aware of a term that describes a system in transition between equilibrium states, does anyone know?
I don’t know what to say, if you don’t think a mass balance is valid. You just don’t believe in the law of conservation of mass I guess. It’s Chem Eng 101.
Probably almost all of the molecules of CO2 currently in the atmosphere were emitted from natural sources due to the low residence time and the huge mismatch between natural and human-induced fluxes. That is irrelevant. What matters is if the system as a whole nets out to be out of equilibrium. And if it is, while we also know that we put in more than the accumulation, then we are responsible for the overall disequilibrium, regardless of whether the actual molecules of CO2 currently in the atmosphere originally came from fossil fuels.
I don’t think you understood my comment, I certainly do understand the conservation of mass, it is an irrelevant point, I am not suggesting mass is created or destroyed, it is about where it goes. What you don’t seem to understand is the concept of equilibrium. The CO2 in the atmosphere is not in equilibrium, never was and never will be, if it where then it would be constant. It is subject to various dynamic equilibria, none of which ever attains equilibrium. If everything else in the system were constant, then human-added CO2 must increase the atmospheric concentration, but we don’t know that it is. I stand by my point, simply to say that because the rate of human-generated CO2 is larger than the rate of atmospheric increase then the latter must be a result of the former is false, as I said before, the concentration of CO2 can and does decrease even as human-added CO2 increases.
Jim
Kindly read some of my other posts if you think I have ever suggested that CO2 is in equilibrium. It is all about the fact that it is NOT in equilibrium (which in a highly complex dynamic system with multiple feedbacks, it can never be, just as you stated). The sources and sinks are more complex I’m sure than I’m likely ever going to have time to understand vaguely.
But “where the mass goes”is the whole nub of the question. The sum of all mass fluxes in and out of the atmosphere must equal the accumulated mass.
We can only perform this calculation meaningfully over a period of at least a year in increments of whole years, because of the seasonality. During that period many of our emitted CO2 molecules will be exchanged out for other CO2 molecules coming from natural sources. Where the specific carbon dioxide molecules that we emitted end up by the end of our “accounting period” is not relevant. What matters is the question of whether the net effect of our emissions over the period is the accumulation of some CO2 molecules in the atmosphere. CO2 is in fact accumulating.
If we emit more CO2 molecules than the number of CO2 molecules accumulated in the atmosphere, then we are responsible for the accumulation. The fact that some of our emitted CO2 was removed by natural sinks demonstrates that the net natural flux is a sink. Without our contribution the accumulation would be negative.
Incidentally I am aware that there are no actual true equilibria in the earth system, but I am not aware of a term that describes a system in transition between equilibrium states, does anyone know?
I’d term it ‘phase space’, the trajectories in the space pass around the stationary points. In the case of the CO2 trajectories the stationary point is moving over time, hence the increase over time. The nature of the trajectory depends on the nature of the stationary point.
The “conservation of mass” argument was debunked a long, long time ago. This is not an algebraic problem. It’s calculus. See my comment earlier on this page.
It should be noted that ammonia is actually basic and only produces acidity upon bacterial action. There are nitrogen containing fertilizers that don’t acidify soils.
Certainly, there are farming practices that damage soil and practices that are better for it. Organic carbon content should be conserved or improved in general.
CAGW is a scam.
One can only hope that when the AMO and PDO switch to their 30-year cool cycles and global temps start to naturally cool, despite record levels of annual CO2 emissions. this scam will finally die…
that hasn’t happened in over a century. Why do you think it will happen in future?
Izaak, Your wild guess is wrong. Here is your preferred scientists view of AMO and PDO. They admit they are robustly present in all temperature data sets, but naturally, being CO2 control knob folk they rationalize them more than other scientists.
https://climatedataguide.ucar.edu/climate-data/atlantic-multi-decadal-oscillation-amo
https://climatedataguide.ucar.edu/climate-data/pacific-decadal-oscillation-pdo-definition-and-indices
I just came across this archived interview with Reid Bryson from 2007:
http://webarchive.loc.gov/all/20070913051956/http%3A//www.wecnmagazine.com/2007issues/may/may07.html
“Climate’s always been changing and it’s been changing rapidly at various times, and so something was making it change in the past,” he told us in an interview this past winter. “Before there were enough people to make any difference at all, two million years ago, nobody was changing the climate, yet the climate was changing, okay?”
“All this argument is the temperature going up or not, it’s absurd,” Bryson continues. “Of course it’s going up. It has gone up since the early 1800s, before the Industrial Revolution, because we’re coming out of the Little Ice Age, not because we’re putting more carbon dioxide into the air.”
We ask Bryson what could be making the key difference:
Q: Could you rank the things that have the most significant impact and where would you put carbon dioxide on the list?
A: Well let me give you one fact first. In the first 30 feet of the atmosphere, on the average, outward radiation from the Earth, which is what CO2 is supposed to affect, how much [of the reflected energy] is absorbed by water vapor? In the first 30 feet, 80 percent, okay?
Q: Eighty percent of the heat radiated back from the surface is absorbed in the first 30 feet by water vapor…
A: And how much is absorbed by carbon dioxide? Eight hundredths of one percent. One one-thousandth as important as water vapor.
You can go outside and spit and have the same effect as doubling carbon dioxide.”
What Covid has really shown is that there is zero chance that the world will lower emissions on a scale to deliver what the activists say is necessary. The current economic slowdown, drastic and politically unsustainable as it is, has produced a tiny drop if any in atmospheric ppm.
To deliver the reductions the activists say is necessary would require a permanent global freeze on almost all economic activity. That is, all countries, and all fossil fuelled industry, commerce, heating, farming etc.
That means China going back to bikes and those blue uniforms. It means everyone closing down coal fired generating plants. It means the abolition of the petroleum powered transport system. It means wearing sweaters, made of wool, indoors for much of the year. It means an end to the global construction boom – stopping making concrete.
It just is not going to happen. Even were the West to do this, no-one else will.
For too long now activists have been able to get away with claiming that life could carry on as normal with zero emissions. It cannot. And they have also been able to get away with claiming that things which make minimal reductions to emissions are in some way righteous and a means to zero.
Covid should have made clear the emptiness and irrationality of both stances.
I knew it! Obviously, if the increased CO2 in the atmosphere is do to human activities, then the CO2 levels would not be still rising.
Oh well, just wait for the next “study” (computer simuation) that “proves” the real world, observed data is wrong.
The Scripps process is flawed. It removes water vapour from the original volume of air by freezing, and the data on the original ambient temperature and pressure is also removed during the process. The subsequent measurement of the CO2 content is made on the remaining lesser volume, yet it is reported as if it applies to the original full volume. The result is a hidden bias in the CO2 measurement which will vary with atmospheric humidity, temperature,and pressure changes.
It follows that the annual fluctuations in the Keeling Curve are not caused by seasonal vegetation growth and decay, but actually by seasonal changes in temperature and by changes in barometric pressure of the local ambient air.
Therefore, the Keeling Curve demonstrates that rising air temperature is the cause of CO2 increases, and not the other way round. This nullifies the CAGW conjecture.
It’s a very common practice to report concentrations on a dry basis, in fact, it improves the quality of the data because as you point out, humidity is widely variable.
Besides, analytically, water interferes with the IR absorbance, so must be removed anyway. Something to think about.
Scissor, you miss the point.
1. CO2 in the Keeling curve is shown as ‘parts per million by volume’
2. Removing the water vapour from a sample reduces the volume being measured, and therefore the content of all of the gases including CO2 is overstated in proportion to the % of water vapour removed.
4. Humidity varies with the seasons, and is shown in the ‘Keeling curve’
5. As humidity changes are the result of temperature changes, it follows that the Keeling curve is in fact a record of temperature changes, and also shows that the reported levels of CO2 follow temperature, rather than lead.
Added to my conjecture above that the Scripps process overstates the CO2 readings, and this error varies with water vapour content, it is ironic that NOAA actually admit it, and even give us a worked example!
https://www.esrl.noaa.gov/gmd/ccgg/about/co2_measurements.html
In their section “Mole fraction in dry air” they show a table of comparison between dry air and air containing a nominal 3% of water vapour (i.e. realistic air)
If you now look at the CO2 row you will see that the CO2 measure in dry air is some 3% higher than that for the wet air. In other words, their drying process causes them to over-read the actual CO2 content of real air, by the fraction of water vapour extracted from the sample.
Now, as water vapour varies with temperature, it follows that the amount of over-reading varies with water vapour content. As humidity varies with temperature, it follows that the over-reading varies with temperature.
As temperature varies with the seasons, the annual fluctuation of the Keeling Curve follows the temperature via the over-reading bias of their CO2 measurement.
It follows that changing temperature is the cause of apparent changes in CO2 in the real atmosphere, and not the other way round.
Proof is given by NOAA that the Scripps /Keeling process is an elaborate method of measuring atmospheric temperature changes
Bang goes the whole CO2 scare.
Up next: Greta and Antifa co-opt BLM movement for the environment.