
Guest essay by Eric Worrall
Even worse than we thought ™ – global warming estimates have been raised, just in time for next year’s COP26 conference. But one of high end CMIP6 models, CESM2 (highlighted above), has already been invalidated by a paleo study.
Just how hot will it get this century? Latest climate models suggest it could be worse than we thought
Michael Grose Climate Projections Scientist, CSIRO
Julie Arblaster Associate Professor, Monash University
May 18, 2020 5.58am AESTClimate scientists use mathematical models to project the Earth’s future under a warming world, but a group of the latest modelshave included unexpectedly high values for a measure called “climate sensitivity”.
Climate sensitivity refers to the relationship between changes in carbon dioxide in the atmosphere and warming.
The high values are an unwelcome surprise. If they’re right, it means a hotter future than previously expected – warming of up to 7℃ for Australia by 2100 if emissions continue to rise unabated.
Our recent study analyses these climate models (named CMIP6), which were released at the end of last year, and what insights they give for Australia.
These models contain the latest improvements and innovations from some of the world’s leading climate modelling institutes, and will feed into the Intergovernmental Panel on Climate Change (IPCC) Sixth Assessment Report in 2021.
But the new climate sensitivity values raise the question of whether previous climate modelling has underestimated potential climate change and its effects, or whether the new models are overdoing things.
If the high estimate is right, this would require the world to make greater and more urgent emission cuts to meet any given warming target.
…
Read more: https://theconversation.com/just-how-hot-will-it-get-this-century-latest-climate-models-suggest-it-could-be-worse-than-we-thought-137281
A few weeks ago WUWT reported a study which determined CESM2 predictions are incompatible with the fossil record, because CESM2 incorrectly hindcasts temperatures which would have created lifeless tropical deserts during the Early Eocene, a period of high atmospheric CO2 and abundant tropical life.
“Some of the newest models used to make future predictions may be too sensitive to increases in atmospheric carbon dioxide and thus predict too much warming,” said U-M’s Chris Poulsen, a professor in the U-M Department of Earth and Environmental Sciences and one of the study’s three authors. – source Science Daily
CESM2 is a component of high end CMIP6 projections (see the diagram at the top of the page).
Like a spoiled two-year-old who wants a cookie, the more the proponents of anthropogenic climate change aren’t listened to and appeased the louder they get.
As if CMIP 5 were not sufficiently ludicrous, the modelers are doubling down on CMIP 6. The 3.6 times spread in sensitivity tells one that the modelers are just groping in the dark. Climate sensitivity to CO2 increase has not been narrowed down since FAR 1990. But the modeling outliers with the most ridiculous projections get all the press.
Excellent comment, Robert.
The narrowing increased the lower limit, which takes it even farther away from the theoretical maximum of 2 W/m^2 of incremental surface emissions per W/m^2 of forcing as constrained by first principles physics applied to the bulk behavior of the planet.
The original low end of 0.4C per W/m^2 requires increasing the surface emissions by about 2.2 W/m^2 per W/m^2 of forcing and is already above the theoretical maximum. Any increase in surface emissions MUST be offset by a corresponding increase in the energy arriving at the surface which is the combination of forcing plus any energy returned by the atmosphere. It’s exclusively this energy returned by the atmosphere above and beyond the forcing that allows the surface emissions to be greater than the forcing itself.
Calculating the theoretical maximum based on energy domain constraints is easy. The current fraction of the LWIR emitted by the surface and absorbed by the atmosphere is about 78%, half of which is returned to the surface and the remaining half is emitted into space which is consistent with the measured balance, the emissions corresponding to the average temperatures and the geometric constraints on the atmosphere’s energy balance where energy enters over half the area that the atmosphere ultimately emits that energy. Only radiant energy matters and any non radiant energy can only be returned to the surface in a closed loop since non radiant energy can not leave the planet.
Even if this affected the temperature and ultimate RADIANT emissions by affecting the albedo, it can not affect the relative fraction of absorption returned to the surface or any other condition for balance.
The upper limit is when the atmosphere absorbs 100% of the LWIR emitted by the surface. When a single W/m^2 of forcing results in 2 W/m^2 of incremental emissions and all is absorbed by the atmosphere, in the steady state, half is emitted into space to offset the W/m^2 of forcing while the remaining W/m^2 is added to the W/m^2 of forcing offsetting the 2 W/m^2 of incremental surface emissions. Balance is achieved all around.
The macroscopic behavior of the planet is this simple and there’s no wiggle room to get any other answer. The failure of the misinformed consensus is to consider that if the atmosphere absorbed 100% of what the surface emits, the surface temperature increase is infinite, i.e. thermal runaway. They fail to consider the origin of the energy emitted into space to offset the solar forcing and that the fraction of absorbed surface emissions sent into space for Earth is dependent on geometry and not CO2 concentrations. They also fail to understand that Venus is not an analogy for the Earth and given the same 100% cloud cover, the surface temperature would not be much different even if the atmosphere was 90 bar of N2 at the surface.
Their fantasy is the result of assuming massive positive feedback when misapplying LINEAR feedback AMPLIFIER analysis to the climate system by ignoring both the linearity precondition and the active, powered gain (implicit supply powering the amplification) precondition. Approximate linearity around the mean is not compliant with the analysis nor is assuming that the average not accounted for by the incremental analysis is the power supply. The Achilles heel of the IPCC is that James Hansen with help from the late Michael Schlesinger established this pair of self consistent errors as the holy grail that justified its formation.
“modelers are just groping in the dark”
But armchair critics here have the whole thing firmly sorted out and settled with zero doubt. Just as Dunning and Kruger predict.
Loydo
It seems from your comment that you are certain that the “armchair critics” are wrong. Is that also attributable to a “Dunning and Kruger” effect?
You apparently didn’t notice that most commenters are open to accepting the Russian ECS values.
“wrong”
No, I’m pointing out the absurd hubris of their certainty.
Armchair critics don’t have vested interests like an income to influence outcomes and can generally analyse the freely available and well understood IR properties of CO2, the available concentration data and temperature records and form their own opinions. And they are usually correct.
It’s comical to believe in organisations like NOAA that claim to know what the global average temperature was back in 1880.
You can’t blame skeptics for doubting can you?
By their own admission the IPCC doubts as well (emphasis added):
“In sum, a strategy must recognise what is possible. In climate research and modelling, we should recognise that we are dealing with a coupled non-linear chaotic system, and therefore that the long-term prediction of future climate states is not possible. The most we can expect to achieve is the prediction of the probability distribution of the system’s future possible states by the generation of ensembles of model solutions. This reduces climate change to the discernment of significant differences in the statistics of such ensembles. The generation of such model ensembles will require the dedication of greatly increased computer resources and the application of new methods of model diagnosis. Addressing adequately the statistical nature of climate
is computationally intensive, but such statistical information is essential.”
https://tinyurl.com/twzr3kd
Section 14.2.2.2, p. 774
“You can’t blame skeptics for doubting can you?”
I can blame them for not extending that doubt to thier own opinions. Opinions are ephemeral, best not to cling on to them with whitening knuckles. Especially opinions in areas one has little or no training.
“It’s comical to believe in organisations like NOAA that claim to know the global average temperature back in 1880″… more accurately than Patrick.
Ok. But the “Patrick” goalpost is new to the field. Let’s get back to the criticism of Robert about his claim regarding modeling. At least that’s who you’d quoted in the comment I was referencing.
What special training would you say I or Robert would need in order to interpret the IPCC statement I cited above?
No need for any training Sy, but expressing an opinion with vehemence and certainty outside one’s field of expertise is exactly what D&K were warning about. Circumspection is rare around these parts.
Btw how long do you think Fauci has? He’s held on three extra weeks by my reckoning.
Since there’s no need for training to interpret the IPCC statement, Robert shouldn’t be criticized for uncircumspectively claiming that modelers are “groping in the dark” then, wouldn’t you agree?
Yes, you rather uncircumspectively made another reckoning or two that flew the coop didn’t you? 🙂
Not sure what you mean by “held on,” Fauci serves at the pleasure of the president. Personally I’m not sure why he’s still there. He’s not offering anything particularly new or fresh to the subject matter as far as I can tell. Seems like his time has passed.
Would one of the astute modelers here please explain to me how these models can predict with the accuracy they claim considering the collection of shortcuts, rules of thumb and Guesstamites used in these Models what is going to happen out for 100 years? THE ACCURACY IS NOT THERE. Even a space flight to the moon and back has several trajectory corrections on the way there and back. And then several to get the space craft into the correct descent attitude. Worse, the same is true for flights to/from the ISSS.
THESE MODELS ARE WORTHLESS. A dart could give better predictions.
Do the MATH. Figure out the degree of accuracy needed for every input parameter and the calculation process itself. I can clearly remember when my ten digit accuracy handheld calculator did not give the correct answer on my Statics/Dynamics problems in Sophomore engineering classes. I had to verify many problems with my slide rule. Intermediate calculation to the tent decimal point are NOT going to work. Even to the 100th decimal point is not going to work. Each 1/100th of a degree inaccuracy will be multiplied by hundreds of thousands of times. And, NO, they will NOT average out. If you provide that response, go back to math class. One of my degrees is in Applied Mathematics.
If you look at the predictions of the climate models you will find that they have an almost perfect linear trend line. In other words you can simulate the climate models with a simple equation y=mx+b.
All the hype about the models being made up of multiple partial differential equations with certain fudge factors to account for unknown unknowns is just that: HYPE.
When most of the temperature input data from around the globe has an uncertainty of +/- 0.5 degree of uncertainty there is simply no way to calculate a global average temperature with a smaller degree of uncertainty.
All the AGW alarmists like to quote the Law of Large Numbers as meaning the average of a lot of data points gets you closer to the true value – never realizing that the Law of Large Numbers only applies if you are measuring the same thing with the same measurement device where the differences in readings are a random variable. None of these restrictions apply when you are measuring different things with different measurement devices. The differences seen between readings is *NOT* a random variable. Averaging them all together does *not* get you closer to the true value.
And, as you point out so succinctly, it’s not obvious that *any* of the AGW climate scientists have ever heard of significant digits. As someone on wuwt pointed out once 2+2 is not equal to “4.0”. An experiment giving the values of 7 and 4 does not mean the answer is 5.5 (i.e. 2 significant digits). You can’t get 2 significant digits from inputs having only one significant digit – unless of course you are an AGW climate scientist.
Tim Goreman, you are either an electrical engineer, or some other kind of engineer, are you not?
FYI, for myself, I’ve spent thirty-five years in nuclear construction and operations. (Or is it thirty six now? Whatever.)
Anyway, concerning your prior comments about my Year 2100 GMT Prediction Envelope graphic that you made on April 27th, 2020, I’ve saved those comments, and my draft response to them, for a later discussion.
This is the topical link from April 27th: https://wattsupwiththat.com/2020/04/27/some-dilemmas-of-climate-simulations/#comment-2978900
With any luck, my direct response to your April comments, plus some other remarks which I haven’t completed yet, will be posted on WUWT in June once the impacts on my work schedule from the corona virus pandemic have sorted themselves out.
In the meantime, we can predict with 99.99 % certainty — note the four significant figures there — that another article concerning the latest IPCC modeling results will be appearing on WUWT before the end of June, 2020. (Or ten by the end of June. Whatever.)
Beta,
Guessing whether the wheel will land on red or black is not *measuring* anything (if the wheel is fair). A probability statement is neither an intensive of extensive property.
Tim, as flawed as the concept of global mean temperature might be from a purely scientific and mathematical perspective, both AGW alarmists and AGW skeptics have settled upon future predictions of GMT as a central point of contention in debating the validity of the IPCC’s climate models; and indeed, the validity of today’s mainstream climate science in general. That train has long since left the station, and it is on a one way track.
I am not a big fan of models , but I think this guy Hugh Hefner was on the right track.
Thomas
Wasn’t Hefner the one who come up with the “Twin Paradox?”
Some models can predict any weather they like-
https://www.ninjajournalist.com/world/weather-girls-tb/
I often wondered how Anthony found his calling in life and wondered no more.
An average 7C increase is prima facia insane. How is it possible for anyone to be so stupid as to believe this kind of garbage?
To put this insanity in perspective, the average seasonal difference between winter and summer in the S hemisphere is only about 4-5C. while the average seasonal differenc in the N hemisphere is about 12-13C.
An excellent comment on Models used in another context. https://knowledgeisgood.net/2020/05/17/ruling-pandamerica/
1. Climate sensitivity is not significantly different from zero.
2. They still do water vapor incorrectly.
3. They don’t account for the 64 year net ocean surface temperature cycle.
4. They don’t account for the amplification of solar effect by clouds.
They are getting the wrong answer with higher confidence.
Dan,
The only climate sensitivity that matters is what ever temperature change arises from a 1.62 W/m^2 increase in surface emissions per W/m^2 of solar forcing. At the current mean temperature, this is about 0.3C per W/m^2.
The consensus claims that doubling CO2 is equivalent to about 3.7 W/m^2 of additional solar forcing, so by that metric, the temperature change would be about 1.1C. You can argue about the equivalent solar forcing from doubling CO2, but you can’t argue the basic sensitivity factor in the energy domain which is demonstrably independent of the temperature, forcing or any other factor. The IPCC tries to claim that instead of 1.62 W/m^2 per W/m^2 of solar forcing, the energy domain sensitivity is 4.4 +/- 2.2 W/m^2 of surface emissions per W/m^2 of forcing which is obviously incorrect. This is why they quantify it as a temperature change per W/m^2 of forcing since 0.8C per W/m^2 sounds plausible while 4.4 W/m^2 of incremental surface missions per W/m^2 of forcing is obviously impossible. They then add yet another level of obfuscation and misdirection by expressing the sensitivity as a change in temperature per doubling CO2, implying the 3.7 W/m^2 of equivalent forcing. Finally, to obfuscate even further, they invert the sensitivity factor and call it alpha with units of W/m^2 per degree and apply different alphas to difference sources of W/m^2 without explaining how one Joule is any more or less powerful at warming the surface and maintaining its warmth than any other.
Applying 4.4 W/m^2 of incremental emissions per W/m^2 of forcing linearly to the 240 W/m^2 of solar forcing would result in a required surface temperature close to the boiling point of water. Linearity in the energy domain is also unambiguous in the data, making the IPCC’s nominal ECS unambiguously falsified.
Who keeps listening to those buffoons ?
Politicians, unfortunately.
The best models were the ones that got banned from the F1 grid.
Specific heat of CO2 is .849 kJ/kg K. This encompasses all physical capability of molecule. There is no sensitivity to IR that causes warming. The Shomate equation has no mention of IR, NIST data has no mention of this warming capability, specific heat tables don’t mention it, Anthony’s jar experiment demonstrated no warming.
Thermodynamics says the energy can be in ANY form. Climate science says otherwise..
dT = Q/ (Cp * m)
The specific heat of a substance has generally nothing to do with its infrared absorption bands, and the measured amount of heat to raise one kilo by one degree is accomplished by conduction….although it could be accomplished, in the case of CO2 with an appropriate IR frequency, followed by conduction to the rest of the CO2 sample…..
Sorry, to be more specific, “molecular motion” rather than “conduction”
I have a crazy idea on how to sort this out. Maybe someone could do a comparison of all these models results for, say the mid-troposphere for, say the last 40 years to direct measurements from, say weather balloons or satellites. That should indicate which, if any, of the models produce credible results. I’d suggest that any models that deviate from measured values by more than the 95% Confidence level of the measured data be scrapped. Any remaining models could then be considered “not invalidated”. Maybe someone (Dr. John Christy?) could look into this?
I keep reading that the models are based on known physics and do not need to be validated by comparison to real data to be useful. However, the CMIP6 models indicate a factor of 3 difference between the lowest and highest Climate Sensitivity. Physics must be very different in Russia than in East Anglia.
If there’s any known physics in any GCM used to support a large effect from CO2 emissions, there’s clearly also significant non physical behavior quantified with heuristics. The unambiguous evidence of this is that known physics falsifies the planet’s bulk behavior as predicted by these models.
That has been done, by Christy for (IIRC) his 2017 congressional testimony. You can find it and the chart using Google. The only model that tracked observations (satellite, radiosonde) reasonably well was the Russian INM CR4. And see my comment above.
Lauer and Hamilton (2013) included INM-CM4 among their CMIP5 test set. Its liquid water path appeared to be missing the ITCZ moisture band, and its SST showed large positive and negative biases compared to observations.
Dolinar (2015) also included INM-CM4, which showed a good global average cloud fraction, but (again) a very low water path. It was too low in both reflected short wave and outgoing long wave cloud forcing, making the net nearly correct with respect to observations.
The INM-CM4 result appears indistinguishable from being an artifact of offsetting errors. Offsetting calibration errors do not produce reliable predictions.
Done for the CMIP5 models, Rick.
+7C, we can grow barley in Greenland again! Last time was 1000 years ago.
Yawn. The annual, hysterical “worse than we thought!” prediction.
Stay tuned for next year’s version when it will be even worse.
When you don’t rely on objective reality for your prognostications about the future, you can say anything you want, as Michael Grose and Julie Arblaster do. Computer models are not reality, especially when they repeatedly fail to match measurements. Interestingly, “refinements” to each new version seems to produce results that depart from measurements even more than previous versions. You’d think someone would notice, but the groupthink is strong among the climate modelers. The motto of “The Conversation” is “Academic rigor, journalistic flair”. Ironic.
For reference, the measured trend in global temperature over the last 40 years from satellite data is 1.4° C per century. The measured trend in sea level rise over the last 25 years from satellite data is 0.31 meters per century. Both of which are in the middle range of the RCP2.6 scenario, in case anyone was wondering.
So anyone can choose an ECS value from 1.8 to 5.6 and the Science is on their side?
Carbon Brief suggests: ‘Having a diverse range of ECS values in CMIP6 is not necessarily a bad thing, as it indicates that modellers are not making choices to make their results similar to those of other modeling groups (e.g. fitting in with the herd). However, the fact that a number of models available so far have a very high ECS means either future warming may be worse than we thought or a number of prominent climate models may be getting climate sensitivity wrong’
Or it could mean the higher value models have got sensitivity wrong and future warming will be milder than thought.
Personally I think this is critical to why the models wont work.
The cooling of the northern North Atlantic (developing negative AMO) will continue because large open water sea ice formation releases latent heat weakening the polar vortex which in tern weakens the Icelandic low-Azores high structure thus less warm Atlantic water is driven into the polar region. The gradual buildup of ice snow in the high north will start to drive stronger meridional winds including the PDO pattern in the northern hemisphere increasing deep water upwelling and thus more low cloud- cooling ocean temperatures.
Another cause for weakening of the polar vortex is solar activity which I see as a top down affect due to ozone warming during weaker solar activity. A further affect might be changes in atmospheric height/density as it has been hypothesized that polar atmospheric heights are higher at solar minimum and thus pressures could be higher around the Icelandic low weakening it driving less warm water north.
The point of this post is to consider what would happen (IF the above holds true) at the end of the 30 year negative phase of the AMO if solar activity is very weak. The solar affect would continue to keep the Icelandic low- Azores high weak and thus we continue with a greatly diminished flow of warm Atlantic water into the the Arctic. This will drive a continued cooling of the oceans through the increased wind speeds and upwelling water causing more low cloud.
Personally I think this will hammer home the power of nature over man and our attempts to model climate vastly underestimates the natural processes.
as I see it – Bruce.
HA HA HA ha Ha ha ha HA HA!
AAAAah ha ha ha ha!
Gerry Parker
[Cartoons by] Josh is running out of year cross-out space on his recycled COPxx comic. COP26 promises to be the most exciting one yet with tiny sideways numbers in the margin.
Just one possible suggestion: For the new number, he could always try drawing a “post-it note” that partially overlaps one of the earlier crossed-out number, leaving enough of the old numbers to tell what they were while keeping the gag of replacing the numbers every year.
“Michael Grose Climate Projections Scientist, CSIRO”
Projections…says it all!
We’ve enjoyed about 1C of beneficial global warming recovery since the end of the Little Ice Age in 1850, of which, roughly 0.7C was from natural causes and 0.3C from CO2 forcing… Oh, the humanity…
Accordingly, ECS is highly likely to be between 0.6C~1.2C with a “best guess” estimate of around 0.9C; which is a joke.
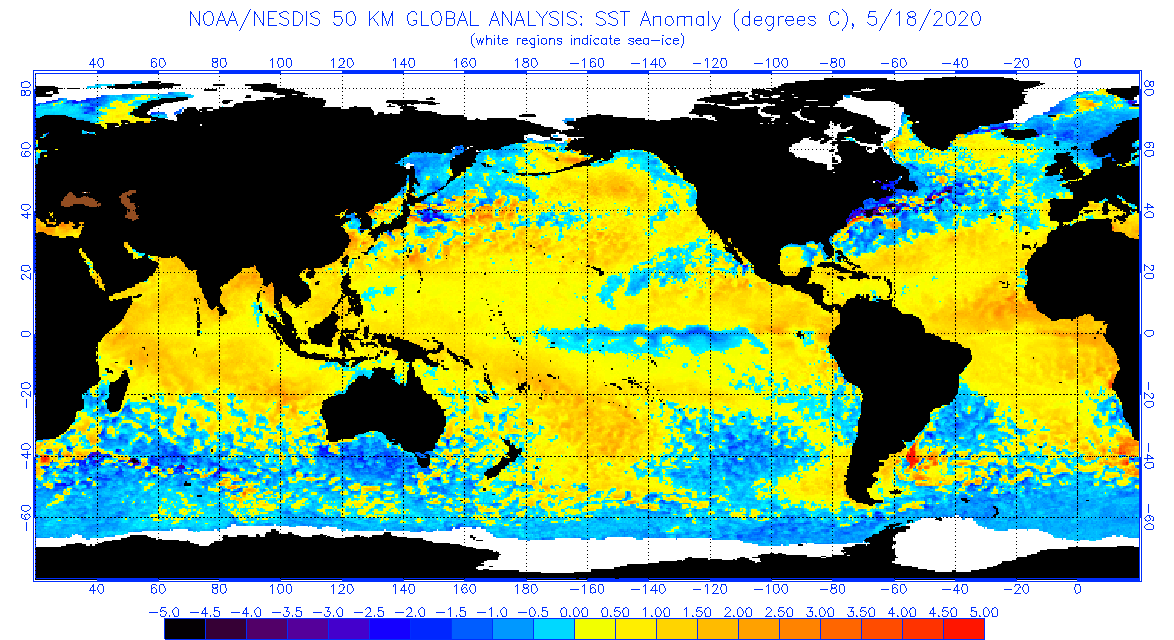
We’re about to suffer 30 years of global cooling when the PDO and AMO enter their respective 30-year cool cycles, and it looks like the AMO cool cycle has already started:
https://www.ospo.noaa.gov/Products/ocean/cb/sst5km/#gallery-17
The above link also shows a strong La Nina cycle is developing, which will finally offset the 2015~16 Super El Nino spike over the next 2 years.
Moreover, we’re in a 50-year Grand Solar Minimum cycle, which may also add many decades of global cooling.
By the end of Trump’s second term, this silly CAGW hypothesis will be laughingstock.
No model is correct. That is easily assessed by the level of agreement. The ones closest to zero are closer to reality than at the other end of the scale.
If you have forty piles of garbage, mixed them all together and then put them into forty equal piles, they remain garbage.
This diarrhoeic diatribe is a disgrace to the human race.
Never before has “science” been so completely and wretchedly enslaved to a monotonic political imperative.
Never before since the days of demons behind every dust-devil and witches behind every hard winter has there been so little (zero) connection between “science” and the real world.
Political belief systems have evolved from animism to monotheistic religion to scientific rationalism now back to animism.
Nature itself has disappeared.
Now there is a malevolent sentient agency – fossil fuel burning humans – behind weather and climate.
The age of science and reason is a dead as a doornail.
What? Another ”new estimate”
Shouldn’t we wait till they get it right? If they keep getting it wrong like they have, the planet will be on fire by 2100. If not, sooner.
If, so far we have seen about 1C since the mid 1800s, do they really believe, or expect anyone else to believe, we will see +6C rise in the next 80 years?
Eamon.
Actual catastrophe report from Germany: Huge tsunami is expeted in Alaska.
https://www.t-online.de/nachrichten/id_87908118/tsunami-befuerchtet-forscher-warnen-vor-folgen-der-gletscherschmelze.html
Please, could somebody analyse this fake news?
Thank you in advance.