Guest News Brief by Kip Hansen — 18 May 2020
 There has been a lot of talk in the press and from talking heads claiming that the Covid lockdown has “reduced emissions” (power plants cutting back on power generations, factories closed, populations ordered to stay home, most airplanes grounded) and talk encouraging that government Covid recovery packages, should support only companies and projects “which decouple economic growth from GHG emissions”. The “Build Back Better” movement.
It is true that emissions from human sources – automobiles, factories, power plants, etc. – have been reduced by the multitude of nations that have sacrificed their economies in the [misguided] belief that doing so “saves lives”.
But the idea that the Worldwide Covid Lockdown has had any effect on atmospheric CO2 concentrations is simply not true.
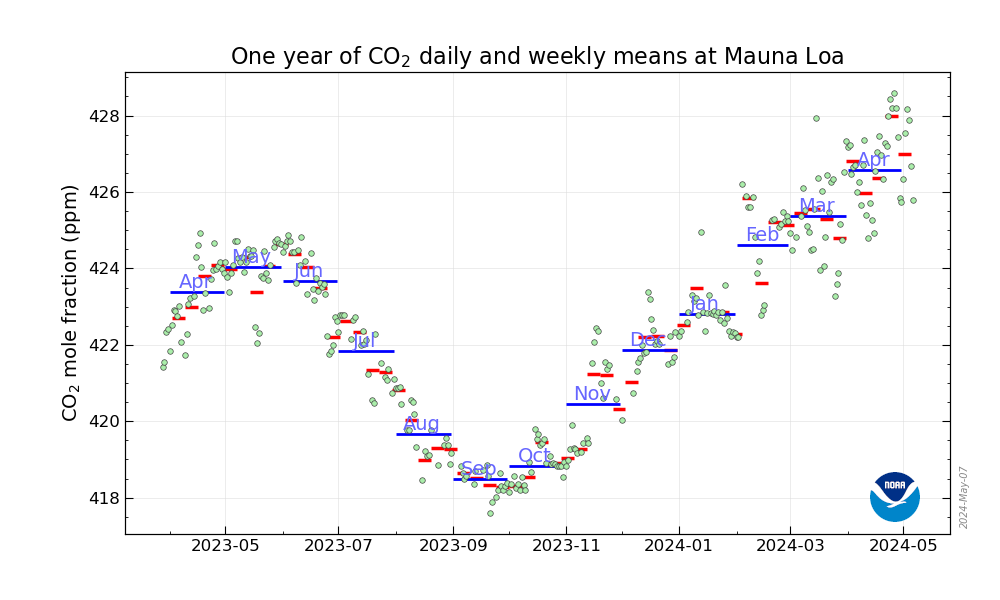
Here is the data, from the world’s most trusted monitor of atmospheric CO2:

Despite the dreams of the anti-human element of the Climate Cabal, which seems to have been hoping that the Covid Lockdown would destroy enough of to human society to allow the Radical Greens to dictate the “post-apocalypse recovery plan” — there has been no apocalypse (there has been an economic downturn…by definition, they turned down the economy), the lockdown hasn’t even made a dent, not even a tiny slowdown, in the growth atmospheric CO2 concentrations.
That is, this year, through May, looks precisely like each of the previous four years. You might be asking: “How can that be?” — factories closed, cars off the road, power plants just ticking over…..
[ If you don’t like this chart, try the Daily and Weekly Chart — it shows the same thing. ]

[ Above image added 0945 ET May 15 2020 — too many people complaining about resolution of the first graph — apparently too lazy to click the link provided. ]
Maybe, just maybe, anthropogenic emissions just don’t make that big of a contribution to the increase….Maybe abandoning fossil fuels and all the advantages of modern society isn’t a solution to rising CO2.
# # # # #
Author’s Comment:
And that’s the news for the day….
Don’t ask me to explain it, I don’t know. But it sure is interesting – even I thought the lockdowns would show up at Mauna Loa.
# # # # #
The next few months will be interesting. As we enter the spring and summer months there is a decline in co2 because of plants growing in the northern hemisphere. Will the decline be as great as previous years?
CO2 reducing by plant-grow will be belated, because of the still existent snow masses above average in NH
I fetched the Mauna Loa daily dataset.
The image linked below demonstrates the raw sawtooth (gray line) overlayed with 7-day moving mean (red line) for the last four years, Feb/Mar/Apr only.
There’s no drama.
A case might be made for a tiny slump between 4/20 and 4/29 this year. It would be a pretty thin claim, compared to an 11% drop in human contribution. That’s my opinion.
However, others might be able to draw conclusions other than that. Have at it.
Thank you Wndlord for that useful year on year comparison. The most interesting observation for me, is the apparent stability shown this year compared with the recent past, particularly 2017.
Either new equipment is in place( or data program) that smooths out “spurious” variation or the sensors are detecting local variation rather than world wide well mixed atmospheric change.
Why is there such a visual difference between 2020 and 2017?
I just noticed that the x-axis is a little different on 2017. I’ll take a look at that and post two more years later today.
Looking deeper, I am claiming that no “ding”or wobble is visible in the measurement of CO2 concentration at Mauna Loa. Business as usual, despite an enormous 11% drop in human emissions.
Here is a graph comparison, 2014-2020:

the scale of the jpg is designed for visual comparison of the sine curves, not the numerical.
You can see the actual data in the next link …
Here is that graph and the underlying Excel Spreadsheet, with datapoints:
https://theearthintime.com/CO2-2014-2020.zip
Thank you for that!
Scissor, you are welcome.
Seriously, shouldn’t the CO2-danger-community admit this massive reduction in CO2 human release has to show up in even the tiniest ding at Mauna Loa? I mean, show me the damage.
At the very least, shouldn’t AOC-AlGore at least be nervous that a stoppage greater and faster than they hope for in all their dreams of repression of FF … lays an egg.
Winlord,
What link did you use to get daily data for April-May 2020?
Is it from NOAA or Scripps?
Can it be accessed by the public, people like me?
Geoff S
Geoff,
I’ve been graphing the daily CO2 concentration from Scripps with this as my latest, which compares dailies over the last seven years for the Feb/Mar/Apr time period:
I also linked a zip of my work, which includes the data points, here:
https://theearthintime.com/CO2-2014-2020.zip
You can get the data yourself here:
https://scrippsco2.ucsd.edu/data/atmospheric_co2/mlo.html
CO2- HOW DARE YOU defy Greta????
NO2 drops immediately, measurably, but CO2 isnt.
Even if you were to say that Mauna Loa measures a mixed atmosphere, rather than measuring directly the air above cities and industrial areas, as NO2 is, you would expect, that during spring, where there is a massive CO2 uptake by plants globally, and with mankind producing 30% less, at least, some signal.
Why? This is weird, very weird. Is the Carbon cycle so big, much bigger than thought, that man made CO2 just doesnt show up? Ie are there much bigger sources and sinks for CO2 that we just dont know about?
In a sane world these observations would result in immediate Public Inquiries from politicians the world over, into how they’ve been so duped by Big Green for so long.
Green Blob nonsense would be ditched and ‘renewables’ deservedly shown the door. But we don’t live in a sane world!
Expect a furious Green Blob pushback with multiple ‘rebuttals’ in very short order. It’s gonna be fun.
If the annual CO2 cycle is caused by plant growth, and NASA reports a 30% increase in greening, then we should see an increase in the amplitude of the Scripps sawtooth over the same period. Do we?
Yes we do. See here: https://scrippsco2.ucsd.edu/graphics_gallery/other_stations/global_stations_co2_concentration_trends.html
Blest if I can see a ~30% increase in amplitude (aka max-min) of the annual CO2 sawtooth.
Could you show me?
Sure. At PTB it was circa 310-324 ppmv min/max in 1960 and is now 400-418 (+29%). At LJO it was circa 309-317 and is now 404-416 (+50%). Of course these are just eye-balled and you would need to detrend them to get a more precise estimate.
Jim, thanks for the reply. For Mauna Loa, the one with the longest record, my eyeballs say a 7ppm swing in 1960, and a 7ppm swing in 2029.
I speculate that we might be looking at e.g. humidity rather than greening as an explanation. Given that the air samples are freeze-dried to -70 degC to remove any humidity before being read, a varying humidity in the original sample ought to show through in a varying result.
Incidentally Samoa has a pretty stable humidity, as does the South Pole, and both have a very low annual fluctuation. OTOH Point Barrow has a really big humidity swing, and a really big fluctuation.
If this speculation ‘holds water’ then the consequences for the Keeling Curve as evidence for AGW could be serious. Anybody interested in doing an analysis?
that 30% increase in greening wouldn’t be being observed in part by OCO-2 photosynthesis instrument would it?
– where photosynthesis is registered with an accurate CO2 measurement…..
My turn for a question. Every year at Mauna Loa, as shown in the 5 year plot included in the original post, the monthly growth of CO2 is lower for a month or so during the period from January to March. What is the cause of this? A clue, perhaps, is that it appears to be less pronounced during major El Niño years (which obviously would correlate with higher CO2 growth during such years).
Because Feb is 10% shorter than the other months?
Interesting idea, but in 2017 and 2018 the “low growth month” was January. Thanks for the suggestion though (especially as I had not thought of this!).
“Short February” is dwarfed by the fact that at Mauna Loa, there are missing days on a random basis every month. I discovered that when plotting the daily data last night. Some months 2-3 missing, some 5-6.
Link to spreadsheet showing this:
https://theearthintime.com/CO2-2014-2020.zip
Oops, my mistake! The years 2017 and 2018 are low growth because of the reduced difference between the monthly averages for Feb and Jan, and hence could be a result of less data in Feb. However, in 2019 and 2020, the low growth was between Feb and March, so it still does not work as an explanation.
Jim ==> I;ve already said “I don’t know”…. but I suspect that repeating little slowdown you mention is the Northern Hemisphere Spring event — the leafing out of all the trees and the growth of all things green sucking up CO2sub> in that brief mad burst. This, of course, is a uneducated guess.
Kip,
Thanks for the suggestion. The issue would then be, why does the growth rate “perk up” again through to the annual max in May when photosynthesis in the NH really kicks in (likely driven by the boreal forests). I think this could be a very important point in understanding the link between ENSO and atmospheric CO2 growth, given the AGW view that the increase in CO2 growth rate seen in major El Niño years is due to reduced CO2 removal of anthropogenic emissions by tropical vegetation because of drought – and without any material involvement of the oceans. Hard to believe!
Perhaps OCO-3 will help, though it doesn’t sound promising. Thanks very much for the update, Joel.
Jim ==> You may be misreading when the NH starts into Spring. It may well be an increase that starts in the Equatorial Band and sucks up CO2 starting there as the Sun passes directly overhead. Don’t know — but it is pretty consistent over the years — right in that same spot, give or take a month.
Kip,
Obviously photosynthesis starts earlier at lower latitudes, but the fact remains that the sharp drop in atmospheric CO2 occurs in May, both at Mauna Loa (MLO) and at Point Barrow (PTB), Alaska. The annual cycle is much larger at PTB than at MLO, which leads to the widely-accepted view that it is largely driven by far northern vegetation (supported by the δ13C data). The annual cycle even further north at Alert, Canada, shows virtually the same annual variation as PTB.
Of course, being “widely-accepted” doesn’t make it right, nor does it mean that I agree with it. The CO2 drop at MLO in late spring does seem out of line, but I suspect it is simply because it reflects what is happening at Barrow rather than its own latitude. In other words, the CO2 cycle at PTB dominates the northern hemisphere (NH) response. From May onwards, the MLO changes lag those at PTB, most noticeable where it generally shifts from decreasing to increasing in August at PTB and September at MLO. Such a relationship would also explain the overall NH diminishing size of the annual cycle from PTB southwards towards the equator.
Whether or not the annual cycle at PTB is driven by the terrestrial biosphere or by photosynthesis of phytoplankton (or a combination) would appear to be worthy of further investigation, especially as that seems to get going in May in the Arctic and the Iceland Sea (based on in situ pCO2 measurements). I can provide links if anyone is interested.
Jim ==> The point we were discussing is the little “stutter” seen in the Monthly Means graph about two-thirds of the way in the UP phase of each year.
Kip,
We were indeed. I tried to expand the discussion to include what else we see in the NH with regard to the effect of photosynthesis on atmospheric CO2, because I have difficulty assigning the “stutter” to this effect when CO2 continues to increase at Mauna Loa through until May. I tried to make that point previously, but I was not clear enough. I apologise.
Jim ==> No worries. This whole topic has been poisoned by the Climate Cabal, some representatives of which comment here.
I’m just trying to keep the thread constrained to the simple observation record. In the final analysis, and despite claims from some quarters, we know precious little about the true detailed causes of Atmo. CO2 fluxes.
With the drastic reduction in air traffic there should have been an equally large reduction in the number of contrails and contrail cirrus clouds in our skies. Has their been any discussion anywhere of possible effects on surface temperatures of such reductions today?
I have heard both of contrails (and also thinner cirrus clouds) cooling the world, and warming it (by absorbing thermal infrared and reradiating half of it downwards). There is more certainty that lower clouds have a net cooling effect.
iirc there were measurable changes in the clear skies after 9/11 … again iirc primarily in North America.
Go to http://www.retiredresearcher.wordpress.com for a detailed analysis.
Go to href=http://retiredresearcher.wordpress.com>Climate Changes for a detailed analysis.
Total Aviation is down 50+%
But it can’t have much effect.
The global aviation industry produces around 2% of all human-induced carbon dioxide (CO2) emissions. Aviation is responsible for 12% of CO2 emissions from all transports sources, compared to 74% from road transport.
Too many humans still breathing?
COVID is mother earth fighting back?
Covid-19 is killing off old comorbid people in nursing homes and hospitals.
And really not much of anyone else.
There is nothing special or unique or novel about Covid-19.
It’s just another run of the mill flu bug that found easy pickings in the too many, too old, too sick packed too close together.
NYC alone is responsible for 25% of the Covid-19 deaths.
The top ten states for deaths account for almost 80% of them.
Japan has a higher percentage, 27%, of 65+ than any other country and not even 1,000 deaths.
Somebody should go find out why.
https://www.cdc.gov/nchs/nvss/vsrr/covid19/index.htm
Hi Nick
There are lot of old people in the east part of the European Union, large percentage of young are employed on the long term bases in more industrialised and more prosperous countries of the EU, and yet death rate in the east is only fraction of that in the most of the west.
http://www.vukcevic.co.uk/EuropeCV.htm
as you say Somebody should go find out why.
Sounds like tailpipes and “smoke”stacks are a lot cleaner thasn one is led to believe.
Regarding: “Maybe, just maybe, anthropogenic emissions just don’t make that big of a contribution to the increase….Maybe abandoning fossil fuels and all the advantages of modern society isn’t a solution to rising CO2.”:
The current high level of CO2 was built up over decades. Dr. Roy Spencer worked out a natural removal rate that corresponds to a half-life of about 30 years, and a few years ago Willis Eschenbach worked out a natural removal rate that corresponds to a half-life of 41 years.
(To the extent natural removal of an injection (“pulse”) of CO2 into the atmosphere goes by exponential decay instead of a Bern model, and atmospheric concentration and emissions data can’t prove one over the other until there’s a sustained substantial departure of emissions from exponential growth great enough to cause the growth of the “atmospheric surplus” to deviate substantially (and for at least a few years) from exponential growth.)
A decrease of emissions by somewhat over 10% for a few months is not going to make a visible difference in a graph of the Keeling curve, perhaps a couple tenths of a PPMV, as expected by Dr. Roy Spencer.
Donald ==> You may be right — however if the Spencer/Willis calculations are circular (based on the graph itself to explain the graph….) then those bets are off.
We do not know how much CO2 we are adding to the atmosphere . . . we only have guesses, mostly based on the Keeling Curve with the assumption that any increase is due to anthropogenic emissions.
The point of this accidental experiment is that if we reduce our emissions by a discernible amount and Atmospheric CO2 Concentrations do not reduce by that discernible amount, then we know that something is amiss with the calculations we wewre depending upon.
The accidental experiment is not over, of course, but preliminary data is in . . . . we will be able to determine the results of the experiment over the next six months or so.
If CO2 concentration continues to rise in the same manner as before, despite our reductions in emissions, then our emissions are having precious little to do with it.
If CO2 rise reduces by 5 % — Spencer’s calculation — then we might have some evidence of how anthropogenic emissions add to whole atmosphere CO2 concentration (or how little.)
You get the circularity issue?
Spencer figures that a 43% decrease of emissions will cause atmospheric CO2 concentration to level off, +/- regular seasonal variations, irregularities in seasonal variations and year-to-year variations (such as from ENSO). He cites EIA expecting an 11% decrease of CO2 emissions, and I searched and found this is a US figure and not a global one. With industrial countries other than the US recovering more quickly than the US, the global figure for emissions decrease for 2020 would be less than 11%. An 11% decrease for a whole year would merely slow down CO2 growth by .6-.7 PPMV over a year, so the actual 2020 decrease of global CO2 emissions looks like it will accomplish less than that, a value comparable to year-to-year variations in the CO2 increase trend.
Donald ==> The guesses about anthro emissions notwithstanding, the “proof of the pudding”s whether or not reduction in human industrial activity slows the rise of Atmo. CO2.
We know that fossil fuels are going unburned — petroleum prices have gone negative and stockpiles are overflowing.
The CAGW stance is that in order to save the world, we must do what is currently being done — slowing industrial activity.
We will see, over the next six months or so, how much, if any, slowing industrial activity affects Atmo. CO2.
It is an experiment that we could not otherwise have done — and the results will tell us something.
I’ve already admitted I don’t know what it will tell us — we only have interesting but preliminary results so far.
Spencer/Willis are wrong. See Dr. Ed Berry’recent comment on his blog.
What is really interesting is this – what does it take to bring that number down? Shutting down most of Europe and the U.S. had basically no effect, thus, all the plans of climate change enthusiasts are pretty much moot – they won’t make any difference at all. We can’t do any more than what we just did. We shut down as much of our generation as is humanly possible, and it didn’t move the needle even a little bit. Whatever the reason it don’t change the numbers, the fact remains, shutting down our entire economy would still not be enough to affect any change whatsoever in carbon dioxide concentrations. If you say, well it is because China didn’t shut down, then fine. We don’t control China. If it was natural then fine, we don’t control nature. Either way it doesn’t matter.
President Trump just said he has been taking hydroxychloroquine for the last few weeks as a preventative for the Wuhan virus!
The reporters are Stunned!!!
Kip: No argument with your article, but I would point out that the MLO is — by intent — high in a mountain in the tropics. CO2 is “well-mixed”. Like O2,N2 and Ar (but not H2O) long-term, it tends to be much the same everywhere on the planet. But, it’s not clear how long it would take for changes in the gas mixture of the Northern Farrell Cell (the heavily populated/industrialized North Temperate Zone) to propagate to the Northern Hadley Cell where MLO is located. It’s possible that measurable changes are taking place, but that our key instrument won’t see them for a while.
… or not.
While looking to see if the Scripps Institute weekly flask measurements of CO2 at various latitudes might show anything (I didn’t find them quickly in an easy to read form), I came across a rather neat article
https://www.esrl.noaa.gov/gmd/ccgg/about/co2_measurements.html If it’s too long, just skip down to figure 5a. That, in itself, seems enough to suggest to me that some caution is in order when dealing with short term CO2 measurements.
Presumably, someone will come along in a few years and do a really detailed analysis of today’s MLO, Scripps, OCO-2 and OCO-3 data. My GUESS is that they will find a recognizable COVID-19 effect just as there is a very small blip in the early 1990s MLO data that is likely due to Mt Pinatubo (1991). But it will likely be small and not very informative.
Don K ==> It has long been known that near surface CO2 varies with the activity of the plants (and animals — such as above huge herds of beasts in Africa). The figure 5 graph is informative of this fact — oddly, not true every day — the last couple of days of the measuring shows little height difference.
“The “Build Back Better” movement.”
The problem with this concept is that nothing was removed that needs to be built again. They’re talking about replacing perfectly good infrastructure for no reason (well, their fairy tale reason, but nothing based in reality). Such a thing would cost, well, as much as the so-called GND, for no gain, and demonstrable loss.
You Citizen Scientists are not probing well enough.
Believe the CO2 in air measurements at your peril.
Repost from 15 March WUWT follows:
When you decide to investigate a process that involves measurement, two fundamental questions always need confident answers:
1. What is the limit of detection?
2. What is the total error envelope?
Those wanting to track daily atmospheric CO2 during this 2020 lockdown should be aware that there is next to no daily CO2 data available to the public apart from some from Mauna Loa. That the agreement between daily NOAA and Scripps measurements there indicates an error envelope of some +/- 0.5 ppm CO2 (1sigma) for 2020 so far. This helps dictate the detection limit, indicating some 1 ppm.
Looking for a change of 0.2 ppm, as some people are, is therefore not possible.
There is a determination from several research bodies away from Mauna Loa to not release daily CO2 data for 2020 to the public. If you do not believe this, ask them, as I did.
Summarising, the citizen scientist has next to no hope of contributing to the science because access to required data is being denied by several of its curators, or simply not updated by others.
Science policy at its worst. Geoff S
“Citizen Scientist”
Speaking for myself only, I prefer “Climate Realist” with the job description inferred:
“Member of the Rational peer group.”
One sign we are far more qualified to detect error and/or fallacious conclusion in certain closed-off tiny peer groups than those few within their own collective? When they afraid to show their data.
At the risk of spamming the thread, I think that the bee in my particular bonnet is worth a wide hearing:
As a citizen, I have long suspected the dependence on the Scripps process to justify the AGW conjecture. My suspicions have been confirmed by the annual amplitude of the ‘swing’ being ascribed to N. Hemisphere plant growth and decay. However, NASA claims a ~30% increase in the greening of the planet, but eyeballing the annual ‘swing’ since 1960, there seems to be no increase in amplitude. WUWT?
Given the Scripps process of freeze-drying the air samples, my own conjecture is that these measurements are affected by the variation in site humidity. And looking at e.g. Samoa and Point Barrow annual monthly humidity readings, it seems that the ‘sawtooth’ amplitude does indeed follow local humidity.
IF my conjecture holds any water (pardon the pun) then the Scripps process might at least partially be tracking local humidity. If so, then the AGW conjecture based on the Keeling Curve could be in trouble.
Any comments, including refutations would be most welcome (as it would help me move on to a new ‘buzz’)
Interesting. Glad someone else checked. I looked for websites under several combinations of Google search string:
“world co2 monitoring stations, graph”, and “northern hemisphere CO2 monitoring stations, graphs”,
“Co2 monitoring stations combined, graph,” etc…
All roads lead to Mauna Loa, which is one of the four observatories in the “Global Monitoring Laboratory” network.
https://www.esrl.noaa.gov/gmd/ccgg/about.html
One of the pages at that website is devoted to the Global Greenhouse Gas Reference Network”.
Along with the line of Pacific observatories – at Barrow, Mauna Loa, American Samoa, and Antarctica, which are all about 150 degrees W longitude – they monitor from “Aircraft”, “Surface Continuous”, “Tower”, and “Surfact Discrete”, at various locations, all noted on the map linked above.
I checked for data or compilations of world data at the Boulder monitoring station. It says all their current and historical readings were “ongoing”.
Anyway, a simpleton’s-eye-view of CO2’s values, judging from what’s available at Mauna Loa is as follows, in ppm:
2017-’18 – 401-410, for a gain of 9ppm
2018-’19 – 403-411, for a gain of 8ppm
2019-’20 – 405-415, for a gain of 10ppm
2020—– 408-416, for a gain of 8ppm
For someone more energetic, an average seasonal gain over last several decades would be useful.
Best.
In 2020, May is not yet over, and May is normally the peak month.
On average from 1958 through 2019, in each year May of a year was 3 PPMV above that year’s average and Sep-Oct of a year were about 3.2 PPMV below that year’s average, according to my eyeballing of the inset graph in https://upload.wikimedia.org/wikipedia/commons/c/c5/Mauna_Loa_CO2_monthly_mean_concentration.svg
This would mean a rise of 6.2 PPMV and a drop of 6.2 PPMV repeating annually on average if CO2 did not have an increasing trend.
From January 2015 to January 2020 Mauna Loa CO2 increased from 399.98 to 413.39 PPMV, which is .2235 per month. I figure that’s slightly less than 1.8 PPMV to add to 6.2 PPMV or a total of slightly under 8 PPMV average increase from September to May, and slightly less than .9 PPMV to subtract from 6.2 PPMV for a total of slightly over 5.3 PPMV average decrease from May to September. (Assuming the average seasonal variation in the past few years is unchanged from the 1958-2019 average seasonal variation, and from January 2015 to January 2020 is representative of the increasing trend in recent years.)
Repeating for January 1959 (315.62 PPMV) to January 2020 (413.39 PPMV) which works out to .1987 PPMV per month, this means average Septermber-May increase of slightly less than 7.8 PPMV and average May-September decrease of slightly more than 5.4 PPMV.
I tried answering this with my math work and did not see indication of my post making it to moderation, maybe I missed something. Trying again more briefly: I figure on average using average monthly deviations from annual values and the gain rate from January 1959 to January 2020, an increase of slightly under 7.8 PPMV on average from September to May, and a decrease of slightly over 5.4 PPMV from May to September.
Using the same average average monthly deviations from annual values and the gain rate from January 2015 to January 2020, I figure average increase from September to May of slightly under 8 PPMV, and average decrease of slightly over 5.3 PPMV from May to September.
I note a BBC story from 3 hours ago https://www.bbc.com/news/science-environment-52724821 under the headline “Climate change: Scientists fear car surge will see CO2 rebound” shows graphs that (without careful reading) appear to report on measurements showing CO2 levels falling. The article uses phrases such as “the fall off in carbon” and “the rebound, especially on the roads, could see a carbon surge.”
A careful reading reveals that the graphs are created from models, and purport to show rates of emissions of CO2, rather than measured levels of CO2.
boffin ==> The “data” is from the Global Carbon Project — an advocacy group pushing Net Zero scheme. They are guessing, like everyone else. The pudding tasting is Atmospheric CO2 Totals — and that is a lagging stat — we’ll know more in six to nine months.
CO2 Data Source:
Scripps has daily records for measurements for all of its related sampling stations, available from links at this page: Atmospheric CO2 Data – Sampling Station Records .
Note that there are a lot of missing data points in the .csv files, but they are extensive and might be useful to anyone with a deep interest.
Detailed analysis href=http://retiredresearcher.wordpress.com/a>
Detailed analysis