Reposted from Dr. Roy Spencer’s Blog
May 15th, 2020 by Roy W. Spencer, Ph. D.
[UPDATE: MISSING IMAGES INSERTED]
Summary: Atmospheric levels of carbon dioxide (CO2) continue to increase with no sign of the global economic slowdown in response to the spread of COVID-19. This is because the estimated reductions in CO2 emissions (around -11% globally during 2020) is too small a reduction to be noticed against a background of large natural variability. The reduction in economic activity would have to be 4 times larger than 11% to halt the rise in atmospheric CO2.
Changes in the atmospheric reservoir of CO2 occur when there is an imbalance between surface sources and sinks of CO2. While the global land and ocean areas emit approximately 30 times as much CO2 into the atmosphere as humans produce from burning of fossil fuels, they also absorb about an equal amount of CO2. This is the global carbon cycle, driven mostly by biological activity.
There are variations in the natural carbon cycle, such as during El Nino (more CO2 accumulation in the atmosphere) and La Nina (more CO2 removed from the atmosphere). Greater wildfire activity releases more CO2, while major volcanic eruptions (paradoxically) lead to greater photosynthesis from more diffuse sunlight and extra removal of CO2 from the air. The most dramatic variations are seasonal, as the land-dominated Northern Hemisphere experiences an annual cycle of vegetation growth (CO2 removal) and decay (CO2 release).
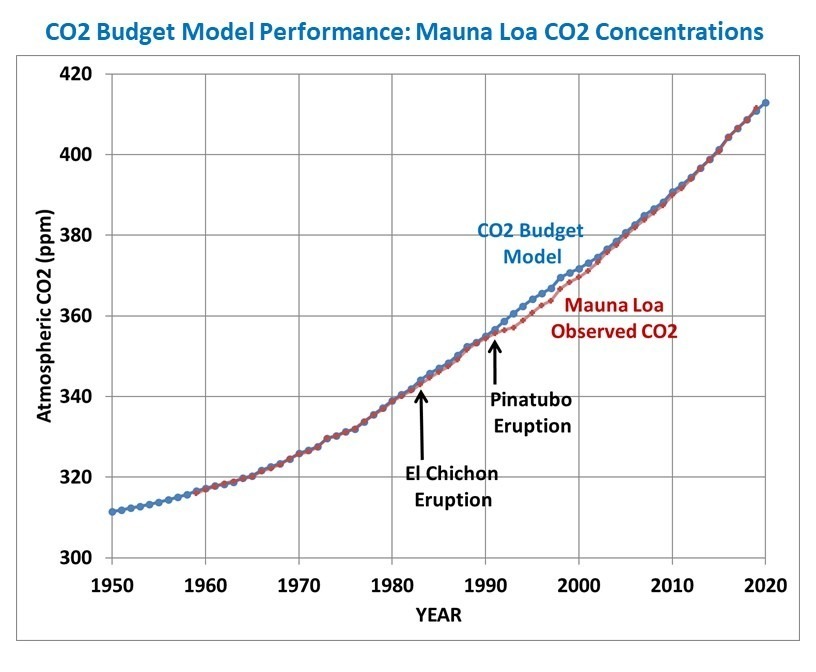
The increase in atmospheric CO2 observed since the 1950s is most likely dominated by anthropogenic CO2 emissions, which are twice as large as that needed to explain the observed rise. As I have shown before, a simple CO2 budget model driven by (1) estimates of global yearly anthropogenic CO2 emissions, (2) El Nino and La Nina activity, and (3) a CO2 removal rate that is proportional to how much “extra” CO2 is in the atmosphere compared to a “preferred baseline” CO2 level, yields an excellent fit to yearly CO2 observations at Mauna Loa, Hawaii.

Fig. 1. Yearly Mauna Loa, HI CO2 observations since 1959 (red) versus a simple CO2 budget model (blue).
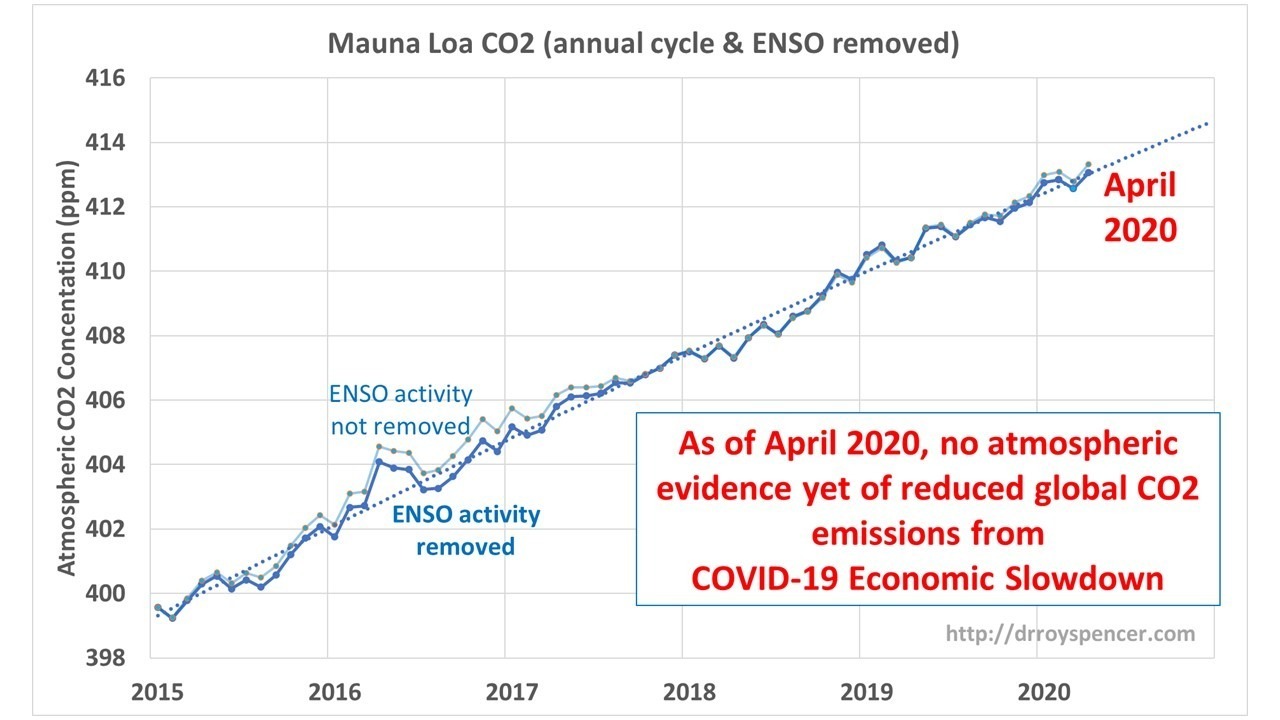
But those are yearly measurements, and we are now interested in whether the recent global economic slowdown is showing up in the monthly Mauna Loa CO2 data. If we remove the large seasonal variations (driven by the seasonal growth and decay of Northern Hemisphere vegetation), we see no evidence of the economic slowdown through April, 2020.

Fig. 2. Monthly CO2 data since 2015 from Mauna Loa, HI after the average seasonal cycle is statistically removed.
As can be seen in Fig. 2, there are some pretty large month-to-month jumps and dips around the long-term increase (represented by the dotted line). These are probably natural variations due to fluctuations in the average seasonal variations in vegetation growth and decay, wildfire activity, and El Nino and La Nina activity (which are imperfectly removed in the solid blue line in Fig. 2). Variations in economic activity might also be involved in these fluctuations.
The point is that given the large month-to-month variations in natural CO2 sources and sinks seen in Fig. 2, it would be difficult to see a downturn in the anthropogenic source of CO2 unless it was very large (say, over 50%) and prolonged (say over a year or longer).
Instead, the U.S. Energy Information Administration (EIA) estimates that the global economic slowdown this year due to the spread of the novel coronavirus will amount to only about an 11% reduction in global CO2 emissions. This is simply too small of a decrease in CO2 emissions to show up against a background of considerable monthly and yearly natural variability in the atmospheric CO2 budget.
That relatively small 11% reduction also illustrates how dependent humanity is on energy, since the economic disruption is leading to U.S. unemployment rates not seen since the Great Depression of the 1930s. Everything that humans do requires access to abundant and affordable energy, and even the current economic downturn is not enough to substantially reduce global CO2 emissions.
ADDENDUM: How much of a decrease in CO2 emissions would be required to stop the atmospheric rise in CO2?
An interesting aspect of the observed rise of atmospheric CO2 is that it indicates the greater the CO2 concentration, the faster the “extra” CO2 is removed by biological activity. The observed annual rate of removal is 2.3% of the excess above a baseline of 295 ppm. The greater the “excess”, the faster the rate of removal.
Because of this rapid rate of removal, the anthropogenic CO2 emissions do not have to go to zero to stop the observed rise in atmospheric CO2. Using my simple model (blue line in Fig. 1, above), I find that a 43% reduction in anthropogenic CO2 emissions in 2020 would — in the absence of natural fluctuations in the carbon cycle — lead to a halt in the observed rise of atmospheric CO2 in 2020 over 2019 levels. This is about 4 times larger than the EIA estimate of an 11% reduction in CO2 emissions for the year 2020.
Discover more from Watts Up With That?
Subscribe to get the latest posts sent to your email.
When you decide to investigate a process that involves measurement, two fundamental questions always need confident answers:
1. What is the limit of detection?
2. What is the total error envelope?
Those wanting to track daily atmospheric CO2 during this 2020 lockdown should be aware that there is next to no daily CO2 data available to the public apart from some from Mauna Loa. That the agreement between daily NOAA and Scripps measurements there indicates an error envelope of some +/- 0.5 ppm CO2 (1sigma) for 2020 so far. This helps dictate the detection limit, indicating some 1 ppm.
Looking for a change of 0.2 ppm, as some people are, is therefore not possible.
There is a determination from several research bodies away from Mauna Loa to not release daily CO2 data for 2020 to the public. If you do not believe this, ask them, as I did.
Summarising, the citizen scientist has next to no hope of contributing to the science because access to required data is being denied by several of its curators, or simply not updated by others.
Science policy at its worst. Geoff S
Geoff
Something contributing to the problem may be that the burning of fossil fuels is a lower-bound on anthropogenic CO2. As I semi-quantitatively described, humans contribute a lot of CO2 through other activities related to eating, which probably hasn’t declined much.
https://wattsupwiththat.com/2015/05/05/anthropogenic-global-warming-and-its-causes/
heard this a couple of times on BBC World Service radio. some fun replies:
TWEET BBC News (World):
“If Covid-19 leads to a drop in emissions of around 5% in 2020, then that is the sort of reduction we need every year until net-zero emissions are reached around 2050” says Glen Peters, from the Centre for International Climate and Environmental Research
6 May 2020
https://twitter.com/bbcworld/status/1258139147413401607
6 May: BBC: Climate change and coronavirus: Five charts about the biggest carbon crash
By Matt McGrath
We’re living through the biggest carbon crash ever recorded…
But even though we will see a massive fall this year, the concentrations of CO2 that are in the atmosphere and warming our planet won’t stabilise until the world reaches net-zero…
As our chart shows, since the Spanish flu killed millions over 100 years ago, the global expansion of emissions of CO2, from the use of oil, gas and coal has risen massively…
What if CO2 was cut like this each year?…
“If Covid-19 leads to a drop in emissions of around 5% in 2020, then that is the sort of reduction we need every year until net-zero emissions are reached around 2050,” said Glen Peters, also from Cicero.
“Such emissions reductions will not happen via lockdowns and restrictions, but by climate policies that lead to the deployment of clean technologies and reductions in demand for energy.”..
https://www.bbc.com/news/science-environment-52485712
‘Changes in the atmospheric reservoir of CO2 occur when there is an imbalance between surface sources and sinks of CO2.’
The increases CO2 measured in the overnight dew of the Mauna Loa updraft of air represent the changes in the speed of Earth’s rotation caused by the 41,000-year obliquity cycle. They have nothing to do with the relatively minor anthropogenic CO2 emissions that are mostly used by photosynthesis. The 4 seasons ensure that these cannot be cumulative and vary with sun elevations. Any further changes as can be seen more easily in the annualised version of the Keeling curve are caused by solar system influences such as the time of the year that Earth laps Jupiter and it’s lapping of Saturn, etc. 1993 was the year that Uranus lapped Neptune, a once every 171.4-year event. Despite the current global cooling trend, CO2 is still going up, as it may be expected to do until the reverse of the cycle sets in about 11,000 years from now, or before that after the ocean has cooled enough to reduce its CO2 supply. I have written more on that on Quora
Nailed it John. Most sensible accurate post so far. I think you need to study Uranus a bit more ‘though.
How droll Loydo 🐈.
John B … We need to get Steve McGarrett onto this immediately. There’s been a major fraud occurred on Mauna Loa. This has resulted in scientific integrity being slowly throttled to death for cash 🤑.
“major fraud”
Extraordinary claims require extraordinary evidence, just ask John. Finding a result conflicts with your ideology doesn’t make it fraudulent.
https://www.esrl.noaa.gov/gmd/ccgg/trends/gl_trend.html
They’re all in on it right?
Et tu Tasmania…
Jack Black,
There are about 70 CO2 monitoring stations all over the oceans and coastal and on mountain tops which measure CO2 in least contaminated air. They are supervised by many people from many different organizations of different countries.
It is simply impossible to tamper with the data, without someone bringing that out.
Moreover the calibration scheme at Mauna Loa and many other stations is extremely strict. One can only hope that the same rigor will be implied for the temperature monitoring…
https://www.esrl.noaa.gov/gmd/ccgg/about/co2_measurements.html
Ferdinand
You said, “Moreover the calibration scheme at Mauna Loa and many other stations is extremely strict.” I also understand that there is a strict policy for pruning outliers in the readings. Might we be missing something from deleting data?
Clyde Spencer,
Hardly as using all data or only the retained data doesn’t show a difference in trend (within 0.1 ppmv/year), only more “noise”…
I have plotted the full hourly data set for the year 2004 here:
http://www.ferdinand-engelbeen.be/klimaat/klim_img/mlo2004_hr_raw.jpg
And for the “cleaned” data here:
http://www.ferdinand-engelbeen.be/klimaat/klim_img/mlo2004_hr_selected.gif
I understand that the Scripps measurement process involves the dehumidification of the original sample before it is passed through the detector. I speculate that some of the CO2 is absorbed within the moisture that is extracted, and this amount would vary with the humidity and temperature. If this is so, how do Scripps measure and make the necessary adjustment?
If they do not, then I speculate that the annual measured increase and decrease of CO2 might be at least partially caused by an annual fluctuation of humidity.
Could anybody advise?
TonyN,
The air is dried over a cold trap at -70ºC where most of the available water vapor forms a film of ice which doesn’t include CO2, only a thin film of CO2 may adhere at the surface, but that is compensated for by either passing several minutes of outside air (for continuous measurements) before reading the results, or (in the case of small samples like from ice cores) by passing a flow of a calibration mixture with about the composition of what is expected before the real sample is measured.
Ferdinand, thanks for the response. Does the station also make a continuous record of the actual humidity before freeze-drying? If so, then it would be interesting to see the annual fluctuation and whether it too aligns with the N Hemisphere growing season.
TonyN,
Not at the CO2 station I know of, but in the same complex is a meteorological station and that monitors humidity data continuously.
https://www.esrl.noaa.gov/gmd/obop/mlo/programs/esrl/met/met.html
Somewhere the data should be available…
If I understand the good doctor’s paper,his research indicates that to stop any further rise in CO2 in the atmosphere we would have to reduce World economic activity by “43%”.This covid crisis has reduced World economic activity by “11%”. Therefore we would have all(even the politicians and public servants who are still being paid) to suffer permanently an incredibly painful disruption to our way of life to achieve nothing really!
Anyone mention the 19C? Even the 18C.
Oh great,we need “only” a 4 times bigger reduction than has caused record massive unemployment and economic destruction.
Do these GND loons even know the hardships they are intending to waste on humanity? I think they do, it is their goal.
“Atmospheric levels of carbon dioxide (CO2) continue to increase with no sign of the global economic slowdown in response to the spread of COVID-19”
Dose this not prove that humans are not responsible for the rise in atmospheric CO2? World airplanes have practically stopped flying, and cities are empty of cars, all of which are blamed for causing rise of CO2!
“The increase in atmospheric CO2 observed since the 1950s is most likely dominated by anthropogenic CO2 emissions, which are twice as large as that needed to explain the observed rise.”
Wrong. Off course mankind’s CO2 emissions has not helped, but they would also have been sequestered underways were it not for the continuouly increasing temperatures coming out from LIA which shifts our CO2 sinks capacity to hold said CO2.
E.g ocean CO2 solubility capacity which shift very, very dramatically (gigaton wise) for a miniscule variation in temperature.
Henry and Dalton.
Oddgeir
[my apologies to the room, I have not read the comments. Too angry. So, others may have already ranted the following rant …]
“The reduction in economic activity would have to be 4 times larger than 11% to halt the rise in atmospheric CO2.”
Those of us alerting the world that an 11% drop in human contribution should be noticed at Mauna Loa and other stations, are … pause for emphasis ..
NOT CLAIMING THE RISE SHOULD STOP.
We are saying that at least a “ding” should be noticed.
Just a perturbation in the noise. A reaction, however small, to this stupendous decline in human contribution, which is beyond the wildest dreams of AOC et al in extent and speed.
Repeat: We are not claiming the huge drop should should halt the rise of CO2 atmosphere concentration. Only that SOME evidence should be noticed.
After all, the vaunted accuracy, precision, thoroughness, and professionalism claimed by the Climate Science Community for measuring CO2 concentration is absolutely true, right? They KNOW the concentration down to the PartPerMillion with sublime certainty, by the power of their awesome measuring instruments, right?
On top of which, they claim that of the current ~417 PPM, a significant percent is due to human-caused release. Right?
So … where is the ding? Where is the ding.
A reduction of 571 million metric tons for the U.S. (-11%) in 2020 means 5.2 Gigatonnes total annual CO2 emissions for the U.S, if my math is correct (and it usually is: shameless quote from Ironman). That means the rest of the world is expected to pump out 31.6 Gigatonnes in 2020. Here, the U.S. contributes 14% of annual anthropogenic CO2 emissions but produces ~25% of global GDP, that is, until this Covid-19 nightmare lockdown. Seems to me that the U.S. is not the problem because our coal burning has been cut in half since 2007. Meanwhile coal burning in China, India et al. has been increasing. So, why is the U.S. blamed for everything? Not that the burning of fossil fuels is a problem, but that’s a different argument.
If 2% a year increase in man made CO2 is enough to visible take the graph from 400 to 415 ppm in the 2014 – 2019 period a 15% drop in co2 in spring 2020 will definitely show up.
So no, I am not buying this.
What makes you think the rise in CO2 concentration from 400 to 415 was due to the increase in manmade?