Guest Post by Willis Eschenbach
Some days I learn a lot. Today was one of them. Let me start at the start. Back in 1987 in a paper entitled ‘The Role of Earth Radiation Budget Studies in Climate and General Circulation Research“, a prescient climate scientist yclept Veerabhadran Ramanathan pointed out that the poorly-named “greenhouse effect” can be measured as the amount of longwave energy radiated upwards at the surface minus the upwelling longwave radiation at the top of the atmosphere, viz:
The greenhouse effect. The estimates of the outgoing longwave radiation also lead to quantitative inferences about the atmospheric greenhouse effect. At a globally averaged temperature of 15°C the surface emits about 390 W m -2, while according to satellites, the long-wave radiation escaping to space is only 237 W m -2. Thus the absorption and emission of long-wave radiation by the intervening atmospheric gases and clouds cause a net reduction of about 150 W m -2 in the radiation emitted to space. This trapping effect of radiation, referred to as the greenhouse effect, plays a dominant role in governing the temperature of the planet.
And here is what Ramanathan was talking about:

Figure 1. All-sky (both cloudy and clear) greenhouse effect. In climate science, “upwelling” means headed for space, “downwelling” means headed for the surface, “forcing” means a change in downwelling radiation, “LW” is thermal longwave radiation, and “SW” is solar shortwave radiation.
The best modern information about this question comes from the CERES Energy Balanced and Filled (EBAF) dataset that I used to make Figure 1. It combines a number of satellite and other measurements into a single coherent group of individual datasets. Interestingly, Ramanathan’s estimate of the size of the greenhouse effect was “about 150 W/m2” and modern CERES data shows a number very close to that, 158 W/m2. Well done, that man!
Today, a chance comment got me thinking about top-of-atmosphere (TOA) downwelling longwave radiation versus what happens at the surface. A doubling of CO2 is supposed to lead to a 3.7 W/m2 increase in downwelling TOA longwave radiation … but what does that do to downwelling LW at the surface?
So what I did was to calculate on a monthly basis, the change in downwelling longwave radiation at the surface for each one W/m2 change in TOA greenhouse radiation. Figure 2 shows that result.

Figure 2. Change in downwelling radiation at the surface for each 1 W/m2 change in downwelling TOA radiation.
Now, this is curious. On average the change at the surface is a little less than half the TOA greenhouse effect change. So an increase of 3.7 W/m2 at the TOA from a doubling of CO2 becomes a 1.8 W/m2 increase at the surface. I would note that this value of 0.46 agrees in general with the published study of Feldman et al. in Nature magazine who found (from observations, not models) that surface forcing is 0.43 times the TOA forcing, quite near to the above figure.
Next, I got to wondering about something I’d never looked at—just how large an additional energy flux in watts per square metre of energy is needed to increase the surface temperature by 1°C. This is a simple calculation using the Stefan-Boltzmann equation, but I’d never done it for the entire globe. Figure 3 shows that result.

Figure 3. Increase in ongoing downwelling energy flux needed to increase the surface temperature by 1°C with everything else unchanged.
In Figure 3 you can see that as Stefan-Boltzmann says, it takes more energy to raise a hot surface by 1°C than to raise a cold surface by 1°C. And for the globe, the average is about 5.5 W/m2 per degree. That was a surprise to me, I didn’t expect it to be quite that large … but then as I said, I’d never calculated it.
So here’s the summary of today’s wanderings in CERESville.
• The long-accepted value for a doubling of CO2 gives a theoretical 3.7 W/m2 increase in downwelling TOA radiation. However, because of all of the factors that affect downwelling TOA radiation (changes in clouds, temperature, water vapor, eruptions, aerosols, etc.) and the fact that the log of CO2 is essentially a straight line, it’s not possible to determine that value experimentally. Here’s the problem:

Figure 4. Ramanathan’s greenhouse radiation, along with the change in CO2 radiation over the period. The CO2 radiation change has been set to the average of the greenhouse radiation for easy comparison.
Using that accepted 3.7 W/m2 figure for a doubling of CO2, that would give an increase in downwelling surface radiation of 1.8 W/m2.
• This doubling of CO2, in turn, would warm the surface by:
1.8 watts per square metre CO2 surface forcing / 5.5 watts per square metre per degree C ≈ 0.3°C …
By comparison, the IPCC says that a doubling of CO2 would increase the surface temperature by 1.5°C to 4.5°C. If we take the midrange value of 3°C, this would imply that there is some mysterious feedback increasing the CO2-caused surface temperature change by a factor of about ten …
The general view seems to be that this mysterious ten-fold increase is somehow the result of feedback from water vapor and clouds. The problem with that theory is that the CERES measurements I’ve used above include all of those feedbacks. That is to say, the GHE value includes the feedback effects of clouds and water vapor, and the surface downwelling radiation also includes those feedbacks.
Answers gladly accepted. Here on the northern California coast, despite the screaming about “PERPETUAL CALIFORNIA DROUGHT! CLIMATE EMERGENCY!” … it’s raining again, the trees are happy, and the cat is not.
My best regards to all,
w.
NOTES: For those unclear on the physics behind the poorly-named “greenhouse effect”, it works because a sphere only has one surface, and a shell has two surfaces, inside and outside. See “The Steel Greenhouse“, “People Living In Glass Planets“, and “The R. W. Wood Experiment” for further discussion.
MY USUAL REQUEST: When you comment please quote the exact words you are discussing, so we can all be clear on your exact subject.
Willis,
“A doubling of CO2 is supposed to lead to a 3.7 W/m2 increase in downwelling TOA longwave radiation”
Is that really true? Do you have a source? Doubling is supposed to lead to a 3.7 W/m2 increase in forcing. That is, in energy flux available to result in surface warming. But I haven’t seen a claim that it would produce a measurable IR flux of that magnitude anywhere.
Nick, it’s spelled out pretty well in the Feldman link above.
Regards,
w.
Just a comment for Figure 4. The yellow trend line has been named by “Greenhouse radiation”. It is the difference between the surface emitted radiation and the atmosphere emitted radiation. Which is normally 395 – 240 = 155 W/m2. In this trend line is the super El Nino 2015-16 included. It cannot be caused by GH effects. I think that this is a problem in using real observations. There are many – even strong impacts like ENSO – included and therefore these observations cannot be called Greenhouse effects only.
Ollila, all you are pointing out is that CO2 and GHGs are not the only contributors to the size of the greenhouse effect.
Regards,
w.
If one measures the temperature (thermal heat energy) of the atmosphere, they are in actuality measuring the temperature of all the gas molecules (N2, O2, H2O, CO2, etc.) that are resident in the locale that the temperature is being recorded.
All atmospheric gas molecules can conduct thermal heat energy “to & from” all other gas molecules that they come in contact with.
The per se “greenhouse” (radiant) gas molecules can ALSO, both radiate and absorb IR (infrared) thermal heat energy “to & from” all other “greenhouse” gas molecules, … as well as “to & from” the earth’s surface and to outer space.
So, given the fact that both the H2O and CO2 molecules are “conducting” thermal heat energy “to & from” all other gas molecules, ….. plus radiating and absorbing IR (infrared) thermal heat energy, ….. how is it possible to accurately calculate the “role” that CO2 plays ….. “in size of the greenhouse effect”?
Yes, don’t wanna use real observations when doing “science” they screw up the results. Use models or made up observations they give much better graphs.
Willis,
Feldman apparently was NOT able to directly measure downwelling IR in the 15 micron band. Gero tried and failed, despite the AERI instruments being designed specifically to make that type of direct measurement. These instruments are extremely sensitive and there is no reason that the signal should not be able to be detected directly.
What Feldman did once he was brought in to evaluate why downwelling CO2 radiation could not be detected, was to create a SIMULATED signal to be combined with the actual signal received.
Viola! The result was a detectable CO2 downwelling signal. It smacks of Mannian manipulation.
I cannot put my finger on the walnut shell that actually has the pea under it but hopefully someone can
I think the downwelling longwave radiation at TOA is very close to zero. The satellites that do the readings fly at an altitude of around 700 km. Only very little “cold space” back radiation there, nothing to do with atmospheric greenhouse gases.
For practical reasons TOA is sometimes calculated to be above the tropopause, say at 20 km altitude. The greenhouse effect is negative in the stratosphere..
Olof,
“I think the downwelling longwave radiation at TOA is very close to zero.”
Of course it is zero because, by definition, there is no “atmosphere” to be heated beyond the TOA. The satellites measure upwelling radiation, escaping from the atmosphere to space.
Surprisingly, looking at the entire electromagnetic spectrum (“DC to daylight and beyond”) the Earth’s atmosphere is mostly opaque to EMR in general. But there are two big gaps (“windows”) in the absorption spectrum, which tend to fool us humans into believing the atmosphere is “mostly transparent”.
http://coolcosmos.ipac.caltech.edu/cosmic_classroom/ir_tutorial/irwindows.html
The first window is in the radio frequency (RF) spectrum, roughly from mediumwave to microwave, which allows radio transmissions to and from outer space.
The second window is the visible light and infra-red spectra, which includes longwave IR. However the IR window is onlypartially transparent (but very transparent around 10μm).
There are many satellites which observe this light through the atmosphere from above. For example, here’s a summary of the GOES-16 IR viewing “channels”.
https://www.weather.gov/media/crp/GOES_16_Guides_FINALBIS.pdf
The outgoing LW radiation is 240 W/m2 and it is a sum of two fluxes: 212 W/m2 emitted by the atmosphere (around the height of 9 kilometers, because thereafter there is no much material) and the transmitting flux from the surface 28 W/m2; totally 240 W/m2.
Use MODTRAN to do the calculations, and you will find that doubling (375 to 750 in this instance) produces a difference of about at the top (70km actually) of a tropical atmosphere. So, Willis’s value seems reasonable even without a reference to back it up.
Kevin,
My question was whether the 3.7 W/m2 was an IR flux that could be observed. You can do a Modtran calculation, but it depends on your assumptions. Willis quoted below the section of AR5, which I’ll extract:
“RF is defined, as it was in AR4, as the change in net downward radiative flux at the tropopause after allowing for stratospheric temperatures to readjust to radiative equilibrium, while holding surface and tropospheric temperatures and state variables such as water vapor and cloud cover fixed at the unperturbed values. ERF is the change in net TOA downward radiative flux after allowing for atmospheric temperatures, water vapour and clouds to adjust,but with surface temperature or a portion of surface conditions unchanged.”
They are theoretical values with assumptions; in observation the surface temperature does not remain unchanged, but warms. In fact at equilibrium, the observed RF would be zero.
@Nick Stokes
Good catch. According to Trenberth’s energy budget diagram:
Downwelling solar: 341.3 w/m2
Upwelling reflected: 101.9 w/m2
Upwelling LW: 238.5 w/m2
Net: 0.9 w/m2 downwelling
https://scied.ucar.edu/radiation-budget-diagram-earth-atmosphere
*******
I see no reason a doubling of CO2 would cause this value to change much. Like you pointed out, the 3.7 w/m2 at the TOA is a hypothetical given no surface or troposphere warming, ie. no adjustment to upwelling.
There are plenty of studies that indicate that a doubling of CO2 calculates to less than 0.5 C, without following the math in detail, to agree with the IPCC models it would require Willis calculations to be out by a factor or 10, can anybody point to the 10????
I firmly believe that CAGW is a false theory but even so I feel that as a scientist I need to point out a fallacy here.
The action of a green house gas is to absorb surface emission at the green house gas wavelengths (instead of it escaping to space) and replace it with radiation at those wavelengths escaping to space from the top of the green house gas column. Since the top of the green house gas column is typically the tropopause or more accurately the lower stratosphere which is colder than the surface overall emission to space is reduced.
This bimodal effect happens because for most GHG’s the atmospheric column is so thick. Spectroscopists use the term absorbance to describe the impact of absorbing substances. An absorbance of 1 means the substance (in this case the atmospheric ghg column) absorbs 90% of the incident radiation. An absorbance of 2 means it absorbs 99%, an absorbance of 3 means it absorbs 99.9% and so on. So what is the absorbance of the atmospheric CO2 gas column? Answer about 3000 absorbance!!!!! Most of the surface emission is absorbed in the first few meters!
That is WAY into saturation and begs the question, does further increase change anything? The answer is yes it does, in fact GHG’s in the atmosphere only become significant AFTER they saturate. The reason is that the absorbance profile is not a box car but rather something very close to a gaussian (actually a Lorentz profile). Gaussian profiles never go to exactly zero. One of the features of a gaussian is that convolving the spectrum with itself (equivalent to doubling the concentration) gives a new gaussian with the same mean but a greater standard deviation. Each doubling gives approximately the same increase in line width. Increasing the line width means the GHG column absorbs over a slightly greater range of wavelengths (ie: it intercepts more of the surface radiation) and this is the source of the logarithmic relationship between concentration and retained energy. Before the gas column saturates the relationship is closer to linear but the unbroadened line is so narrow that the total impact is nearly negligible. It is only when the line broadens after saturation of the line center that the impact becomes significant.
The energy retained by doubling concentration will be the additional surface radiation blocked minus the additional top of gas column radiation. This is easily calculated using Planks law but even without any calculations it is obvious that since the additional top of gas column radiation is not zero (since the top of gas column is nowhere near absolute zero) the additional surface radiation blocked must be larger than the energy retained, not less than it. I have done the Planks law calculation and it turns out that for a 3.7 watt/sqM total change in retained energy for the planet, the incremental surface radiation blocked is around 5.5 watts/sqM which corresponds to about 1C of warming before feedbacks. This seems to agree with the claims I have seem from both warmists and skeptics. The BIG issue of course is what are the feedbacks, are they positive or negative. I have reason to believe they are negative and the experimental data Willis cites seems to again confirm this.
I also anticipated that the absorption line would broaden as you did. And where it is saturated it would only lower the reabsorption height for the upwelling FIR when the concentration of CO2 increases. Then it would be interesting to know what the the time delay between absorption and re-emission is and how that would compare to the mean collision time of the gas molecules, since the absorbed energy would thermalize after a collision.
The energy imbalance in the satellite measurement could also come from this: the satellite looks at different heights in the atmosphere, depending on the absorption depth at a particular wavelength. So where CO2 is optically thick, the satellite will look at emissions at higher altitudes where the atmosphere is much colder, and where it is optically thin, it could look all the way down to the surface. On average, there should be less FIR measured than what is emitted from the surface.
But it is ‘Planck’ not ‘Plank’.
Stephan, you are right Planck not Plank my apologies. As regards rising CO2 reducing the reabsorption height, where does on define saturation. From an engineering point of view a reasonable point would be where the gas column absorbs 99% of the incident radiation ie: 2 abs.
But the total CO2 column is 3000 abs; 1500 times more than saturation. 99% of the surface emission at 14.7 micron is absorbed in the first 1/1500 of the gas column. The gas column extends up to the tropopause but the pressure is reducing with altitude. The first 1/1500th of the gas column is at an altitude of about 5 meters. Whether it is 5 meters or 5.5 meters is really quite irrelevant. Indeed 90% is absorbed in the first 2.5 meters. On the issue of relative time constants of emission vs thermalisation but are extremely fast (nano seconds) and we know from observation that the emission intensity depends on the bulk gas temperature not on the amount of energy being absorbed. That suggests the thermalisation time constant is faster than the emission time constant.
“I have reason to believe they are negative…”
So the 1°C rise since 1900 could have been more?
Ah Loydo; firstly, how much of the claimed 1C rise is due to “adjustments” of the historical data set – I suspect a very significant portion. Secondly, how much of the actual temperature rise is is due to causes other than rising CO2. By the way we have gone from 280ppm to 410 ppm which is only 0.55 doublings so the additional retained energy is only 2watts/sqM before feedbacks. Thus the direct impact before feedbacks would have been about 0.55C and if the feedbacks are negative the actual rise due to increasing CO2 would be well under half a degree centigrade.
By the way, the theory of CAGW is that rising CO2 reduces earths energy loss to space. Since the incoming energy is constant that creates an energy imbalance, more energy in than out which causes the Earth to warm. Energy loss to space is measured as outgoing long wave radiation or OLR for short. So if the theory is right we should be seeing OLR fall as CO2 rises. Of course as Earth’s temperature rises OLR will increase since rising temperature increases emission so the net impact should be a rise due to increasing temperature (3 watts/sqM/C) minus a fall due to rising CO2 (3.7 watt/sqM/doubling) all before feedbacks. Positive feedback due to water vapour as claimed substantially increases the negative 3.7 watts/sqM/doubling.
But if Earth is warming at an increasing rate, net OLR would have to be falling as CO2 rises.
Trouble is NOAA has been measuring OLR since the satellite era and over that time it has risen by 3 watts/sqM. Earth’s temperature has risen by less than 1C since 1980 (even warmists only claim 1C since 1900) so a rise of 3 watts/sqM is even more than could be explained by warming, assuming zero impact from changes in CO2 or feedbacks. So where is the evidence to justify the claim that rising CO2 is heating the earth by reducing energy loss to space. Also, if OLR is rising what is the source of the energy imbalance driving the warming?
The only answer I can see is that Earth’s energy input is rising and since the solar output is constant that means Earth’s albedo must be falling. ie: cloud cover is reducing. Well NOAA also measure albedo and cloud cover and guess what, both are indeed falling. So Earth is not warming because GHG’s are reducing OLR, it is warming because cloud cover is reducing which is exactly what Svensmark’s theory is suggesting (note, since clouds also reduce OLR reducing cloud cover will increase OLR but will increase absorbed energy even more). Guess we need to hear how rising CO2 is driving down cloud cover.
Would you have any references handy that discuss the increase of OLR?
Carl; NOAA do publish the data but it is difficult to find in a convenient form. Other sites have republished the NOAA data as a convenient graph. They this site http://www.climate4you.com/GlobalTemperatures.htm#Outgoing%20longwave%20radiation%20global. Please note the 3 watts/sqM rise (980-2020) is more than one would expect even from the claimed global temperature rise in the absence of any impact form rising CO2 whatsoever.
As far as a discussion, I have not seen any rationalisations that make sense to me. If you find a rational understandable explanation I would be very interested to see it. Bottom line, the claim is CO2 causes warming by depressing OLR yet the experimental data is OLR has been on average rising for the last 40 years at least. If a theory predicts one outcome yet real world data shows the opposite outcome to me that casts VERY serious doubt on the theory. At the very least one would expect massive discussion over the issue. The fact that there is not (indeed, to my way of thinking, the silence on this issue is suspicious in itself) starts to sound to me like a coverup.
Very nice!
Neatly bypasses (i) a multitude of complex calculations, each with their own inherent (&/or applied) errors & (ii) all the various “unknowns” affecting/involved in the “Forcing Formulae” and cuts straight to the chase with a very nice simple comparative approach! 🙂
≈ 0.3°C sounds pretty reasonable to me (unlike most of the Alarmist drivel we’re subjected to)… I reckon I can live with that… 🙂
My personal filtering of the science and the BS leads me to expect around 0.8 deg C, Willis’ figure is surprisingly low. Not that surprise is an argument against numbers.
That is all part of the pseudo scientific trickery. They know that most people will be unaware of mean, median and long tailed probability distributions and that they will instinctively apply the little maths they know: add and divide by two.
That is why they keep a wide range to include the improbable high values and boost the incorrectly assumed “mid range” as being the mean. If you increase percentiles you use the lower figure does not move much but upper limit get much bigger. Plus the press always go for “may be as a much as ” figure for an exciting headline.
Willis:
No, SW is part of solar, LW is also part of solar. If that caption reflects the way the calculation is actually done it will probably affect the bottom line result.
Greg, in climate science a distinction is made between shortwave IR and longwave IR. The former is a part of sunlight. The latter, usually called “LW”, is not part of sunlight. It is thermal IR emitted at earthlike temperatures.
w.
“The latter, usually called “LW”, is not part of sunlight”
Do what?
It may contain a lot less LWIR than at other frequencies, but it does not contain Zero.
https://en.wikipedia.org/wiki/Sunlight#/media/File:Solar_spectrum_en.svg
We have been here before Mr Eschenbach, you know how nit picky I am.
ps LWIR may not reach the surface if it is absorbed by the Atmosphere, but it is part of Solar Radiation.
Is this true?
“The upwelling LW channel produced by CERES is Surface IR which is confined to the window wavelength range of 8-12 μm, this range is unaffected by GHGs. The expectation is therefore that if the cloud concentration goes up backscatter to space of incoming SW will increase but backscatter of LW towards the surface and absorption of the surface LW by the water droplets in the cloud will also increase. This means that the presence of the clouds will reduce the upwelling LW at the same time as it increases reflected solar leading to the negative correlation. This effect has nothing to do with GHGs.”
https://wattsupwiththat.com/2014/01/07/upwelling-solar-upwelling-longwave/#comment-1170207
If so, Does CERES observe surface total upwelling LWIR or is it calculated from temperature?
So I got an answer from Kevin Kilty: It’s calculcated from surface temperature estimates.
“The CERES surface temperatures are a skin value, derived from GEOS data. The method of producing these temperatures is complex, and involves both parameterization and maximum likelihood inverse methods. Comparison against independent temperature data, satellite and ground, suggests a precision of about 0.5°C. The amount of analysis and scientific work that goes into these efforts is well described in a series of technical documents, available online, that are well worth reading for a background in the subject.”
Seems to be two problems here: 1) Looking for how much does radiation affect temperatures while using temperature to estimate radiation. And 2) Looking for changes in radiation and temperature smaller than the error of observation.
Sorry forgot the link to Kilty’s post:
https://wattsupwiththat.com/2019/06/15/a-third-look-at-radiation-versus-temperature/
Ron, that data on Ceres is extremely interesting. It is abviously not actually measuring the things that we thought it was and is “model” based yet again.
I was a bit concerned when I saw it’s description in the top of the post ie ” CERES Energy Balanced and Filled (EBAF) dataset”.
I vaguely remember that CERES has an unexplained inaccuracy of about 5 W/m2. That does not render the data useless, as it still detects changes. Rather than publishing raw instrument data, they “energy balance and fill” them to the best of their abilities. Keep in mind that the EBAF is just the best available guess.
So Willis said LWIR “is not part of sunlight”. That’s wrong of course. He should have said, the LWIR part of “sunlight” is negligible, compared to “earthlight”.
Sun and Earth are both blackbody radiators, with distinctive Planck curves.
https://www.acs.org/content/acs/en/climatescience/energybalance.html
Note that the earthlight, having a lower Planck temperature (~210K), accounts for virtually all LWIR detected radiation.
The general rule of thumb for classifying detected radiation as sunlight vs earthlight is: if the wavelength is greater than 4μm, then it is “earthlight”.
Thanks johanus, a useful rule of thumb. Is it also true that the longer the wavelength, the lower the elctron voltage? I read that solar full spectrum radiation emanating from the sun’s surface at 5,778 K has 48 times the eV as what CO2 emits?
Ron, you can see it for yourself by looking at the area under the curve that I posted.
There have also been a couple of posts on this forum (but not this thread) that show that CO2 Energy is ineffective to produce any warming of it’s own.
Thanks A C. That diagram does not display the energy implications as clearly as this one does:
 ?w=1000&h=796
https://rclutz.wordpress.com/2020/01/16/co2-so2-o3-a-journey-of-discovery/
Ron, yep, I like your graph more.
@Ron Clutz
“Is it also true that the longer the wavelength, the lower the el[e]ctron voltage? “
Yes, the wavelength of a photon is inversely proportional to its _energy_ (not “voltage”), the proportion constant being the Planck h=6.62607004 × 10**-34 . So, E=h=c / λ
[FYI, “electron-volt” is defined the kinetic energy due to acceleration of one electron, starting from rest, pushed by electrostatic potential of one volt. So it is just another unit for expressing energy, but for use at a very small scale. It is not correct to call it ‘voltage’ ]
“I read that solar full spectrum radiation emanating from the sun’s surface at 5,778 K has 48 times the eV as what CO2 emits?”
You are trying to compare apples and oranges. In one hand you have the Sun’s full spectrum EMR output (“solar exitance”) which is about 63 megawatts per square meter (from the Sun’s surface). What is in the other hand? CO2 exitance? But that depends on the excitation state of the molecule and the wavelength of the emission, which could range from zero upwards. So comparing the Sun’s full spectrum output to the output of an excited molecule. ??? That does not make sense.
Perhaps you meant the ‘full spectrum output (radiant exitance) of the Earth’, which would be about 240 watts per square meter. Much smaller than solar exitance, of course, but a valid comparison.
[BTW, the solar and terrestrial exitances were shown on the ACS black-body plots in my link above]
It also seems that electron volt is the proper unit of energy for photons, though I take your point that this is not voltage in the usual sense.
“When dealing with “particles” such as photons or electrons, a commonly used unit of energy is the electron-volt (eV) rather than the joule (J). An electron volt is the energy required to raise an electron through 1 volt, thus a photon with an energy of 1 eV = 1.602 × 10⁻¹⁹ J.
Johanus, just a small nitpick to your informative comment. Your linked diagram says the area under the solar radiation curve is 63,000,000 Wm^2 compared to 250 Wm^2 for the earth radiance curve.
@Ron Clutz
“It also seems that electron volt is the proper unit of energy for photons,”
Any unit of energy, e.g. joule, BTU, horsepower, erg, is ‘proper’ for photons because they are all equivalent (up to a scale factor). But it would be proper to say that eV is convenient for photons, because of its very small scale.
Willis, in physical (not climate) science there is no difference between incident solar LW radiation and reflected LW radiation. “Ninety-nine percent of the solar energy is in the range 0.276 to 4.96 μm, and 99.9 percent of the the solar energy is in the range of 0.217 to 10.94 μm”. https://ntrs.nasa.gov/archive/nasa/casi.ntrs.nasa.gov/19710021412.pdf About thermal IR radiation. Physics emphasizes the difference between infrared and thermal energy: “Infrared radiation is popularly known as “heat” or, perhaps, “heat radiation”, since many physics teachers traditionally attribute all radiant heating to infrared light. This is wrong, and is a very widespread misconception. Light or electromagnetic waves of any frequencies would heat surfaces which absorbs it”. ( Infrared Radiation. Van Nostrand Scientific Encyclopedia. https://onlinelibrary.wiley.com/doi/abs/10.1002/0471743984.vse4181.pub2 )So, how physically justified is the calculation of the temperature change based on the values of the energy of infrared radiation?
Nice to see “yclept”. We should use it more.
Sure, but let’s not become ycleptomaniacs.
Good one
Hello Willis,
I am not sure I understand some of this. Well, actually I am sure that I don’t. If the forcing at the surface is only 0.43 of the TOA forcing, where is the remaining energy going? If it doesn’t go out and it doesn’t reach the surface, then it needs to somehow stay in the middle. Warming the atmosphere itself. Some or all of its layers. And isn’t it the atmosphere’s temperature what we measure, near the surface? Can’t the atmosphere increase its temperature more than the surface itself? And can’t it do it by different means than infrared radiation? The fact that the radiation received is less doesn’t mean that it is not receiving energy in a different way, which should be accounted for. Does this make sense?
“If the forcing at the surface is only 0.43 of the TOA forcing, where is the remaining energy going?”
I was wondering about the same. Would that”then maybe radiate into space during the night?
This is a very important question.
As so little Solar Radiation reaches the surface, does the same apply to LWIR from the upper atmosphere?
If so what happens to it?
In reading the head posting, the description does make it sound as though some portion of the upwelling power flow is just disappearing into nothing? Or else causing a persistent imbalance to be sustained, cooking the planet in short order?
I believe downwelling at the TOA is trapped by greenhouse gases on the way down before hitting the surface and then partly emitted as upwelling radiation.
This is all based on erroneous assumptions and worse – pseudoscience.
https://arxiv.org/PS_cache/arxiv/pdf/0707/0707.1161v4.pdf
https://arxiv.org/pdf/1012.0421.pdf
The article seems to explore (or exploit) the subtle differences between modeled surface temperature and modeled and “measured “surface *air* temperature. Since these two relate to different models and calculations, it’s entirely unsure if there’s anything here at all.
Indeed. What Willis does in his articles is to clearly expose the stupid complexity of a non-science called ‘climatology’. By cutting out 95% of erroneous waffle, he exposes the truth; there is nothing there at all.
That is not to say that climate change doesn’t happen. It does, it will always. It doesn’t mean humans don’t change their environment and affect some balances; 365/24/7 lifestyles in increasingly urban locations coupled with modern agricultural techniques is bound to affect local environments.
But Willis very cogently puts silly computer-driven forecasts into true perspective. he is able to do this because he has no axe to grind, no skin in the game.
I could not figure out the basis of this clause: “Using that accepted 3.7 W/m2 figure for a doubling of CO2, that would give an increase in downwelling surface radiation of 1.8 W/m2.” I think that according to the IPCC, the radiative forcing is exactly the value of 3.7 W/m2.
How do we get the corresponding temperature? According to the IPCC, it is dT= CSP * RF. CSP (also marked by λ) is the climate sensitivity parameter. It has two values: for TCS it is 0.5 K/(W/m2) and for ECS it about 0.865 equal to the ECS value of 3.2 C, which is the average ECS value of 30 GCMs as tabulated in Appendix 9.5 in AR5. TCS value according to the equation above is 1.85 C and according to 30 GCMs in Appendix 9.5 it is 1.8 C – close enough.
By the way, this simple equation always raises fierce protests among the Finnish IPCC supporters, when I have used it in my blog stories. They say that it is not real IPCC science, but the real IPCC calculations are based on using GCMs. Then I ask that can you name the GCM accepted by the IPCC. No answer. Anyway, this simple equation works even with RCP8.5 which is the worst case (an impossible) scenario of the IPCC.
Antero Ollila January 20, 2020 at 11:40 pm
Yes, the radiative forcing is 3.7 W/m2 … but not at the surface, instead, at the top of the atmosphere or at the top of the troposphere. From the IPCC:
and
Finally …
SOURCE: IPCC AR5
Note that in no case is this the actual forcing at the surface, as you are claiming. The Feldman et al. paper used observations to determine that the difference between TOA forcing and surface forcing is 0.43, and my own calculations put this ratio at 0.46.
Best regards,
w.
The definitions of RF and ERF defines in which conditions the magnitude of RF or ERF should be calculated. So far so good. But then we have only defined the driving force. We should calculate the surface temperature effect. This definition does not say anything about it. The final step in the model world is to increase the surface temperature and to find out what is the new temperature which brings the Earth back to the radiation balance, which means that the outgoing LW radiation must be the same as the incoming SW radiation. Only then we know, what we really should know – the surface temperature effect.
For example, if the case of TCS by raising the CO2 concentration from 280 ppm to 560 ppm: According to IPCC, the outgoing LW radiation at TOA will be 3.7 W/m2 less = 240-3.7 = 236.3 W/m2. It means that the Earth’s surface is not cooling with the same amount as before even though the incoming SW radiation remains the same. The GH effect has now been involved and the atmosphere radiates 3.7 W/m2 to the surface. The total SW plus LW radiation has now increased from value 510 W/m2 to 513.7 W/m2 (165 + 345 + 3.7). According to the physical laws, the surface temperature starts to increase until a new balance has been reached. According to the IPCC, it is 1.8 C. The Earth can reach a new balance value in about a year.
I did a step-by-step illustration of what you are outlining here in a blog from last spring found here.
Only if radiative balance would exist.

In the tropics we see max ~1000 W/m^2 on a good sunny day. Don’t believe the SST goes to the accompanying ~364K.
Back in the real world the sun warms the upper 5m or so directly and it takes ~21 MJ to increase the temperature of a column of 5 m^3 water 1K, pretty much regardless what the initial temperature was.
How come the SB calculation for the earth works out to a 5.5 watts for a 1C rise, when say using the MODTRAN model, it is 3.7 watts? Where is the disconnect, is it because temperatures above the average take considerably more energy to raise 1 C than those below?
If this is the case then the basic 1.2 C for the 3.5 watts, per doubling, is fundamentally wrong, and is nearer 0.8 C.
This is a big change, huge. This is the fundamental figure everyone works with.
Matthew, no clue about Modtran. But we can calculate it directly. The average temperature of the planet is on the order of 14°C, which is 287.15K.
Per Stefan-Boltzmann, this equates to radiation of 385.5 W/m2. The formula is
W/m2 = 5.67E-8 * emissivity * K^4
= 5.67E-8 * 1 * 287.15^4
= 385.5 Wm2.
If it warms by 1°C, this equates to radiation of 390.9 W/m2.
The difference is 5.4 W/m2 … I’ve assumed an emissivity of 1, as most natural surfaces have an emissivity quite close to 1. If we use an average emissivity of 0.97 instead, the difference is 5.2 W/m2 …
Regards,
w.
Willis
I’ll use my own terminology & very rough figures here so don’ t quote me.
Basically we currently have a surface flux of about 390 w/m2 (average temp of ~288k).
Because of the greenhouse effect only about 6o% is transmitted through the atmosphere to space, i.e. 235/390. Basically the 390 w/m2 surface flux drives a 235 w/m2 TOA flux.
If ghgs reduce TOA flux by 3.7 w/m2 the surface will need to warm so that equilibrium can be restored (i.e. 235 w./m2 is radiated back to space).
New TOA flux = 231.3 w/m2
To restore equilibrium TOA flux needs to increase by a factor of 1.016, i.e. 235/231.3
So surface flux needs to increase by a factor of 1.016
390 x 1.016 = 396.2 w/m2 which represents a temperature of 289.1 k
Therefore the surface will need to warm by 1.1 k to restore equilibrium at TOA. This is close to the 1.2 k per CO2 doubling (NO feedback) figure which is regularly cited but my figure comes from rough approximations.
Conclusion: Forcing at surface should be about 1.6x forcing at TOA.
OK, gotcha, thanks
I just had a quick look at MODTRAN.
Tropical atmosphere: 400ppm CO2,
Upward IR Heat Flux 298.52 W/m2
Ground Temperature 299.7K
Increase surface by 1ºC
Upward IR Heat Flux 302.947 W/m2
Difference = 4.4 W/m2
Midlatitude summer:
Difference = 293.873-289.602 = 4.3
Midlatitude winter:
Difference = 3.7
Subarctic summer:
Difference =4.0
These values are for a surface at 299.7 and 300.7K
So MODTRAN lies between the 3.7 value and the value calculated by Willis.
Willis, Ramanathan apparently assumed a global temperature of 15 C to get his 390 W/m2 emission rate. I recall looking on KNMI at the absolute (not anomalous) calculations, and being quite surprised that the the models disagreed in their estimate of current temperature by what seemed to me to be rather large: 12-15 C.
What would be the emission rate associated with 12 C? Or 13.5 C, which would correspond to the model mean?
12°C = 374.9 W/m2
13.5°C = 380.2 W/m2
15°C = 390.9 W/m2
For the average temperature see The Elusive Absolute Surface Temperature by NASA. From that:
w.
13.5°C should be 382.8 W/m2 (380.2 W/m2 is for 13.0°C).
Willis
Since the ‘forcing’ varies with temperature, and we are dealing with a 4th power, I think a better approach would be to use the average temperatures by latitude, and then determine the average forcing instead of using a single average temperature for the globe.
Clyde, that’s what I did in Figure 2—a gridcell by gridcell calculation first, followed by an area-weighted average.
w.
Willis
My apologies for not reading more carefully.
Willis,
As always, thank you for an interesting read!
One issue which has bugged me for some time,
I get the impression that 2 things are mixed up when people talk about ‘surface temperature’.
One being the temperature of the ‘ground/water surface’ used to calculate the emissions from same surface using SB. And the second being the near surface ‘air temperature’ measured some distance above the ground surface (standard 1 meter above i think). Now, as anyone who has ever walked barefoot over a non-vegetated surface (beach, road, poolside, desert etc) on a sunny day knows from direct personal observation, the difference between the two can be painfully large.
So could it be that the actual emission from the surface is in fact very different from what a calculated value using ‘air temperature’ would suggest? and what effect would that have on the ‘greenhouse effect’?
Best regards,
Willem
Question for you brainiacs…
Willis on surface emissions –
“12°C = 374.9 W/m2
13.5°C = 380.2 W/m2. Plus 5.3 W/m2
15°C = 390.9 W/m2. Plus 10.7W/m2
Yet if a doubling of CO2 is supposed to lead to a 3.7 W/m2 increase in downwelling TOA longwave radiation;
then how does plus 3.7 W/m2 produce progressively larger surface emissions per doubling?
As the surface warms would it not take progressively larger increases in downwelling LW radiation to produce the same affect?
Thinking about the article, I got this idea for an experiment, to measure the effect of CO2.
You have a shelter, with a roof of let’s say 4m^2, on four poles, let’s says of 2m high.
You have a radiation-meter outside and one under the shelter and wait for a cloudless and calm day.
Then you blow air with increasing amounts of CO2 over the 2 meters, from 200ppm to 800ppm, steps of +50.
And you measure the readings of the one under the shelter and the one in the sun.
I think you should then see a decreasing difference between the 2 readings. If CO2 has any effect.
And if so, you could calculate that effect. Or am I totally wrong?
Scarface, I fear that won’t work. See my post referenced above, The R. W. Wood Experiment, for why.
Best regards,
w.
Thank you!
Scarface,
I once pointed out to a fellow engineer that the increase in atmospheric CO2 since 1850, was about the same as me opening a soft drink can in my office, which didn’t cause my office to warm up. He said “… but there is a beam length issue…”. A few minutes of calculations with the Hottel charts hanging on our wall showed him to be correct….so you can actually know quite a bit about CO2 and IR, and still be very wrong in your conclusion.
Maybe you could write a guest-post about this, because now I want to know!
Willis’s story is also about the GH effect (GHE). I use real radiation values for illustrating the GHE. The first fact is the radiation fluxes must be absorbed by the Earth’s surface in order to have any temperature effect. For example, solar radiation is at TOA 340 W/m^s but only 240 is getting absorbed by the Earth and because the Earth is radiation balance, the same 240 W/m2 escapes as LW radiation into space.
The first observation is that only 165 W/m2 of solar radiation is absorbed by the surface. Now we have a problem. According to Planck’s law, the black surface temperature of 240 W/m2 is about
-18°C, and the measured surface temperature is about 15 C. This difference 33°C is a generally accepted measure of the GHE.
There must be more radiation energy absorbed by the surface because its temperature is so high. And there is. The observed LW energy flux radiated by the atmosphere to the surface is 345 W/m2. The surface does not make any difference if it is SW or LW radiation if it can be absorbed. So, totally the radiation absorbed by the surface is 510 W/m2. It 213 percent more than 240 W/m2.
The extra radiation absorbed by the surface is 510 – 240 = 270 W/m2. It is the real GHE effect and magnitude of the GHE. But this magnitude is different according to the IPCC. They define the GHE like this in AR5 / p. 126: “The longwave radiation (LWR, also referred to as infrared radiation) emitted from the Earth’s surface is largely absorbed by certain atmospheric constituents – (greenhouse gases and clouds) – which themselves emit LWR into all directions. The downward directed component of this LWR adds heat to the lower layers of the atmosphere and to the Earth’s surface (greenhouse effect).”
By simple words, the IPCC says that the GHE effect is the difference of LW radiation emitted by the surface (395 W/m^2) and the LW radiation emitted by the TOA into space (240 W/m2) = 155 W/m^2, and what is more, this absorbed radiation is the same as emited by the atmosphere to the surface. This 155 W/m2 is the same as used by Schmidt et a. (2010). The IPCC’s definition conflicts with the reality:
1) The IPCC says that the absorption (155 W/m2) is the same as the LW radiation to the surface (345 W/m2). It is against physical laws.
2) Or even though the LW radiation downwards is 345 W/m2, only 155 W/m2 have real temperature impacts. The surface cannot leave the difference 345-155 without absorption; it is against physical laws.
What is the real explanation? The downward LW radiation emitted by the atmosphere is the sum of four different energy sources: 1) solar radiation absorbed by the atmosphere 75 W/m^2, LW radiation absorbed by the atmosphere 155 W/m2, the latent heating 91 W/m2, and the sensible heating 24 W/m2. These fluxes are totally 345 W/m2 and the GHE effect is 345-75 = 270 W/m2, because the solar radiation absorption by the atmosphere cannot be part of the GHE.
What are the consequences? The contribution of CO2 is only 7.4% in the GHE responding 2.5 °C of 400 ppm CO2 concentration. According to Schmidt et al. it is 19 % and according to Kiehl & Trenberth it is 26 %. IPCC’s forcing of CO2 producing 1.8°C for 560 ppm cannot be fitted into the real GHE but the TCS value of 0.6°C can be fitted very well.
Two links to research papers of mine:
– http://www.journalpsij.com/index.php/PSIJ/article/view/30149
– http://www.journalpsij.com/index.php/PSIJ/article/view/30127/56520
I have published blog stories about this in Finnish blog sites. The comments of the IPCC supporters can be summarized like this: We cannot find anything wrong in your GHE definition, but the IPCC’s definition is correct because thousands of real climate scientists have evaluated IPCC´s specification and they never found any errors. My comment is that the majority of climate scientists have never read the IPCC’s GHE definition or even considered what it means. The rest of the climate scientists follow this rule: “It is better not to look a gift horse into the mouth.”
The ‘surface’ is at least 75% water. Water does not absorb IR radiation at all well, indeed it is probable that in a wind IR could cool the surface by increasing evaporation and loss of latent heat to the atmosphere. SW radiation will penetrate water and warm down to several meters, but the energy content of SW radiation is low.
I feel treating the Earth as if it was just a rock ball with an atmosphere, introduces considerable errors.
On the contrary liquid water is a strong absorber of IR.
Ian, Phil is right. The absorptivity of water in the LWIR range is 0.96, meaning it absorbs 96 percent of impinging LWIR.
w.
Ian
Water can evaporate in the absence of IR or even other wavelengths. Wind can supply enough energy to strip off water molecules. The key is that it takes energy to evaporate water and that energy can be of different types.
I do not find a way to fix printing errors in my comment. So, I have to fix it like this:
Original: “The surface cannot leave the difference 345-255 without absorption; it is against physical laws.”
It should be: “The surface cannot leave the difference 345-155 without absorption; it is against physical laws.”
Fixed, Antero. I hate typos. There’s no way to have a comment editor function on WordPress, so I guess I’m the Comment Editor.
w.
Willis
IIRC Small Dead Animals uses WordPress and has editing for a time after you post
Oh, you can have comment editing in WordPress (but you have to have a .org site, not a .com, as a friend reminded me the other day).
It only takes the appropriate widget. BUT – doing this is a fraught exercise, to say the least. (Doing almost anything not plain vanilla with WordPress is a fraught exercise, to be honest. I note that I am still commenting without a “verified” WUWT account, for instance; there was also the mini-debacle with the comment system a while back.)
In any case, I tend to be somewhat AGAINST comment editing here. Better, like any other real science forum, publish – and then correct by publishing new content, if necessary.
Oh. Since my comment on comments hasn’t shown up yet… The one thing I would change about the comment system is to have a clicky-box for emailing me “replies to my comments.” The follow-up comments box all too frequently floods my email, and I still have to search for any actual replies to my input.
For those saying the 3.7 W/m2 per doubling of CO2 occurs at the surface, the IPCC and Feldman et al say that it doesn’t … see above.
But even if it did, that’s still only 3.7 W/m2 / 5.5 W/m2 per degree ≈ two thirds of a degree warming … so how will it get up to 3°C?
w.
How to reach 3 C. See my comment about the RF ERF definitions.
Transmission Ratio ??
TOA Flux =~ 0.6 TOA Flux
The downwelling TOA radiation is pretty much the solar constant. Any increase in downwelling radiation takes place within the atmosphere.
Nick Stokes was kind enough to provide us with this link. It shows the measured spectrum of the upwelling radiation over the arctic measured at 20 km as well as the spectrum of the downwelling radiation measured at the surface.
It’s very important that the upwelling spectrum doesn’t show any wavelengths longer than 17 um and the downwelling spectrum doesn’t show any wavelengths longer than 25 um. They miss a lot of the energy because that’s where H2O has total absorption (and therefore radiation).
The part of the spectrum attributed to CO2 is flat bottomed (or topped). To my mind, that indicates saturation. The other thing is that the CO2 absorption spectrum overlaps with the H2O absorption spectrum. The other thing to note is that arctic air has quite low specific humidity. In most of the rest of the globe, the absorption of long wave infrared (LWIR) by H2O will be greater.
The important thing vis a vis the present article is that looking down from 20 km, we see around 220 mw/m^2 at 15 um and 260 mw/m^2 looking up from the surface. ie. the observed upwelling LWIR is less than the downwelling LWIR at that wavelength. (Note that the power figures are in mw. That’s because they describe the power within a narrow band of wavelengths, not the whole spectrum.)
Quote: “The downwelling TOA radiation is pretty much the solar constant.”
The solar constant is about 1360 W/m2 and by dividing it by the 4, the flux value is 340 W/m^2. Because 100 W/m2 is reflected back to space, the downward SW radiation is 240 W/m^2. Basic knowledge in climate science.
“The part of the spectrum attributed to CO2 is flat bottomed (or topped). To my mind, that indicates saturation.”
It indicates low optical depth. IOW, you see radiation coming from an emission layer at fairly uniform temperature. But that doesn’t mean more GHG couldn’t change that temperature. It can still raise the height of that emission layer, cooling it, which would lower the flat bottom (and so radiate less).
It seems like you’re confusing spectral response with altitude.
example
Nick writes
Standard theory but that idea has never sat well with me. Emssivity of the atmosphere has increased at that altitude so it should radiate from more of the GHG molecules more often losing energy more quickly.
Here’s a thought experiment. Consider a ball of say O2 at say 20C out in space its magically held in a set volume so walls of any container cant play any part. The gas doesn’t radiate so you cant detect its temperature (Ok, I know even O2 can radiate a bit)
Now add a single CO2 molecule. You can now detect its temperature by measuring the radiation from that single CO2 molecule as it acquires energy from the O2 and radiates and slowly cools the O2 and the amount of energy radiated is limited to the frequency of emissions from the CO2 molecule which is set by the temperature.
Now add a second CO2 molecule. The temperature measured is still the same but surely the amount of energy radiated away has doubled.
Interesting analysis. However, I wonder if it’s really valid to simply use an average for the earth’surface?
Not every meter squared is created equal.
Not every Watt/m squared is equal either.
Solar watts can be used to do work, LWIR can’t because it is diffuse and does not carry the electron volt energy that SW and UV carries.
But according to the accepted science all photons are the same, regardless of what and where the come from.
So explain how UV photons penetrate metres of water and LWIR ones don’t when the are all the same.
A C Osborn January 21, 2020 at 1:49 am
The problem with using the ≈ 340 W/m2 downwelling IR (global average, great variation) for work is twofold. First, it’s not powerful enough to use like we use solar energy in a solar cell. To do that you have to have enough energy to kick an electron up to a higher orbit, and LWIR can’t do that.
The other is that to use it in a heat engine you need to have somewhere to reject the heat to that is cooler than the heat running the engine … and no matter where you are, the atmosphere up where the LWIR is coming from is colder than the surface temperature.
Having said that, there is current interest in the possibility of getting work out of LWIR by using a rectenna system … details here.
Best regards,
w.
“To do that you have to have enough energy to kick an electron up to a higher orbit, and LWIR can’t do that.”
Thank you.
LWIR does not have the same Energy.
I wonder where is that “Energy” accounted for when comparing Watts/m2 of Solar v Watts/m2 of LWIR?
Only 8% of Solar is UV and yet UV will crisp your skin and give you cancer, whereas LWIR just warms you a bit.
True IR doesn’t perform electronic excitation, that’s primarily UV, however it does perform ro-vibrational excitation which can then be transferred as kinetic energy to the surrounding gas molecules.
true that. there is a real world example of that in nearly every household called a microwave oven.
Good point. So how is it valid to make energy budgets that treat SW and LW radiation as additive and subtractive, i.e. equivalent?
That is my point, we know that Solar warms the Oceans to a certain depth (metres) and that that energy is therefore Stored for some indeterminate time.
It does not get reflected (pun intended) in the “Surface Balance Calculations” because it does not necessarily immediately go out as overnight LWIR.
I think Trenberth was on to something when he said the heat was hiding in the Oceans.
A C Osborn January 21, 2020 at 7:06 am
Solar is stored for 1 season (except probably in the tropics):
It does not perpetrate below ~400m or so.
He was fully correct, only it is not heat from the sun (and most certainly not from the atmosphere) but from the inside of the earth.
Just as the continental crust is hot in spite of the small geothermal flux (~65 mW/m^2) are the oceans hot from internal heat of the Earth.
Ben, I am not so sure about just 1 season.
Ensos come from somewhere.
E M Smith said in one of his posts that the Sun & Atmosphere just keep the heat inside the earth and slow down it’s cooling.
A C Osborn January 21, 2020 at 10:27 am
One of the reasons why I excluded the tropics.

In the tropics the daily amount of solar energy varies between ~15 to 25 MJ/m^2.
At high latitudes the swing is from ~0 MJ/m^2 to eg 18 MJ/m^2.
In this case in winter all stored energy will be lost to space again.
A C Osborn January 21, 2020 at 10:27 am
To me the flux through the crust is a basic conduction situation (Fourier).
For continental crust the flux is ~65 mW/m^2. Without sun and atmosphere, this would result in a surface temperature of ~40-50K to radiate the flux to space.
Switch on the sun, and the crust temperature will start to rise, until the Geothermal Gradient from mantle to core matches the average surface temperature for a given position, and the flux is established again, close to the original number.
(slightly different due to now lower temperature difference between mantle and surface).
Mike Smith January 21, 2020 at 1:14 am
Michael, the 5.5 W/m2 figure is an area-weighted gridcell-by-gridcell average … for exactly the reasons you put forward.
w.
Ahhhh, thank you Willis!
well sigma * T^4 is simple but you also need to know “effective” emissivity of all the fertile and baron land plus the sea / ice and snow and wet snow and ice, etc at the appropriate wavelengths. Values range from about 10% to 90%.
In other words, it’s not that simple and like anything else in climate science you get the values you dictate by your assumptions.
I think the issue is not so much emissivity (mostly close to 1) but local back radiation. S-B gives radiation into vacuum. But if the surface warms, it warms the air above (with GHGs), and also clouds, which creates back radiation. So the net radiation going up is a lot less. It’s like the steel greenhouse, but with more transparent steel.
Nick, AFAIK all of that is taken into account in the various CERES datasets. By that I mean, the surface DWIR is the net of everything-solar warming of the atmosphere, radiant warming of the atmosphere, sensible and latent heat energy transfers, etc.
And you’re right, emissivity is close to 1. From my bible, “The Climate Near The Ground” by Geiger, first published sometime around the fifties when people still measured things instead of modeling them. He gives the following figures for IR emissivity at 9 to 12 microns:
Water, 0.96
Fresh snow, 0.99
Dry sand, 0.95
Wet sand, 0.96
Forest, deciduous, 0.95
Forest, conifer, 0.97
Leaves Corn, Beans, 0.94
and so on down to things like:
Mouse fur, 0.94
Glass, 0.94
You can see why the error from considering the earth as a blackbody in the IR is quite small.
I must admit, though, that I do greatly enjoy the idea of some boffin at midnight in his laboratory measuring the emissivity of common substances when he hears the snap of the mousetrap he set earlier, and he thinks, hmmm …
w.
Willis writes
With the T^4 term, emissivity is very important.
For example the difference between 1m2 of a material with emissivity at 0.98 and 0.97 at 20C is 410.4 – 406.2 = 4.2 W/m2
This is a nifty way to play with its impact https://www.omnicalculator.com/physics/stefan-boltzmann-law
This is especially important where its changing like at the effective emission altitude for example. Is never mentioned in discussion of “the green house effect” however.
(Rescued from spam bin) SUNMOD
S-B is for solid surfaces not gases.
Water rules, not CO2, as you say real world conditions prove it.
Good heavens, Mr Stokes, you are agreeing with me ( probably without realising it). The only human causes of ‘warming’ are localised surface effects due to increasing urbanisation and agricultural use. This warming effects the local atmosphere , creates more clouds , and traps heat because of water vapour ( your transparent steel). Naught to do with CO2 or at least miniscule effects from that molecule.
Nick
If this discussion is still focusing on the TOA/surface flux ‘discrepancy’ picked up by Willis, surely the issue ir related to the “Transmission ratio” of the atmosphere.
i.e before CO2 enhancement TR = 235/390 = 0.6 (60%)
After CO2 enhancement TR = 231.3/390 = 0.593
To restore equilibrium (235 w/m2 TOA) = 235/0.593 = 396.2 w/m2 or 1.1 k (NO feedbacks).
Nick and Willis,
On the question of water vapour, has there been any resolution of –
(1) Paltridge et al 2009 showing that water vapour was negative in feedback on some readings at the tropopause.
(2) Contra: Dessler and Davis 2010.
In a discussion thread on Jo Nova at the time of the 2 papers, Garth Paltridge commented on and contested the 3 points that Dessler and Davis used to substantiate the “traditional view” that water vapour is a strong positive feedback.
I appreciate your point, Willis , that the CERES material incorporates water vapour, clouds etc. but is water vapour a negative or positive feedback or unresolved?
‘..but is water vapour a negative or positive feedback or unresolved?’ Think Swamp Cooler. Swamp coolers work great in Az but are less effective in Florida. Or, as someone, who pushes “Co2 causes global warming” agenda, wants you to believe to get warm on a cool day stand next to a water fall.
Vacuum is not the issue. S-B pertains to a cavity radiator in a strict sense because within a cavity the IR characteristics of whatever constitutes the surface doesn’t matter — withinm a cavity all materials behave like perfect blackbodies at equilibrium. Without a cavity one really should use the actual characteristics of the surface, which aren’t known to any great precision.
Physics revision question for me as it’s a long time since I did physics. If the Sun were to suddenly disappear (forgetting gravity, momentum and other similar interactions), would the surface of the earth have an intrinsic temperature because of atmospheric pressure? If so what would that value be? Likewise, what would be the Venusian temperature be? Would the temperatures stabilise?
John January 21, 2020 at 1:48 am
No. There’s no way that atmospheric pressure alone can lead to an ongoing increase in temperature. See my post here for a proof of that.
w.
What is the reason for Venus’ high surface temperature? It has a retrograde rotation where it’s day is longer than the year, an atmospheric pressure of 90 atmospheres and is closer to the sun but with a high albedo. What would the temperature be on Earth if it swapped with Venus, no other orbital/rotational/atmospheric changes?
Willis proof relies on showing it leads to a falsifiable conflict, if you want the technical reason why it is called the shell theorem and read and note statement 1 and 2
https://en.wikipedia.org/wiki/Shell_theorem
It was developed in classical physics but the formulation still holds in GR
All the pressure is targeted at a single point in space being the centre of mass and so if the statement was true that would be the place all the temperature would manifest. In classical physics temperature is the kinetic vibration of particles and we are talking about a point in space so you can’t connect those two things or as we say classical physics fails. In GR you are simply applying pressure on a point in the spacetime fabric and given it can take the pressure of a neutron star or blackhole it is a bit trivial and does nothing.
Have you ever been outside during a full eclipse of the sun. Amazing how quickly it cools.
The sun is the reason that there is an atmosphere in the first place. The atmosphere is a gaseous fraction of the planet, it is just as much a part of the planet as the soil under your feet. Without energy from the sun, the atmosphere would condense and absorb into the solid and liquid fraction of the planet.
“Today, a chance comment got me thinking about top-of-atmosphere (TOA) downwelling longwave radiation…”
WUWT? Downwelling LW at TOA? How does that work? Where does this radiation come from? Space? Sun?
Willis, please reply, I see other people pointed it out too. There can be no downwelling LWIR at the TOA, by definition. There is no (significant) atmosphere above TOA. If there is, it’s not TOA.
Based on the measurement of upwelling LWIR at ToA which will have been emitted by excited molecules from lower in the atmosphere from which region there will be an equal amount of LWIR emitted downwards.
But not at ToA! There can be no downwelling (atmospheric) LWIR at ToA, there is no doubt about it. Upwelling LWIR at ToA comes from the surface (window) and various heights in the atmosphere, and clouds. Downwelling LWIR at ToA is zero, by definition.
The point is that measurement of upwelling IR allows us to calculate what the amount of downwelling IR will be before it interacts with the atmosphere. That is why Ramanathan used it to estimate the Greenhouse effect.
Phil, please quote where Ramanathan mentions downwelling IR at the ToA. Yes, there is downwelling IR within the atmosphere all the way down to the surface, but at the ToA? No such thing.
What Phil said. It’s measured at the TOA.
w.
Well, this is really frustrating.
Willis, downwelling LWIR is measured at the ToA? There is no atmosphere above the top of the atmosphere and you say it’s not the Sun, so what emits this radiation? Can you please quote where Ramanathan mentions downwelling LWIR at the ToA? From your quote:
“At a globally averaged temperature of 15°C the surface emits about 390 W m -2, while according to satellites, the long-wave radiation escaping to space is only 237 W m -2.”
Fair enough, however I disagree that this reduction of about 150 W/m2 (or greenhouse effect) is caused solely by the “trapping effect of radiation”, but I digress… At this point, I just wanna know how can there be downwelling LWIR at the ToA? It’s clearly impossible.
Edim, what is measured at the TOA is upwelling LW. It is subtracted from surface upwelling LW. This gives us total GH radiation.
w.
Edim January 21, 2020 at 1:04 pm
Well, this is really frustrating.
Willis, downwelling LWIR is measured at the ToA? There is no atmosphere above the top of the atmosphere and you say it’s not the Sun, so what emits this radiation?
I’ll try to spell it out carefully.
Any excited CO2 molecule in the vicinity of the tropopause will emit a photon in any direction with equal probability. Any of those photons heading upwards will most likely escape the atmosphere and therefore cross the ToA. Therefore when you measure the upwelling IR at the ToA there will also an equal flux of downwelling IR, that’s what we’re talking about.
“there is some mysterious feedback increasing the CO2-caused surface temperature change by a factor of about ten …”
Willis.
The mysterious GHG feedback effect was invented by NASA Climate folks in pursuit to blame fossil fuel CO2 for naturally caused warming during the 1980s, 1992 1998 ElNino episodes. It was adopted by IPCC climate modelers.
It’s in the archive web pages.
Reality:
The Earth’s standard temperature at mean sea level is still 15°C used by ICAO. All that 390 W/m2 energy on the Earth’s surface is produced by the weight of the entire atmosphere. No relation to the fictitious GHG effect.
Most far or long wave IR reradiated from the Earth escapes to the space at the speed of light except the cloud effect and convention as per gas laws.
The full computational model using SB heat transfer and general gas law considering the entire atmosphere is described in our forthcoming publication.
Surface temperature of all planetary bodies such as Venus can be explained this way.
GHE is not fictitious. The Earth receives net energy form the Sun 240 W/m2 and the same amount is radiated back into space. This radiation corresponds to -18 C. How do you explain that the surface temperature is 15 C?
A printing error again: not -1 but 15 degrees.
Adiabatic compression by the atmosphere. Arrhenius misunderstood Fourier. Now explain why the average whole Earth temp. is normally 21 degrees C over the last 3 billion year…..
chaswarnertoo January 21, 2020 at 6:58 am
The atmosphere is not being compressed and is certainly not adiabatic.
Actually the atmosphere needs internal pressure and thus (energy) to expand against gravity. Is called Hydrostatic Equilibrium.
Antero Ollila January 21, 2020 at 5:30 am
Fixed.
w.
Antero Ollila January 21, 2020 at 5:04 am
If you accept that the atmosphere warms the surface, you implicitly also accept that the atmosphere has warmed the deep oceans, since their temperature is ~275K. THAT idea is totally fictitious.
255K (-18 C) is the RADIATIVE balance temperature for ~240 W/m^2 incoming radiation. On Earth RADIATIVE balance temperatures are not found. Only between sunrise and noon and again between noon and sunset for 2 moments the incoming radiation will be the same as the outgoing for a body emitting according SB.
Our moon receives ~300 W/m^2 on average (albedo .11) so its temperature SHOULD be ~270K.
Actually it is ~197K. Daytime temperatures are close to radiative balance temperatures, nighttime is much to warm (should be ~3K, actually ~80K). Otherwise the temperature would be ~150K or so.
Simple. Earths oceans were (close to) boiling when they came into existence.
Currently they are colder, but the sun only increases the shallow surface layer ~13K on average.
The solar energy that actually reaches the surface is perfectly capable to maintain that temperature during day/night and summer/winter periods.
The atmosphere just reduces the outgoing energy to space. A body at 290K emitting according SB
would radiate ~400 W/m^2. Actual loss at TOA ~240 W/m^2.
=> ENERGY balance due to the Atmospheric Insulation Effect.
GHE is insolation of the Earth if you like to call it by that name. Climate change contrarians do not win this battle by denying scientific facts.
Antero Ollila January 21, 2020 at 8:29 am
Not aware that I’m denying any scientific facts.
Since you seem to accept that our cold, low density atmosphere is capable of warming our ~4km deep oceans, I’d like to hear how this is possible.
Realize that warm water does not sink to the bottom of the oceans, only cold, dense water does (mostly AABW and some NADW)
Isn’t some of the problem to do with considering everything based on averages rather than considering the very real differences between the equator and the poles.
For example, apparently warming is quite modest at the equator. Wouldn’t this be because a large amount of incoming solar radiation is absorbed at the surface, what is reflected is mostly dominated by the action of the very humid atmosphere. So any extra CO2 is only operating on a very small amount of remaining energy and adding this small amount to an already large amount of energy absorbed at the surface.
At the poles the opposite is true. Very little humidity and high albedo mean that very little energy is being absorbed at the surface and very little of the large amount of reflected energy down-welled by water vapour. In this environment, added CO2 would provide additional down-welling of this large percentage of energy which would be significant compared to the little that is directly absorbed, hence warming is larger at the poles.
“Back in 1987 in a paper entitled ‘The Role of Earth Radiation Budget Studies in Climate and General Circulation Research“, Ramanathan pointed out that the “greenhouse effect” can be measured as the amount of long wave energy radiated upwards at the surface minus the upwelling long wave radiation at the top of the atmosphere, viz:
–
The greenhouse effect. The estimates of the outgoing longwave radiation also lead to quantitative inferences about the atmospheric greenhouse effect. At a globally averaged temperature of 15°C the surface emits about 390 W m -2, while according to satellites, the long-wave radiation escaping to space is only 237 W m -2. Thus the absorption and emission of long-wave radiation by the intervening atmospheric gases and clouds cause a net reduction of about 150 W m -2 in the radiation emitted to space.”
–
Lost me on square 1.
Help.
First problem
At the top of the atmosphere – Incoming energy from the sun balanced with outgoing energy from the earth.
Is this correct?
If so then there cannot be any net reduction of about 150 W m -2 in the radiation emitted to space.”
What goes in is coming out.
How can we have extra free heat continually trapped forever by GHG. Not possible.
–
Problem 2
the surface area of the earth is 510.1 million km², radius 6371 km
The Kármán line, at 100 km (62 mi), or 1.57% of Earth’s radius,
gives a TOA of 526,2 million km².
The IR radiation at the TOA is coming off a much bigger sphere surface than at the earth surface. Ramanathan is unlikely to have mad such an elementary mistake but the question remains.
You cannot take directly to compare or subtract a surface of earth energy measure from a TOA energy measure without changing the energy to surface area amounts to the same total surface area.
Was this done?
Though the radius change is small the total change in energy might be much larger.
The 390 W m -2, at the surface might attenuate to 237 [239] W m -2, at TOA to keep that perfect balance of energy in to energy out without any retained heat at all. just from emitting from a larger surface area. [may be a 4th power attenuation??
Anyway needs working through and explaining if anyone has the knowledge I lack.
–
There seems to be some confusion over retained energy, needing to be hot enough to radiate the IR outwards and actual energy transfer. [ see Knobs Willis Eschenbach / December 9, 2010″] Global Energy Flows.
First up the surface emits about 390 W m -2, but only receives 161 W m -2 from the sun, the rest is the same recycled energy as it makes its way out. The 390 W m -2 is being double counted, none is retained, it is only 161 W m -2 of real energy to go back out.
According to satellites, the long-wave radiation escaping to space is only 237 W m -2.
But this is in balance, 161 from the original IR emitted by the earth, 30 W m -2 from clouds and 40 W m -2 from direct window transfer.
Therefore there is no absorption and emission of long-wave radiation by the intervening atmospheric gases and clouds causing a net reduction of about 150 W m -2 in the radiation emitted to space.”
–
This is not to deny that the surface or atmosphere has heated up but the heat needed to create the warming or cooling is not retaining new heat all the time.
Air needs an energy budget to emit the 237 it receives back to space. Yes the surface and the air heat up but this is a minuscule amount of energy in view of the vast amounts going in and coming out each day.It does not constantly keep trapping 150 W m -2. This can be seen by the large changes in air temperature over 24 hours every day. The bulk of that energy is already in the system, ocean and land and clouds.
The atmosphere holds only 1 /6th of the energy going through it , 40 W m -2 compared to 237 W m -2.
–
As an aside you wrote
‘And for the globe, the average is about 5.5 W/m2 per degree. That was a surprise to me, I didn’t expect it to be quite that large … but then as I said, I’d never calculated it.”
I found this funny equation on the net which seems to match your 5.5 figure
“The energy emitted by the Earth can be written as:
EO = σ * T4 (T = temperature in Kelvin, σ = 5.67 x 10⁻⁸ J/m2 sec K4)
The Earth’s temperature reaches a balance, called a steady state, when the two equations match (EI = EO). Under those conditions we can write an equation for planetary temperature.
T4 = [(1 – a) Ω] / 4 σ (T in Kelvin degrees)
The solution for this equation with measured solar flux (Harte 1988, ERBE 2005, 2007) at the top of the atmosphere yields a value of 254° K (-19.2° C, -2.6° F) for average planetary temperature.”
Not sure if it is relevant or not.
I try to explain two points:
1. “If so then there cannot be any net reduction of about 150 W m -2 in the radiation emitted to space.” The SURFACE radiates 395 W/m2 and at TOA outgoing LW flux is 240 W/m2. Difference is about 155 W/m2.
2. “First up the surface emits about 390 W m -2, but only receives 161 W m -2 from the sun”. See my comment about the GHE, then you see all the real radiation fluxes involved. The surface receives 165 W/m2 SW radiation directly from the Sun and 345 LW radiation from the atmosphere (270 W/m2 is the GHE effect because 345 includes 75 W/m2 solar absorption).
Willis,
A very interesting post! Thank you for that. It’s highly appreciated.
I have a view questions though which I hope I can make clear:
1. I’ve always understood from the work of Roy Spencer that the limitations of CERES’s accuracy or any other device are still too large to make up balances in the order of single Watts/m2. What is your estimated order of magnitude error in all these analyses? And second, it would be interesting to hear Roy’s opinion on your analysis. Do you by any change have or have had correspondence with regard to the analysis of CERES data? Just curious…
2. Assuming your analysis is correct there still is a possibility that heat transfer by convection and evaporation etc. (non-radiant heat transfer) interfered with the thermal balance by all the radiating fluxes in a different magnitude in the concerning period than in any other period. To keep it simple: the air might have been cooled a bit extra by the oceans for example.. Since you did quite extensive analyses on these aspects as well, do you think it’s possible to figure out if the 2000-2018 period had been any different from let’s say the decade before in that manner? If not, could this strengthen your conclusion?
3. With regard to your findings, by what degree of certainty do you think we can now say that net positive feedback is demonstrated to be out of question? That would be a powerful conclusion by itself.
Thread fragment;
“Nick Stokes January 18, 2020 at 7:51 pm
“CO₂ is 0.04% of the atmosphere and is minimally infrared active.”
Here is an actual measured IR spectrum taken over Alaska. The big bite around 15 μm is the CO₂ absorption.
Link;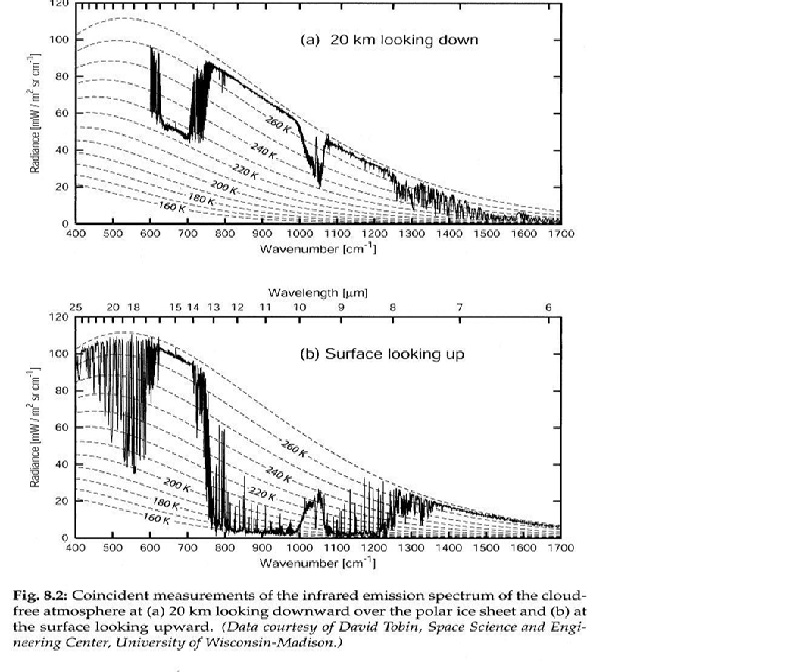
Reply
Patrick MJD January 18, 2020 at 8:35 pm
A big bite?
Patrick MJD January 18, 2020 at 9:07 pm
Note the words “cloud free atmosphere”. Got one for a non-cloud free atmosphere over any part of the earth?
Anthony Banton January 19, 2020 at 11:45 am
“Got one for a non-cloud free atmosphere over any part of the earth?”
That was the whole point of the experiment.
To determine the magnitude of changes to the forcing exerted by CO2 in the atmosphere.
So obviously (?) the experiments were conducted in cloud free skies.
(In case it’s not obvious) because then the signal is obscured by H2O
And yes we know that water absorbs at an overlap with CO2 near 15 micron (the Earth’s strongest emission) BUT there’s plenty of places in the Earth’s atmosphere where dry air predominates, most notably at altitude where the GHE is strongest.
Patrick MJD January 19, 2020 at 7:53 pm
“Anthony Banton January 19, 2020 at 11:45 am”
What is altitude at the surface looking up? What is your definition of “dry air” because I know of two. One is theoretical.”
So what is it?
I am a little bit surprised. There are no comments about my definition of the GH effect. Not in favor or against my theory or the IPCC’s theory. You should know that this time it is really the definition of the IPCC because they do not refer to any research studies.
The GHE is the basis of the Anthropogenic Global Warming (AGW) theory. If it is wrong – and very badly wrong – the science of the IPCC is based on the wrong theory.
I do not know what to think. Do you think that the IPCC’s definition is correct? Do you think that is according to reality and according to physical laws? If it is correct, then you should show in which way my deduction and evidence are incorrect or what is incorrect in my definition.
This time we do not need complicated theories or models. We need only to use radiation fluxes, which are commonly accepted and used in the energy balance presentations also used by the IPCC. I have not invented any energy flux figures in my presentation.
Antero…probably a number of WUWT faithfuls have made the mental note “….thats a very interesting way of looking at it…. now I really need to plug all these numbers into my old Trenberth diagram spreadsheet someday”. It will take a while. Your numbers are right, for whatever my opinion is worth.
Antero, you said above:
Antero, you are conflating two things. One is the total LW to the surface. The other is the amount of upwelling radiation absorbed by the atmosphere.
The key is to realize that the atmosphere is not heated by just Ramanathan’s ~150 W/m2. It is also heated by direct solar radiation, by sensible heat from the surface, and by latent heat from the surface. Here’s my diagram of the simplified energy budget. Unlike Trenberths similar diagram, this one actually balances, with equal amounts radiated up and down from the two atmospheric levels.
Note that the atmosphere absorbs ~150 W/m2 of upwelling radiation (Ramanathans greenhouse effect), but because it is absorbing energy from the other sources, the total downwelling is ~ 320 W/m2.
Best regards,
w.
Willis,
I have summarized exactly in the same as you write: “The downward LW radiation emitted by the atmosphere is the sum of four different energy sources: 1) solar radiation absorbed by the atmosphere 75 W/m^2, LW radiation absorbed by the atmosphere 155 W/m2, the latent heating 91 W/m2, and the sensible heating 24 W/m2. These fluxes are totally 345 W/m2 and the GHE effect is 345-75 = 270 W/m2, because the solar radiation absorption by the atmosphere cannot be part of the GHE.”
The differences in radiation fluxes are not the point. The contributions of GH gases are calculated by Schmidt et al and Kiehl & Trenberth from the LW absorption, which is 155 W/m^2 according to the IPCC definition. In reality the GHE is much greater 270 W/m^2. Because the absorption by CO2 is about 20 W/m^2, it makes a big difference if you calculate the contribution from the total GHE effect being 155 or 270 W/m2.
The LW flux emitted to the surface having the real GH effect is not 155 W/m2. It is much greater. Everything would be scientifically correct if the LW radiation to the surface would be 75 + 155 = 230 W/m2 but is 345 W/m^2. If you think that there is no difference if it is 230 or 345 W/m^2, it would mean that that difference 345-230 = 115 has no warming effect. How do you explain that it has no warming effect and it has nothing to do with the GHE?
Yes, I recall you, W.E., posting this power flow diagram before, a few years ago wasn’t it? I do like to see the books balance like that! I remember thinking how readily one could look at this as an idealized system of just two light absorptive “smoked plates” at two different levels in the atmosphere (with the ground as such as a third absorptive/emittive “plate”, if you like). The first question, I suppose, is why climate scientist Trenberth couldn’t publish a balanced diagram in the first place. Climate scientists can’t do arithmetic, need to hire an accountant?
Anyway, what you appear to be saying is that the difference between the 392 W/m2 surface number ‘going up’ vs the 237 W/m2 upwelling number can be viewed as a determiner for surface temperature? It looks like it could be important to know where all those numbers are going?