Guest Post by Willis Eschenbach
My last two posts, one on Gavin’s claims and the other on the Urban Heat Island (UHI) effect, have gotten me to thinking about the various groups producing historical global surface temperature estimates. Remember that the global surface temperature is the main climate variable that lots of folks are hyperventilating about …
In particular, in the earlier post, Steven Mosher has been defending how the Berkeley Earth folks handle the Urban Heat Island effect. I remembered that Berkeley Earth had data about cities, so I went and got it from here. The data shows the trends for the period after 1960.
I graphed it up, but I wanted to have something to compare it to, so I also got the data for Berkeley Earth global surface temperature trend since 1960. Figure 1 shows the result:
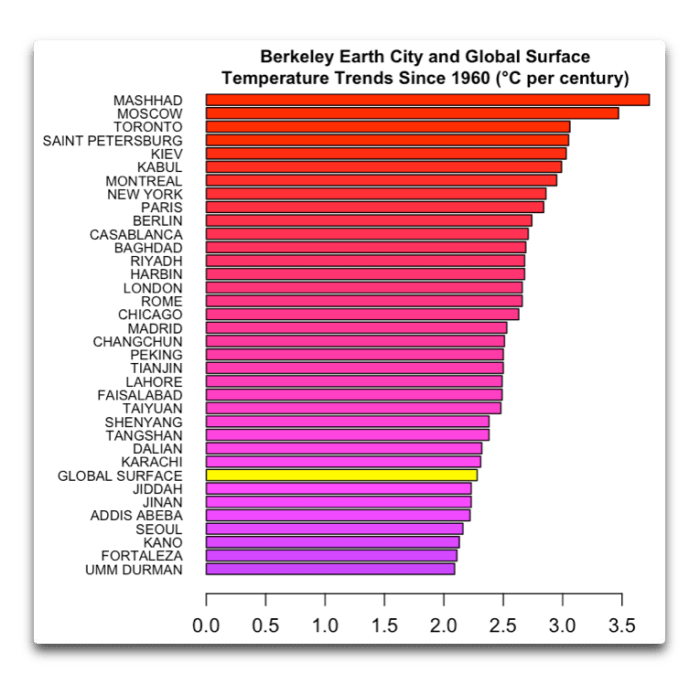
Figure 1. Berkeley Earth trends for various cities, along with the global surface temperature trend over the same period.
There were a couple of things that I found unusual about this. First, there are some indications that the Berkeley Earth method of removing the Urban Heat Island distortion of the global temperature record is … well … perhaps not all that accurate. However, more research would be needed to determine that.
The bigger surprise to me, however, was the size of the Berkeley Earth global surface temperature trend. I had remembered the global trend as being around two-thirds of the value shown in Figure 1. I thought “Over two degrees per century? That’s over two-tenths of a degree (0.2°C) per decade! How did it get that high?”
The answer is, that’s land-only Berkeley Earth data … the global Berkeley Earth data is less than that. A lot less.
So, being addicted to data, I went and got the temperature records from a variety of organizations. I wanted to include the satellite-measured temperatures of the lower troposphere, which only started in 1979, so my analysis covered 1979 to the present. I got the data from Berkeley Earth, the Hadley Centre (HadCRUT), the Goddard Institute of Space Sciences (GISS LOTI), Remote Sensing Systems (RSS), the University of Alabama Huntsville (UAH) and the Japan Meteorological Agency (JMA). I smoothed them all with a 6-year Gaussian average and graphed them up.

Figure 2. Surface and lower troposphere temperature records from six different groups.
For me, the best part of science is my first look at some batch of numbers that have been converted into a graph. It’s always so exciting waiting for the unknown surprises. In this case, I cracked up laughing when I saw the graph. If there were ever an indictment of the current state of climate science, it’s shown in that graph.
People are all up in arms about the surface temperature … but thirty years after James Hansen started madly beating the alarm bell about “global warming”, and after thirty years of endless claims about some mythical “97% scientific consensus”, the sad truth is that the climate scientists have not even been able to come to a consensus regarding how much the globe has warmed in the last 60 years. I mean, the answers differ by a factor of 1.5 to 1!
And mainstream climate scientists wonder why people don’t pay much attention to them? …
Here’s a protip. It’s not a communications problem. If you want people to listen to what you say, first you have to centralize your fecal material.
My best wishes to everyone,
w.
My Usual: Please quote the exact words that you are discussing in a comment. Otherwise, we can’t tell what you are referring to, and misunderstandings multiply.
Willis,
It’s even worse than you thought. Rather than smoothing the noise, look at the trends for the individual stations over the 1990-2019 period, and see how many stations are negative or statistically zero. There are a few hundred out of the thousands of valid reporting stations, and it’s gotta mean something that stations with negative trends are mixed right in with stations with positive trends.
It sure doesn’t look like there’s any uniform warming going on, only warming on average.