Guest Post by Willis Eschenbach
[OK, had to start over, had bad numbers for the areas. Graphics have been replaced. I was using “core area” but I should have been using “greater metropolitan area”. All conclusions are unchanged.]
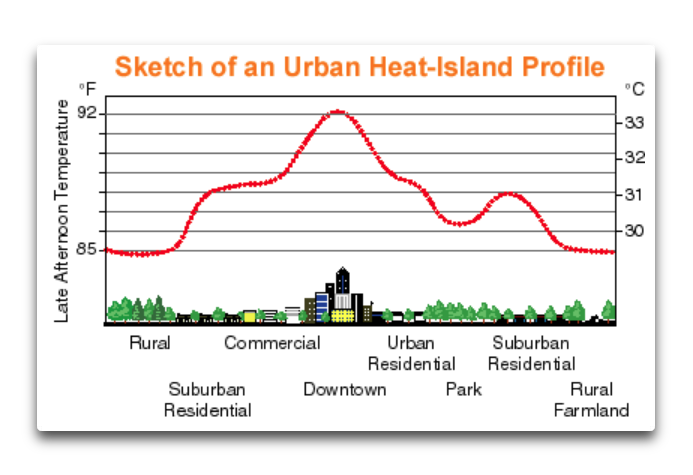
I got to thinking about the phenomenon known as the “Urban Heat Island” effect, or UHI. Cities tend to trap heat due to the amount of black pavement and concrete sidewalks, the narrow canyons between buildings that slow down the wind, and the sides of the buildings reflecting sunlight downwards.
As a result, cities are often warmer than the surrounding countryside. In some cities, it’s hot enough that it affects the local weather. Here’s a simplified diagram:
What I was curious about, however, was another kind of urban heat effect. This is the heat from all of the energy used within the city—electricity, fuel for transport, fuel for heating buildings, all of it. Eventually, almost all energy ends up as heat. So I went and got the energy usage for 27 huge “megacities”, along with the area of the city itself. I then combined the two to give me a measure of citywide energy usage in watts per square metre (W/m2). As a measure for comparison with Figure 2 below, a doubling of CO2 is said to increase the “forcing”, the total radiant energy impinging on the surface, by 3.7 W/m2.
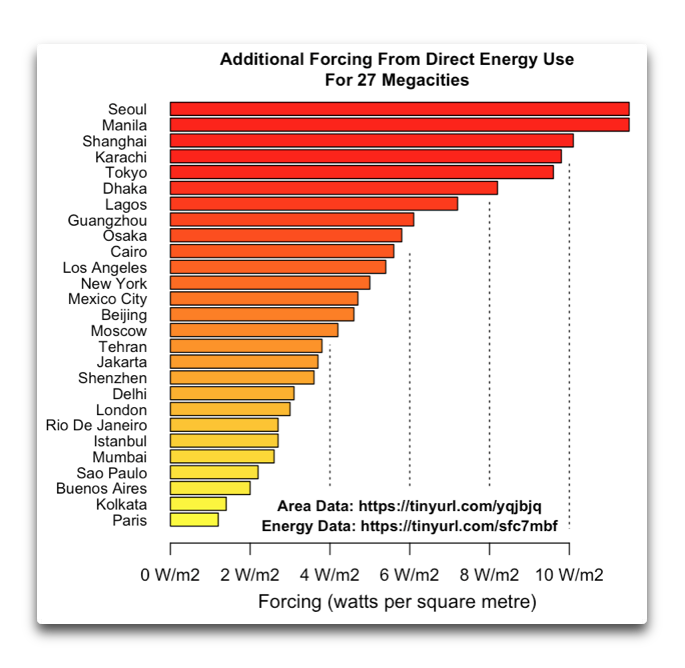
This was surprising to me. I hadn’t expected the effect to be so large.
Finally, I converted the forcing to an equivalent warming. The Intergovernmental Panel on Climate Change (IPCC) fifth assessment report, completed in 2014, gave a likely “Transient Climate Response” of about 1°C to 2.5°C for each additional 3.7 W/m2 of forcing. I’ve used 1.5°C because the heat generation persists over time. As a result, the cities have had time to equilibrate to the additional heating. Figure 3 shows that result.
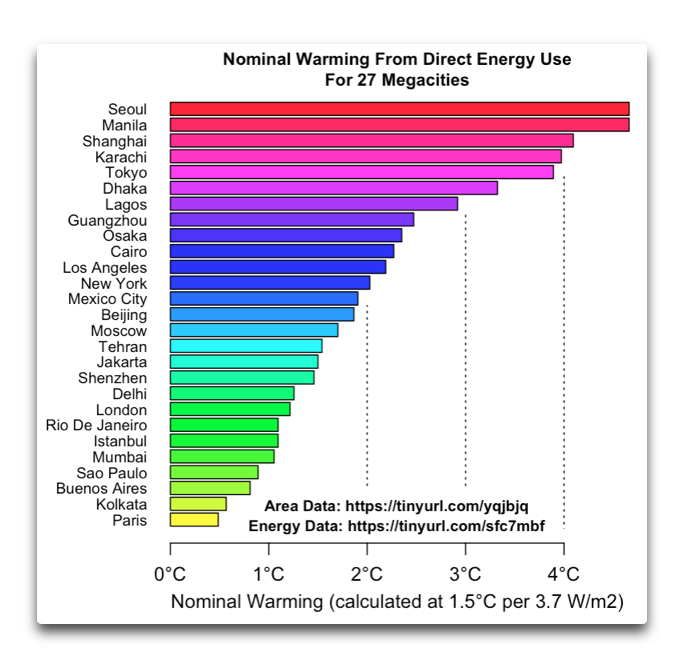
Not much more to say about all of that. Note that this is a “first cut” analysis, I make no overarching claims about the accuracy of the results. I’ve used conservative assumptions and the best data I could find. It looks to be a significant additional heating source due to direct energy usage in the densest of the largest cities, one that is not generally included in the calculations of the Urban Heat Island.
Here, I’m in the Forest Cool Island, life is good. I spent my morning crawling around under my house successfully putting a new “generator” into my floor furnace so we now have a warm house again, a less than pleasant job that came complete with a veritable plethora of bad words. Then I got out the pumice stone and scrubbed a toilet bowl until it sparkled, and this has been my afternoon project … do I know how to have fun, or what?
My very best wishes to each of you,
w.
[UPDATE] In the comments below, someone asked about human body heat and how that affects the forcing in megacities. Humans on average put out on the order of 120 watts continuously. Here’s how that plays out.
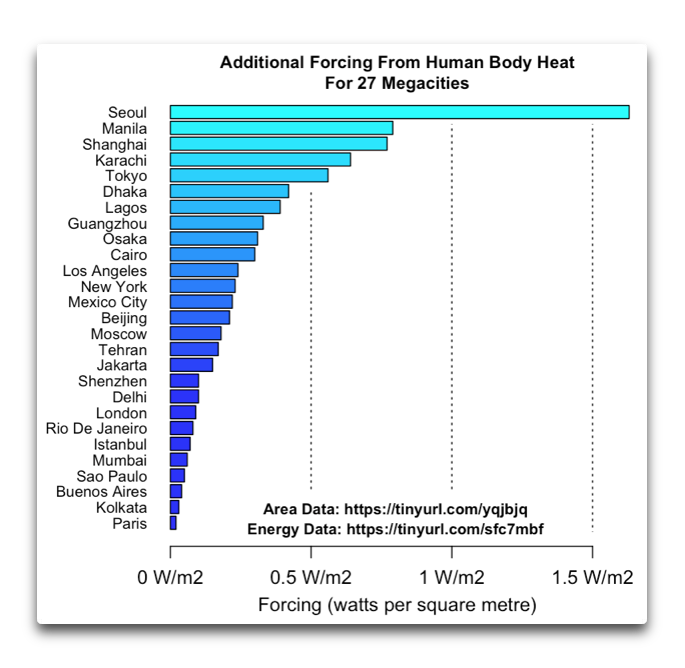
You can see how densely populated Seoul, South Korea is …
DATA: I’ve appended the data below, in comma-delimited form. PJ is petajoules, 10^15 joules.
City,                PJ,    km2,Population
Beijing,            952,   6562,  21516000
Buenos Aires,       702,  10888,   3054000
Cairo,              282,   1600,  10230000
Delhi,              316,   3182,  11034000
Dhaka,              350,   1353,   8906000
Guangzhou,         1474,   7711,  14043000
Istanbul,           464,   5500,  14025000
Jakarta,            589,   5100,  10075000
Karachi,            339,   1100,  14910000
Kolkata,             78,   1785,   4486000
Lagos,              350,   1535,    861000
London,            1065,  11391,   8825000
Los Angeles,       1848,  10780,   3884000
Manila,             918,   2521,   1780000
Mexico City,       1099,   7346,   9041000
Moscow,            1984,  14925,  12197000
Mumbai,             191,   2350,  12478000
New York,          2824,  17884,   8622000
Osaka,             1258,   6930,   2691000
Paris,              657,  17174,   2229000
Rio De Janeiro,     384,   4540,   6718000
Sao Paulo,          589,   8479,  12252000
Seoul,             1848,   5076,  10197000
Shanghai,          1644,   5177,  24256000
Shenzhen,           350,   3051,   8378000
Tehran,            1145,   9500,   8154000
Tokyo,             2438,   8014,  13839000
Yeah, they’re currently trying to sell us that ‘urban living ‘ is better for the environment, while they destroy the suburbs and rural-areas.
We’re dealing with Agenda 21 in my city. They desperately want to tear down iconic structures built 50 years ago that will last for centuries if maintained so that they can be replaced with “sustainable development”. It’s all just intended to bankrupt cities and force more and more people into the communist -style apartments through ever increasing property taxes.
Spot on. I opted out.
I feel ya’. I live in for-God’s-sake Portland Oregon. We’re about to have another fight over forcing Cap and Trade on us – trying to sneak it in real quick after the new year.
The Oregon legislature has nothing but screw citizens over with every move they made in recent memory.
But hey, they legalized weed, so that’s enough for the brain dead morons that keep voting them in.
It’s a strange coincidence that you posted this today. For the last couple days I’ve been pondering whether all of the heat that is released in the usage of energy/fuel has any impact on temperature and, if so. how much.
It’s the Lobachevshy effect …
w.
—Tom Lehrer
Exactly!
w.
That story appears to be a confabulation or a conscious lie by Lehrer. It’s unreliable at best and is sourced in personal envy one presumes.
Even the NYT appears to admit this. Best not to spread fictional slanders like this, though I am happy to stand corrected:
https://www.nytimes.com/2002/03/09/books/connections-plagiarism-that-doesn-t-add-up.html
“Mr. Lehrer imagined an unscrupulous acolyte following in Lobachevsky’s footsteps* by writing a math book in which every chapter is stolen from somewhere else and the index is copied from an ”old Vladivostok telephone directory.”
”Plagiarize, plagiarize, plagiarize,” Mr. Lehrer sang. ”Only be sure always to call it please — ‘research.’ ”
*Lobachevsky was actually cleared of all wrongdoing* — similar ideas developed simultaneously in different countries — but plagiarism lives on. “
Tom Lehrer was (of course), joking. Lobachevsky was brilliant and did not plagiarise.
Michael, Lehrer was JOKING. It was merely another in the long list of people coincidentally making simultaneous discoveries.
w.
Reminds me of the programmer’s credo.
“Plagiarize like hell, claim nothing!”
Far too many dilettante programmers plagiarize other’s programs than claim the plagiarized program code as theirs without giving credit where it is due.
Much like Al Gore and the internet.
“I got out the pumice stone and scrubbed a toilet bowl until it sparkled, and this has been my afternoon project … do I know how to have fun, or what?”
Ha ha
I read every article with “Eschenbach” on the byline because they are consistently good.
I didn’t get the purpose of this article.
The first issue is that oceans cover 71% of our planet, so THOSE temperature measurements are most important.
Repeated changes in ocean measurement methodology make those data questionable.
And there’s a lack of Southern Hemisphere ocean coverage before WWII.
The next step is to consider the other 29% — land surface temperature data.
I believe cities / urban areas cover only about 3% of the land surface.
Your article seems to focus on that 3%.
I don’t get it.
With only 3%, UHI, land use changes, and economic growth of urban areas could not be that important.
The UHI effect is ignored by most surface temperature calculations, and abused by one organization.
Of course a city is warmer than surrounding suburbs and countryside.
But over time, with population growth, anyplace could get warmer, not only a city.
But:
What if an urban weather station located near buildings was moved to the middle of a large park? Negative UHI ?
What if a city loses population — Detroit used to have two million people, and lots of manufacturing — now 675,000 people, and very little manufacturing. Negative UHI ?
The real issue is how much does nearby economic growth & land use changes affect the warming or cooling measured by each weather station.
And why do we need weather stations located where they WILL be affected by nearby economic growth?
UHI affects rural weather station too:
A rural station, over time, could gradually become a station in a village, then in a town, then in a larger town, and eventually in a city, with a century of economic growth.
And then there are local changes to individual weather stations, such as the green weeds around a weather station being killed with RoundUp, leaving bare brown soil, changing the albedo.
It is also a well known fact that climate alarmists park their cars right next to some accessible weather stations so their hot engine exhaust causes local warming, or maybe that was jet planes idling near airport weather stations, located between runways. I forget which.
You just can’t trust those smarmy leftists.
My bottom line is that surface temperature measurements are so haphazard, and non- global, with excessive infilling and “adjustments”, that they belonged in the toilet bowl in the 1990s … replaced by satellite data, that at least is close to being global, and is measured in a stable environment.
The actual city of Detroit lost a lot of population, but that’s mainly because people moved to the nearby suburbs where it’s generally safer (among other factors). The Metropolitan area still has millions of people, and most areas (outside of Detroit ghettos) are growing in population and development.
I assume the UHI is now greater in the suburbs of Detroit, while most of the city itself (outside of downtown) resembles a post-apocalyptic scenario with plant-life overgrown on top of crumbling infastructure and collapsed homes.
“With only 3%, UHI, land use changes, and economic growth of urban areas could not be that important.”
Question: What percentage of the thermometers are in that 3%? Are they only 3% or are they closer to 10 %?
Clearly remember an analysis here on WUWT that shows that for the State of California alone the temperature increase is shown to be essentially, completely, due to UHI.
I am very familiar with a weather station that was right across the fence from the parking lot for the local municipal airport 60 years ago. Back then there were only three or four commercial flights a day and about a dozen private flights. Today those numbers are orders of magnitude greater and many are small jets. Weather station is still in the same place. Its location would easily qualify for the web page showing sites that should not have weather stations. Also back then there was no AC at that airport terminal.
The objective of weather stations should be to collect the data of the area temperature and not the temperature of the local airport, airport parking lot and HVAC exhaust]t temperature.
Weather stations’ primary purpose is not the production of data for climate scientists. Weather stations gain info on the local weather for those who need that info: especially pilots at airports…..just as sea level tidal gauges are most important for those who skipper boats in a harbor.
And, people want to know how hot or cold it is so that they may plan their clothing and outdoor activities.
So weather stations are where they belong. Scientists (or government agencies) who want non-UHI contaminated measurements can set up their own stations for that purpose.
While urban (or otherwise developed) areas cover only a negligible fraction of Earth’s surface, they account for the bulk of available historical data. Met stations are rarely located at pristine, undeveloped sites. Such highly unrepresentative siting is what makes UHI so pernicious when compiling regional or global averages. The sheer preponderance of UHI-corrupted data in most the world makes a travesty out of “homogenization.” Don’t drink the Mosher kool-aid!
Such coincidences are strange aren’t they? Nearly twenty years ago I was conversing with a Dutch colleague about this same topic — our other colleagues couldn’t believe we were worrying about such an insignificant factor when — CO2!. Then two nights ago I was reading an old Scientific American article where the author was worrying that with a mere 10 more doublings of energy demand (a factor of 1024!) we would be dumping a heat load onto the entire planet equivalent to solar isolation.
You should check the numbers. I think you are out by a factor of 10. Current global annual primary energy consumption is 5.4E20J. Annual insolation is 5.4E24J. That gives insolation 10,000 times greater than all primary energy consumption.
The Sci. American author was actually speaking of the continental U.S. circa 1973.
I’ve been thinking about this for years. Roy Spencer did a post on it a couple of years ago with pictures of buildings taken with an infrared camera.
Willis
Is this apples to apples since this forcing would be 24/7 and CO2 forcing would be only during daytime?
Don’t your figures represent perfect thermal efficiency of all energy used?
Since a large portion of electrical loads power mechanical devices, the actual heat produced is substantially less than’ (for example) a furnace.
RobR January 16, 2020 at 10:40 am Edit
A car drives down a level road. In a perfect world, that wouldn’t take any energy once the car got going, and that energy would be recouped by regenerative braking when the car slowed down.
But in fact, like most mechanical work, the car is operating against friction. Mechanical friction of the engine. Air friction of the car moving through the air. Rolling friction of the tires on the road. Friction of the brake pads against the brake disks.
And although it’s generally invisible, all of that mechanical energy used to overcome friction ends up as heat. It’s most apparent in brakes—they convert mechanical energy directly into heat energy. But it’s invisible in terms of air friction—the air is warmed by the passing car, but you wouldn’t know it from observation.
Remember, energy can’t be destroyed. All that can happen is that it changes form … and eventually, with small exceptions, at the end of the day it ends up as heat. It’s the nature of entropy.
Regards,
w.
Willis,
The portion of energy converted to useful work equates to a devices mechanical efficiency.
I’ve no quarrel with your thesis, I just believe that additional calculations are required. If all of the energy consumed by a blender were converted to heat, there would be no energy left to chop the ice.
Put another way: a heater consuming the same load as a blender, will produce more heat.
“Put another way: a heater consuming the same load as a blender, will produce more heat.”
Think about what would happen if you operate the blender inside one freezer and the heater inside an identical freezer. The extra energy that the freezers consume to maintain internal temperatures is likely to be the same. But the freezer containing the heater will cut in sooner because its load is promptly transferred to the air instead of being transferred to the ice.
It’s interesting to note how much of the mechanical “work” done in a city is only fleeting.
Consider a bus that drives around town for 16 hours or so, taking people to work in the morning, returning them home in the evening, and parking in the same spot where it began the day. The only net “movement” is all the air molecules that got pushed out of the way along the route. Nearly all of the energy has been converted to heat.
Elevators take people up, then back down again.
Willis’ approximation is probably very close to accurate, and sure simplifies things.
RobR, what you fail to understand is that you are neglecting the fact that the energy used to stir your drink will also result in heat.
If the watts are the same, the heat is the same. The only difference is where the heat comes out.
Negative Entropy delay appears to be ignored in the calculations. But perhaps over a relevant (60 years?) timeframe that becomes irrelevant as that entrpoic relaxtion will release the heat.
So you are both right, just tempirally talking about different timeframes.
Just musing.
Precisely the example I was thinking of. I’ve observed it numerous times: Commuting to work on a cold morning, frost on everything, but after only several minutes of traffic the highway is clear and dry.
your thesis has completely ignored the energy consumed with altering valence bonds between atoms.
Which Mod. deleted additional responses from Old Engineer and I.
If WUWT. Doesn’t stand for truth, where exactly does it stand?
My point was valid, and anyone with a basic understanding of machinery would agree.
RobR-
Actually, Willis’ figures represent the opposite- zero percent efficiency- all the energy being turned into heat rejected to the atmosphere, no useful work being done. For example, most gasoline fueled, IC engine powered, cars are about 33% efficient. One third of the fuel energy is used to propel the car down the road, one third of the energy goes out the exhaust pipe, and one third goes to the radiator. Note that some of the energy used to propel the car down the road is rejected to the atmosphere when the car is brought to a stop and the brakes heat up.
Cold fired, stream turbine powered electrical generation plants have about the same 33% efficiency, with one third of the fuel energy converted to electricity and rest going up the stack or to other heat losses.
So Willis’ estimate of temperature maybe somewhat on the high side. But given the uncertainty in all the input data, it’s probably a good first cut.
Old Engineer,
We are arguing the same point.
Old Engineer,
You’re correct regarding mechanical efficiency. My first post specifically mentioned thermal efficiency.
Best,
Rob
“…Therefore, the mechanical work a blender performs, will generate heat at a rate substantially less than a device designed to convert power into heat.”
RobR: You have solved (inadvertently I guess) the conundrum for yourself. You are confusing the rate at which something happens with the end result.
old engineer:
No, Willis is correct that it all ends up as “heat” (thermal energy). To take your car example, with 33% of the gasoline’s thermal energy generating useful mechanical power, so 67% directly expelled as waste heat.
But that 33% useful mechanical power is almost immediately turned into thermal energy as well, through air friction, surface friction of the tires, and internal friction (bearings, etc.). That is why you need to expend some power at constant speed.
The interesting issue is thermal electric generation, where the initial waste heat generated at the power plant is not co-located with the dissipation from the actual use of the electricity. I haven’t figured out what is included in the statistics Willis uses.
Often the power plant is located outside the urban area where the electrical power is used (and dissipated into thermal energy). In this case, only the electrical power itself should be included. But if the power plant itself is inside the urban area under consideration, its waste heat should be included.
One of the rare examples where the energy input does not all end up as heat is endothermic reactions. For example, electrolysis. But it is rare to find aluminium smelters or chlorine plants in urban areas.
Photosynthesis is also endothermic meaning trees are sucking energy from their environment and growing themselves with that energy.
Ed Bo,
I beg to differ. A simple thermograph of a blender and a hair dryer consuming 100 watts of energy will yield vastly different results.
A machine cannot create more energy than it consumes. Therefore, the mechanical work a blender performs, will generate heat at a rate substantially less than a device designed to convert power into heat.
Rob, this is very basic thermodynamics. Conservation of energy. What the heck happens to that 100 watts of mechanical power in the blender? Where does it go?
In fact, some of the very first experiments that established the science of thermodynamics involved a “blender” of sorts, spinning a paddlewheel in a liquid, and measuring the increase in temperature of the liquid, equating the increase in thermal energy of the liquid to the mechanical energy input of the paddlewheel.
Ed Bo, Willis, et al.,
I stand corrected in my previous assertions and appreciate the cordial responses.
Rob:
No worries. We’re all here to learn (or should be).
old engr says:
with one third of the fuel energy converted to electricity and rest going up the stack or to other heat losses.
Greatest loss by far is the condenser condensing the steam to water (and that heat having to be rejected to the ambient environment) and then the necessity of re-heating it back to steam. That’s the disadvantage of using water as the working fluid (but water remains the most practical fluid).
The mechanical energy ends up as heat too.
Basically Willis is right, but some energy can be stored for a long time. If you drive your car to the top floor of the airport parkade, some of the chemical energy of the fuel (or the electrical energy) is converted into gravitational potential energy. If you then fly to Arutanga for a 6 month vacation, that potential energy does not get changed into heat (of your car’s brakes) for 6 months.
If you build a very tall building, potential energy of the materials in the upper floors may be stored for centuries.
But all of this is niggling – effectively all of the energy we consume is transformed into heat somewhere and sometime.
But Willis is not saying that all the energy “ends up” as heat – his Figure 3 is based on the understanding that all the energy “ends up” as radiation out to space. The city is radiating energy out to space.
Not all of it, some can end up as entropy. In the cited example of a blender take a liquid with large pieces of a solid in it and break up the solid into very small particles. Some of that energy ends up as entropy (disorder).
Bob, CO2 forcing is also 24/7.
w.
It actually might be more significant at night than in the day.
I understand that CO2″back radiation” happens at night but is it still 3.7 w/m2 through the entire cycle, maybe true but does seem right to me.
Bob, The 3.7 W/m2 is not the downwelling radiation. It’s the estimated average change in downwelling LW radiation from a doubling of CO2.
w.
I was thinking more along the lines of the warming effect, rather than the forcing. Enhanced greenhouse warming is more significant at night, in winter and in cold air masses because it retards cooling. Most of the rise in average daily temperatures is due to higher low temperatures, not higher high temperatures.
The amount of back radiation depends on the level of IR at the time.
While this level goes up by a bit when the sun out (the ground gets hotter), the total amount of IR doesn’t change by that much on a percentage basis from day to night.
Like any global figure, it’s going to be specific depending on time and place. I can imagine a scenario where lower atmosphere CO2 prevents some long wave infrared radiation from reaching the ground. I envision heat reradiating off the bottom of clouds as the source.
In that case presumably, the forcing due to lower atmosphere CO2 would be a negative number.
It could be, I have seen change as large cooling as 7 F just going 12 miles north of Pasco, to see darker skies for teaching my Daughter stars and stuff. When I come home after 11/2 hours later it warms back up 6 F. This was last November when there was a clear sky night.
284,000 residents in the region.
You didn’t feel the toasty CO2 radiation in the cloudless sky? Me neither! Just because we have down-welling radiation doesn’t mean the the surface, or near-surface air warms. It doesn’t if the surface and air is already radiating at a higher equivalent temperature, i.e. warmer. The radiation just gets reflected, or you can say absorbed and re-radiated, which is the same thing.
@John Francis
Put your helmet on, while you await the inevitable “but it slows the rate of cooling” argument. Which the Climate Fascists, of course, equate to “heating.”
And Pasco is a desert environment (though the surrounding area has been “modified” a bit by farming using irrigation and chemical fertilizers), where the supposed “effect” of CO2 should be the largest, due to the relatively smaller amount of water vapor present.
Which tells you that the supposed “effect” of CO2 is a complete non-issue.
CO2 forcing would be 24/7 too, because it operates off outward IR not incoming sunlight.
Where does the CO2 go at night?
CO2 forcing exists so long as something is emitting IR.
Still seems wonky to me, having something slowing heat loss vs a direct heat source doesn’t seem equal to me, but hey what do I know.
And CO2 has higher emissivity than air so I’m not sure how it actually “slows” heat loss.
Robert – Absorptivity equals emissivity for any and all wavelengths. So if CO2 “has higher emissivity than [most of the other constituents of] air”, which it does, it also has higher absorptivity.
An atmosphere without emissive/absorptive gases would allow radiation (and the energy it carries) from the warm surface to pass directly to space. By absorbing some of that radiation before it reaches space, these gases reduce the direct flux to space. They do also emit radiation at the same wavelengths, but because the temperature is (generally) lower than the surface, the intensity is less.
Temperature is determined by the amount of energy in an object.
Whether you increase the amount of energy going in, or reduce the amount of energy going out doesn’t matter. They both result in the object having more energy and hence getting hotter.
You need to add heat capacity to that statement. Bake a pie in your oven. Put your hand in the oven. Now put your hand in the pie. The pie burned your hand but the air in the oven did not. Why? Same temperature, but big difference in heat capacity.
CO2 IR will only slow cooling at -80C. It has very low intensity. Unlike UV.
Only someone with ZERO understanding of radiative heat transfer would write that.
It’s not a good idea to get your science from the pink unicorn brigade at PSI. The only interesting thing there is how many different ways they get things completely wrong.
Hint: That’s not what Wien’s Displacement Law means at all.
Hey Ed Bo,
Previous comment on WUWT stated the following:
“*I’m a professional infrared astronomer who spent his life trying to observe space through the atmosphere’s back-radiation that the environmental activists claim is caused by CO2 and guess what?* In *all the bands that are responsible for back radiation in the brightness temperatures (color temperatures) related to earth’s surface temperature (between 9 microns and 13 microns for temps of 220K to 320 K) there is no absorption or radiation by CO2 at all.* In all the bands between 9 and 9.5 there is *mild absorption by H2O,* from 9.5 to 10 microns (300 K) the atmosphere is perfectly clear *except around 9.6 is a big ozone band that the warmists never mention for some reason.* From 10 to 13 microns there is more absorption *by H2O*. Starting at *13 we get CO2 absorption but that wavelength corresponds to temperatures below even that of the south pole.* Nowhere from 9 to 13 microns do we see appreciable absorption/radiation bands of CO2. *This means the greenhouse effect is way over 95% caused by water vapor and probably less than 3% from CO2*. I would say *even ozone is more important* due to the 9.6 band, but it’s so high in the atmosphere that it probably serves more to radiate heat into space than for back-radiation to the surface. *The whole theory of a CO2 greenhouse effect is wrong*, yet the halls of academia have gone to great lengths trying to prove it with one lie and false study after another. *I’m retired so I don’t need to keep my mouth shut anymore. Kept my mouth shut for 40 years, now I will tell you, not one single IR astronomer gives a rats arse about CO2.* *Just to let you know how stupid the global warming activists are, I’ve been to the south pole 3 times and even there, where the water vapor is under 0.2 mm precipitable, it’s still the H2O that is the main concern in our field and nobody even talks about CO2 because CO2 doesn’t absorb or radiate in the portion of the spectrum corresponding with earth’s surface temps of 220 to 320 K.* Not at all. Therefore, for *Earth as a black body radiator IT’S THE WATER VAPOR STUPID and not the CO2”
How is this in violation of Wien’s Displacement Law?
Not hostile comment, just trying to understand, as this IR Astronomer & Macha’s comment (and other experiments i have seen) appear cohere on this.
Apologies if it’s a silly question.
First, here’s the absorption with both CO2 and water. This shows what gets through the atmosphere, so notches mean absorption.
Now, lets remove the CO2. This is just water.
Note the lack of the notch between about 550 and 700 or so. That’s the absorption by CO2.
Finally, here’s the absorption with no water, just CO2.
The difference between the first one and this one is the absorption due to water.
So … both CO2 and water are responsible for significant absorption. The bands overlap, but CO2 still absorbs.
The astronomer is talking in terms of wavelength, while the graphs are in wavenumber. They are related as follows: wavelength = 10000/wavenumber.
w.
” IT’S THE WATER VAPOR STUPID and not the CO2””
Yep, its right there in all those sciency papers that get ignore by the MSM when they’re quoting some low-IQ teenage “influencer” going on about how we’re all gonna die if we don’t DO SOMETHING RIGHT NOW about coal and oil and gas.
Like, say, close down Niagara Falls? I mean, all that water vapour pouring down every second is KILLING US.
Michael – Macha’s assertion that “CO2 IR will only slow cooling at -80C” is just plain wrong. I see this mistake made commonly on climate blogs, and it does come from a complete misunderstanding of Wien’s Displacement Law.
Wien’s Law states that the peak wavelength for idealized blackbody radiation is inversely proportional to the temperature of the radiating body. The equation is:
Amax (um) = 2898 (um*K) / T (K)
For a blackbody at 193K (-80C), the peak wavelength is 15 um, the center of gaseous CO2’s main absorption/emission band.
But this in NO WAY means that radiation with 15 um wavelength “has a temperature” of -80C, and cannot affect anything above that temperature. Objects of many different temperatures emit 15 um radiation, and there is NO mechanism for a receiving object to discern the source of this radiation.
Most solid and liquid objects are close to perfect blackbodies in the longwave IR range, with absorptivities/emissivities of 0.95 or so. (Polished metals are the significant exception.) They can be considered “graybodies” having almost ideal absorption and emission over a wide range of wavelengths.
The astronomer’s comment is just plain wrong as it pertains to the relevance of CO2 absorption/emission band of ~14-16um to heat transfer. This is because he does not consider the broadband nature of thermal emission and absorption.
For example, your body at 310K (37C) has a peak emission wavelength of 9.5 um, but its radiation intensity at 15 um is over half that of the peak. This is significant for heat transfer considerations.
Because real substances are broadband emitters at earth ambient temperatures, they emit significant radiation in CO2’s 14-16 um absorption band. The diagrams Willis posted above show the large “bite” CO2 takes out of surface radiation. It is significant.
Yes, water vapor (and clouds) are more significant. But the interesting question is how much difference increasing CO2 concentration, which induces a slight broadening of the 14-16 um band, makes, given all the other things going on in the atmosphere.
Willis, thanks for the informative graphs. It’s difficult slaying the dragons….
Also thanks to Ed Bo for the good explanation. Radiant utility boilers have long been necessarily designed w/the radiation-absorbing characteristics of both CO2 and H2O in mind (both which are abundant in flames & flue gas).
beng: I have directed the dragon slayers at PSI to good on-line engineering heat transfer textbooks regarding the nature of radiative heat transfer. Their response? Those textbooks are completely wrong!
I have then asked them why they are wasting their time on blogs when, if they really believe that our engineers who design potentially very dangerous thermal systems have been taught completely bogus science, they should be out trying to shut down these systems to avert catastrophe…
Thanks heaps Willis and Ed Bo. I genuinely appreciate the time you both took to disabuse me (and no doubt others) of common misunderstandings
Yes Willis, I’ve posted those same graphs multiple times.
Ed Bo January 17, 2020 at 10:37 am
Michael – Macha’s assertion that “CO2 IR will only slow cooling at -80C” is just plain wrong. I see this mistake made commonly on climate blogs, and it does come from a complete misunderstanding of Wien’s Displacement Law.
I’ve lost count how many times I’ve rebutted that fallacious Wien’s Law argument (as recently as two days ago).
But this in NO WAY means that radiation with 15 um wavelength “has a temperature” of -80C, and cannot affect anything above that temperature. Objects of many different temperatures emit 15 um radiation, and there is NO mechanism for a receiving object to discern the source of this radiation.
Some examples: an object at 193K has a peak spectral radiance of ~1.1 W/m2/sr/µm at 15microns whereas the same object at 288K has a peak spectral radiance of ~5.8 W/m2/sr/µm.
Because real substances are broadband emitters at earth ambient temperatures, they emit significant radiation in CO2’s 14-16 um absorption band. The diagrams Willis posted above show the large “bite” CO2 takes out of surface radiation. It is significant.
Indeed!
No, as most of the warming seen, is seen as higher minimum temperatures, which, of course, occur at night.
Every time an electrical appliance is switched on … be it a light, refrigerator, vacuum cleaner, washing machine, Tesla car, etc., heat is generated and since there are more electrical appliances in cities than in rural communities, it all adds up. It doesn’t matter a tinker’s cuss where and how that electricity was generated: use of electric energy will contribute to the UHI effect. So even the beloved solar, wind & biomass ‘green energy’ generators are contributing to this UHI effect.
Are there still any cities with generating plants within the city limits? If so, does the energy used to create the electricity get counted?
MarkW
Ah!…My particular grouse.
Our city dwelling cousins are delighted to use energy, just as long as it’s NIMBY.
The Greater London area, generally recognised as that delineated from its rural surroundings by the M25 motorway system which entirely circles the area, with a 20 mile radius, has not one single source of meaningful electricity production within it.
Not a single large wind turbine to be seen.
Same thing happened here in Toronto, Canada:
The Liberal government of the day actually listened to the engineers and planners and was going to put allow some gas plants in the GTA (Greater Toronto Area).
Of course, the green hit the (voting) fan, the plants were cancelled (to a cost of a billion dollars in cancellation fees), THEN the bastards built plants a hundred clicks from Toronto.
I’ve said that I wished we could somehow route the black and brown outs through the Liberal ridings…
Bridgeport, CT has three, a coal-fired plant to be decommissioned within a couple of years, its recently completed/started replacement (gas fired) and a waste-to-energy plant.
NIMBYs can only keep them out of their back yards when they’re rich, after all.
Toronto:
https://en.wikipedia.org/wiki/Portlands_Energy_Centre
It isn’t clear to me that a rural household automatically uses less electricity.
In particular, farms: irrigation systems, lighting & heating for animals, electrically powered machinery etc.
The UHI is much more likely a function of density and concrete coverage as opposed to electricity consumption.
@c1ue – This is “forcing” per square meter. Back of the envelope calculation (literally, on the back of the electric bill envelope) says that my household generates an average of 2.02 Watts per square meter (of my suburban lot and halfway across the street). In the ballpark of what Willis comes up with, although a full figure would have to include our heat generated for transportation, a share of the heat generated by the places we shop, etc. (I might be able to figure transport heat, given a couple of hours, mostly to figure out average fuel use, but have no way to get numbers for the “overhead” heat.)
The average farm size (US) this year is 434 acres – call it 1.8 million square meters. That average farm would have to be using about 1,500 – 1,700 times my energy consumption to match the “forcing” per square meter.
I don’t think so. Even less do I think that the rural household generates as much “forcing” per square meter as even a modest apartment building.
c1ue,
This is about density of energy usage. Because the population density is so much higher than in the country, the effect on the surrounding area is much greater.
c1ue, if you’ll recheck, Willis took total energy used and divided it by surface area.
Hence he did what you asked, calculated energy density.
In this post, he didn’t talk about concrete holding in heat.
Not many streetlights on most farms.
And lets not forget the energy all those rechargeable gadgets we all have now use. Just counting my wife and I: 1 cellphone, 2 tablets, 1 iPod, 1 cordless headphones, 1 FibBit for the daily stuff…cordless screwdrivers, drills, etc.
(Of course, in the Good Old Days, we simply threw out batteries, Seriously Not Good, but I do have to remind the Krazy Klimate Kiddies (of all ages) that, yes, you have to do ALL the math and add everything up if you are actually “sciencing” stuff.
It’s not surprising that the global terrestrial weather station data shows continuing warming that differs significantly from the satellite data. The urban heat island effect explains the difference.
The U.S. has a climate reference network (USCRN) of properly-sited weather stations that is a small subset of all U.S. stations (USHCN), but the GISTEMP and HadCRUT data that is cited most often for “warmest year ever” (gee, I wonder why?) comes from thousands of global stations, of which a large number are poorly sited and biased by the urban heat island. Fake “global” warming.
I routinely see a 10 degree F difference between morning temps (after clear nights) from the multiple thermometers at my house 14 miles from the city and in the city when I get to work. The biggest thermal change is at about 7 miles when I get on the interstate. Spring trees also bloom 2 weeks earlier in the city.
Two years ago we had two days in a row at 11 below and my multi-year rosemary garden died out. The local airport only recorded down to zero. Noticing heat island effect is a part of my daily routine.
The mangos in Miami are in full bloom…
…at our house outside the city, they have not come out of dormant yet
I live in a suburban part of Sarasota County and my mango tree is also in full bloom. It is positioned in the middle of my back yard which consists of Florida native vegetation. Of course we have had higher than normal temps the last few weeks, around 80F daily.
UHI likely accounts for a large portion of the “observed” land heating. It really is a lot hotter in the city than outside it. I have measured this many times from my truck. In the winter you can literally predict the temperature over the river and then inside the city (Fort Worth, Texas) by knowing the temperature at my house. The temperature drops as one approaches the river (-1 to -2), and then increases as one gets inside the city (+1 to +2 as compared to my house). So a delta of up to 4 degrees from the river to inside the city. This measurement assumes there is little wind – if the wind is up the differences are less but still observable.
And it isn’t just the energy transformed into heat, it’s also the energy stored in the pavement and building walls as heat. It would be interesting if a city albedo was available – I am betting those cities that are darker are also hotter. The most common building materials will effect it as well – those with greater mass like brick and stone should be able to store more heat, and therefore radiate heat longer in the night. For example, I am willing to bet that 1^2 meter of airport tarmac radiates heat longer than 1^2 meter of a simple road (its thicker) – assuming they are made of similar materials.
Another contributing factor (I think) is a reduced amount of evaporation within the big cities. Without water to transmit heat upwards, any air convection will be much less efficient. With storm drains to convey rain away from the city, the water is simply not available to be evaporated.
Robert
Back when I lived in San Jose (CA), I frequently drove to Sacramento and beyond. Neither of my cars had air conditioning. Therefore, when I drove in the summertime, I drove with the windows down (unless it got over 110). There was an area of irrigated alfalfa alongside Highway 50, near Davis, that was distinctly cooler than the typical 100 deg F. It was surprising how much just a few acres of transpiring greenery could impact the air temperature.
Thanks, Willis. Your Figures 2 and 3 are enlightening. Just imagine the last 3 to 5 decades with time-series graphs, especially the Asian megacities. Oy!
Regards,
Bob
Yet the IPCC still claims that the increase in UHI since 1900 is only about 0.1C.
Well that’s the IPCC for you.
CO2 up by what, 50% and bitumen, concrete, roofs up by what 1000% in the same time so of course its all about ‘carbon pollution’. Not even the Nazis would have tried such an absurd propaganda line. The communists, well that’s a different story.
You mean the political organization that ignores the sun, clouds and history also ignores UHI?
Hard to believe.
Basically, the same professional liars who ignore the Little Ice Age (then downplay when they can’t do that any longer) ignore (then downplay) UHI.
0.1C
That is increase in UHI averaged over the Earth,
Not the increase in Seoul.
The sensors aren’t located all over the earth. For the most part they are located in areas contaminated by UHI.
Global averages are a good way to hide a herd of elephants. When Willis begins to break it down a lot of interesting things appear. The UHI effect is included in the global averaging of temps as if it hardly exists.
His post a couple of days ago using buoy data showed nearly 800 w/m2 at the peak of day while 240 avg is the usual global average solar gain quoted. Global averaging is the backdoor for fraud and misdirection. The global average of fires vs land mass should show that Australia doesn’t have any fires recently!
Yes, amazing how much can be “hidden” in “averages.” And in “anomolies.”
We live in a innumerate society.
People used to almost brag about how bad their math skills were: couldn’t balance a check book (remember those), couldn’t do math in your head. They would NEVER brag about being illiterate, of course.
Here in Toronto our usual MSM are all over the provincial government using “average” class sizes in negotiating with the teacher’s unions. Apparently, its BAD to use averages there.
I posted a comment about “now, use the same train of thought about how useful an average global temperature would be…”
Never got published, for some reason…
Actually the said that they didn’t need to adjust the global numbers since UHI had only increased by 0.1C, so there was no significant contamination of urban and suburban sites.
Can the calculated temperature increase be checked with actual temperate records?
Paul S January 16, 2020 at 10:41 am
Difficult, because we’re looking at two factors with the same outcome—UHI from concrete, buildings, and asphalt, and direct heating from energy use. Disentangling them wouldn’t be easy.
w.
There’s one place in the world where the experiment could be done – the Chinese Empty Cities:
At least those cities are energized just look at the traffic lights…
My guess is that China is ramping up their CO2 output early and unnecessarily so they can claim to reach Peak CO2 early.
China does not believe in global warming at all
I did this about ten years ago. A small college nearby has its campus located out in the countryside. During an extreme cold snap I began to take reading around and within the campus at night. There was an obvious effect of warmer air within the campus throughout the night and I could only assume that heat dissipated from buildings and equipment was the causative factor.
In one extreme case a set of doors at the lowest end of the campus would pop open in response to HVAC going on up campus (there is a long hallway connecting the entire campus for student comfort and safety during the winter). Lots of conditioned air being pumped into the environment at -10F or so.
Going from my office in a typical commercial environment to my home right next to the Atlantic Ocean, it is not unusual to experience a temperature differential of as much as 8 degrees in the summer and slightly less in the winter.
Most eco-fanatics *are* from major cities. That’s where they live, not in the country. So, yes, their brains are cooking in the UHI heat, which is fine with me. A 2012 paper about Anatolia found that there was no observable “warming” in the country. However, Anatolian cities got progressively hotter[1]. In 2016 Murray and Heggie [2] looked exactly at what the above article is about, viz., the contribution to warming made by the actual heat generation as opposed to CO2. They found that heat output fluctuations explain observed warming better than CMIP5 models.
[1] https://doi.org/10.1007/s00704-011-0515-8
[2] https://doi.org/10.1002/2016EF000352
Manilla (2018 pop. 12,946,263) releases over 3 times the heat from energy usage than Tokyo (pop. 38,001,000) ??? I seem to recall from somewhere recently that Tokyo consumes 2 gigawatts at times. Hard to believe Manilla is anywhere close to Tokyo in energy usage.
Alan, check the data at the end. The difference is in city size, not energy use.
w.
Manila 38.5 sq km
Tokyo 2188 sq km
I have a vision of Manila as a giant clown filled Volkswagen.
I second Alan. Manila in the first place? Surprising. I don’t know your sources, the numbers are worth double-checking.
is there a global rural temperature record for high quality Stevenson screens? That would eliminate UHI.
Mosher will be along soon to tell you it doesn’t matter. Problem is, he’s still averaging different rural locations together, which is a no-no.
There is also an impact on rainfall. Here in Raleigh during the summer approaching convective rain storms tend to disappear as they approach the city from the southwest to west, then reform on the other side.
We stay hot and dry where I live which is near downtown Raleigh. The major weather station here is RDU airport, which is northwest of the main city of Raleigh and southeast of Durham. RDU gets significantly more rain than I get on my weather station (not calibrated to NWS standards, but is equivalent to other personal weather stations in the neighborhood). Rain cools.
It’s also interesting that this area is heavily wooded but there are enough hard surfaces to evidently make a difference.
This doesn’t seem to be as much influence during the six colder months (Oct-Mar) when the Sun angle is less.
It’s fascinating to use weather radar to watch approaching ice and snow storms. For the first 10 to 20 minutes after transitioning from water to ice or snow, the area above our local city stays with water, leaving a big dot in the middle of all the wintry weather.
UHI = The greenhouse effect. A cause to reduce, reuse, and recycle urban jungles.
It isn’t just those, too. Consider that each human radiates 50 W. I am not sure about the pets and even the flora and fauna that also live there. Cities are naturally warmer than their surroundings just as ant hills and bee hives are, the other energy is more cake.
I’m sorry, but this is just impossible! Haven’t we been warned repeatedly that if the climate warms by 3 C over X number of years (where X is less than 100), it will be the end of civilization on Earth as we know it? It’s the AGW rallying cry, don’t you know.
Now you’re telling us that major metropolitan areas around the world, particularly in energy-rich countries, have experienced UHI warming of 3-6 C, most of which likely has occurred since WWII. How is it possible that humans can live, work and prosper in such metropolitan “hothouse” conditions?
/sarc
And it gets worse. The average temperature of Maine is 46F. That of Florida is 72F. How is it possible for anybody to live in Florida?
They also consume electrical and fuel energy at nearly twice the rate of an average interstate highway of the same surface area with much less efficiency.
And are full of people who sweat.
That’s the problem. UHI has little to do with the building materials and lots to do with the power consumption being concentrated so heavily that many buildings have to run cooling systems in the midst of winter storms.
My professor at University in the early 1970’s (Civil Engineering, Hydrology) published many papers (and achieved tenure from that effort) on showing the definitive effect of increased severe weather (mainly thunder storms) down wind of big cities.
rms
NASA has studied this also. Atlanta (GA) was the first city looked at. Precipitation and temperature are affected for tens of miles downwind. That’s why any analysis of UHI impact has to examine meteorological parameters downwind, and not average it with the upwind areas.
Wouldn’t there also be effects from back radiation? Generally, the assumption is that CO2 (not to mention water vapor) is well mixed but is that valid on a mesoscale in cities? Also the wind blocking by tall structures and temp inversions would contribute to retention of heat just as they do pollution.
Corresponds with my casual observations from the car thermometer in the U.K. also. The effect around and in smaller towns is most pronounced on winter nights and can often be 2C. It is also noticeable when moving from rural areas onto a motorway (ok highway!)
Willis Eschenbach:
Your calculation is in two dimensions. Height is not factored in. Maybe it should be. But the CO2 impact of 3.7 watts per square meter might be only two dimensions as well. The heat you’re talking about is IR. And the CO2 warming is IR going up but slowed. I could be wrong about whether three dimensions instead of two changes anything.
I second this. Seemed a huge oversight to be honest.
Ragnaar is correct, Gentlemen, yes?
Interesting analysis. What caught my eye was the supersizes at which cities had the highest impact per area and which were lower on the list. I coul;dn’t have predicted the outcome and then my next thought was why/ Best guess I came come up with is population density and some aspect of the energy use mix. It does appear some of the highest energy density use is in areas where cooling might be more common than heating and where efficiency may be less due to lower economic achievement. The population density might be the key driver. Would love to see analysis I of that.
“the total radiant energy impinging on the surface, by 3.7 W/m^2”
This is only valid for 255K. For the surface you need to take 5.4W/m^2. Better still to take average temperature for each city and calculate the first derivation of Stefan-Boltzmann equation for this temperature.
…”it’s not Putin in disguise.”
==========
Funny Willis, of course it is not him personally.
Then again, how would you know ??