Reposted from Chris Martz Weather
Posted on 10 Nov 2019 by Chris Martz

By Chris Martz | November 9, 2019
INTRODUCTION
Just when wildfires weren’t enough, we now have people blaming cold weather on a warming climate, which seems quite contradictory. In light of the Arctic outbreak in forecast this coming week, people like Phil Plait (who has since blocked me) took to Twitter (Figure 1) to claim that man-made climate change is causing frigid, Arctic air to be displaced south into the United States, Europe, and Asia.

Figure 1. Phil Plait thinks cold weather is caused by climate change.
His argument, which is supported by some climate scientists, suggests that man-made global warming causes the polar jet stream to destabilize causing it to become wavy rather than zonal, sending Arctic air southward into the mid-latitude regions. He also stated that without global warming, the polar air would stay near the north pole. Both of these claims are exactly backwards from reality and are not supported by weather dynamics, the global warming theory, or statistical observations in long-term temperature data.
1. WHAT CAUSES COLD AIR OUTBREAKS?
Cold air outbreaks are generally caused by disruptions in a large scale atmospheric circulation known as the polar vortex which surrounds the coldest air above the North Pole.
Contrary to popular belief, the polar vortex is not unusual, extreme, or a new phenomenon. As Waugh et al., 2016 stated, “they are simply basic features of Earth’s climatology.”¹
There are two main polar vorticies in each Hemisphere, but for sake of time, I’m only going to discuss the one that gets the most attention; the Northern Hemisphere polar vortex. It’s commonly believed that the two polar vortexes, one in the troposphere and the other in the stratosphere, are directly connected as one, but they are in fact quite different (Waugh et al., 2016).¹
The tropospheric polar vortex is found between approximately 5,000 feet (850 mb) and 52,000 feet (100 mb) with it’s core at approximately 18,000 feet (500 mb) in altitude (Waugh et al., 2016).¹ The stratospheric polar vortex however, is located much farther up in altitude (Figure 2).¹

Figure 2. Climatological zonal-mean zonal wind in Jan and Jul. The diamonds mark the hemispheric maximum of the zonal wind at each pressure level and the approximate edge of the polar vortex for that hemisphere. Data source: National Oceanic and Atmospheric Administration (NOAA) Climate Prediction Center (CPC) analyses. – Waugh et al., 2016.
As shown in the diagram below (Figure 3), the tropospheric polar vortex circulation is much larger than the stratospheric circulation (Waugh et al., 2016).¹ The circulation of the stratospheric polar vortex is much more organized and less wavy.¹

Figure 3. Schematic of stratospheric and tropospheric polar vortices. – Waugh et al., 2016.
While the tropospheric polar vortex remains present all year long (and is stronger during the cool season), the stratospheric circulation only arises during the late autumn, winter, and early spring (Waugh et al., 2016).¹ This is why it’s rare for temperatures to fall far below average in the mid-latitudes during summer.
Following the summer solstice in June, the sun angle becomes increasingly lower over the Northern Hemisphere’s high-latitudes before finally “setting” throughout the course of the winter.¹ ² With the lack of solar heating (short-wave radiation) reaching the surface, long-wave radiation begins being naturally emitted into outer space.¹ ² As radiational cooling occurs, air temperatures cool causing sea ice to grow. The more sea ice there is, the more radiational cooling occurs due to stronger albedo, and the more radiational cooling that occurs, the colder it gets in the troposphere and eventually the stratosphere (Waugh et al., 2016).¹ ²
This cooling causes a dense, cold air mass to form in the Arctic forming the surface “polar highs,” while subsequently lowering the air pressure aloft.
The strong cooling that occurs in the atmosphere over the Arctic strengthens the temperature gradient between the tropics and the North Pole causing winds to flow faster in attempt to balance the large temperature contrast (Waugh et al., 2016).¹ ² The winds flow cyclonically (counterclockwise in the Northern Hemisphere) due to Earth’s rotation.
Because the Northern Hemisphere has much more land than the Southern Hemisphere, strong upward-moving waves will occasionally move up into the stratosphere causing polar temperatures in the stratosphere to rise (Waugh et al., 2016).¹ This is often referred to as a sudden stratospheric warming (SSW) event. This warming in the stratosphere causes the cyclonic circulation to break down and split forming two to three separate vorticies generally over the U.S., Europe, and Asia causing the polar jet stream beneath to become very wavy ushering very cold air into the mid-latitudes.
2. WHAT IS THE REASONING BEHIND THE THEORY THAT CLIMATE CHANGE WILL INCREASE DISRUPTIONS OF THE POLAR VORTEX?
While the theory of increased Siberian snow cover due to sea ice decline (caused by global warming) in the Arctic (Cohen et al., 2014) causes a disruption in the polar vortex later in the cool season is supported with observations, global warming theory does not support increased visits from Arctic air masses, as I’ll discuss later.
The theory simply states that due to sea ice decline in the Arctic, increased snowfall over Eurasia will lead to a stronger Siberian high through albedo and radiational cooling (Cohen et al., 2014).³ The high in turn will produce an upward energy flux into the stratosphere causing sudden stratospheric warming event in December or January, disrupting the cyclonic flow leading to a polar vortex split by January or February.³ ⁴ This theory is indeed supported by both sea ice data and Eurasian snow cover anomalies since 1979.⁴

Figure 4. October Eurasian snow cover extent 1979 through 2018 with 2019 estimated. I expect 2019 to be comparable to 2013. – Dr. Judah Cohen.
But here’s what it almost never mentioned in most peer-reviewed publications and media pieces…
3. WHY GLOBAL WARMING MEANS LESS ARCTIC OUTBREAKS; NOT MORE.
While global warming theory specifically states that the tropical upper atmosphere should warm the most (Tropical Hotspot Theory)⁵, it’s also expected that the poles, especially the Arctic, warm faster at the low and mid-levels of the atmosphere compared to anywhere else.

Figure 5. Latitude – Altitude cross-section of 38-year temperature trends (°C decade−1) from the Canadian Climate Model Run 3. The tropical tropospheric section is in the outlined box. – Watts Up With That.
A faster rate of change in surface and/or lower tropospheric temperatures in the Arctic versus the tropics would reduce the temperature gradient between the two regions, which is exactly what we have seen. While the anomaly differences have diverged drastically since January 1979 (Figure 6), the gradient between the absolute tropical tropospheric temperatures and Arctic absolute temperatures has been reduced. (Author’s note: I linear regressed the data to show the trend between the two datasets clearly. Obviously, the linear model does not explain the entire rate of change given R2 values are 0.243 for the Arctic and 0.198 for the tropics, respectively.)

Figure 6. Arctic and Tropical Lower Tropospheric Temperature Anomalies (linear regressed); January 1979 to October 2019. – NSSTC UAH. (download the raw data here).
While having a conversation through private messaging on Twitter with Dr. Roger Pielke Sr., he confirmed what I already knew…
A reduced temperature gradient between the Arctic, the mid-latitudes and the tropics results in a weaker jet stream. While it’s popular belief that a weaker jet stream produces a wavier jet stream, this is scientifically incorrect. As previously discussed, the temperature gradient is stronger during the autumn, winter, and spring months, which is when we tend to see lobes of cold air penetrate the mid-latitudes; this means that the polar jet stream is strong, not weak. During the summer months, the polar jet stream is more zonal and weaker, which is why we do not typically see significant cool air outbreaks during the summer.
Another bust in the theory that climate change is causing more frequent Arctic outbreaks is that when the troposphere warms, the stratosphere cools, which is exactly what satellite data shows (Figure 7). Considering Arctic outbreaks require the stratosphere over the North Pole to warm to cause a polar vortex split, this is a major bust in attributing cold air outbreaks to man-made global warming.

Figure 7. Global Lower Tropospheric and Lower Stratospheric Temperature Anomalies; January 1979 to October 2019. – NSSTC UAH. (download raw data here (Lt) and here (Ls)).
Last, but not least, perhaps the most obvious flaw in claiming that Arctic outbreaks will increase in intensity and frequency in the coming years and decades due to climate change is the very simple fact that these very cold air outbreaks occur every year and have for at least as long as we have temperature data and historical documentation.
Moreover, to make a more compelling argument against climate activists, cold spells have become less common over the last 124 years (at least in the United States where the best long-term surface temperature data exists) due to the very fact that climate change (which I conclude is mostly natural variability) decreases the overall cold air supply, warms the troposphere, and cools the stratosphere.
Raw temperature data from the United States Historical Climatology Network (USHCN), plotted by Alabama State Climatologist, Dr. John Christy, shows that the average number of November through March cold waves lasting at least two days in 27 Midwestern, Mid-Atlantic, and New England states has decreased from around five times per year in the 1890s and 1900s to around three times per year in the last decade (Figure 8).⁶ The trend since the 1970s has been quite similar to the long-term trend, despite a lot of year-to-year variation.

Figure 8. Average number of November through March cold waves lasting at least two days at USHCN stations from 27 Midwestern, Mid-Atlantic, and New England states. – Dr. John Christy.
The EPA has a graph (Figure 9) showing the percent of land area in the Lower 48 affected by unusually cold winter temperatures from 1911 to 2016.⁷ Once again, confirming the data complied by Dr. Christy, the trend is considerably negative over the last century, and especially during the 1970s.

Figure 9. Area of the Contiguous 48 States With Unusually Cold Winter Temperatures, 1911–2016. – EPA Climate Change Indicators.
CLOSING REMARKS
While I agree with the background theory presented in Cohen et al., 2014 that Arctic sea ice decline has indirectly contributed to polar vortex disruptions in recent years, I do find it very challenging for anyone to assert that climate change is behind Arctic outbreaks considering that they a.) have solid meteorological explanations, b.) are not supported to occur more frequently by a cooling stratosphere, and c.) have declined in frequency over time.
While I respect the research scientists like Dr. Cohen have conducted, especially because it’s supported fairly well with statistical relationships and mechanisms, I do respectfully disagree with the climate change attribution aspect due to what we’ve been observing in the big picture with the frequency of cold spells.
What is very perplexing to me is not what scientists are saying, but rather the amount of ignorant statements on climate change being touted throughout social media from politicians, journalists, and people like Phil Plait who have no clue what they’re talking about.
I have a strong passion for meteorology, mathematics, and history (just ask Joe Bastardi or Tony Heller). I know quite a bit about each of those three topics because I spend hours upon hours doing research.
There are many things in science and other aspects of life that I am not knowledgeable about, and I don’t claim to be. That’s why I don’t go touting out nonsense about things I know nothing about. I would highly suggest other people who say absurd things about climate change take my dad’s advice; “know a lot about a little, not a little about a lot.” In other words, don’t be an expert in everything, but rather narrow your focus to be an expert on a few things. Always check your facts.
REFERENCES
[1] Waugh et al., 2016. “What is the Polar Vortex and How Does It Influence Weather?” AMS Journals. February 27, 2016. Accessed November 9, 2019. https://journals.ametsoc.org/doi/full/10.1175/BAMS-D-15-00212.1.
[2] Haby, Jeff. “HABYTIME MINI LECTURE 66: THE POLAR VORTEX.” The Weather Prediction Education. Accessed November 9, 2019. http://www.theweatherprediction.com/habyhints2/665/.
[3] Cohen et al., 2014. “Linking Siberian Snow Cover to Precursors of Stratospheric Instability.” AMS Journals. March 31, 2014. Accessed November 9, 2019. https://journals.ametsoc.org/doi/full/10.1175/JCLI-D-13-00779.1.
[4] Cohen, Judah. “Arctic Oscillation and Polar Vortex Analysis and Forecasts.” AER. November 4, 2019. Accessed November 9, 2019. https://www.aer.com/science-research/climate-weather/arctic-oscillation/.
[5] Watts, Anthony. “UAH finds a warming error in satellite data, lowers “tropical hotspot” temperature trend, contradicts IPCC models.” April 6, 2018. Accessed November 9, 2019. https://wattsupwiththat.com/2018/04/06/uah-finds-a-warming-error-in-satellite-data-lowers-global-temperature-trend-constradicts-ipcc-models/.
[6] Spencer, Roy. “If the Polar Vortex is due to Global Warming, Why are U.S. Cold Waves Decreasing?” Roy Spencer, Ph.D. January 31, 2019. Accessed November 9, 2019. http://www.drroyspencer.com/2019/01/if-the-polar-vortex-is-due-to-global-warming-why-are-u-s-cold-waves-decreasing/.
[7] “Climate Change Indicators: High and Low Temperatures.” EPA Climate Change Indicators in the United States. Accessed November 9, 2019. https://www.epa.gov/climate-indicators/climate-change-indicators-high-and-low-temperatures.
After it became obvious that there was no truth to the “future generations will forget what snow was” trope, they had to come up with something else.
Doesn’t the “setting” begin at the start of fall/autumn and stop setting or reverses at the beginning of winter?
From the article: “Last, but not least, perhaps the most obvious flaw in claiming that Arctic outbreaks will increase in intensity and frequency in the coming years and decades due to climate change is the very simple fact that these very cold air outbreaks occur every year and have for at least as long as we have temperature data and historical documentation.”
Yes, there is nothing occurring in the Earth’s atmosphere today that didn’t occur in the past before CO2 could have been an issue. There is no unprecedented weather being caused by human-caused CO2, because there is no unprecedented weather to begin with.
Thanks for this explanation of what is going on with the Polar Vortex and the Jet Stream.
On a related topic: I wonder if the Earth’s Polar Vortex is comparable to the activity at the poles of Jupiter and Saturn. Is what we are seeing on those planets their equivalent of the Polar Vortex? Is there a Jet Stream lower down in the atmosphere, as it is with Earth?
My personal experience with cold spells is the US usually gets two or three of these excursions each Fall/Winter starting around November and ending in March. The cold spell will arrive and stay for a short period of time and then it will warm up for a while before the next one comes along.
I’m lucky. I’m situated where snow does not remain on the ground for very long, so my area can warm up pretty quickly after a serious cold snap. That’s not the case for people living farther north. They get snow and it stays on the ground for much longer and keeps them colder, longer.
Please update with this: https://www.nature.com/articles/s41558-019-0551-4
And this
https://www.nature.com/articles/s41558-019-0560-3
Thanks for those quotes, Tom.
“Sun so hot I froze to death..”
Of course(Insert Weather) is caused by global warming.
Everything is caused by great Gaia,buy your indulgences or DOOM DOOM Doom!.
Welcome to the world we have created.
This is the “success” of public education.
Mass Hysteria is quite a thing.
These gullible minions of the Cult of Calamitous Climate are immune to evidence,logic and reason.
But that is OK,for they feel.
So their mindless attempts to collapse technical civilization as we know it…..we must tolerate,cause they feeel.
Oh well the lesson of the last few decades is obvious, protecting the useless and clueless produces hordes of them.
Who could have known.?
Anyone with a interest in cold weather events should make a study of the “Great frost of 1709” which stuck europe. l think it was a very rare and interesting event, because from what l have read about it.
lt suggests that europe suffered a type of LGM weather pattern set up that happened within recorded history.
In climate science I think there are too many people who “know a lot about a little, not a little about a lot.” It leads these experts to make ridiculous extrapolations from tree rings or corals or sediments because they don’t see the interconnections with other areas of climate science. As my old science teacher said “an expert is someone who knows more and more about less and less, until they know everything about nothing!”
Global warming causes colder weather until it doesn’t.
Nice discussion. Thanks.
Many of us remember this special “damage control” video put out by John Holdren, President Obama’s climate czar, when the polar vortex hit in the US during January 2014.
https://www.motherjones.com/politics/2014/01/john-holdren-video-polar-vortex/
“Breathtaking”: The White House Releases Its Climate Heavy Hitter on the Polar Vortex”
” Holdren stated: “A growing body of evidence suggests that the kind of extreme cold being experienced by much of the United States as we speak is a pattern that we can expect to see with increasing frequency as global warming continues,” Holdren asserts.”
As Mother Jones and other MSM outlets cheered him on. “Go climate propaganda, Go climate propaganda!”
We’ve yet to see that increasing frequency of extreme cold predicted by Holdren, as proven by the data in this article which shows the opposite.
We have however, seen the continued increase of extreme events being blamed on man made climate change. Extreme events have absolutely NOT increased. We can find similar extreme events, often much more extreme in the past.
The reporting of them being caused by what used to be called global warming has gone way up though. Changing it to climate change was a good marketing strategy since that includes everything. But change was not a scary enough word, so now its the climate crisis. Even that is not scary enough, so many, like Bernie Sanders use climate emergency.
Those are all political descriptions based on a model manufactured, simulated atmosphere for the next 100 years.
Here on the real planet. REAL, R-E-A-L, the observers from life on this greening planet, are telling us what all scientists agreed on before climate science was hijacked for the political agenda.
We are having a climate OPTIMUM:
https://en.wikipedia.org/wiki/Holocene_climatic_optimum
Life is experiencing the best weather/climate in the last 1,000 years and the best CO2 conditions since humans have existed as we continue to recover from CO2 starvation.
It’s the coldest places in the coldest times of year that are warming up the most.
So what happens in the mid/high latitudes during Winter?
Life suffers tremendous adversity from cold. So much that some creatures migrate south to escape the life threatening cold and find food. Most stay and many struggle, even die. With the lack of food, some creatures hibernate until it warms back up.
Plants go dormant or suffer death from the cold. Annuals are all killed by the cold. Humans are unable to grow food and must live off of what was stored during the previous warm seasons.
Why is warming in these coldest places entirely a bad thing? OK, it melts ice and contributes to the tiny increase in sea levels.
What is the other legit reason?
What does life have to say about this(outside of humans)?
Life: “We’re the ones that have to survive outside, naked and without food in the Winter, please can we have more CO2 and warmth? Pretty please???
The great Moscow Heatwave of 2010 was caused by jet stream blocking, as was the white-out of the British Isles that year.
Jet stream blocking is a result of sinuous Rossby waves, which this blog post is essentially about.
So last time we were in a solar minimum we had major blocking events related to low solar activity. Is it any surprise that we are now seeing the same weather patterns given solar activity is again at a minimum?
Can’t meteorologists remember back even 11 years?
The frosty front moves East.

The distribution of ozone during the solar minimum over the polar circle is highly asymmetrical.
The polar vortex pattern is formed in the upper stratosphere depending on the influx of ozone. Strong current in the stratosphere is created due to the temperature difference.
Oh yes it is!
The rapid warming of the pole and continuing sea ice decline IS absolutely causing the cold outbreaks.
there is ample recent evidence from winter weather patterns in the USA.
Ha ha ha, explain why we had the very opposite from the 1940’s to the 1970’s, when there were MORE Arctic outbreaks than now.
Come on Griff!
ROTFLMAO.
“Climate Change” (TM) causes everything, even things diametrically opposed to one another – Griff didn’t tell you?
Or, more correctly, it doesn’t cause any of it, because it’s an imaginary “crisis” that doesn’t exist.
I wonder how Griff deals with all that cognitive dissonance; maybe he drinks.
My money is on cannabis. I would submit, though, if he’s posting here, then deep down he’s seeking truth in matters discussed here. Even I once bought into the CAGW, etc. narrative, reinforced through approved sources. Then I came and checked a citation pointing to an article on WUWT, and here I am, still astounded at how I could ever have so easily (lazily) accepted the CO2-is-evil narrative.
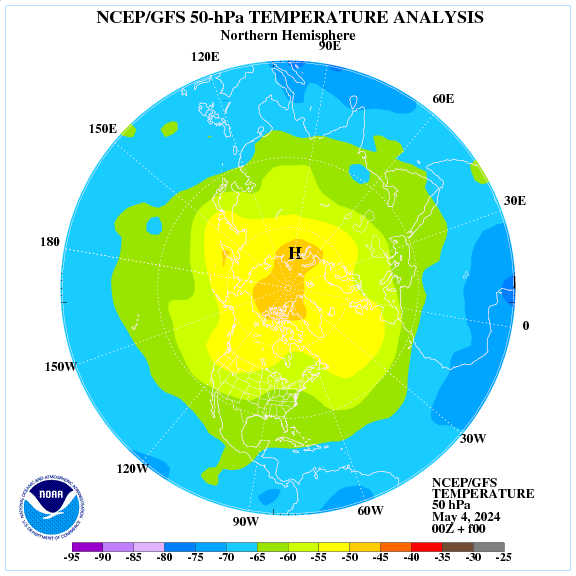
The temperature above the 80th parallel is in line with the average from 1958-2002.
http://ocean.dmi.dk/arctic/meant80n.uk.php
Yes!
The ice range in the central Arctic is the largest in five years.
http://masie_web.apps.nsidc.org/pub/DATASETS/NOAA/G02186/plots/4km/r11_Central_Arctic_ts_4km.png
NOVEMBER 11, 2019
The National Weather Service predicts that more than 250 new cold records could be tied or set during the first half of the week.
Know a little about a lot (and you’ll more often sense the likelihood of nonsense when you see it).
AND
Know a lot about a little (and then you may speak with some authority… with confidence).
Current temperature anomalies in North America.

Forecast of temperature anomalies in North America.

Cold is the worst kind of warm.
All I know, the brass monkeys are getting nervous.
A positive temperature anomaly in Iceland during the winter of 1708/1709 indicates a breakdown of the polar vortex. Was it a fault of CO2 growth?
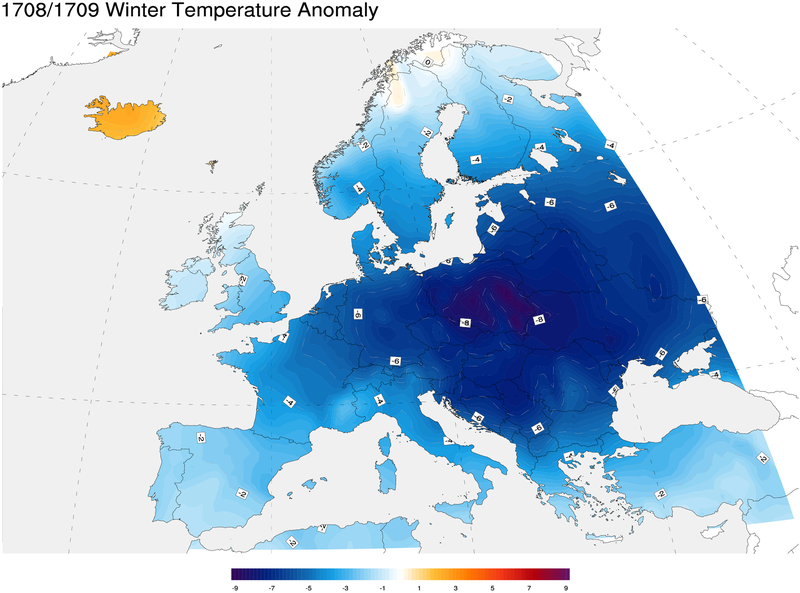
https://en.wikipedia.org/wiki/Great_Frost_of_1709
Yes this winter is not just note worthy because of its cold. But also because its a cold event that the climate models cannot explain. l think its a rare gem in climate history because it open up window into what was going on in europe during the LGM. lt would be interesting to find out what was going on in the eastern USA during this time. ls there any recording of weather events in the USA that go back as far as 1709.
Great question!
Only one thing that causes this and that’s the change in the sun.
Why?
Zero sunlight causes the cold dense air to build in the first place over the pole. The polar vortex and positioning of the Jetstream are divided between this polar air and sub-tropical air.
A warming planet leads to more sub-tropical air reaching North, so the positioning of the jet stream moves further North.
A cooling planet leads to more polar air reaching South, so the positioning of the jet stream moves further South.
The polar vortex is generally controlled by solar activity where when high leads to a more often zonal jet stream cooling the polar regions, but warming mid-latitude regions. In winter it is much stronger and further south then compared with Summer.
With low solar activity the Jetstream meanders and causes polar vortex to move further south at times more often. Increases the risk of severe cold episodes that can reach much further south than usual.
There is no coincidence this event has been occurring while solar activity remains low with potential record lows.
Finally, cold out-breaks were more frequent and more severe hundreds of years ago or less because solar activity was on the whole low compared to recent decades. These events have been always occurring and CO2 doesn’t distinguish anything between them. When solar activity ramps up again in future these will be forgotten about, but when low solar activity returns they will be back again.
http://www.woodfortrees.org/plot/sidc-ssn/from:2017
Climate change responsible for unprecedented floods in the UK and Venice (well at least for several decades) https://www.bbc.co.uk/news/science-environment-50407508
“Contrary to popular belief, the polar vortex is not unusual, extreme, or a new phenomenon. As Waugh et al., 2016 stated, “they are simply basic features of Earth’s climatology.”¹”
And polar vortices even aren’t restricted to Planet Earth but to find on most planets in the Solar system:
https://www.google.com/search?q=planets+polar+Vortex&oq=planets+polar+Vortex+&aqs=chrome.
Solar vortices on the moons proof the plain every celestial body with substantial atmosphere may develop polar vortices:
https://www.google.com/search?client=ms-android-huawei&sxsrf=ACYBGNQrtvaajGO1OhNlgNdeuDS5TZJcrw%3A1574414363080&ei=G6jXXePCBPDnrgSHqp-QBg&q=moons+polar+Vortex&oq=moons+polar+Vortex&gs_l=mobile-gws-wiz-serp.