Guest post by Paul Dorian

Overview
November has started off much colder-than-normal across the nation and there won’t be any let up for the eastern 2/3rds of the nation into at least the middle part of the month. The cold start to the month follows a colder-than-normal October across the CONUS with more than twelve-hundred sites experiencing the lowest temperature ever in the month of October and, even-more impressive, many locations set their monthly record for the month as a whole. Multiple cold air outbreaks will ride along the polar jet stream during the next couple of weeks from the northern part of Canada to the Mid-Atlantic/NE US with the first one arriving in the Thursday night/Friday time frame and another next Monday. The late week cold blast will also feature rain-changing-to-snow in parts of the interior Mid-Atlantic and NE US and several inches can accumulate from western New York State to upstate Maine.

Recap of the October cold
A few of the standout new monthly lows (data courtesy of NOAA, “electroverse.net”):
· Eureka, NV‘s reading of 2°F on October 30 broke the previous monthly record of 3°F set back 1971, and is now the town’s lowest-ever October temperature in 131 years of data.
· McDermitt, NV set a new cold-record in books dating back 127 years — last month’s -10°F busted the previous record October-low of -6°F set in 2002.
· Lamar, CO‘s Halloween low of 1°F is now the coldest October temperature since records began some 126 years ago, smashing 1991’s previous record of 8°F.
· Haskell, TX surpassed its previous monthly low from way back in 1917 — the 18°F observed on the 31st is now the city’s lowest-October temperature in the record books dating back to 1893.
In terms of monthly temperature records, a few of the noteworthy highlights included Spokane, WA which suffered its coldest October-ever in the record books dating back to 1881. The National Weather Service data confirms the average temperature of 42.3°F observed last month broke the city’s all-time record of 42.8°F set way back in October 1905 (the Centennial Minimum). Also worth nothing is that three out of four of Spokane’s coldest Octobers ever (in 138 years of records) have occurred this century — including 2002 and 2009. Another example included Rapid City, SD — the NWS reports that the average temp of 38.1°F registered at Rapid City Airport was the coldest-ever for the month of October in books going back 100+ years, beating out the old record of 38.7°F from 2009.
Finally, the coldest temperature ever recorded in the continental US during the month of October was likely set in Peter Sinks, Utah. Peter Sinks is a natural sinkhole in the northern part of Utah at an elevation of around 8000 feet and is known for its highly localized effects. Nonetheless, the unofficial overnight low temperature there of -43.6°F on 30 October was pretty amazing. Nearby Salt Lake City, Utah provided some supporting evidence of the extreme cold on that day as it set a low temperature record of 14°F for 30 October and records there go all the way back to 1874.

Late week cold blast
A significant cold air outbreak is headed to the Mid-Atlantic/NE US from the northern part of Canada at the end of the work week. As high pressure ridging intensifies across Alaska and western Canada, the upper-level air flow will develop in a manner which allows for the transport of air from way up in Canada to the central and eastern US. In fact, forecast maps of “backward-trajectories” ending on Saturday morning depict air movement from northern Canada into places like New York City and even into the Southeast US (Atlanta, GA). This type of upper air pattern was an important factor in the 2019-2020 “Winter Outlook” issued by Perspecta Weather in October.
As the cold air pushes to the southeast late this week, moisture will push northeast along the advancing frontal boundary zone. This should result in a rain-changing-to-snow scenario in much of the interior Mid-Atlantic and NE US with several inches of accumulating snow possible from western NY to upstate Maine by Friday morning. In addition, the Great Lakes “snow machine” will get turned on late in the week as the unusually cold air crosses over the still relatively warm waters causing instability in the lower part of the atmosphere for downstream locations. While there can be some snow shower activity in the DC-to-Philly-to-NYC corridor with the arrival of the cold air at week’s end, the bigger story in these areas will be the cold.

Cold blast early next week
All signs point to another cold air outbreak for the central and eastern US early next week and this too can feature snow in interior sections of the Mid-Atlantic/NE US and Great Lakes. Much like the late week cold air outbreak, this next air mass will drop southeastward across Canada and then push through the Great Lakes to the eastern seaboard. Once the cold air is established, we’ll have to watch for a possible wave of energy to rotate through the upper-level trough which could result in snowfall for the Mid-Atlantic/NE US by the middle of next week. Looking even farther ahead, it appears this colder-than-normal weather pattern that began in the eastern US on the very first day of the month may very well continue for much of the month of November.
Meteorologist Paul Dorian
Perspecta, Inc.
THE REAL CLIMATE CRISIS IS NOT GLOBAL WARMING, IT IS COOLING, AND IT MAY HAVE ALREADY STARTED
By Allan M.R. MacRae and Joseph D’Aleo, October 26, 2019
https://thsresearch.files.wordpress.com/2019/10/the-real-climate-crisis-is-not-global-warming.pdf
http://endoftheamericandream.com/archives/record-low-temps-of-up-to-45-below-zero-threaten-to-absolutely-wreck-the-rest-of-the-harvest-season
https://www.usatoday.com/story/news/nation/2019/10/30/arctic-cold-blast-breaks-temperatures-october-utah-wyoming-colorado/4098089002/
https://www.accuweather.com/en/weather-news/icymi-unrelenting-winds-fan-devastating-california-fires-old-man-winter-plays-a-trick-on-northern-us-and-tropics-activate-around-the-world/612335
https://electroverse.net/central-england-experiences-historically-chilly-october/?fbclid=IwAR0qFgXOr1mBJzYbuy2KJtvb62kBOgctsgAW8XjOM9dHnwqIKLHQ5oiFutM
https://electroverse.net/central-england-experiences-historically-chilly-october/?fbclid=IwAR0qFgXOr1mBJzYbuy2KJtvb62kBOgctsgAW8XjOM9dHnwqIKLHQ5oiFutM
More and more cold air flows from Canada to the Midwest.
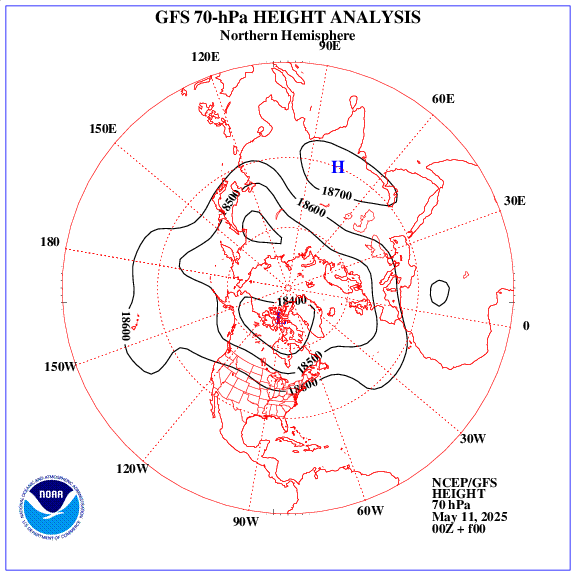
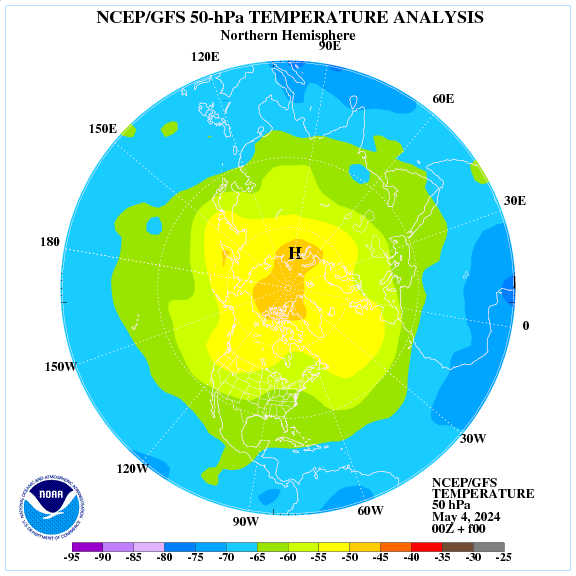
The polar vortex pattern in the lower stratosphere does not change.
A realisation came to me earlier regarding climate change.
I realised, climate change actually means, no matter what the climate is, it must be changed to suit the Green socialist agenda. So voila, Climate Change, you can’t argue with a green, they know what Climate change is. It is what ever they decide it is. Thankfully an ever increasing number of normal people, are waking up to the no longer hidden agenda, that is Climate Change.
It is accurate to state that “every scary global warming prediction by the IPCC and its CAGW acolytes has proved false-to-date” – the warmist cult have a perfectly negative predictive track record and thus perfectly negative credibility. Nobody should believe them.
To their credit, the warmists’ masterful use of deceitful Goebbels/Alinsky propaganda tactics have deceived gullible fools around the world, including most politicians and their minions.
The CAGW hypothesis has been falsified many ways over the decades – some of those falsifications are described here:
https://wattsupwiththat.com/2019/06/15/co2-global-warming-climate-and-energy-2/
The warmists have strategically moved their false rhetoric from “catastrophic human-made global warming” to “climate change”/”wilder weather”, which is a non-falsifiable hypothesis. The warmists have again deceived the gullible public, but competent scientists know that a non-falsifiable hypothesis is non-scientific nonsense.
“A theory that is not refutable by any conceivable event is non-scientific.” – Karl Popper
These climate fraudsters should really be the subject of ridicule – they are the world’s greatest bullsh!tters, even greater than Goebbels and the Third Reich.
“THE END OF THE WORLD” – “Beyond the Fringe, 1962.
I wonder what it is that keeps Justin Trudeau’s office warm.
Ed Zuiderwijk, Justin Trudeau’s office is kept warm by lots of emptied / half emptied renewable plastic fresh water bottles and plastic cups gassing out rest CO2.
And once again I remind you that this is a nasty side effect of a warming arctic and receding sea ice (which incidentally is still at second lowest for date in the 40 year satellite record nearly 2 months after minimum)
Once again, Griff doesn’t explain WHY we should be worried about it, he certainly never tries to show that CO2 is the culprit. He goes on and on about low summer ice, zzzzzz.
The same broken record Griff who keeps (deliberately) forgetting that Polar Bears population keeps increasing, long after the low 2007,2012 very low levels have come and gone, they are still stable or increasing in numbers anyway, which is now 7-12 years ago…..
The same man who has been told DOZENS of times about periods of little to zero Summer ice in the region, yet no calamitous events occurred. This anti science dude tries hard to ignore the published papers posted in from of him, this Eddie boy never gives a dam that he has been given hard evidence that he is overselling pseudoscience baloney.
Warming Arctic, sure ? 😀
You shouldt read some paper of Marcel Leroux about MPH (Mobile Polar Highs).
Or follow M. Lockwood, giving some good explanations about Polar Outbreaks.
But stop proofs of missing knowledge about all you are commenting here.
Krishna Gans
“http://ocean.dmi.dk/arctic/meant80n.uk.php”
You manifestly don’t understand the graphic presented by DMI.
1. The graphic presents only data for latitude bands above 80N; Arctic starts at 60N, but DMI doesn’t provide us with that.
2. All red points above the green plot mean ‘warmer than average’.
3. Though 2019 is lower than 2018 and 2017, look for example at 2010 or earlier years to find what you mean.
4. Of the 1000 highest Arctic temperatures anomalies computed out of the raw GHCN daily data set wrt the mean of 1981-2010, 412 belong to the 2000’s.
If there is a person needing to learn before commenting, Krishna Gans, than certainly that’s you.
Will you tell me s.t. new ? No ? Why not ?
Or will you continue to prate ? Ok, go ahead 😀
Bindidon: The Arctic does NOT start at 60N. I live at 60N, and the climate here is far from arctic. There are no “official” definitions of what constitutes the Arctic. Sometimes the Arctic circle is used, i.e. 66° 33’N. Sometimes the isotherm for 10C average July temperature is used: https://commons.m.wikimedia.org/wiki/File:Arctic.svg
Temperature changes in the region which you describe are mainly related to surface wind flows. CO2 does not control surface winds. … https://earth.nullschool.net/#current/wind/surface/level/overlay=temp/orthographic=-178.00,85.50,672/loc=-118.484,59.605
Not scared……
http://ocean.dmi.dk/arctic/meant80n.uk.php
Time will tell if the US cold will propagate to Madrid, where it snows every 5 years or so: 10°C max day temperature and 2°C min night temperature.
https://www.weather2travel.com/december/spain/madrid.php
Snow comes to Madrid every five years, but stays no longer than 24 hours, according to this:
https://www.notesfromspain.com/2009/01/09/once-every-5-years-snow-in-madrid/
There is currently a lot of riots in Barcelona and if this triggers riots in Madrid, then maybe Stockholm in Sweden could offer last minute COP-festival hosting. Then Greta is on home-ground, and the celebrities can experience real weather and the taste of Global Cooling.
Not sure if the Swedish meatballs will contain meat though.
Having studied many geological, biological and Holocene Interglacial historical records since the 1970s in my teen’s. One thing stands out about Glacial Maximum and Interglacial cooling events and that is the Northern Hemisphere Glaciers always have a center of the Atlantic Ocean. From the Northern Rocky Mountains to the European Alps the glaciers have gone closer to the Equator along the American Appalachian and eastern U.S. coastline and in Europe the same glacial scaring is found east of the Alps down into southern European countries. When The Little Ice Age peaked it was Western Europe and Eastern America that had the coldest temperatures. South Eastern Asian countries and Western America were cold but didn’t get the kind of glaciers those other areas had, except in the higher mountains. Fossil records tend to show this for previous Glacial Maximums going back to the formation of The White Cliffs of Dover, even though they went extinct from the Oxygenation the Glacial Maximum occurred then too. My basic point is all the past Global Cooling both large and small tends to center with the Atlantic Ocean in the Northern Hemisphere. And that in the Southern Hemisphere with less land mass to get records from. And I have not researched it. How did Glaciers form in Australia and New Zealand or South America or the tip of Africa? Did the Antarctic in the South Pacific or/and Indian Ocean reach to create glaciers there? That Earth tilting during Solar Minimum and our orbit would cause the effects of Glacial Maximums as I’ve described in the Northern Hemisphere. It would imply that those Southern Hemisphere lands would show a similar results. Especially since the Antarctic Glaciers become much bigger during Glacial Maximums. And of course it depends on your opinion of Continental Drift or Expanding Earth theories.
l think the key point here is the fact there are 2 huge land masses on each of the Atlantic on which for snow to settle and grow into glaciers. Which drives cold out of the Arctic and down into these land masses. Which on turn changes the jet stream and weather patterning as a cooling N America and yet still warm Pacific ocean will likely do.
As one would expect just after the hottest October ever, (/sarc) among US midwest farmers there’s a run on propane.
https://www.reuters.com/article/us-usa-propane-demand/scramble-for-propane-marks-mother-natures-latest-challenge-for-u-s-farmers-idUSKBN1XF1FA
Everyone is harvesting soggy corn after both spring and fall were cold and wet. Now everyone’s chasing propane to dry the harvested produce (and stay warm themselves) and propane is getting scarce and expensive.
They better get right with the climate crusade gods and go electric and batteries for drying. Propane is on the bad list, at least after the election.
Just so you know, it doesn’t matter how cold it gets in Spokane because it’s safely out of sight and out of mind for libs in Seattle. They would send trucks of ice there as a relief effort if the Governor asked.
If it’s not cold in Oakland, then it’s not cold anywhere. The Sierra Club says so.
It’s snowing in the Dakotas, Minnesota, Iowa, Wisconsin, and Michigan again today.
The Climate Change Alarmists are shoveling the ‘Global Warming’ feces while the hardy denizens of the US northern tier states are shoveling snow. Which group do you suppose is honestly confronting reality?
Take your time. No hurry…..
Winter reached northern US in November.

No wonder NY is again exporting homeless people to warmer places. They can’t have homeless people frozen in the streets that were supposed to be getting hotter for citizens with heat stroke warnings.
Heat dangers in NY from 2013
https://wattsupwiththat.com/2013/05/20/heat-related-deaths-in-manhattan-projected-to-rise-except-reality-shows-them-going-down-in-the-usa/
Homeless exports now
https://katu.com/news/local/beaverton-mayor-denny-doyle-responds-to-new-york-city-sending-homeless-to-town
It will be this winter, which North America does not remember.
http://tropic.ssec.wisc.edu/real-time/mtpw2/webAnims/tpw_nrl_colors/namer/mimictpw_namer_latest.gif
Tomorrow, a snowstorm will attack over the northeast US. It will be a sudden blow.
Arctic air will hit November 10 in the east of the US at full power.
http://virga.sfsu.edu/gif/19110712_jetstream_h72.gif
Finally, Climate Change is over and a few days of cold air in the Eastern US is all the evidence needed!
That was a close one, what with the highest average temp 5 years occurring in the past 5, with the slope of the regression going back to 1980 at 0.26 C/decade (land).
Anyone who believes its over should start speculating on Florida water-front real estate! (or Put Your Money Where Your Mouth Is, as the economists say). My sisters live on Sanabel Island and they can’t give their property away.
Climate change never sleeps.
It has been 40 years of propaganda and rhetoric, that if we don’t follow the GREEN AGENDA the enhanced greenhouse effect will make this planet inhospitable to human life, and life in general.
What did we get?
Weather that varies from day to day, week to week, year to year, and decade to decade.
There is just no evidence that we are effecting the climate in a negative way.
And that is what the GREEN AGENDA will never admit, no matter what the actual data says.
Spell check knows better.
worth nothing is that three out of four of Spokane’s coldest Octobers ever (in 138 years of records) have occurred this century — including 2002 and 2009. –>
worth noting is that three out of four of Spokane’s coldest Octobers ever (in 138 years of records) have occurred this century — including 2002 and 2009.