Second-lowest September minimum since observations began
Alfred Wegener Institute, Helmholtz Centre for Polar and Marine Research

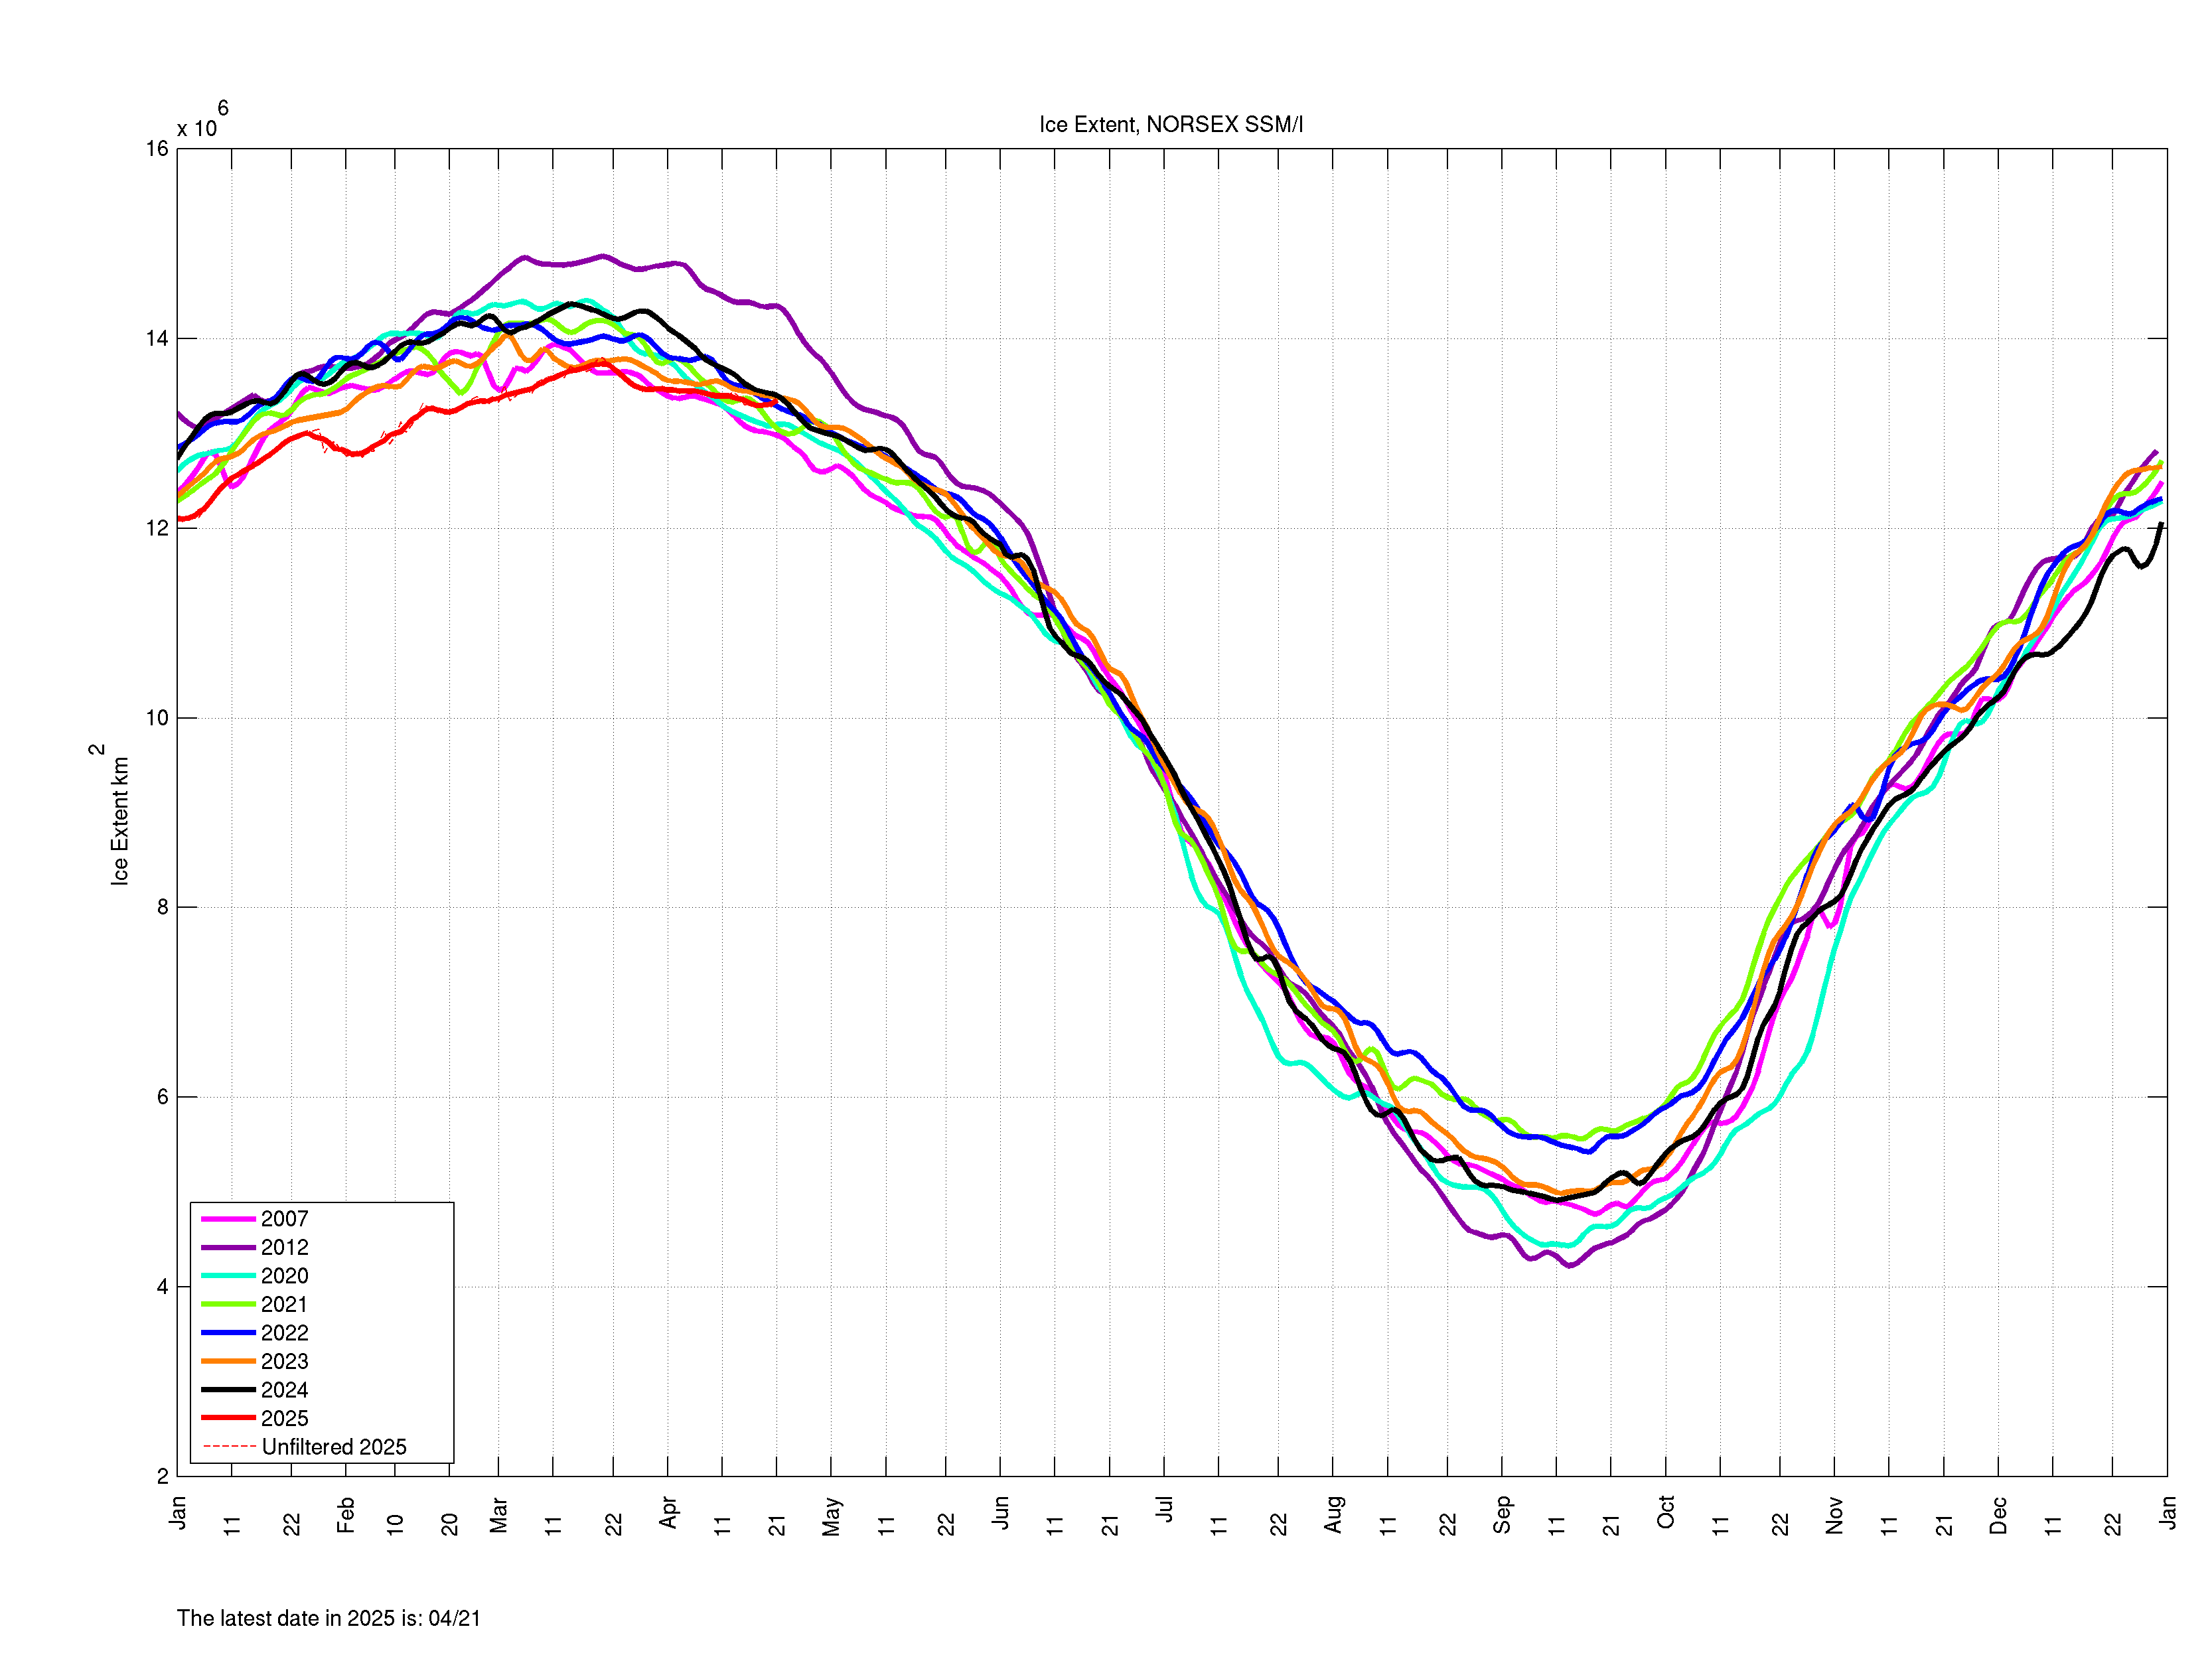
The sea-ice extent in the Arctic is nearing its annual minimum at the end of the melt season in September. Only circa 3.9 million square kilometres of the Arctic Ocean are covered by sea ice any more, according to researchers from the Alfred Wegener Institute and the University of Bremen. This is only the second time that the annual minimum has dropped below four million square kilometres since satellite measurements began in 1979.
Until mid-August, it looked as though a notable record would be reached: the area of the Arctic Ocean covered by ice (defined as the area with a sea-ice concentration of more than 15 percent) from late March to early August was the smallest measured by satellites since 1979. “Our satellite data show that between March and April 2019, there was an unusually large decrease in the ice extent, from which the Arctic sea ice was unable to recover,” explain Professor Christian Haas, a geophysicist and head of the Sea Ice section at the Alfred Wegener Institute, Helmholtz Centre for Polar and Marine Research (AWI) and Dr Gunnar Spreen from the University of Bremen’s Institute for Environmental Physics. Since the second half of August, however, the seasonal reduction has slowed down, overlaid by short-term fluctuations. The lowest value so far for 2019 was 3.82 million square kilometres, observed on 3 September. This means that this year, the September average could be below 4 million square kilometres for only the second time.
But in the coming weeks, the ice could retreat further: even though in early fall air temperatures in the Arctic have now fallen below freezing, the heat stored in the water can continue to melt the underside of the ice for a few more weeks. However, if it becomes extremely cold in the Arctic in the days ahead, the ice cover can already increase again. In October, the scientists will analyse the data for the whole of September, and will then be able to make a final assessment of the sea-ice minimum in 2019. It appears unlikely that this year we will see a new absolute record, below the sea-ice extent of 3.4 million square kilometres observed in 2012. “Record or not, this year confirms the continued long-term reduction of Arctic sea ice as a result of climate change, making it ever more likely that in a few decades the Arctic will be ice free in summer. This will mean drastic changes in the Arctic, with consequences for the climate and ecosystems, as well as for people, including us in Europe,” says Christian Haas.
Scientists at the Alfred Wegener Institute and the Institute for Environmental Physics at the University of Bremen are together analysing the complete satellite data on the ice concentration, extent, and thickness, as well as atmospheric measurements. The website https://www.meereisportal.de/en/ , for example, publishes daily updated ice maps and provides detailed summaries of the sea-ice developments. Ice extent estimates from other institutions (e.g. NSIDC or OSI-SAF) can provide slightly different results. Currently, for 2019 they predict the third-lowest ice extent. “These slight differences are due to the higher resolution of our data and the slightly different methods used to calculate the ice concentration. They show the uncertainties that even the most modern satellite observations can have. Data from the MOSAiC expedition will help to reduce these uncertainties,” explains Dr Gunnar Spreen from the University of Bremen’s Institute for Environmental Physics.
The researchers are currently particularly interested in the northern Laptev Sea: on 20 September, the research icebreaker Polarstern will set sail from Tromsø, in Norway, for the start of the MOSAiC expedition. In the northern Laptev Sea they will search for a suitable ice floe to moor the Polarstern to, in order to drift, icebound, through the Central Arctic for an entire year. “We’re following the ice situation very closely and have developed a series of new data products to offer the best-possible, detailed insights into the current conditions,” reports Christian Haas. “In the Laptev Sea, the ice situation is similar to previous years with an Arctic-wide low ice extent. This means that it will be relatively easy for us to reach our research area, at a latitude of 85 degrees north. But being so close to the ice edge will make it difficult to find a suitable ice floe that is large enough and thick enough to set up our ice camp. Our computer models show that the ice south of 88 degrees north is less than 80 centimetres thick, which is less than the 1.2 metres we’d ideally like to have to safely set up our measuring stations. We may have to travel farther north than planned to find the right conditions,” expects Christian Haas, who will lead the second leg of the MOSAiC expedition from mid-December.
###
Joint Press Release: Alfred Wegener Institute and University of Bremen
“But in the coming weeks, the ice could retreat further”
So it’s a bit early to be writing about a minimum.
No it won’t. Look at the forecasts.
Also:
http://nsidc.org/arcticseaicenews/charctic-interactive-sea-ice-graph/
4.25 over here on this site.
Jeroen 2019 is still on a downward trend.
I aint talking trend(year to year), just that the bottom is reached. It might vary 100KM² in the coming week, but you could pretty much call it. My biggest point was that on my source the extend is 300KM² more extend. So that must be a different way of calcutaling things.
Also if we do talk trend then it is all a matter of interpetation. If you start high then trend down and then hit a plateau are you then still trending down? Any year with no change would still add to the down trend.
Both NSIDC and Norwegian extractions are well over 4M , even today. Odd that NSIDC has 2019 and 2007 indistinguishable, where are this crew has it half way between 2007 and 2012 and 2018 dead on 2007 where as NSIDC had last year well above 2007.
Looks like someone has a thumb on the scales, yet again.
Sadly we do not see any error bars on their pics.
2019 is still on a downward trend.
This year the arctic was warmed by inflowing warmer tropical waters from the Nino 3 & 4 regions, and from the concurrent warm tropical flow through the N Atlantic. The NH sea-ice lags Nino34 by 6-8 months, which peaked in May-June, making the maximum effect on the arctic ice by November-December. The reverse, increaseing ice, will begin in earnest thereafter including Greenland AMB.
Nino 34 now below zero anomaly.
Apparently NOAA has early satellite data showing 1973 was a very low sea-ice year. I’d like to know more about that year. It is a bit lame to start sea-ice graphs in 1979, which was the highest recent sea-ice year:
This definitely is a low sea-ice year, but to me what is more important is not the amount of sea-ice but the motion. The motion is indicative of the pattern, and if you want to get alarmed about anything, it should be that the sea-ice jamming over to the Atlantic side is similar to the summer before the winter of 1962-1963, which was a wild winter old-timers in England like to brag about surviving.
https://sunriseswansong.wordpress.com/2019/09/20/arctic-sea-ice-a-denier-pride-parade/
Caleb – I can’t display the image here it seems, but check out the NSIDC’s pre 1979 numbers here:
http://GreatWhiteCon.info/wp-content/uploads/2019/09/mean_anomaly_1953-2012.png
What do you make of the late 60s – early 70s?
Firstly it’s unclear where they are getting these figures from. NSIDC 15% extent is still clearly above 4 million km^2 and it’s far from clear it will even reach less than that figure.
https://nsidc.org/arcticseaicenews/charctic-interactive-sea-ice-graph/
Norwegian estimate for extent also above 4.
https://web.nersc.no/WebData/arctic-roos.org/observation/DailyArcticIceAreaExtent.txt
Maybe they are confusing with sea ice area. An easy error for anyone who does not know anything about sea ice to make !!
In fact it looks like this year will be indistinguishable from 2007 – over a DECADE AGO – when Al Gore and IPCC started all the shouting and wailing about the imminent disappearance of Arctic sea ice.
Pretending that essentially flat lining for 12 years “confirms the continued long-term reduction ” is simply a lie. If you do nothing more than fit one straight line to the whole record, it is negative but that does not mean there is a continued reduction. It means there was a reduction which is NOT continuing.
Why do they mention sea ice minimum a week or two before it happens? As Nick says that seems a bit odd.
Oh, wait, isn’t there some climate meeting coming in NY. Maybe they just could not wait happened to get this misleading statement out until the event ACTUALLY since they would miss the chance to flood the media with fake climate news before the meeting.
Greta Thunberg is reportedly able to melt millions of square kilometers of sea ice, simply by means of those 40.000 ppm emerging from her lungs at a climate rally.
No, she just needs to give the Arctic ocean one of her famous, frosty stares and it would instantly freeze over. Sadly she does not care enough about polar bears to do that, she would rather see them suffer and become extinct so that she can give us all another of her “my patience is running out, I’m really cross now” looks from her climate pulpit.
The record starts in the late 70s. I’m not surprised that there has been a downward trend since then as in the 70s we were apparently headed for an imminent ice age.
It is a pity that the observations don’t go back to the 1920s or 30s, then you might get some more interesting data to look at.
Linear interpolation of cyclical phenomina also looks to be a problem. They have data for something like -sin(x), been 0 and pi/2.
There are sea ice records going back well over 100 years.
Here are a few graphs that combined go back to before 1925.
There is nothing in the least bit unusual about the amounts of sea ice in the Arctic this past year, ten years, twenty years…
The only thing unusual is seeing so many people who purport to be educated and knowledgeable acting like such ignorant jackasses.
See here:
https://twitter.com/NickMcGinley1/status/1173374067468066816?s=20
Seems to me that using 15% ice cover as a threshold between “ice” and “no ice” gives them plenty of opportunity for getting the results they want (in this case, they want the ice cover to be low, you can tell by the tone of the article).
E.g. by choosing smaller cell sizes. A hypothetical example: imagine a 100 km² cell containing 15 km² of ice floe, that’s 15%, so the 100 km² is “ice covered”. But then visualize if they used a 50 km² cell size to look at the same 100 km² with its 15 km² of ice, and the western 50 km² had 8 km² of ice, that’s 50 km² with 16% ice, so it’s “ice covered”, and the eastern 50 km² had 7 km² of ice floe,so that’s 50 km² with 14% of ice, so it’s “no ice”. So without having to falsify the data, they’ve just turned 100 km² of “ice cover” into 50 km² of “ice cover” and 50 km² of “open water”.
Perhaps the”higher resolution of our data” is being used creatively to generate yet another “worse than we thought. Isn’t science wonderful!
Also you no doubt noticed “Our computer models show that the ice south of 88 degrees north is less than 80 centimetres thick“. Model results taking the place of observational data; this article is in the very best tradition of climate science!
The 2006 Arctic sea ice volume is greater that the current level.
http://psc.apl.uw.edu/wordpress/wp-content/uploads/schweiger/ice_volume/BPIOMASIceVolumeAnomalyCurrentV2.1.png
There are sea ice records going back well over 100 years.
“Here are a few graphs that combined go back to before 1925.
There is nothing in the least bit unusual about the amounts of sea ice in the Arctic this past year, ten years, twenty years…
The only thing unusual is seeing so many people who purport to be educated and knowledgeable acting like such ignorant jackasses.
See here:
https://twitter.com/NickMcGinley1/status/1173374067468066816?s=20”
I can only see one graph at your link Nick. It shows that even at its lowest (about 1945-55), at 6 million sqkm it was still 50% higher than today.
You have to scroll through my tweets before and after that one.
Note the legend on the graph: Those are YEARLY average values.
They are not monthly.
What is the yearly average value recently, Lloydo?
If the coverage is 14 msk for most of the year and falls for a few months in Summer to 4-6 msk, what is the annual average?
Do you know how to read and interpret graphs and data?
Just a few days ago, Loydo couldn’t differentiate between count and area. Now he can’t differentiate between annual and monthly…and possibly daily.
NSIDC har Arctic sea ice extent of 4.251 mill. km2 Sept. 14th, practically same as for 216. Nothing dramatic here. Just another crises that refuses to materialize.
https://nsidc.org/arcticseaicenews/charctic-interactive-sea-ice-graph/
Just noticed one detail NSIDC graph says ” sea ice extent at least 15%” , Wegener say “>15%”
So if Wegener measure to nearest % , “>15%” means ” at least 16%” . However, this does not explain the notable differences in 2007 and 2018 between the two datasets. IMO someone has moved the goal posts to mask the recovery since 2012 OMG minimum.
BTW CPOM ice volume shows sustained recovery in minimum since 2012.

I see another dip forming and expect minimum to be 16th/17th this year.
I’ve wondered if they use different pixel values for the 15% threshold. 37/250 = 14.8%, or 15% rounded; 38/250 = 15.2%, or 15% rounded. The difference is 0.4%. So potentially they can decrease ice extent by 0.4% while still using a 15% threshold. The appearance, of course, is that ice extent has gone down, whereas in reality they just moved the goal post.
Up since 2012 is a downward trend?
Pretty much.
http://psc.apl.washington.edu/wordpress/wp-content/uploads/schweiger/ice_volume/BPIOMASIceVolumeAprSepCurrent.png
There are NO volume data before 2011 when Cryosat 2 was launched. All earlier volume data are guesses. Volume since 2011 has been remarkably stable:
http://www.cpom.ucl.ac.uk/csopr/sidata/vol_ts_0.large.png
And as for “Our computer models show that the ice south of 88 degrees north is less than 80 centimetres thick”, it is of course pure whistling in the dark as the thickness is not measurable during the melt season when there is meltwater pools on the ice. The average thickness at the beginning of the freeze season (October) has varied between 0.9 and 1.3 meters in recent years:
http://www.cpom.ucl.ac.uk/csopr/sidata/thk_ts_0.large.png?version=1
Yes, when the cherry pickers are blatantly obvious.
Loydo,
That’s volume, not extent.
The trend since 2012 is still up. And flat since 2007.
4.22 as of today and that’s the average over the last five days.
Weren’t we supposed to be “ice free” like 10 years ago?
We have all been dead since 2000, don’t understand what all the bruhaha is about!
Nope, the minimum is past, this all BS, if you look at the surface temp records it’s clear the ice did not melt as much as stated these are all models not actual measure, no worse then the fourth lowest extent and the ice thickness is up again this year
According to Jaxa, recent days have all shown melting. Same with NSIDC, including 71,000 sq km on most recent day.
Yah and NRL sea surface temperature makes it clear that ice extent is much higher than any of these models say. You look at it an explain.
@Nick
Starting 8.8th – ending 9.14th
2

-131

-165

19

-50

-97

4

-49

-21

-33

-79

-26

-28

-12

-94

23

17

11

-25

29

-21

-15

-58

-73

-97

-21

-112

-48

46

49

-9

-16

34

-27

-35

0

-71

-38
So does that look like we have shifted from negative to positive?
@Nick
It contradicts your comment: “recent days have all shown melting.”
Not mor, not less.
“It contradicts your comment”
For detecting a minimum, recent means the last few days. In your case, the last five days have melting, except for one zero, which may well just be a day without an update. For Jaxa, which I linked, all five days have melting.
At this time of year it is unlikely to be surface melting Nick, more likely to be compaction and dispersion as a result of wind direction.
From many of the replies to this thread, I can base the sea ice extent on the number of crows flying over my house, seasonally adjusted of course, then homogenise this figure with the number of galahs sitting on the fence.
Standards are so wonderful because there are so many to choose from.
Being able to pick and choose which ‘data’ source to use can give credence to anyone’s argument but does not make it correct. This applies to all arguments and why we should not take any single proclamation as the truth but look behind the curtain.
Even better, by hopping from one standard to another, you can artificially create any trend you need.
The thing about sea ice extent is that it reveals nothing about ice quantity or quality, and sometimes even ice existence. All that it really indicates is there is ice of some indeterminate area, volume and thickness in a certain grid location that emits a microwave signal above a certain threshold (15% of measurement range). New ice up to a certain point isn’t even detectable.
Ice volume
http://psc.apl.uw.edu/wordpress/wp-content/uploads/schweiger/ice_volume/BPIOMASIceVolumeAnomalyCurrentV2.1_CY.png
The trend
http://psc.apl.uw.edu/wordpress/wp-content/uploads/schweiger/ice_volume/BPIOMASIceVolumeAnomalyCurrentV2.1.png
So what does that tell us? What will be, or what has been? If ice volume increases or decreases from this point we would see the same thing.
Trend for last 10 years is level. no decrease.
Gerald – The past 5 years show a steep decline. (I too can cherry)
The long term trend is very much down.
Since the start of the satellite record, the trend is down.
However there are records that go much further back, and they indicate that their is no trend.
As you say, you can cherry pick with the best of them.
Mark w
“However there are records that go much further back, and they indicate that their is no trend.”
Really let’s see these records. Not some old guys sketches or a sailer who thought there was more ice. Real data.
Use actual data please, not models:
http://www.cpom.ucl.ac.uk/csopr/seaice.html
Fascinating how you reject real data, just because it doesn’t fit into your religious convictions.
Markw
“Fascinating how you reject real data, just because it doesn’t fit into your religious convictions.”
Once again all mouth no facts. You should run for president.
These are NOT models: they are from direct satellite observations. And what is more you can see they are accurate by looking at satellite pics online.
When I go to the sea ice page all I find are graphs that make this year look a lot like 2012. ie. I’m more inclined to agree with Griff and Nick than I usually am. 🙂
What should I be worried about……..?
No Bob, it’s running very close to 2007 substantially more than 2012.
https://nsidc.org/arcticseaicenews/charctic-interactive-sea-ice-graph/
There are a number of graphs which all seem to be produced differently. Plus there’s time for something weird to happen. I’m not betting on anything.
Very clever using a month old graph commiebob
Not clever at all. Mea culpa. There are six arctic sea ice extent graphs at the Sea Ice Page, and as you note, they are all a month behind. Groan.
Isn’t it great to see the Arctic get some ice after having none for several thousand years as it recovers from the Holocene onset?
Sea ice extent is not a direct measurement. The raw passive microwave signal data have to be conditioned with proprietary algorithms and numerous assumptions about weather and surface conditions. That’s why sea ice extent can vary amongst the various agencies.
Oh yeah?
“Our computer models show that the ice south of 88 degrees north is less than 80 centimetres thick, which is less than the 1.2 metres we’d ideally like to have to safely set up our measuring stations.”
Take a hike, or learn to read.
Ice thickness = models
Ice extent = measurements.
Take a hike yourself
Very clever using a month old graph commiebob
“This means that it will be relatively easy for us to reach our research area, at a latitude of 85 degrees north. But being so close to the ice edge will make it difficult to find a suitable ice floe that is large enough and thick enough to set up our ice camp. Our computer models show that the ice south of 88 degrees north is less than 80 centimetres thick, which is less than the 1.2 metres we’d ideally like to have to safely set up our measuring stations.”
–
At least it will be thick enough for their icebreaker to go through. Once it starts freezing it will get to 1.2 metres in a few days. Once it does it will not be an artificially created ice flo anymore, it will be part of a thick extensive ice plain
Sunsettommy September 15, 2019 at 7:56 am
What should I be worried about……..?
B I N G O
Or in other words, so what?
Just because you’ve chosen not to look for the reasons Steve, doesn’t mean they don’t exist.
What reasons? All are accompanied with ‘may’, ‘could’ etc.
Griff, do you really believe you can measure accurately from satellite pictures without knowing the angle or other processing operations on the pictures, and judge what is 15% ice and what is not……….. you are talking rubbish again. All measurements are essentially models that make assumptions about coastlines and what is/isn’t ice.
You may know this, but since it keeps being repeated… This is what I learned from reading about it; different agencies may use different methods. I think I read this on NSIDC.
Sea ice extent is not 15% coverage, i.e., it is not area. They really should use sea ice area, but don’t because using passive microwaves they can’t distinguish melt pools on top of ice from open water. So instead of using area in winter and extent in summer, they use extent year round. That’s unfortunate for accuracy.
Extent is minimum 15% of microwave signal range per grid area, quantified by pixel value in satellite “photos”. In other words, every grid cell photo pixel value (8-bit grey scale; 0-255) with a value between 38-250 (15%-100%) is considered to have ice present. That’s it. So that means a grid area could be 100% covered with crappy ice that emits a 15% signal, or a grid area could be whatever-percent covered with thicker ice that emits a 15% signal.
Icisil
For clarity I think you have to state the wavelength at which this assessment is made. If it is 15% it must be in a visible range.
It’s microwave, non-visible. The technology digitizes microwave signal strength (0-250) for each grid cell. Any grid cell value below 38 (15% of 250) is considered to be open water; 38-250 (15-100%) is considered to be ice.
Griff being wrong again
Take the bet
Except, if one clicks on the years between 2012 and 2019 to add them back into the NSIDC graph, 2019 is not lower than 2016. Or one could access a chart developed by the Arctic-roos.org:
As Bob Boder points out, the actual data is collected by passive satellite microwave sensors. Satellite sensors require many satellite passes to complete a picture. Daily sea ice estimates are courtesy models/assumptions; using datasets provided by that allegedly trustworthy agency NSIDC.
Last winter appears to be cooler than recent winters. link As well, there was a report that ships were encountering thicker than normal ice (but I’m darned if I can find the link). The arctic ice is cranky and almost anything could happen in the next few weeks. On the other hand, the trend does look a lot like 2012.
“ships were encountering thicker than normal ice (but I’m darned if I can find the link).”
_____________________________________________
https://electroverse.net/thick-arctic-ice-halts-yet-another-ship-of-climate-change-documentary-filmmakers/
https://www.highnorthnews.com/nb/node/47245
https://www.google.com/search?q=2018+winter+ships+were+encountering+thicker+than+normal+ice&oq=2018+winter+ships+were+encountering+thicker+than+normal+ice&aqs=chrome.
The other interesting thing is the minimum appears to be coming earlier in the month again, like it did prior to 2007. May or may not be an indication of a cycle change, only time will tell. What is pretty clear, like every other doomsday warming, the arctic sea ice death spiral was just another scam.
“May or may not…”
Sounds like you’ve already made your mind up about that Bob: that an appearance does actually make it a scam. You obviously think this graph is upside down.
http://berkeleyearth.org/wp-content/uploads/2018/01/TimeSeries2017-1024×582.png
Maybe so Nick, but surely that doesn’t negate the AWI’s point that, using their metric at least, 2019 will post the “Second-lowest September minimum since observations began”?
Or are you seriously suggesting that going lower than 2012 is still possible?
He just wants to take exception to the headline and declare that all is therefore wrong with WUWT.
It is Wegner Institute which is making pre-emptive claims and apparently getting their numbers wrong as well. Why are you trying to think that Nick is criticising WUWT, rather than those making the silly statements?
I can tell you why they are trying to talk about the min before it even happens it is to get their fake “continued decline” comments in in time for NY meeting. More PR pretending to be science.
AWI are not “making pre-emptive claims”, unless you are seriously suggesting that going lower than 2012 is still possible!
They are not “getting their numbers wrong” either. They are not using NSIDC or JAXA numbers, that’s all.
They are discussing sea ice minimum before it has happened. That is pre-emptive. The reason for it is political PR , not science, like I said.
**since observations began”?**
And when did they begin?
Good morning Gerald (UTC),
The AWI weren’t very specific. However assuming that they are referring to passive microwave satellite data:
SSMR: 1978
SSM/I: 1987
AMSR-E: 2002
SSMIS: 2005
AMSR2: 2012
Pre the NSIDC’s very own Sea Ice Index there’s also EMSR: 1975
The point is, now is the time when a minimum should be occurring – but! this year the ice could still be melting further. On top of the second lowest extent, that shows exactly how bad the state of the ice is…
The latest minimum we had if I remember well was on 20th of Sept. as an exception.
Griff where is it Cast in Stone that Sea Ice Minimum must always fall on a specific day?
Sea Ice Minimum can be affected by many differing Weather Dependant Variables.
It has almost always fallen within the same two week stretch between the first and third week of September (1979 – 3rd week, 1984 – 2nd week, 2007 – 3rd week, 2012 – 2nd week, 2016 – 1st week)
It Never turns the corner on a single date like Autumn is always Sept 23.
It is just like Autumn, the date depends on the year.
http://www.apples4theteacher.com/holidays/fall/first-day-of-fall.html
Yes, it could melt some more. And it could also start re-freezing. It could melt a lot or freeze even more. Stop acting like you can predict the future. Just fyi – you CAN’T!
Please enlighten us on how to know when sea ice “should ” reach minimum.
Your claim that it “could” go lower … shows exactly nothing because it has not happened. The key problem for alarmists is not knowing the difference of maybe-could-be speculations and FACTS.
If you would like to inform yourself about the timing of Arctic minimum you could read my article studying how it got later and later until 2007 and had been drifting earlier since. Exactly now “bad” is that?

https://climategrog.wordpress.com/arctic_min_extent_dates/
Sorry, missed the full article over at Climate Etc.
https://judithcurry.com/2016/09/18/is-the-arctic-sea-ice-spiral-of-death-dead/
However according to the russians new ice is already forming:
http://www.aari.ru/main.php?lg=0&id=94
According to the Germans as well:
http://GreatWhiteCon.info/2019/09/the-mosaic-expedition/#comment-289460
yup there may be some compaction going on over the next 2 days
Nick just wants to complain because well, he’s Nick.
The typical date range for the sea ice minimum in the Arctic is Sept 18th to 22nd.
So, it is a good time to be talking about the minimum. WUWT usually notes and reports the minimum before official agencies do, that will likely be the case again this year.
Don’t assume ill will unnecessarily. WUWT was simply reporting Wegener Institute’s pre-emptive statements. If anything I would think his criticism applies to them, it was their timing and their announcement.
What is more relevant is why they should chose to try to talk about minimum now instead of wait a week or 10 days to have something concrete to report instead of speculative commentary.
The reason is almost certainly the NY climate meeting and the MSM conspiracy to saturate news with climate coverage in the week preceding this event.
Greg September 15, 2019 at 9:12 am
It may also have something to do with the institute’s little boating adventure.
“RV Polarstern”
michael
Thanks, Greg. I quoted what I was querying, and it was indeed the statement from the Wegener Institute.
So the Arctic ocean will lose an enormous quantity of energy because not being covered by ice.
Gerald – The past 5 years show a steep decline. (I too can cherry)
The long term trend is very much down.
No, not really. The last 12 years (2007 through 2019) are all right about at the same level. 1/3 of the entire satellite record makes somewhat an exaggerated linear extrapolation not really really very important, doesn’t it?
The cycle seems to be about 72-74 years – with a peak at 82-84, and is now at its low point of 2007-2012. And each year that remains near the 2010-2018 average makes your exaggerated linear trend more useless.
“So the Arctic ocean will lose an enormous quantity of energy because not being covered by ice.”
Yes, there is so much more energy to lose. Its warmer, close to 3C warmer.
http://berkeleyearth.org/wp-content/uploads/2018/01/TimeSeries2017-1024×582.png
Which would be 276C above absolute zero.
Given how dry the air is above the arctic, it’s fairly easy for that heat to escape to space.
I’ve seen nothing with a 3 in front of on the DMI site
This graph has the extent over 5 msk:
http://ocean.dmi.dk/arctic/icecover_30y.uk.php
The numbers are essentially the same over all of the recent years.
We are one or two unusually cold Arctic Winters away from a sharply increasing trend.
Just as a couple of years of globally lower temps and we will be below the 1980-2010 average.
The only place anything dramatic is happening is in the pronouncements of shrill alarmists and the world of doctored data and graphs.
Whaat? Are you looking at the graph in your own link?
Let me get this straight: IF we have as few as one “unusually cold Arctic Winter” that will refute the data and the graphs. Kool aid anyone?
Yes, that is right.
Historically, it is evident that a huge amount of ice can form and persist in a single year.
No Kool Aid required to know this, just an ability to look at historical data and understand what you are looking at.
Warmistas are incredibly unable to see what is in front of their eyes, if it conflicts with their world view.
Trends can and have change very quickly.
During the 1970s, around the time of the peak, there were huge swings in ice amount.
We saw a muted version of that phenomenon in 2013 when ice amount snapped back sharply.
Look what occurred between 1960 and 1963-64.
Lowest level of that 50+ year period to very close to the highest level of the century.
In the mid 1970s were some low ice years, but 1979 was a huge spike upwards in ice amount, and it persisted for many years of warming temps.
I suspect you were not alive in the 1970s, or at least not old enough to be aware are anything.
I was.
Why do you suppose there was an effort to launch satellites in the late 1970s and keep an eye on temperatures and ice?
It was not due to warming.
It was due to concerns about cooling and an impenetrable Arctic.
The Soviets were way ahead in icebreaker technology, and the cold war was red hot.
Okay, I see what you mean. Between last night and this morning they updated that graph and the last dot went below the 5msk line. It was above it, with a “?”.
It is even now just below the 5msk line.
It was late last night, and perhaps I was holding my mouse over the August tab and not realized.
Not sure, but it is clear it is no where near 4.
Personally, I do not care how much ice melts.
My view on perpetually frozen lifeless wastelands is clear: Less of them is better.
Anyone wishing for an even more frigidly frozen polar wasteland is insane, IMO.
Yawn
Best reply so far. They are getting their panties in a knot over something that’s been going on for millennia.
The point isn’t to be accurate. The point is to be able to get “second lowest” into a press release and headlines. Therefore, if data goes otherway it won’t be reported and John Q Public only hears second lowest. You are mistaking these people for scientists.
Bingo!
Nick, No mention of the expedition from Russia a week or so ago which was taken by surpise when it encoutered 3 or more metres of solid packed ice all the way from Svalbard to the North Pole. The big, new nuke powered breaker had to back up many times to break through and the planned trip took an extra two days. The ice in the Arctic basin is actually 100% extent! This means the ice is actually growing strongly. Spread this hard packed mass out to 15% and redo the assessment.
Gary,
You state “The ice in the Arctic basin is actually 100% extent!”
Oh no it isn’t! A picture is worth a 1000 words, but it seems they are unavailable on here.
In which case please take a look at some more data from the University of Bremen:
Jim I’m merely reporting an actual trip from Svalbard to the Northpole a week ago. The fact that Bremen data doesn’t show this thickness and that it was a big surprise to all on the trip, including the Russian Navy makes Bremen data wrong. One of the world’s largest and most powerful breakers had to back up numerous times to get a run at the ice. This added two days onto the expected duration of the transect.
Gary,
FYI “Svalbard to the North Pole” != “The Arctic basin”
Are we talking about area or extent? Neither one seems to look particularly bad according to Nansen.
Ice area looking better than extent would imply some compaction rather than dispersal from wind.
It almost sounds like they were disappointed that a record wasn’t set.
“…So it’s a bit early to be writing about a minimum…”
It wasn’t. You didn’t get your wish.
What are you on about Michael?
The JAXA minimum was on September 17th. The NSIDC version reached a minimum on the 18th:
https://nsidc.org/arcticseaicenews/2019/09/arctic-sea-ice-reaches-second-lowest-minimum-in-satellite-record/
Run to the hills!
Al Gore claimed scientists said the arctic would be gone by 2014.
What Al Gore really said:
Last September 21, as the Northern Hemisphere tilted away from the sun, scientists reported with unprecedented distress that the North Polar ice cap is “falling off a cliff.” One study estimated that it could be completely gone during summer in less than 22 years. Another new study, to be presented by U.S. Navy researchers later this week, warns it could happen in as little as 7 years.
https://www.nobelprize.org/prizes/peace/2007/gore/26118-al-gore-nobel-lecture-2007/
Masolwski, Wadhams, Zwally, Serezze, Barber and others made similar statements. Perhaps the Arctic can’t hear them because it’s screaming.
What would satellites have shown for 1910, 1920 or during the LIA?
“What would satellites have shown for 1910, 1920 or during the LIA?”
Good question! It would look something like the first link below. As you can see, the arctic sea ice has been lower in the recent past (the 1930’s). Starting the chart from 1979, when satellites first started making these measurements, is, as can be seen, very misleading as to the trend.
And the reason why more ice melted in the arctic in the 1930’s is because it was warmer in the arctic in the 1930’s than it is today. Nothing unprecedented is happening today in the arctic with the temperatures or the ice melting.
Is there anything that cores could do to resolve the ice extent? You know that magnetic dust that you can collect in your storm gutters from meteorites? Maybe if there are extended periods of ice coverage of on-island pools, it would build up, and only be released and sink to the bottom of pools when the ice covering those pools melted. By comparing strata of pools at various latitudes, maybe you would get some insight?
These 20th century graphs also plainly depict how rapidly a trend can and often does change, as also how drastically year to year variations within a secular trend can be.
Also obvious that what happened in 2012 is not unusual, that there is no death spiral in the ice under current climate conditions.
Every year it gets dark up there for 6 months, and all the water freezes over.
Enormous amounts of ice can form or melt in a small interval of time, and a low value one year does not mean the ice is going away, nor does a high value mean it cannot melt back to below average in a year or two. We have seen how the ice can be blow out of the Arctic basin and melt in warmer water further south. One huge storm can bust up a lot of ice.
How many people on this comment thread think it would be a good thing to have year-round 80-100 foot thick ice covering the entire basin, as some reports from the LIA assert?
That was only ONE comment.
Gore made similar statement several other times in subsequent years. Often he referenced Dr. Wieslav Maslowski as his source, ignoring that fact that these results were far more aggressive than those of other scientists.
Worst of all, Dr. Maslowski himself said he did not know where Gore was getting substantiation for those claims out of his work.
Fail.
James Hansen was more confident, in 2008 he said the Arctic “will” be ice free in summer in 5 to 10 years.
“…scientists reported with unprecedented distress…” Yeah right, Gore has of course made a study of scientific distress through the ages and reached this stunning conclusion. And to think that such BS was uttered in my home town, in MY City Hall!
jack,
Gore has upped his game. “Climate Crisis” is the new name.
2013 but who’s counting
Yes, it was in December, 2008 when he spoke stridently, in a German museum with a dinosaur skeleton in the background, about no sea ice in 5 years
Dave,
I stand corrected.
From the archives: https://wattsupwiththat.com/2018/12/16/ten-years-ago-algore-predicted-the-north-polar-ice-cap-would-be-gone-inconveniently-its-still-there/
As of 9-14-2019 JAXA data shows it still above 4 million
9 8 4163470
9 9 4170163
9 10 4149896
9 11 4110564
9 12 4087341
9 13 4053800
9 14 4025718
9 15 4006036
Getting close.
As of 9 16 it’s 3.991187.
The Data from NSIDC shows Artic Sea Ice extent of above 4.251 Million km2 till date ?
See
Charctic Interactive Sea Ice Graph
Yes. In NSIDC data this year is still above 2016 and 2007, as well as 2012. Thus fourth lowest is still possible. Just depends upon how long the melt lasts.
But in any case, won’t come close to 2012, despite increase in Russian ice breaking activity.
So this article is using the now common alarmist tactic of the pre-announced record, to flood the media with fake news – even though it is obvious that there is near zero chance it will actually be a record low 15% extent. And NSIDC and DMI are both above the suggested level (and given the sizable discrepancy between those 2 sources too – who would believe any of them!)
Hey: it is ALREADY a record second lowest, even though it is STILL melting.
It’s not still melting. Stop spreading that bullshit.
This is like that “greenland all melted at once!” lie your lot were throwing around a while back.
No, griff, that’s wishfull thinking</a<
Griff there is no such thing, except in alarmist speak, as a “Record Second Lowest”
Second places at a track meet doesn’t set any records. Sorry
No, it isn’t.
The minimum was lower in 2016 and 2007. To be second it needs to be lower than 4.155 in NSDIC observations.
You left out “since 1979”, Mr Panic. In 1979 I had already been on this Earth 28 years, but those don’t count. My Father had been on this Earth for 57 years, but those don’t count. It was 203 years before that the Founding Fathers declared independence, but those years don’t count. It was 1979 years since the start of the current calendar, but those years don’t count. It was over 12,000 years ago that the post Younger Dryas warming started, but none of those years count. So not so much a record.
Griff; what on earth does it matter if the sea ice is still melting or not? Is it only important in order to score some silly debating point? What if, by some Goreatric Miracle, the minimum would stop at 1,5 mill. km2, and stay there for a few days, before starting the freeeze again? How much would that alter global temperature?
Griff, no it isn’t according to multiple sources, and it isn’t going to change significantly now – the volume has already increased – so any change in extent is just wind pushing it around, and as you know the ice decline stopped 15 years ago, all years are so close it makes no difference, to suggest otherwise is dishonest, but we know you have no problem suggesting otherwise.
There is absolutely no correlation between Arctic ice and CO2, the Arctic is no warmer than c.1940, the peak of the last major cycle, as you full well know.
There is also no credible (accurate enough to compare) record of extent outside of the satellite era – despite ludicrous attempts to claim otherwise. But we do know with near certainty that the Arctic has had considerably less/no ice for thousands of years at a time in at least 2 distinct periods in the last 11k years.
Your alarmism is bogus.
It’s not melting, and it’s not the second lowest.
griff is eager to believe any lie that supports what he is paid to believe.
I count three, 2007,2012,2016 – the day the statement was published.
Which of the numerous different extent metrics are you looking at Krishna?
ftp://sidads.colorado.edu/DATASETS/NOAA/G02135/north/daily/data/N_seaice_extent_daily_v3.0.csv
But AWI are referencing the University of Bremen’s numbers, so it’s hardly surprising that there’s a discrepancy!
Next summer there has to be more icebreakers to melt ice, because othervice prediktions fail
“this year confirms the continued long-term reduction of Arctic sea ice as a result of climate change”
Climate Newspeak for the fact that the amount of ice has been remarkably stable for 12 years now, both in area and volume:
http://www.cpom.ucl.ac.uk/csopr/sidata/vol_ts_0.large.png
http://ocean.dmi.dk/arctic/plots/icecover/osisaf_nh_iceextent_seasonal_en.png
Thanks tty , exactly what I’ve been trying to point out for the last few years. The death spiral dead , run away melting has stopped running away. The naive +ve feedback hypothesis is disproven.
Normal for a centennial solar minimum. No wonder the British Navy observed a great loss of Arctic sea ice in 1815-1817 in the Dalton Minimum. 4 months of negative North Atlantic Oscillation this summer was bound to reduce the sea ice.
The northwest passage and the northern sea route were open.
For your information the northern searoute has been open every year since 1933.
And yes, the southern, shallow, northwest passage is open this year – unlike last year.
How odd that the press is not full of ships using the North West Passage as it is so open.
Odd maybe. I monitored the progress of ms The World and another cruise ship as they passed through the NW passage a week ago. There is an ice breaker (Terry Fox) stationed up there that makes regular runs through the route. I don’t know if that’s to keep the passage clear, or simply to monitor the situation.
“I don’t know if that’s to keep the passage clear, or simply to monitor the situation.”
Quite possibly because basically nobody lives in the Canadian Arctic. If a cruise ship has an engine room fire or hits a reef or gets trapped in wind blown ice, without that icebreaker, they’re going to have to depend on the resources of Cambridge Bay — population less than 1800 — for help. And they don’t really have all that much time for help to be mobilized. It’s not like the sailing season in the Northwest Passages is all that long. Neither is ever likely to be very long. But an icebreaker conceptually can extend it considerably.
” It’s not like the sailing season in the Northwest Passages is all that long.”
I think it’s over. There’s not a single ship in the area except Terry Fox. ms The World has moved on to the Kamchatka Krai peninsula in Russia.
The icebreaker is probably mostly around to ensure that supply shipments get through to the settlements up there. Last year several supply ships got stuck and they had to fly in a lot of supplies which was very expensive.
And the southern route – which is the only one that is open – will never amount to much, it is to narrow, too crooked and too shallow (20 feet). The northern, deep one, through the McClure strait, requires stronger icebreakers, probably nuclear. It has only ever been passed by non-icebreakers in four seasons: 1944, 2010, 2012 and 2014.
tty, McClure wasn’t passable in 1944.
Oh no… SHIPS are slow and take TIME. Important press and media people demand JET travel.
SURRRE, it goes against the whole narrative, but IMPORTANT people delivering the IMPORTANT message about imminent climate calamity (media people- including news anchors, magazine writers, talk-show hosts; Hollywood spokespeople, social media “influencers,” and TV stars; “Important Voices of Authority” from academia (but only the ‘correct’ schools); and of course, POLITICAL authorities) who can explain why it is NECESSARY to suspend your cautious, investigative nature, and FULLY trust these vaunted cultural icons as they parrot off talking points about the liberties and lucre you must sacrifice to the new international religion…
But FEAR NOT!! Simply sign over your civil liberties, your disposable income, and your right to direct your own life— and in exchange, the all-wise climate SCIENTISTS will inform you regularly as they travel the world to SHOW you how their “CO2-scrubbing” technology is steadily, little by little, FIXING the problem! Oh, but don’t think of cutting off funding just yet– oh, not at all! It’ll take YEARS and YEARS of “scrubbing” to make any real progress!!
I can predict how the Leftists & Marxist-Communists would spin the narrative, because it is THEY who are dim, stupid, and as predictable as Tax Day.
The one-size-fits-all “magic solution” prescribed by government will be said to be working, and that the outlook is very positive, but it will take a long, long time to fix all the “damage” done by the proletariat (certainly can’t have the revenue stream dry up before all the government aristocracy are impossibly rich, now CAN we?!).
And the world will descend into totalitarian serfdom under an all-powerful aristocracy.
The time it would then take for the under-class to revolt and murder the ruling class depends only on how ruthless and cruel the latter is, and how angry the oppressed become over time.
For ME, that would be 30 seconds. For the upcoming generation, I fear they could be happy for generations, as long as they could play “Call of Duty” 24/7, and not have to leave the house.
ftp://sidads.colorado.edu/DATASETS/NOAA/G02135/north/daily/data/N_seaice_extent_daily_v3.0.csv
Yesterday = 4.171
2016 = 4.145
2012 = 3.340
2007 = 4.147
“Record or not, this year confirms the continued long-term reduction of Arctic sea ice as a result of climate change, making it ever more likely that in a few decades the Arctic will be ice free in summer. ”
staying the same for past 7 years….is not a long term reduction
Long term Arctic sea ice decline
Sure it’s down since the maximum of the 20th century, but it’s still above the minimum of the 20th century, not shown on the chart. Sea ice is naturally cyclical. We’re also above most of the Holocene summer minimum.
actual chart ’til yesterday
Yeah, but it’s up from zero just a few thousand years ago when the seas were six feet higher.
Jack….second lowest in 7 years…..is exactly what it says
..and more ice than there was 7 years ago is not a sign of continued long term reduction
that’s not saying there been no long term change….only that more ice is not a sign of it
Those pre 1979 “estimates” or “reports” are not accurate. Check the source. They said”use with caution\\\\\\\\\\’
chart
https://moyhu.blogspot.com/p/latest-ice-and-temperature-data.html#ice
Try the DMI, it’s the same as in previous years…. certainly nothing at all like a record and the Melt season is over as you can see it’s up turning already.
http://ocean.dmi.dk/arctic/icecover.uk.php
These Leftist “scientists” are such liars.
2019’s Arctic Ice Extent will be the FOURTH lowest, and about 900,000 KM^2 larger than the 2012 record low.
Why must Leftist always lie about the facts?
A rhetorical question, BTW…
The arctic sea icecover was likely similar to 2019 during the last Franklin expedition in 1845, when the ships maneuvered around up to 77 °N in the Wellington channel. How can that be during times when LIA (Little Ice Age) has just ended. The claims about lowest sea ice coverage is less relevant if the time span is only 40 years, wait some more 40 years and we‘ll observe there is cyclic event due atlantic currents and cycles (AMO, …).
Less ice in a cold climate with cloud cover will:
Warm the earth?
or
Cool the earth?
Underlying water will be exposed to wind and cool temperatures so I guess a lid on the heating pot is good to preserve the heat.
Its 3C warmer than 100 years ago and climbing, now above the 40 year trend. Warming means warming not cooling.
http://berkeleyearth.org/wp-content/uploads/2018/01/Arctic2017.png
I suggest that you aquaint yourself of how the Berkeleyearth dataset is actually compiled, they are not “real” temperatures.
Real is defined by whether it supports the cause.
Berkely Earth’s graph shows the temperature north of 60° N has risen 2.5C since 1980. Happy to be shown if that is incorrect AC. Do you have a link?
Whatever difference Arctic ice makes to the habitability of the earth, deuterium/CO2 lead/lag in ice-cores indicates that CO2 has no significant effect on its extent so we can continue to make our lives better using hydrocarbon fuels.
P.S. It’s called an interglacial period for a reason.
The Holocene Optimum was 6000 years ago, followed by long term cooling which abruptly reversed about 2 centuries ago with the Industrial Revolution and the reliance on fossil fuels. We have emitted 1.5 trillion tonnes of CO2 which, using carbon isotope analysis, can directly attributed to human activities. We now have CO2 levels not recorded to 3-5 million years.
Instead of continuing to cool, we are warming.
The long-term trend is still cooling. HCO ended about 5000 years ago. Since then, the secular cooling trend has been interrupted at about millennial intervals by countertrend warming cycles. The Egyptian 4 Ka and Minoan 3 Ka Warm Periods were about equally balmy, with the Bronze Age Collapse Cool Period in between. The Greek Dark Ages CP was followed by the Roman 2 Ka WP, which was cooler than the Minoan. The Dark Ages CP preceded the Medieval 1Ka WP, which was cooler than the Roman. The Little Ice Age CP preceded the Modern WP, which is still cooler than the Medieval.
So the T downtrend is intact. The massive East Antarctic Ice Sheet quit retreating after the Minoan WP.
Is the Egyptian Warming Period recognized widely?
I’ve been familiar with the Minoan Warming Period for a while (at -3000 years ago), and the Roman Warming Period (at -2000 years ago -which makes a nice contrast between the Medieval Warming Period at -1000 years ago) and the Modern Warming Period (2000 AD), but yours is the first referencing the Egyptian Warming Period.
Do you really believe Earth’s climate prior to the appearance of humans was so well behaved that an interglacial period was always characterized by continuous warming to a maximum, and then continuous cooling until the onset of the next glacial period?
Also, since the Earth is around 4.3 BILLION years old, why did you cherry pick the last 3-5 million years (i.e., the last 0.1% of climate history) . . . could it be that you did not want to address those past periods of Earth’s climate that had atmospheric CO2 levels 3-10 times the current level of 410 ppm . . . levels that Earth survived and recovered from quite naturally without panicked, ill-considered actions from puny humans?
Life flourished during the Cambrian period, despite atmospheric CO2 about 10 times higher than today and whatever “greenhouse effect” those CO2 levels MIGHT have created.
The cooling ended about 100 years prior to the dumping of huge amounts of CO2 into the atmosphere.
Regardless, we are still 3 to 5C below the level of the Holocene optimum during which time life on earth flourished.
Tell me again why a small increase in temperature is a bad thing?
a simple plot of arctic sea ice with data from https://ads.nipr.ac.jp/vishop/#/extent
no models just their data
https://ads.nipr.ac.jp/vishop/#/extent
Sea ice is 2nd lowest extent
Rate of change per day of extent is still showing a loss (2012 which was lowest was at this date showing zero change per day).
loss rate is changing rapidly to gain and sea ice may possibly reach zero from Sept 15th onward
All plots of extent on selected days show a rate of loss conforming to the start line approximation.
Because vast areas of ocean will be near freezing one can expect a large positive rate of change (similar to 2012) to occur this month.
wait for this baby
https://svs.gsfc.nasa.gov/Gallery/icesat2.html
It was launched a year ago. What are we waiting for?
~¿~
The data must be properly adjusted first.
From mid-August through the end of the year, more heat is lost from the newly-exposed open Arctic ocean each day than than is gained from the ever-shorter Arctic daylight hours. Dr Curry (SHEBA, August 12 1998) reported melt water ponds froze over each night beginning August 12.
But the year starts over again in January, and from January through mid-April, more heat is lost from the exposed Arctic Ocean each day than is gained from the sunlight. For 8 months of the year, less sea ice means more heat is lost.
2019 is a low year, but the only two years in the last 20 when Arctic Sea Ice was higher than the 1980-2010 average in March or April were 2007 and 2010. And, in both of those years – when “excess sea ice” in Mar-April was present to insulate the Arctic Ocean from heat loss to space, 2010 set a new record low sea ice extents in the summer, and 2007 set an all-time record low sea ice extents at its September minimum.
2019 is certainly a low year, but compared to the most recent years, it is near the middle of the pack (with 6 higher, 3 lower for early September), slightly below the recent average for August-September.
Loss of sea ice is a negative feedback, it allows the ocean to lose heat to space.
Indeed, and by evaporation and conduction to the air. The simplistic assumption that open sea will be a +ve f/b because of minimal insolation at glazing incidence is willfully simplistic but fits the catastrophic mindset so they look no further.
The DATA of the last 12 years solidly refutes the idea of a dominant positive f/b : tipping point : death spiral of what ever other silly names they can invent.
The death spiral is dead
Correct…insolation up there is low to near zero for most of the year, and water has a high albedo at a low angle of incidence anyhow.
But the main thing is…in Winter it is very cold and very dark and the entire basin freezes over, except to the extent that winds can clear ice from one area or another for a time.
In fact, wind piling up ice into piles at the same time as it is extremely cold for months on end is almost surely how the huge increases in ice we have seen in the past can occur.
Wind clears an area of ice, it refreezes, wind pushes the new ice onto the pack, lather rinse and repeat for a whole Winter.
Correct…insolation up there is low to near zero for most of the year, and water has a high albedo at a low angle of incidence anyhow.
The insolation at the pole is greater than that at the equator from early May to early August.
http://2.bp.blogspot.com/-k_S7N0VlMRg/UH4RNvJ3cjI/AAAAAAAAFjk/lqjQhGqLWOk/s1600/insolation_latitude.gif
For reference on insolation at the North Pole.
James Hansen said it was a tipping point and the Arctic was behaving just like predicted. Of course he said that it would be ice free in summer by now. He’s clearly wrong on both points.
Satellite record since 1979?? Completely meaningless in climate terms
Arctic seaice lost startet about more than 150 years.
german source
I found now the archive, as my bookmarks have been out of date and it has moved to:
Historical Ice Chart Archive