Guest Excelling by David Middleton
Every year since at least 2014 the U.S. Energy Information Administration has published a report called Levelized Cost and Levelized Avoided Cost of New Generation Resources as part of their Annual Energy Outlook. I went through each report since 2014 and built an Excel spreadsheet to look at the year-to-year changes. What I found was fracking hilarious.
I specifically looked at the average Levelized Cost of Electricity (LCOE) for five (5) generation sources:
- Natural Gas Advanced Combined Cycle
- Advanced Nuclear
- Solar PV
- Wind – Onshore
- Wind – Offshore
The currency and year of entering service is noted on each line. Each year’s report estimates the average cost of power plants entering service in the near future in current U.S. dollars. I also included the outlook for 2040 that was in this year’s report, even though it is a wild-@$$ed guess.
LCOE by Energy Source

Who else is surprised by the fact that the capital costs for Natural Gas Advanced Combined Cycle have been cut in half since 2014?

Look ma, no subsidies! If nuclear power was subsidized like solar & wind… we might have already replaced coal with natural gas and nuclear power.

Despite all of the advances in technology, solar PV still doesn’t work 70% of the time.

Not bad… when the wind blows.

Ron White would say…

Total System LCOE Comparisons


LCOE as % of Natural Gas Advanced Combined Cycle


With the investment tax credit (ITC) and the production tax credit (PTC), wind barely edged out natural gas on windy days for 3 years.
LCOE Graphs


Any questions?
Addendum
Form EIA-860 detailed data with previous form data (EIA-860A/860B)
This set of files includes generator-level information on power plants that are 1) operable, 2) proposed, permitted and/or under construction, and 3) recently retired or cancelled. The most recent complete year is 2017. At the end of 2017 this is what was in the proposed tab…

Note that there are virtually no offshore wind turbines (30 MW) currently in the permitting/construction pipeline and battery installations are laughable. While there are MW 53,916 of natural gas combined cycle, 12,891 MW of natural gas combustion, and 1,187 MW of coal-fired capacity in the pipeline. Two of the three coal-fired generators are even listed as under construction. That’s just under 68,000 MW of fossil fuel-fired generation capacity vs just under 42,000 MW of onshore wind (27,531 MW) & solar PV (14,282 MW). Since it takes 2-4 MW of wind or solar to offset 1 MW of natural gas, coal or nuclear, it’s even more lopsided than it appears.
From the report:
So what does the as ever objective David Middleton do ? He gets out his Excel and puts dispatchable and non-dispatchable technologies in the same table. Having just read that it can be problematic and misleading.
Indeed, who else is surprised that the capital costs have been cut in half since last year !! That very surprising claim needs further comment. I have no idea how they came to that conclusion.
When I also see that they say the value of a wind driven system is different depending upon whether it is replacing coal or gas generation I smell a CO2 rat lurking behind the stats. Though they seem to take care not to mention AGW or CO2 “pollution” directly , it does seem to be a covert part of their calculations.
That makes me even more suspicious than had they stated it openly and explained what effects this makes to their figures.
If Fossil Fuels we’re properly priced based upon carbon emissions and their costs upon society in health damage they would be completely uncompetitive. That is a subsidy.
What a joke this article is. Pure BS!!!!!
Since you guys are all about antiquated technology, wanna buy my VHS recorder? How about my 8-track player? I’ll even include a bunch of 8 -track tapes at no additional cost.
The replacements for VHS tapes and 8tracks actually work, quite unlike wind and solar, no matter how much you hand wave.
SOrry tom, but WInd and Solar are ataking over, no matter how much much you want to burn coal and convince yourslef that it’s the way to go. COAL IS DYING! Hate to break it to you. Don’t believe me? Invest in it and report back how much you’ve made in the next five years.
HOw many new coal fired plants are coming online in the U.S.? ZERO! It’s dirty and it’s expensive. Thinking some clever marketing slogan like “clean coal” is going to save it is stupidity. Natural gas will follow eventually Too bad you’re stuck in the past.
It’s people like you who used to shout, ‘bla bla bla what about the duck curve? ” Now that reasonably costing energy storage is here and working, you’re on to something else. When we prove that wrong, you’ll move to a different target. Fossil fuels are so last century. Get withthe program. You won’t becasue you’re probably old and your brain is stuck on the old way of way of doing anything.
What storage? Other than pumped storage, which the green blob would oppose actually building, nothing is larger than less than half an hour for the system. One would need at least two weeks. And that ignores cost.
Waht are you talking about?!!! Are you that much in denial? All kinds of storage projects are being built. Is there a need for longer term energy storage? Sure, and that’s coming. It would already be here if it wasn’t for fosil fuel enthusiasts like yourself blocking renewables every chance you get. Google Liquified air energy storage and educate yourself. It will be the solution to long term energy storage. The technology is new but it will be one of multiple energy storage technologies which will replace gas and coal!
https://www.highviewpower.com/news_announcement/highview-powers-liquid-air-energy-storage-named-technology-of-the-year-by-businessgreen-magazine/
Now for your “Yeah, but” response….
Vaporware, all of them. Name the actual installations hooked up to the grid.
Chuck, as someone who was actually responsible for developing and operating generation, transmission and distribution systems to reliably and cheaply meet the needs of his customers, I think you are completely full of shit. Responsible energy utility managers don’t rely on unproven technologies in planning to meet firm loads. Lots of stuff may come down the pipe, but you don’t bet all your marbles on unproven assertions by salesmen.
What is your background, Chuck? I’ve developed and operated hydroelectric, geothermal, coal and natural gas generation systems. Why don’t you tell me how its done? What are your qualifications? Other than having access to a keyboard in your mother’s basement.
Too fracking funny…

In 2050, fossil fuels and nuclear power will still be generating over 2/3’s of our electricity according the the US Energy Information Administration’s Annual Energy Outlook for 2019. Renewables, wind and solar power will be generating less than 1/3 of our electricity and that 1/3 includes hydroelectric and geothermal.
By 2050, “other renewables,” including solar and wind power, will have barely overtaken coal, which will still be around.
https://wattsupwiththat.com/2019/05/03/bill-mckibben-sees-rays-of-hope-in-a-grim-climate-picture/
So, David, the U.S. EIA predicts that solar will be about 15% and wind will be about 7% of our electric energy generation in the year 2050. What is not said is the amount of FF, nuclear and large hydro capacity commitments that will be needed to back up wind and solar’s measly 22% of energy generation. With capacity factors of 15-30%, solar and wind will need massive amounts of power backup. Future advances in battery technology may help some.
How’s that work for your big-picture, uneducated fancy, Chuck?
In a “big picture” that ignores reality, it’s probably copacetic… /Sarc
One of my all-time favorite graphs…
Yes, David. While wind and solar are rapidly screwing up and increasing the costs of our electrical systems, they add practically nothing to our total energy needs.
They don’t totally suck. Wind works pretty well where it works, places like Texas. Solar PV actually sucks more where it works… “The Duck Problem”… Solar peak output ramps down exactly when peak electricity demand ramps up. The more solar in the grid, the steeper the ramp for whatever is backing up solar.
You guys can spout all the BS numbers you want, but the bottom line number is cost per kW/he and solar and wind are crushing it. Go subsidies! Coal is dying and Donnie can’t save him! Wind and solar plus storage is beating all fossil fuels, just ask GE who bet on FFs and is now getting their a** handed to them!
1) Your hilarious previous excuse for presenting LCOE values from Table 1b (not weighted for capacities) rather than Table 1a (capacity-weighted averages) was because Table 1b included “coal”. (By the way, you never answered my previous question about how many gigawatts of coal-fired plants you expect to be installed in the U.S. from 2021-2030, and then from 2031-2040.) What is your excuse this time, since this post does have any numbers for coal?
2) Have you ever heard of the phrase “Garbage in, garbage out?”
3) A “real world” input for an LCOE analysis for 2023 or 2040 would be one for which the average value of the input (such as the capacity factor) has exactly a 50 percent chance of being too high, and a 50 percent chance of being too low. (That would be the *capacity-weighted*, or even more appropriately, *generation-weighted* average, of course.) Do you think these capacity factors represent average capacity-weighted (or more appropriately generation-weighted) capacity factors for 2023 and 2040:
Advanced NGCC, 2023: 87 percent
Advanced NGCC, 2040: 87 percent
On-shore wind, 2023: 41 percent
On-shore wind, 2040: 40 percent
Off-shore wind, 2023: 45 percent
Off-shore wind, 204: 45 percent
???
I posted table 1a in the comments.
Here it is again:
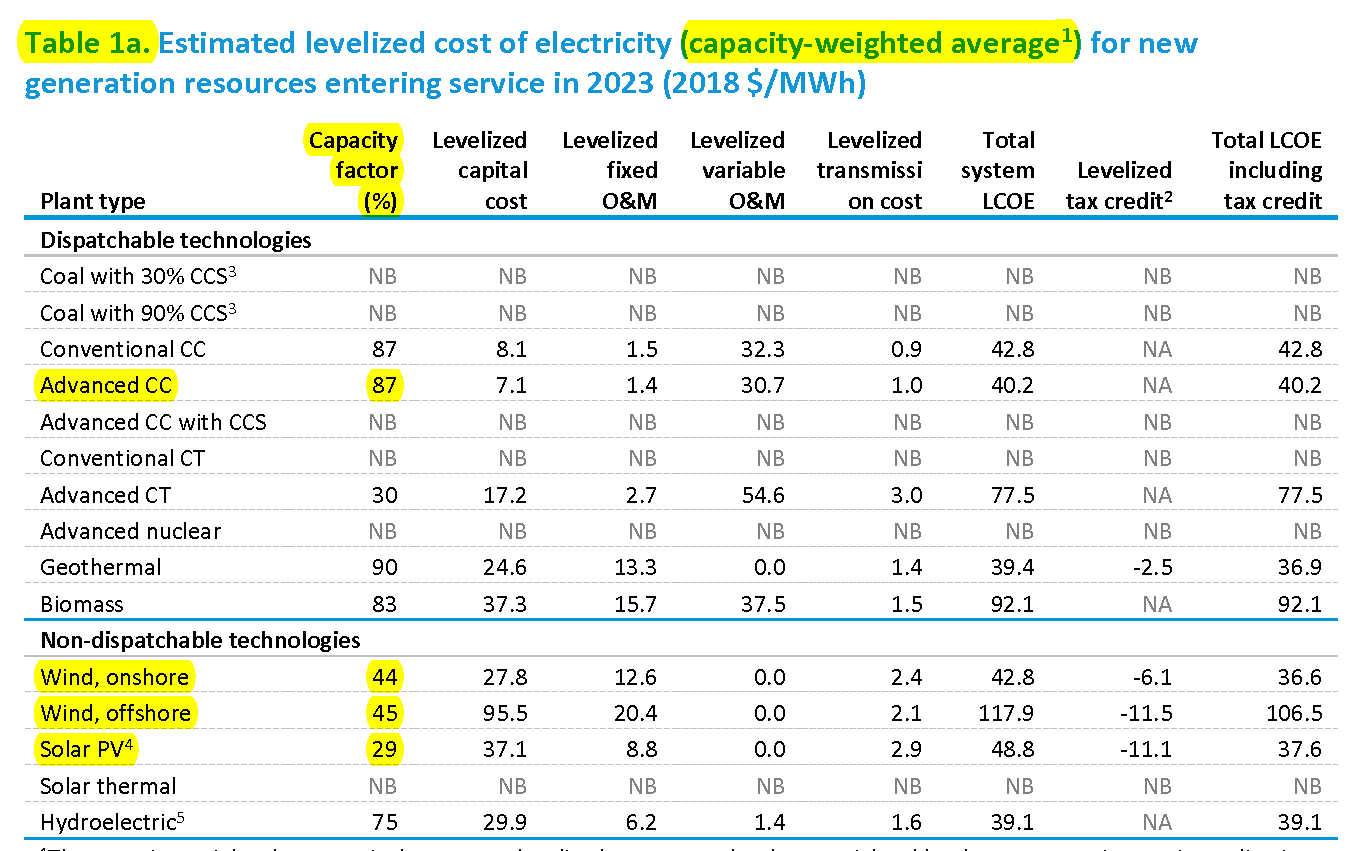
Table 1b is the only table consistent with older LCOE reports.
THe only reason someone justifies coal as an energy source is because they own stock in coal, are employed by coal, have immediate family employed by coal, or are just plain ignorant. The only thing keeping coal alive is Trump’s interference. Had the new regulations which were supposed to be implemented over the next few years, not been weakened strictly for political purposes, then the acceleration of coal plants closing would continue.
The LCOE isn’t the damn 10 Commandments and it’s jsut one source for some information. Bottom line that is undisputable.. More coal plants are closing than being built and plans for future coal plants are being shelved because they see the writing on the wall. Your own tables showed the decline and that will continue.
Coal is dirty, it produces toxic coal ash which contaminates water, it pollutes the air. So anyone still wanting to keep coal going are the stupid ones. All you fans of fossil fuel only want the product but don’t want to deal with the pollution. You’d rather push that cost off to others. If you like coal that much, let’s create a coal ash pit in your backyard and see how quickly you change your mind,
Good fracking grief! EIA was forecasting that coal power plants would still be running in 2050 before President Trump was elected, with or without Obama’s Clean Power Plan. In the USA…
And even more so globally…
Coal keeps going because:
1. The fuel is cheap.
2. Once built, the power plants can operate for nearly 100 years.
3. They are resilient, like nuclear power plants.
Coal will eventually be replaced mostly by natural gas because:
1. Natural gas burns much more cleanly.
2. Natural gas advanced combined cycle power plants are inexpensive.
3. Natural gas can replace coal on a MW-for-MW basis.
Wind and solar will remain “boutique” generating sources well-past 2050, working fairly well in a few geographically favorable locations and monuments to virtue signalling elsewhere.
Just ask Japan how resilient Fukushima was. GE has finished manufacturing a wind turbine which will power 16,000 homes, just one turbine! It’s called the Haliade-X. I don’t know what you call boutique, but a couple hundred turbines in the Atlantic and Pacific will even strongly impact the nat gas biz. FOrget about coal. As more states commit to 100% renewables by 2050, you can bet your sweet a$$ that even nat gas will be on the decline. The future is coming and fossil fuels are not invited.
The only people who want coal are those who make money off of it. Nobody else wants it, not even the coal museum in Kentucky which is powered by solar!!
https://www.foxnews.com/us/kentucky-coal-mining-museum-switches-to-solar-power.
No matter what the charts say, coal is dying, especially in the U.S. and Europe. Even China, while still building coal plants, are building far fewer as they invest heavily in renewable energy Nobody can predict how long, but with rapid advances in solar and wind and energy storage, it will be too expensive to keep operating coal, and even natural gas plants as prices continue to decline.
You guys are so good at your charts, look at the projections for WIND and solar ten years ago compared to actual. Then look at five years compared to actual output. Same with energy storage. YOu will see that the predictions are all way off. New advances in solar are coming out weekly and some of these will be ready for manufacturing wihtin the next year.
You guys will all be driving your ICE pickup trucks as I fly pass you in my electric truck that I charged at home and has a 400 mile range and 5X the towing capacity as your crappy ICE pickup truck
The nuclear reactor was very resilient. It was undamaged by one of the most powerful earthquakes ever recorded and a massive tsunami. The tsunami knocked out external power and flooded the backup diesel generators, leading to the meltdown.
Resilient, as it pertains to power plants, means that it can store at least 60 days worth of fuel onsite.
The Energy Information Administration, Department of Energy, collects data from industry and other government agencies. Power plants aren’t built or retired overnight. The process of permitting and building power plants takes years. The EIA projects future energy consumption and production from real data. They aren’t always right – They totally missed the Shale Revolution – But their numbers are far more solid than the idiots who write headlines or politicians babbling about 100% renewables.
Setting aside the fact that offshore wind costs 3 times as much per MWh and delivers half as much MWh per MW as natural gas… This graph shouldn’t be too difficult to understand…
It is of primary energy consumption in the US, projected to 2050. Primary energy includes transportation, electricity generation, industrial, commercial and residential consumption. The green curve is “other renewables,” primarily wind (both onshore and offshore) and solar, the gray curve is “coal,” the blue curve is “natural gas.” Note that in 2050, “other renewables” will have barely overtaken “coal,” while “petroleum and other liquids” and “natural gas” will each be 3-4 times the Quad Btu as “other renewables.”
Windowing in on electricity generation, wind is not going to be the growth engine of “other renewables.” Wind generation is pretty well flat out to 2050…
EIA projects that solar PV will be the renewable growth engine. In case you need help with the math… If you break renewables down into its components, coal will still be #2 in 2050…
IN case you chose not to read all the headlines and stories from a few weeks ago, but renewables surpassed coal for the first time. NOw coal may take the lead again, but hate to break it to you, it ain’t looking good for the coal industry. YOu’re in love wit hall your fancy numbers, makes you feel important, doesn’t it? Too bad you’re not familiar with the exponential curve, becasue if you were, you’d realize that coal is dead and it’s jsut a matter of time before oil is too. May be twenty years if we’re lucky, may be thirty, but it will happen, no matter what BS numbers you pull out your rear.
There’s a difference between reading headlines and understanding them…
https://www.eia.gov/todayinenergy/detail.php?id=39992
Renewables, including hydro electric climbing into spring when wind and hydro peak and while solar is ramping up from its winter minimum… And demand for coal declines due to… Wait for it…. SPRING.
Almost all of the renewable generation was hydroelectric and wind…

That was April.
EIA Short Term Energy Outlook, July 2019…
https://www.eia.gov/outlooks/steo/report/electricity.php
Please note the statistics are for electric energy production only; there is no distinction made between the ability of the various generation sources to support electric grids. Industrial wind and solar installations require grid support rather than provide grid support. At some point, the addition of industrial wind and solar installations will degrade the reliability of electric systems to the level provided by Third World countries.
Ain’t it cool?
Greentards reflexively reject numbers that are intrinsically skewed in their favor… 😎
I hadn’t thought of it that way, David. They are truly greentards by not seeing the obvious; their own touted statistics will doom them!
If they ever gain sufficient political power, it will doom all of us.
Dave, you must be so proud of your colored charts. It must make you think you are really smart. It’s so sad that you are stuck in the 80s.
You see only wahat you wantto see. You deny the devastataing impact that fossil fuels have. You ignore all the evidence out there showing that CO2 levels are casusing the planet to bake. Just because you’re an engineer doesn’t mean you have any common sense.Or is just that you’re a selfish jerk and don’t give a damn about the future of the planet because you just want to get what’s yours, you want it now, and do not care about anyone else. You and your cronies are heavily invested in fossil fuels and you will do anything to defend it. Companies like Koch Industries, Exxon, Duke, PJM, and others will do everything they can to stop the rise of renewables. As new benchmarks are reached by renewables, people like you will come up with new arguments why it isn’t feasible. It’s a good thing you guys weren’t in positions of power when Kennedy made the Moon Mission a top priority. You would have thought of a million ways why it couldn’t be done.
Instead, everyone came together because it was important and made the impossible possible.
Do your grandchildren a favor…go lock yourself in a room and listen to your 8-track tapes. Renewables are coming. They would already be here if it wasnt for people like you and all the other naysayers on this site who worship fossil fuels because of greed and ideology.
when there are no more beaches to relax on, no more slopes to ski on, no more polar bears in t he wild, it will be because of people like you, TsK Tsk, Dave Fair and others. There’s more to life than pickup trucks, guns, and MAGA hats. It’ll be nice when your generation passes on. Then we can clean up the mess you left behind.
One advantage of being an old fart is perspective. I can sorta remember the foofraw over Silent Spring, and definitely remember Ehrlich and “The Population Bomb” and the computer games of the Club of Rome.
Given that sort of history, your current panicmongering reminds me of all the past failures in doomsday predictions. As you don’t seem to care about the details of what you claim to be the coming Apocalypse, you have the credibility of a late night preacher.
I only see things that are real.
Chuck, there is a new WUWT posting on China’s increasing use of coal.
Since you produce no unbiased facts and resort to personal attacks, this will be my last response to you, Troll.
Correct Dave, the only things you “see” are real, except for the fact that decades of working in the fossil fuel business has distorted your view, and you haven’t “seen” anything other than fossil fuels. Too bad.
When facts, logic and math fail…
It’s not an “ad-hominem” to comment on your perspective. All of your articles, and comments here clearly show anyone that reads them what you perceive as “real.” Your entire career has been working in the fossil fuel industry.
Donald, what does this have to do with David’s posting of government statistics? My career included hydro, geothermal, gas, wind, and coal. What would that information about me suggest to you?
A long time ago, I used to be a moderator in the Armchair General Magazine forum… I moderated the Terrorism and Gulf Wars sections. I also actively participated in the discussions, many of which were nonsensical attacks on Dick Cheney and Halliburton. Needless to say, I shredded their arguments. One dufus BPR’ed (bad post report) one of my posts, complaining that I unfairly arranged the facts in a manner that only supported my position. 😉
As far as I know, the facts have always supported my firm conclusions. 😉
I have very few firm conclusions about any given topic; lack of knowledge or interest. I do, however, firmly believe in individual market freedom as opposed to centralized, socialist economic control. Free stuff is never free and social justice isn’t just.
That’s the text book definition of argumentum ad hominem…
https://rationalwiki.org/wiki/Argumentum_ad_hominem
I’m not attacking you Middleton, I would be attacking you if I said you have a bad odor, or your hands are too small. No, you made the statement, “I only see things that are real” which enables me to comment on how you see things. Having read a lot of your comments and articles, it is plain as day to validly make the claim that your perception of “what is real” is colored by your years of employment in the fossil fuel industries.
So this is not ad-hominem because as you posted all I’m doing is “engaging in an argument or factual refutation of the claim.” Said claim being that you only see things that are real.
That is the fracking definition of argumentum ad hominem…
Argumentum ad hominem attacks the source of an argument, rather than the argument itself. “Attack” is in the sense of argument… Not in the sense of personal insults.
Try to follow along – This will require logic…
Chuck posted…
He provided no supporting evidence for his argument.
I replied…
I certainly can’t see “devastataing [sic] impact that fossil fuels have”… Because there is no “devastating impact.”
I certainly can’t “ignore all the evidence out there showing that CO2 levels are casusing [sic] the planet to bake,” because there is no evidence that the planet is baking.. Less than 1.5 °C per doubling of atmospheric CO2 won’t cause “the planet to bake.” CO2 levels well above 1,000 ppnv didn’t cause “the planet to bake.”
The burden of proof is on the person making an argument.
Then you chime in with…
A textbook “circumstantial argumentum ad hominem“, or “appeal to motive.”
Of course I don’t see the things Chuck imagines because I’m a petroleum geologist… [/SARC]
David, it is at this point in your exchanges that I give up trying to carry on a rational discussions with the “Kliptsteins.” Let them flail about; nobody is listening.
I think of it like batting practice.
An RPG made sure I can’t swing a bat (nor a golf club) all that well. But I, too, have fun with the “Klipsteins” until they ultimately become tedious.
I’ve never even been shot at, and I can’t swing a golf club very well. I had a slice that could literally make my dives land behind the tee-box.
Getting shot at are exciting events; invigorating, even. Getting hit ruins the fun. The wounds aren’t all that bad, though. The VA treats me very well.
My older brother, who passed away last May, was a USMC Sgt and spent 1967 “hiking around” between Da Nang and the DMZ… I could never beat him at golf, chess or Stratego… 😎
Don’t ever compete with Marines; they will do anything to win. I just cheat.
Roger that!
David, I was standing in a long line of Selective Service Inductees in a processing facility in Portland, OR in 1968. A Marine Sgt. walked down the line and selected every 5th man for the Marines. Little did I know that I would have probably been safer had he chosen me. Don’t tell the Marines that.
Middleton says: “here an opponent’s argument is discarded”
.
WRONG Dave, I’m not discarding your argument, I’m engaging it.
.
You opened the door by making the statement, “I only see things that are real.” and now you try to run away when someone engages you, and cry “ad-hominem.”
You haven’t engaged in anything other than argumentum ad hominem so far.
Middleton continues to dig the hole he is in deeper…..
.
1) “I only see things that are real.”
2) “Because there is no “devastating impact.”
.
Exon Valdez isn’t real? DeepWater Horizon isn’t real? Coal ash waste ponds aren’t real?
.
Each of these have had devastating impact, yet you must not “see” them because to you they are not “real.”
.
Thank you very much David, for opening the door to what you consider to be real and what you consider not to be real.
Chuck’s comment…
Exxon Valdez, Deepwater Horizon, etc. are absolutely real. They just don’t constitute “the devastataing impact that fossil fuels have” or “evidence out there showing that CO2 levels are casusing [sic] the planet to bake.”
But… it’s at least an argument, albeit a feeble one. That’s something Chuck never achieved.
See this post for a discussion of Deepwater Horizon…
https://wattsupwiththat.com/2017/10/20/deepwater-horizon-epillog/
So, I clearly saw all of the impacts of Deepwater Horizon.
Regarding Exxon Valdez, what’s the cost:benefit ratio of oil spills to refined petroleum products?
YOu guys are so in love with your colored charts and graphs that you can’t look up to see the trends. Try reading the news once in a while, other than FOX (though Chris and Shep are true journalists). New York is going to target 2040. Doesn’t that tell you anything? California is shooting for 2045 and so is Hawaii. Several other states have made similar announcements and more will follow, except for your coal states and your backward states.
New York just had a major power outage and now they are going to procure 30Mw of battery. PJM is using obscure rules to prevent more battery storage even though it’s been proven to save money. These are things that aren’t on your colored graphs ans charts, but they are facts. Another fact – BMW is losing market share to Tesla. Another fact, which my wrods were twisted in someone else’s reply, that while CHina is still buiildng coal plants, the yare investing massively in renewables.
It’s taking hard fought battles to open up markets to renewables as the entrenched powers are doing their damndest to prevent it from happening becasue it wll mean loss of profits.
Dave, you said your for decentralization yet you demean solar even though what could be more decentralized than soalr on your home?
And the duck curve? So last decade. Now with batteries, that excess energy is increasingly being stored.
You say coal is not declining rapidly, yet it seems we need to define rapidly. That’s subjective.
Dave, you and many others here are biased towards fossil fuels and you use selected graphs and charts that only other engineers would bother reading. What you don’t like, you conveniently ignore. You and your cohorts conveniently ignore what 98% of scientists have to say about climate change. You ignore their data in favor of data that supports your beliefs.
You can google anything I’ve posted here and confirm it so I’m not going to bother looking it up. If you’re smart enough to find these graphs, you’re smart enough to find these news stories, unless you consider them fake news becasue they dont’ gel with your beliefs.
It doesn’t take an engineer to notice all the electric charging stations being built for electric cars. While unfortunately a lot of this will be generated from natural gas or coal in the near future, things are changing in favor of renewable and it doesn’t take a rocket scientist to figure that out.
Surely you understand the concept of tipping points, don’t you? Well your charts can show what they show, even if their biased data, but eventually we will reach a tipping point and all your charts and data projecting future increases in fossil fuels will become as irrelevant as your opinion on climate change. Is this the legacy you wanto leave your grandchildren? DO you want to be like the old closed minded Walt in Gran Torino or the new open-minded ‘Wally’?
https://www.google.com/search?q=starving+polar+bear+picture&tbm=isch&source=iu&ictx=1&fir=LeS1UYBQsjer0M%253A%252C9XlbJkmpReejEM%252C_&vet=1&usg=AI4_-kQnFBEQziNROGFOi668nuuKJ7-l3A&sa=X&ved=2ahUKEwjS0fHblMzjAhWuslkKHfiSArEQ9QEwAnoECAUQDA#imgrc=LeS1UYBQsjer0M:
Chuck, put your dreams of future renewables in one hand and piss in the other. Which fills up first?
[You can see my patience with this twit has run out.]
I haven’t cited anything from Fox News, almost everything I’ve cited is from the Energy Information Administration, the Federal agency actually tasked with this sort of thing.
There’s too much nonsense here to reply to all of it right now…
What I am “for” or against doesn’t matter. Numbers are all that matters.
There are hardly any significant battery storage operations. The significant ones roughly double the LCOE and the Duck Curve gets worse with each MW of solar PV added to the grid. Peak demand occurs early in the evening. Peak solar output occurs at mid-day…
https://en.wikipedia.org/wiki/Duck_curve
The more solar power added to the grid, the worse the problem gets…
https://www.nrel.gov/news/program/2018/10-years-duck-curve.html
Middleton posts “I only see things that are real.”
.
Then he cries “ad-homienem” when someone challenges his assertion.
.
Too funny
The too fracking funny thing is that these comments can be quoted in order.
Donald L. Klipstein, argumentum ad hominem…
David Middleton…
Donald L. Klipstein demonstrates a total ignorance of argumentum ad hominem…
David Middleton…
Donald L. Klipstein continues to demonstrate a total ignorance of argumentum ad hominem…
David Middleton…
Donald L. Klipstein continues to demonstrate a total ignorance of argumentum ad hominem…
David Middleton…
Donald L. Klipstein finally attempts to construct a feeble argument…
David Middleton shoots it down like an F-14 would shoot down a Mitsubishi A6M Type 0…
Donald L. Klipstein resorts to incoherent babble…
Middleton posts: “the worse the problem gets”
.
Yet from the very link from NREL he posts it says:
.
“So fear not: the duck curve doesn’t spell doom for variable renewables. In the U.S., PV deployment is approaching the highest levels of solar studied in the 2008 report by Denholm et al. And thanks to more than 10 years of forward-looking grid integration analyses from NREL, grid planners and operators have access to a wealth of data, analysis, and tools to help get their proverbial ducks in row to manage it. ”
.
Based on this it looks like you need to start seeing things that are “real.”
DOnald, I know you’re more up to date than the others on here. And I know you don’t rely on biased sources (intentional or built in) and colorful charts to get all your information. Here’s something I think you will find fascinating!
https://www.teslarati.com/tesla-sa-battery-response-time-billing-system/
The response time of Tesla’s battery in AU is so fast, 200 milliseconds fast, that they can’t even start measuring the output for billing til six seconds later because it’s designed for fossil fuel energy measurement
It doesn’t “spell doom.” It spells higher utility rates.
And that’s the only thing that matters to poor and middle-class people. The “Klipsteins” worry about the world, not the people on it. Without reliable, inexpensive energy we go back to grubbing out a subsistence living.
Everything is possible to one who doesn’t have to do the work. Mental masturbators.
Why are you so in love with coal? What is this obsession? Even if renewables were somewhat higher, why should I pay for your pollution? Coal and gas do not pay the true cost. Instead they push the cost of pollution onto others. Why should I pay for your pollution? You won’t admit that this is a cost because you dont’ want to pay for it. Instead you just want cheap energy without paying it’s true cost. There’s no question that there’s a cost to pollution. Let’s put a coal ash pit near your house and see if you don’t start saying otherwise. Water pollution and air pollution are visible, tangible costs to everyone else.
Having said all that, I hate to break it to you Dave, but renewable are cheaper than coal now. You can twist it around to say otherwise, but it’s a fact now. Even Middleton’s charts reflect that. I have a 50/50 energy mix of renewables and FFs, doesn’t cost me a penny more. The only people who still want coal are those who have a vested interest in it. Do you really want your grandchildren to breathe dirty air? You want them to develop asthma and have difficulty breathing? You want them to drink water contaminated with heavy metals from coal ash contaminating the groundwater?
Everything is cheaper than coal except offshore wind, in terms of new power plant construction. This post isn’t about coal and I never discussed the LCOE of coal.
“ramp need 13,000 MW in three hours.”
…
Well start up time for a gas turbine peaker is 10-15 minutes, and since the load curve is highly predictable, can you tell us what the “problem” is?
The problem is that the more solar PV you have in the grid, the more gas turbine peaker generation you need and combustion turbines are as expensive as renewables…
Mister I only see things that are real posts a table….
.
1) “Estimated” is not real
2) “Entering service in 2023” is not today, so the numbers are not real
3) Hydroelectric is put in “non-dispatchable” catagory: http://energyeducation.ca/encyclopedia/dispatchable_source_of_electricity (See figure 1)
Estimates based on hard data are real numbers.
Hydroelectric is non-dispatchable.
Hence, EIA classifies hydroelectric as non-dispatchable.
Poor poor Davie…
.
https://thenarwhal.ca/what-s-future-hydroelectric-power-canada/
.
Heck, even wikipedia claims hydro is dispatchable: https://en.wikipedia.org/wiki/Dispatchable_generation
.
LOL @ur momisugly U
Wikipedia vs the US Energy Information Administration Administration… This post is about which?
Hence, EIA classifies hydroelectric as non-dispatchable…. QED
“Hydroelectric is non-dispatchable.”
.
https://www.sandia.gov/ess-ssl/EESAT/2013_papers/Dispatchable_Hydro-Electricity.pdf
Maybe you’ve eaten too many lead paint chips, but this post is not about what Wikipedia, Sandia, or anyone else thinks about hydroelectric power.
This post is about the LCOE of natural gas advanced combined cycle electricity generation compared to wind and solar PV.
Not that it’s relevant to this post, but EIA classifies hydroelectric as non-dispatchable, because it is seasonal. What part of that is too difficult for you to understand?
“but EIA classifies hydroelectric as non-dispatchable,”
.
Wow, and do you know what the EPA classifies CO2 as?
.
Take some time there Dave, and talk to grid operators about “dispatchability” and hydro. Maybe then you will have the opportunity to “see things that are real”
Setting aside the red herring fallacy… This is what the post is about:
Note the total absence of hydroelectric or any discussion about why EIA classifies it as non-dispatcebale in the LCOE reports.
This going to require a little bit of reading comprehension. Here is table 1b from the 2019 Levelized Cost and Levelized Avoided Cost of New Generation Resources report…
Zoomed in on the relevant portion…
The relevant passage…
Another funny thing from Mr. Middleton…..
.
Basing his entire argument on EIA models.
.
On top of that the EIA model is flawed (due to real dispatchability of hydro.)
.
So is Middleton no better than regular climate scientists with their GIGO models?
.
All this from a man that claims he only sees things that are “real.”
Well, Donald, I’ll dip my toe into your steaming mess one more time. As someone who has worked for both the Bonneville Power Administration and Western Area Power Administrations in the areas of hydroelectric planning and dispatch, I tell you the EIA is correct in stating that hydropower is only seasonally dispatchable.
As the new Director of the Division of Planning and Resources at the Sacramento Area Office of the Western Area Power administration beginning in 1979, the real headache was my Division’s job to sort out the mess the ’76-’77 drought caused in contract compliance with the Federal government’s Pacific Gas and Electric power supply contract. The contract specified the minimum firm capacity from the Central Valley Project’s hydroelectric system to be provided to PG&E.
The problem was that the prior modelers of the hydroelectric system didn’t consider the possibility of a drought like that occurring during the ’76-’77 period. When the contract’s minimum capacity levels could not be met and the contract was broken, PG&E began paying only for lesser amounts (which they unilaterally determined). The Federal taxpayers were losing millions annually; out-of-contract sales did not cover interest payments plus O&M.
How does the foregoing comport with your belief that: 1) I am enamored with coal; and 2) You know jack-shit about any aspect of power supply systems. You are trying to lecture to experts; your fantasies about the future are just that.
Please go back to the sandbox in your mother’s basement and quit irritating the adults.
Also, you are a nasty little twit, Donald.
If you had any reading comprehension at all, you would know that I don’t reflexively reject models… I couldn’t do my job if I did.
Since you are so Rainman-obsessed with real things being tangible… This is what is currently in the power plant construction pipeline…
Note that there ares virtually no offshore wind turbines (30 MW) currently in the permitting/construction pipeline. While there are MW 53,916 of natural gas combined cycle, 12,891 MW of natural gas combustion, and 1,187 MW of coal-fired capacity in the pipeline. Two of the three coal-fired generators are listed as under construction. That’s just under 68,000 MW of fossil fuel-fired generation capacity vs just under 42,000 MW of onshore wind (27,531 MW) & solar PV (14,282 MW).
The data can be accessed here: https://www.eia.gov/electricity/data/eia860/
2017 is the most recent year with complete data.
That can’t be! David Middleton, electrical power generation industry expert, insisted in February 2018 that:
https://wattsupwiththat.wordpress.com/2018/02/08/u-s-eia-annual-energy-outlook-2018-now-available/#comment-2742739
This was in the same post wherein he was extolling what a brilliant piece of work the U.S. EIA 2018 Annual Energy Outlook was:
https://wattsupwiththat.wordpress.com/2018/02/08/u-s-eia-annual-energy-outlook-2018-now-available/
Of course, this was the same David Middleton who asserted in February 2017 that “Coal Keeps Chugging Away”. (The caption was: “While coal-fired generation declines from now to 2022, it begins to climb again after 2025, despite plant closures. This is due to an increase in utilization rate from 60-64%.”)
Coal Keeps Chugging Away
Speaking of which, David Middleton, seer of seers with respect to electrical power generation, I’m still waiting for your predictions of:
The amount of utility coal-fired power generation capacity, in gigawatts, that will be added from 2021-2030, and 2031-2040. I’m very interested in that, because you previously said you used Table 1b LCOE values because they included LCOE estimates for newly-built coal-fired power plants.
Now that I think of it, I’d be really interested in another prediction:
In what year do you think that annual coal-fired power generation will go below the bottom of your “Coal Keeps Chugging Away” graph…i.e. in what year do you think annual coal-fired power generation will drop below 1000 thousand GWh? And if you think it will drop below 1000 thousand GWh annually before 2050, do you think it will later recover to the annual 1200 thousand Gwh plateau level in your graph?
https://markbahner.typepad.com/random_thoughts/2018/02/whos-in-fantasy-land.html
Coal-fired power plants aren’t retiring at a “rapid rate.”
https://www.eia.gov/outlooks/steo/report/electricity.php
Rather than lying about what I posted, quote what I posted…
https://wattsupwiththat.com/2017/08/07/coal-plants-keep-closing-on-trumps-watch-and-why-it-doesnt-matter-to-the-resurgence-of-the-american-coal-industry/
The black curve is EIA’s AEO2018 reference case. The yellow/red curve is what could happen with rising natural gas prices and increased utilization of coal-fired power plants. Natural gas prices haven’t risen.
This is the range from AEO2019…

The top curve is EIA’s AEO2018 reference case. The AEO2019 reference case is lower. The AEO2020 reference case will be higher or lower.
Coal keeps chugging along. The level at which it chugs in the forecast, largely depends on the 1) economy and 2) the efficiency of the oil & gas industry.
Oh really? How many gigawatts of coal-fired power plant capacity retired in 2018? What number would be required to represent a “rapid rate.”
In other words, there is no decline in coal-fired electrical generation that falsifies the statement that “coal keeps chugging along” or “coal keeps chugging away”? As long at there’s even 1 MW of coal-fired generation in the U.S., “coal keeps chugging along”?
While we’re at it, how about answering my previous questions:
1) You said you used Table 1b values because they included coal. How many gigawatts of new coal-fired power plants do you expect to come online from 2021-2030? And from 2031-2040?
2) What year do you expect coal-fired power generation in the U.S. to drop below 1000 thousand GWh?
Good fracking grief! This was in English…
The U.S. electricity industry has retired almost 18 gigawatts (GW) of coal-fired generating capacity since the beginning of 2018, with an additional 4 GW planned to retire by the end of this year and 3 GW in 2020. These recent retirements represent 10% of the U.S. coal-fired generating capacity that was operating at the end of 2017.
2018 -18 GW
2019 -4 GW
2020 -3 GW
2018-2010 -25 GW
25 is 10% of… 250.
That only leaves 225 GW of coal-fired generating capacity.
Setting aside the non sequitur, as of today, I expect that there will be little or no additional coal-fired capacity added. There are only 2-3 plants listed as planned and only 1 of those is likely to be built, a small plant in Alaska (IIRC).
I use table 1b because:
1) It tabulates the LCOE of coal.
2) It is consistent with table 1 in earlier LCOE reports.
3) It is the actual average LCOE, not weighted toward geographical regions where wind and solar sort of work.
This was also in English…
AEO2019 Coal-fired generating capacity…

My question was in English, too. What number of gigawatts per year of retirements of coal-fired power plants would be necessary to constitute a “rapid rate” in your mind?
It provides estimates of the LCOE for new coal-fired power plants (with CCS). But you expect essentially no new coal-fired power plants.
The AEOs for 2019, 2018, 2017, and 2016 all had Table 1a. So it was only 2015 and 2014 that had Table 1 (but not either Table 1a or 1b). Don’t you think that the more important years were 2019, 2018, 2017, and 2016…rather than 2015 and 2014?
Don’t you think it would have been appropriate mention in your original post that you were using all Table 1b values, in preference to Table 1a values? And don’t you think it would have been appropriate to explain that much more wind and solar capacity are installed in areas of the country where they are appropriate, but you think that disguising that fact is appropriate?
My question was in English. It was a simple question. I asked you what year *you* think coal-fired power generation will go below 1000 thousand GWh?
I answered those questions… you just didn’t like the answers.
No, you didn’t answer the questions.
1) I asked you what number of gigawatts per year of coal retirements would constitute a “rapid rate. You did not provide a number.
2) I asked you what year *you* expected coal-fired power generation to drop below the 1000 thousand GWh bottom of your “Coal Keeps Chugging Away” curve. You did not provide a year.
Just like you never answered whether you think the generation-weighted average actual capacity factors of these types of facilities installed in 2023 have 50 percent chance of being higher and a 50 percent chance of being lower than these values:
Advanced NGCC, 2023: 87 percent
Advanced NGCC, 2040: 87 percent
On-shore wind, 2023: 41 percent
On-shore wind, 2040: 40 percent
Off-shore wind, 2023: 45 percent
Off-shore wind, 204: 45 percent
And just like you never answered my question about what you thought would happen to coal-fired power plants in Texas in the coming decades.
Yes, I answered all of those questions. I haven’t made any predictions or forecasts about these things. I cited the EIA forecasts and modeled what could transpire if certain conditions are altered.
I don’t recall seeing any idiotic questions about coal-fired power plants in Texas. I don’t read all of the comments ro all of my posts. My answer would be to direct you to EIA’s schedule of power plant retirements.
What a blatant lie! Or do you not even remember David Middleton of only two days ago?:
Further, what did you mean by “boutique”? What percentage of overall U.S. electrical energy generation in 2050 do you think will be provided by solar (including utility, commercial, and residential solar electrical energy generation)? And what percentage of U.S. electrical energy generation do you think will be provided by wind (in all forms, including onshore and offshore)?
This isn’t a “prediction”…
It’s a description of the EIA’s forecast. If the EIA’s forecast changes, my description of it might change.
Boutique…
Read more: http://www.businessdictionary.com/definition/boutique.html
David, Trolls attack the messenger, not the irrefutable message.
The best definition of Troll I have ever seen is “a time thief.”
But… Clubbing Trolls over the head can be fun… kind of like batting practice.
Let me know if my hydro discussion hit the “Klipstein” out of the ballpark.
David Middleton and Dave Fair,
Both you guys think you’re pretty hot stuff. I think you’re ignorant blowhards. Fortunately, there’s a way to figure out who is right and who is wrong.
Here’s a table I filled out with EIA values for 2017 and EIA Reference Case predictions for 2030 and 2050. I put my own predictions in for 2030 and 2050, and left blanks for y’all to fill in your predictions.
Let’s see who knows what they’re talking about
My guess is that neither of you will even provide any predictions…just like when I challenged MarkW, Kaiser Derden, et al. And why do I think that? Because I think both of you know you’re ignorant blowhards. You’re just not honest enough to admit it.
Does the LCOE for solar and wind include the cost of building and maintaining backup generation to bridge the huge amounts of time they don’t operate? If it does not then it seriously underestimates the true levelized cost of “renewables”.
Backup and storage are not included in LCOE.
regarding the EIA data on remewables…
A recent peer-reviewed study led by the co-author of this column reviewed 630 projections made by the EIA between 2004 and 2014 that could be checked against actual data. The study found that most of EIA’s projections for renewables sharply under-projected generation or capacity, with especially pronounced under-projections of wind and solar in more recent years.
Looking the wrong way: Bias, renewable electricity, and energy modelling in the United States:
https://www.sciencedirect.com/science/article/abs/pii/S0360544215015133
It’s an abstract of a paywalled paper. EIA has an actual interface for this. I’ll download the actual data tomorrow, right now my connection is too slow. However, I have previously downloaded the EIA’s misses on oil & gas…
AEO crude oil production forecasts vs actual crude oil production…

AEO natural gas production forecasts vs actual production…

Selected AEO forecasts vs actual oil production. Note that the shale “revolution” was not even in the range of technological possibilities as recently as 2008. The 1998 forecast assumed that the US was past “Peak Oil.”


Selected AEO forecasts vs actual natural gas production. Note that the shale “revolution” was not even in the range of technological possibilities as recently as 2008. The 1998 forecast assumed steadily rising natural gas prices and failed to predict the collapse in natural gas prices triggered by the shale “revolution.”
EIA didn’t see the Shale Revolution before it bit them in the @ur momisugly$$. These forecasts only work from conditions that are known at the time they are generated. However, the EIA bases the forecasts on hard data, not headlines.
Why are you showing information on oil? I didn’t say anything about oil. I was specifically referring to renewables.
This was in English…
Oil & gas are examples of AEO’s missing by wide margins. I’ll download the renewables data tomorrow and see if the abstract you cited has any merit. We’ll see if the renewables misses are even in the same ballpark.
I’m shutting down for the evening… mañana.
Ain’t that tautologic – a wild-@ur momisugly$$ed guess.
Just asking.
Johann, how’s this for stupid?
https://interestingengineering.com/tesla-battery-installed-in-south-australia-saved-the-region-40-million-in-its-first-year
I just chose one because it’s all over the news. But of course that cant be true. Batteries don’t work. Batteries, which like solar require very little maintenance once built, especially compared to fossil fuel pants which are much more labor intensive. And this ins’t a one-off. This is happening all around the world now
Any questions?
Why is it that hard / to impossible / to fix stupid.
My high school football coach put it this way, “Dumb people don’t know any better and say or do stupid things. Stupid people know better, but do and say stupid things anyway.” You can fix dumb, but you can’t fix stupid.
Let’s face it…EIA data is a gauge and can’t be used solely for predictions about much. Things are changing rapidly as more states declare a 100% fossil free future. And no one of us here, amateurs or experts can predict if and when they will hit it. The only reason you would NOT want to see it happen is if you are invested in fossil fuels, either through stock, occupation or years working in the industry. In which case you are going to defend fossil fuels liek the beaches of Normandy and throw up charts like grenades, ignoring the massive wave of renewable ‘soldiers’ that keep arriving on the shore. Wave after wave, they keep coming, project after project, more each time, wearing down your defenses. You” do your best to keep them offshore, and the higher ups will try and support you with bad policies, but it will only hold up for so long. renewables plus batteries are going to take over. The coal regions of the U.S. will resist, but even there, people will start demanding more renewables as rates fall below the cost of even natural gas, but especially coal.
Before long you’ll be hiding in your fossil fuel cave as the rest of the country leaves you behind. You’ll have places like Russia and Iran which are economically dependent on oil for their survival so it won’t go away completely.
My hope is that someday you will wake up and see all the damage fossil fuels are causing and stop being so damn ignorant, intentionally or unintentionally. Because if we can put a man on the moon using technology less powerful than the original iphone, then surely we can transition to a carbon free economy while not causing major economic and employment disruption. Becasue surely if you are as skilled as you profess to be, then a job in renewables will be easy to come by. there’s plenty out there, just ask Tesla, 8minute Solar, Sunrun they’re hiring like crazy!
And lastly , stop using EIA figures for renewable, they’re too foo base. Want accurate info? use Wood Mackenzie data, its much more accurate. And lets not forget how dispatchable storage is changing things as much as renewables, even though you want that to go away like a bad dream. SOrry, the solar + storage revolution is just getting started.
… Conflict with Chuck’s understanding of the headlines.
Dave,
so your readers know what your conflict of interest is exactly with the fossil fuel industry, can you please share with us how much stock or how many shares you owe in fossil fuel or fossil fuel related businesses, how many years you worked for the fossil fuel or fossil fuel related industry (distribution, infrastructure, third party relations, etc. with etc. being something I may have missed, if you receive a pension from said industry, and if you are still employed by fossil fuel industry or related insustry/company that profits from the sale of fossil fuels?
Now something tells me you will split hairs and get like your definition of ‘rapidly’, you may not be fully forthcoming, but let’s just hold that thought for now and await your reply. Even if you have mentioned it before , for new readers who may not know…
*My* readers here on WUWT are fairly familiar with my background; I’ve discussed it extensively in posts and comments and I think I even mentioned it at least once in the comments section of this post. Apart from me and Dave Fair, I don’t think *you* have any readers and it appears that Dave has lost interest.
This may come as a total shock to you… But my background has even less relevance to the EIA data than the headlines you fail to comprehend.
This may also come as a shock to you… But there are no conflict of interest issues in writing articles for a blog such as this.
This will come as an even bigger shock to you… But there is no such thing as a “fossil fuel industry.” There’s an Oil & Gas industry and there’s a Coal industry. I’ve been a geologist/geophysicist in the oil & gas industry since 1981. My only financial interest in the coal industry is that I like to pay less than $0.12/kWh for electricity and I prefer to be able to turn the lights on when I want to, not just when the wind is blowing and/or the Sun is shining.
And none of this is relevant to the EIA data that anyone, reasonably skilled in Excel, can download and analyze.
This is what was currently under construction or in the permitting process at year-end 2017…
Note that there were virtually no offshore wind turbines (30 MW) currently in the permitting/construction pipeline and battery installations were laughable. While there were MW 53,916 of natural gas combined cycle, 12,891 MW of natural gas combustion, and 1,187 MW of coal-fired capacity in the pipeline. Two of the three coal-fired generators were even listed as under construction. That’s just under 68,000 MW of fossil fuel-fired generation capacity vs just under 42,000 MW of onshore wind (27,531 MW) & solar PV (14,282 MW). Since it takes 2-4 MW of wind or solar to offset 1 MW of natural gas, coal or nuclear, it’s even more lopsided than it appears. 2017 is the most recent year with complete data.
The data can be accessed here: https://www.eia.gov/electricity/data/eia860/
Or you can just keep babbling like an idiot.
https://www.cnn.com/2019/07/25/business/pseg-fossil-fuels-renewable-energy/index.html
Another One Bites The Dust. And another one gone…
Keep believing in fossil fuels Dave, someone has to be around to lock the gate after everyone has gone.
PSGE is being forced to announce these “goals” by idiotic political regulators. If they don’t invest in the article’s “dirt cheap” natural gas generation, they will hear from their customers. Wife, where did you put my Yellow Vest?
The utilities announcing net-zero by 2050 are assuming other utilities will support their green schemes, relying on vastly improved battery technology, hoping the Feds will bail them out or are just blowing wind such that the “Wortmans” of the world will have some green porn to drool over. Thirty-plus year “plans” are fantasy; they bit German taxpayers and ratepayers in the ass.
The “Wortmans” fail to understand that state-regulated utilities will do anything the politicians tell them because they are guaranteed a return on any of their investments, including stupid investments. And power purchase contracts are a direct pass-through to ratepayers; the utilities don’t care how expensive the government-mandated green schemes are. Utility propaganda is meant for their masters; no educated person believes the hype.
This will be the subject of a new post tomorrow morning!
I await it with bated breath.
Yes! I can’t wait for more color coded charts and engineering gibberish from the Cliff Clavin of climate denial!
Scientific fact and government data is “gibberish” to the “Wortmans.” Their shamans tell them so.
And you are still a dirty little twit.
Better than being an old decaying, cement brained moron who despite years in the business can’t tell his ass from a hole in the ground, and needs color coded charts to get by in life.
If it was up to people like you we would all be driving a 1980 Mercury Grand Marquis and using incandescent light bulbs. Wait…you still do don’t you? You must live that 70s Show, makes you think of the good old days of lead in the gas, lead in the paint, asbestos in the building, cars that got 10 mpg, where you could pollute and get away with it and not have to deal with these pesky government tegulations
Why am I not surprised you opted to continue babbling like an idiot?
It must suck to live in New Jersey… But not as bad as New England or California. Residential customers in States that still have plenty of coal-fired capacity running and/or “dirt-cheap natural gas” only pay about $0.10 to $0.12/kWh.
Did you even read this CNN piece of schist?
PSEG sold “its stake in a pair of coal plants in western Pennsylvania”… Did they sell it a greentard who will tear them down? Or to a more sensible utility company that will continue to operate them?
And this is priceless… They swear off fossil fuels right after…
So… we have one (1) coal-fired power pant somewhere in Connecticut being shut down over the next 18 months and a whole lot of green blather from CNN. And this is an old story. The colsure of this power plant was announced in 2016.
https://www.courant.com/community/bridgeport/hc-last-ct-coal-plant-20160211-story.html
And it’s being replaced by a natural gas-fired power plant… This is fracking hilarious.
Since, as an energy industry insider, I have an unfair advantage and know how to look things up in the EIA database, let’s see if we can relate this one (1) coal-fired power plant somewhere in Connecticut to the overall coal-fired generating capacity in the US.
Bridgeport Harbor Station is a 418.6 MW power plant. https://www.eia.gov/state/?sid=CT
It’s being replaced by a 485 MW power plant.
Hey Chuck… What’s 485 minus 418.6? It’s net 66.4 MW gain in fossil fuel generating capacity. How big is 418.6 MW compared to the overall coal-fired generating capacity in the US?
It’s approximately 225 GW… That’s 225,000 MW. 418.6 is 0.19% of 225,000. Dean Wormer would describe this as…
https://www.youtube.com/watch?v=2V3CfD8TPac
This CNN article might be worthy of a post on its own lack of merit!
DeNial isn’t just a river in Egypt. And guess what else? U S. Cars WILL be getting 50 mpg courtesy of California and Trump can’t do sh!t about it because all the major car companies are on board with it! Even less fossil fuels in the future!
“You don’t tug on Superman’s cape, you don’t spit in the wind, you don’t pull the mask off that old Lone Ranger and you don’t mess around with Trump. Yeah”