Observational data of equatorial circulation pattern confirms that the pattern is weakening, a development with important consequences for future rainfall in the subtropics
Columbia University School of Engineering and Applied Science
News Release 24-Jun-2019

New York, NY–June 24, 2019–For decades, scientists studying a key climate phenomenon have been grappling with contradictory data that have threated to undermine confidence in the reliability of climate models overall. A new study, published today in Nature Geoscience, settles that debate with regard to the tropical atmospheric circulation.
The Hadley circulation, or Hadley cell–a worldwide tropical atmospheric circulation pattern that occurs due to uneven solar heating at different latitudes surrounding the equator–causes air around the equator to rise to about 10-15 kilometers, flow poleward (toward the North Pole above the equator, the South Pole below the equator), descend in the subtropics, and then flow back to the equator along the Earth’s surface. This circulation is widely studied by climate scientists because it controls precipitation in the subtropics and also creates a region called the intertropical convergence zone, producing a band of major, highly-precipitative storms.
The study, headed by Rei Chemke, a Columbia Engineering postdoctoral research fellow, together with climate scientist Lorenzo Polvani, addresses a major discrepancy between climate models and reanalyses regarding potential strengthening or weakening of the Hadley circulation in the Northern Hemisphere as a consequence of anthropogenic emissions.
Historically, climate models have shown a progressive weakening of the Hadley cell in the Northern Hemisphere. Over the past four decades reanalyses, which combine models with observational and satellite data, have shown just the opposite–a strengthening of the Hadley circulation in the Northern Hemisphere. Reanalyses provide the best approximation for the state of the atmosphere for scientists and are widely used to ensure that model simulations are functioning properly.
The difference in trends between models and reanalyses poses a problem that goes far beyond whether the Hadley cell is going to weaken or strengthen; the inconsistency itself is a major concern for scientists. Reanalyses are used to validate the reliability of climate models–if the two disagree, that means that either the models or reanalyses are flawed.
Lead author Chemke, a NOAA Climate and Global Change postdoctoral fellow, explains the danger of this situation, “It’s a big problem if the models are wrong because we use them to project our climate and send our results to the IPCC (Intergovernmental Panel on Climate Change) and policy makers and so on.”
To find the cause of this discrepancy, the scientists looked closely at the various processes that affect circulation, determining that latent heating is the cause of the inconsistency. To understand which data was correct–the models or the reanalyses–they had to compare the systems using a purely observational metric, untainted by any model or simulation. In this case, precipitation served as an observational proxy for latent heating since it is equal to the net latent heating in the atmospheric column. This observational data revealed that the artifact, or flaw, is in the reanalyses–confirming that the model projections for the future climate are, in fact, correct.
The paper’s findings support previous conclusions drawn from a variety of models–the Hadley circulation is weakening. That’s critical to understand, says Polvani, a professor of applied physics and applied mathematics and of earth and environmental sciences who studies the climate system at the Lamont-Doherty Earth Observatory. “One of the largest climatic signals associated with global warming is the drying of the subtropics, a region that already receives little rainfall,” he explained. “The Hadley cell is an important control on subtropical precipitation. Hence, any changes in the strength of the Hadley cell will result in a change in precipitation in that region. This is why it is important to determine if, as a consequence of anthropogenic emission, the Hadley cell will speed up or slow down in the coming decades.”
But these findings resonate far beyond the study in question. Resolving contradictory results in scientific research is critical to maintaining accuracy and integrity in the scientific community. Because of this new study, scientists now have added confidence that models are reliable tools for climate predictions.
###
About the Study
The study is titled “Opposite Tropical Circulation Trends in Climate Models and in Reanalyses.”
Authors are: Rei Chemke (Department of Applied Physics and Applied Mathematics, Columbia Engineering) and Lorenzo M. Polvani (Department of Applied Physics ad Applied Mathematics, Columbia Engineering; Department of Earth and Environmental Science, and Lamont-Doherty Earth Observatory, Columbia University).
The study was supported by the NOAA Climate and Global Change Postdoctoral Fellowship Program, administered by UCAR’s Cooperative Programs for the Advancement of Earth System Science (CPAESS). Lorenzo Polvani is grateful for the continued support of the U.S. Nat. Sci. Foundation.
The authors declare that they have no competing financial interests.
LINKS:
Paper: https://www.nature.com/articles/s41561-019-0383-x
DOI: 10.1038/s41561-019-0383-x
https://www.nature.com/ngeo/
http://engineering.columbia.edu/
https://reichemke.wixsite.com/reichemke
https://engineering.columbia.edu/faculty/lorenzo-polvani
https://apam.columbia.edu/
https://www.ldeo.columbia.edu/
Columbia Engineering
Columbia Engineering, based in New York City, is one of the top engineering schools in the U.S. and one of the oldest in the nation. Also known as The Fu Foundation School of Engineering and Applied Science, the School expands knowledge and advances technology through the pioneering research of its more than 220 faculty, while educating undergraduate and graduate students in a collaborative environment to become leaders informed by a firm foundation in engineering. The School’s faculty are at the center of the University’s cross-disciplinary research, contributing to the Data Science Institute, Earth Institute, Zuckerman Mind Brain Behavior Institute, Precision Medicine Initiative, and the Columbia Nano Initiative. Guided by its strategic vision, “Columbia Engineering for Humanity,” the School aims to translate ideas into innovations that foster a sustainable, healthy, secure, connected, and creative humanity.
The speed of the Hadley, Ferrel and Polar cells is the variable that works to eliminate any thermal effect from radiative imbalances.
If the world warms they speed up in order to eject energy faster to space and if it cools they slow down in order to eject energy to space more slowly.
The water cycle improves the efficiency of energy transmission within the circulation so that the system need not run as fast as it otherwise would need to in order to maintain hydrostatic equilibrium.
Therefore the models are wrong and the reanalyses are correct but they are using the effect of the hydrological cycle to argue the opposite.
Anyway, is it not the case that the Sahara in the supposedly drying sub tropics actually became wetter and greener around the fringes during the recent warming spell?
“hydrostatic equilibrium.
Therefore the models are wrong and the reanalyses are correct ”
err no. Reanalysis is ALSO A FRICKING MODEL
The reanalysis model is incorrect since it doesnt agree with the observations.
The error in reanalysis is down to Q-latent .
reanalysis modellers have some work to do
The reanalyses include observations that cause the outcome to be opposite to that of the pure models.
Steven you have no idea what you are talking about.
in fact Some Reanalysis models are USED as GCMS.
Did you mean Stephen?
Coming from a charlatan like you that’s a real compliment. What has your “research” produced other than money for yourself and rationalization your continued employment?
Stephen has the intellectual honesty to not make claims on the weather 100 years from now, while you and your kind seek to profit off the thinnest of conjectures without ever being held to account.
When was the last time you made a statement that was enlightening rather than pathetic intellectual trolling?
“Ray A June 25, 2019 at 4:25 am
Did you mean Stephen?”
Freudian slip !!!
Don’t be so hard on yourself!
“Steven you have no idea “
Yes, it has been noted many times that Steven has no idea what he is talking about.
Sigmund would be proud, Steven. 😉
So reanalysis models are wrong, and reanalysis modelers have work to do…but GCMs using reanalysis models are right lol.
Give Steven a break. He’s only trying to do his job as a professional climate science communicator.
@fred250 June 25, 2019 at 6:02 am
High Five, Baby.
That one is going to leave a mark.
I gotta say, the amount of vitriol that you guys heap on Mosher astounds me. Here, he has made two defensible and interesting points:
1. The fact that the reanalysis models are wrong does NOT mean the climate models are right, and
2. Reanalysis models are merely climate models that are regularly nudged back onto the “right” path.
Instead of dealing with those interesting issues, you guys have done nothing but befoul your own selves with your asinine, personal, inane, third-grade level comments.
If you want to discuss the science, please do so.
If you don’t want to discuss the science, please do so elsewhere.
Sheesh …
w.
Hindcasting reanalysis models are constrained by actual recorded precipitation from ground sites.
Climate models that do historical tuning can’t agree with reanalyses. So which one is wrong Stephen?
Those “lying” station historical rainfall measuremnts or the climate models?
“Hindcasting reanalysis models are constrained by actual recorded precipitation from ground sites.
Actually not, otherwise they would have matched the observed data they used.
also ground sites? did you read the paper?
As for rain accuracy in reananlysis
see the taylor diagrams here
https://climatedataguide.ucar.edu/climate-data/atmospheric-reanalysis-overview-comparison-tables
Also, see the following paper
https://ams.confex.com/ams/pdfpapers/118494.pdf
It uses the same observational dataset to evaluate the Reanalysis.
See this
https://journals.ametsoc.org/doi/full/10.1175/JAMC-D-12-049.1
uses the same observatinal dataset to evaluate reanalysis.
I’m betting you never read any reanalysis or user guide
from UCAR: “Reanalyses are created via an unchanging (“frozen”) data assimilation scheme and model(s) which ingest all available observations every 6-12 hours over the period being analyzed.”
What I said.
So the conclusion, we both can agree on is: there are a thousand different way to be wrong with models.
Both climate models and reanalysis models are grossly wrong in different ways.
To force one wrong model to conform to another wrong model…. well I guess that is what passes as science for climate studies today. Junk science… all the way down.
Another reason to defund the entire pseudo-science of today’s climate studies.
And the Taylor Diagram is just a comparison of one reanalysis with other reanalyses.
“To force one wrong model to conform to another wrong model…. ”
A bit like Generally Accepted Accounting Practices then?
Old joke:
Job Interviewer : “What’s 2+2?”
Successful applicant for accounting job: “What sort of answer did you have in mind?”
Yes it is a model, but it is the 0hr timestep of a weather model which is the initialisation input data for a particular weather model run and is made from assimilating multiple global observations which is then interpolated to grid points. This is as close to observations a model can get hence why they use it for reanalysis.
“Yes it is a model, but it is the 0hr timestep of a weather model which is the initialisation input data for a particular weather model run and is made from assimilating multiple global observations which is then interpolated to grid points. This is as close to observations a model can get hence why they use it for reanalysis.”
Err no.
SOME variables are assimilated, typically those that you have hourly or sub hourly data for.
then a PHYSICS model is run. The physics models in some cases (ECMWF) are cheap and dirty versions of GCMS — because they have to run real time
Precipitation is one vriable that is particularly hard to get right.
you can see the studies posted below where they evaluate reanalysis using observational datasets.
This is pretty simple.
you have physics models used for weather that are low fidelity versions of GCMS.
you have GCMS.
The GCMS do a better job of matching the observations than their simplified brothers– weather models.
skeptics lose.
final nail in the coffin
The GCMS are a load of wide-ranging nonsense… they are useless for nothing except propaganda.
So many of them saying so many different thing, yet NONE are anywhere near correct.
The averaging of many WRONG models does not by some fantasy create a correct result.
You have nothing except more nails for your own alarmist walking-dead coffin.
You’re a scientist? You write with the intent of a 5th grade girl who’s mother won’t let her wear makeup. “Err no.” Condescension much?! The absolute infallibility of your tone and unwillingness to debate anything brought up by other posters is wildly non-academic. If you’d prefer to hash it out with the other kids on the playground, try YouTube comments. Making statements like “skeptics lose” and “final nail in the coffin” proves to us you’re highly unworthy of intellectual discourse. Typical armchair climate expert behavior imo
Err yes …..this is basically what I said. It’s as close to obs as a global model can get because it includes recent observations.
“Err no.
SOME variables are assimilated, typically those that you have hourly or sub hourly data for.
then a PHYSICS model is run. “
I too wonder how “averaging models” is at all scientific. If the goal is to more accurately model a process, averaging a lot of incorrect models is the exact opposite of making your model more accurate – that is to say a better model. Each model will have its own flaws and wrong guesses, so averaging them is a ridiculous notion. It is as if you are averaging people’s opinions to find a more middle-of-the-stream opinion- models are not people and the climate is not an opinion (well, it shouldn’t be).
Also, if you admit that Precipitation is one of the things that models get wrong, and as everyone knows Precipitation = heat transfer, then you are admitting that models get heat transfer wrong. On this we agree.
This is priceless. The person who defers to consensus, who yells at people for cherry-picking a few studies that contradict the bulk of work, etc., is now throwing supppsed decades of grappling with contradictory data out the window with this one.
Robert of Texas
If the runs of a particular model vary because of statistical randomness (or chaotic behavior), then averaging the results can provide a description of the model behavior with a mean and standard deviation. But, it says nothing about the accuracy. There can be, and usually is, a systematic bias.
Similarly, averaging the runs of many different models can provide the mean and standard deviation of that set of models. But, again, it provides no information about the accuracy.
One has to compare the output of the model(s) s with either real-world data, or a secondary standard that has been verified against reality. Only the Russian GCM seems to come close to historical data. Therefore, the act of averaging ALL models and their runs adds the biases of the models with little skill in forecasting. That is to say, the average become LESS accurate than the ones that are closest to reality! The more models that are wrong, the farther the mean drifts from the correct value. Logically, there can only be one best model. If the biases were both positive and negative, then one could expect some cancelling. However, the evidence I have seen points to all the models running warm. Therefore, there is no cancelling. Further, with more models, it appears that the standard deviation (uncertainty) increases, providing less confidence in the predictions.
“…The GCMS do a better job of matching the observations than their simplified brothers– weather models…”
Do you need the difference between climate and weather spelled-out for you?
Simplified? Lol.
I agree when you say, “The reanalysis model is incorrect since it doesnt agree with the observations.” However by the same logic, the climate models are also wrong, because they predict 3 times more heating than the observations.
Reanalyses have included observations. They are not just models.
correct in my estimation. The hydrologic cycle is water vapor creation and convection (convective transport of latent heat to the higher tropopause) by another name. What goes up, must comes down.
The models notoriously are tuned for water vapor and its (water)physics to show whatever the modellers need (bias) due to poorly constrained parameters. To think these folks solved those fundamental problems of both grid size and water vapor physics without bias in one paper is laughable.
They no longer model Mother Nature. Now they model a reanalysis. What is it good for, and how much does it cost?
Indeed, and during the last cooling period from 1950 to 1979, the Sahara desert gained on the subtropical region and this phenomenon reversed during the last warming period from 1979 until now.
On a larger time scale, here is an insight on the Sahara climate evolution during the Holocene related to a progressive cooling from the Holocene optimum 8000 years ago to now :
https://www.youtube.com/watch?v=JcsSHPjdsOo&t=40s
So, observations and science are in total contradiction with the ridiculous claims made by the usual climate clowns and prove one’s again that their models are a total failure.
Should the climate, as expected by Climate-Realists, change to colder conditions,we will see a drying Sahel-Zone again!
Good observation, Petit_Bard!
If the models don’t reflect physical reality, the models have no predictive value and are useless.
Until the models are honestly calibrated and certified as demonstrating predictive value, they remain useless. The activists that claim climate models have predictive value are deliberately dishonest.
Thankyou
Furthermore, the speed of the cells would have increased during the warming spell up to around 2000 but would have decreased during the subsequent cessation of warming yet they try to describe the entire period as if it were homogeneous.
That paper has so many flaws… it is laughable.
Just another sad, desperate attempt (by Columbia U communists) ahead of IPCC AR6 to force the data to meet theory.
The UN IPCC climate models do not get the past nor the present right. But now we are assured that they get the future right.
Anyway, the effect on Hadley circulation is based on temperature and evaporation, not CO2 concentrations. Any circulation changes would arguably just reflect the minor warming from the Little Ice Age. This is just my speculation.
“But now we are assured that they get the future right.”
No. The paper says they have been getting the last 40 years right, in one aspect at least.
Bingo
Yes but I think that should have been part of the physics they programmed in. We don’t know. The models should be a whole lot more transparent.
The fact that they got something obvious correct in no way validates the model as a whole.
Nick, to me that’s the equivalent of my saying I give my dog all the nutritional supplements, but fail to feed him.
Nick. I really find it difficult to be convinced that the reanalysis is particularly demonstrative of anything. Figure 1(c) and 1(d) in particular are hardly definitive proof of very much at all
So the models are correct! Would these be the models that said the Maldives would be submerged by 2018, the models that said the Arctic would be ice-free by 2013, or the models that said the Himalayan glaciers will be gone by 2009?
The models said none of those things.
Oh, so they just lied^H^H told some Frankfurt’er BS?
Well, that would be news /sarc
https://dailycaller.com/2018/09/21/maldives-global-warming-sea-level/
Nowhere there is a GCM result cited.
The Daily Caller link goes a review article which cites several papers. Here’s a paragraph from one of those papers:
:Future climate modeling
The availability of multimember ensembles of present-day and warming scenario simulations from 41 GCMs (table S3) in CMIP5 (35) provides a unique opportunity to examine the ability of global models to accurately represent climate, both in terms of future predictions and the observed long-term trends in the tropical Pacific and Indian Ocean regions over recent decades. Historical simulations (1971–2005) were used to assess the models’ ability to realistically simulate the annual mean precipitation, winds, sea surface temperatures (SSTs), and their annual cycles. On the basis of a suite of metrics, five models that demonstrated high skills (“best”) in representing the present-day climatology and variability (table S3) were selected from the larger pool of 41 GCMs for detailed analyses. Then, for the five best GCMs, their skill in capturing interannual variations in seasonal rainfall during rainy seasons was examined. Finally, mean annual changes in rainfall, SST, and winds from the five best GCMs were used for future projections. Although CMIP5 global models do not adequately simulate the intensity of fully developed tropical cyclones (TCs), the genesis and the early life of TCs, in these models over the west Pacific were evaluated, and the statistical properties of these storms around Kwajalein were quantified. The TRACK program (37), a mathematically and physically developed objective procedure, was applied on the model output to diagnose tropical storms over the west Pacific region. TRACK objectively identifies TCs through analysis of the time series of meteorological fields.”
That paper references 41 GCM models from the CMIP5 group of models, picks 5 of the best and does further analysis.
Err, no. All over there, lots of GCM models are cited.
Nick Stokes – “Nowhere there is a GCM result cited” – What sort of idiots do you take us for? When they say “30 Years Ago Officials Predicted The Maldives Would Be Swallowed By The Sea”, of course they were referring to climate model predictions. What magical place other than a climate model (or models) could that prediction have come from?
“What magical place other than a climate model (or models) could that prediction have come from?”
Well, they actually say:
“In September 1988, the Agence France-Presse (AFP) reported a “gradual rise in average sea level is threatening to completely cover this Indian Ocean nation of 1196 small islands within the next 30 years,” based on predictions made by government officials.”
From what magical place do you think they got GCM results in 1988? That was a few months after Hansen’s famous talk to Congress. His atmospheric GCM was about the only one going at the time. And it wasn’t until years later that they even managed to couple an actual liquid ocean at all.
“I wonder why?”
The usual reason – just nothing to respond to. No quotes, no indication of what is supposed to be an invocation of a GCM. All that is in fact said about GCMs is Maslowski saying
“My claim is that the global climate models underestimate the amount of heat delivered to the sea ice by oceanic advection”
Maslowski and Wadhams have models. But they aren’t GCM’s. They are specific models of ice formation and melting. And most people think they are wrong. They think most people are wrong too:
“”Some models have not been taking proper account of the physical processes that go on,” he [Wadhams] commented.”
Nick Stokes – So they DID get it from a climate model. They got it from Hansen’s 1988 model. Hansen claimed that it proved that ECS was about 3.0, from which the predictions of rising sea levels were derived.
” They got it from Hansen’s 1988 model. Hansen claimed that it proved that ECS was about 3.0″
You might as well say they got it from someone’s measure of TSI. Or from the properties of water. These are all things that might go in to a calc of sea level. And for that matter, they could have got an ECS estimate from Arrhenius.
But the statement was that the models said said that the Maldives would be submerged by 2018.
http://news.bbc.co.uk/2/hi/science/nature/7139797.stm
Crickets, eh Marv? I wonder why… 😉
Answer misplaced above.
Probably were dizzy from spinning.
when the various “model” results vary by 100’s of percent (low to high estimates) they are not models but WAG’s and we may as well use cast chicken bones … an “average” of WAG’s doesn’t change the fact that they are all guesses …
If the models are correct, why are they almost always wrong? Which models are correct since the vary widely from each other?
If the models are correct, why are they almost always wrong? Which models are correct since the vary widely from each other?
“Historically, climate models have shown a progressive weakening of the Hadley cell in the Northern Hemisphere. Over the past four decades reanalyses, which combine models with observational and satellite data, have shown just the opposite–a strengthening of the Hadley circulation in the Northern Hemisphere.”
… To understand which data was correct–the models or the reanalyses–they had to compare the systems using a purely observational metric, untainted by any model or simulation. In this case, precipitation served as an observational proxy for latent heating since it is equal to the net latent heating in the atmospheric column. This observational data revealed that the artifact, or flaw, is in the reanalyses–confirming that the model projections for the future climate are, in fact, correct.
How is it that the models have shown weakening but the reality is that the Hadley cell was not weakening but strengthening and that makes the models correct? I am so confused. Maybe one has to be a scientist to understand this?
No, one has to be a professor – like the authors of this paper – to fully understand why theory ALWAYS trumps reality.
” To understand which data was correct–the models or the reanalyses–”
Model outputs are not data. “Adjusted” model inputs are not data.
Reanalyses are not data.
+10!
It’s very simple. Please allow me to explain.
Models showed Hadley cells weakening.
Data reanalysis showed Hadley cells strengthening.
The models got precipitation right.
Therefore they got Hadley cells right too.
The data needs to be re-reanalysed, re-re-reanalysed, re-re-re-reanalysed, etc, until it agrees with the models. Whatever it takes.
The point that you missed is that you naively thought that to check Hadley cell calculations, you would look at Hadley cell activity. But a sophisticated scientist doesn’t work that way. What they do is look at completely different factors, until they find one that can be spun to give them a pre-determined result.
Old-fashioned fuddy-duddy scientists never had pre-determined results, and this led to grave weaknesses in their science. Modern science recognises that when you begin a research process, you must know the end result. A reasonable analogy would be that someone embarking on a journey needs to know where they are going – otherwise they wouldn’t even know in which direction to set out.
Steven Sherwood showed the way forward when he proved that the tropical troposphere hotspot existed. Other scientists had (rather stupidly) looked at the troposphere temperatures, and failed to find the required warming. Steven Sherwood found it by looking at wind shear. The logic is similar to where I started:
Models showed a particular tropical troposphere warming pattern.
Data showed no such warming pattern.
A model fed with wind shear data did find the required warming (aided by a chart in which zero was shown in bright red).
Therefore the models did get tropical troposphere warming correct.
One would suppose that the speed of equator-pole circulation would be a function of the temperature difference between the equator and the poles. Because of polar amplification, a warming planet would have less difference between the equator and the poles, and therefore less equator-pole circulation.
If the models reflect reality with respect to equator-pole circulation then that means the modellers got the physics right, nothing more. It doesn’t mean the model predictions are reliable. The fact remains that the models run hot. That has been the skeptical criticism all along.
With less equator-pole circulation, one would suppose that there would be less energy to support extreme weather like hurricanes. That would upset the alarmist apple cart.
What you say is true, but with less energy in the atmosphere it means Hurricanes would become less frequent and more intense. Warmer atmosphere means a warmer ocean, as has been observed in the raw data (not model simulations; https://agupubs.onlinelibrary.wiley.com/doi/abs/10.1029/2010gl043321). Warm oceans feed hurricanes and if the dwell time of a hurricane increases over the ocean, it’s only going to grow in magnitude. Either way, it’s still going to be bad news for coastal and island dwellers.
Actually, it’s all about the delta_T. If everything was isothermal, there would be no weather.
“Columbia Engineering, based in New York City, is one of the top engineering schools in the U.S. and one of the oldest in the nation.”
But it’s not affiliated with the Columbia Broadcasting System….
https://sci-hub.tw/10.1038/s41561-019-0383-x
The models used in the study used the”the Representative Concentration Pathway 8.5 (RCP8.5″.
By design Pathway 8.5 is an absolute worst case scenario for a warming climate. It is not supposed to model any realistic projection, but the worst possible case that might take place. In reality the temperature is tracking close to RCP 2.5.
So once again we see climate scientists picking assumptions that will prove what they feel is correct to get the results they want.
Since this is a battle between two different types of models, neither of which have been validate, it a bit of clouded thinking.
Philo
I guess they didn’t get the memo about the RCP 8.5 being unrealistic and improbable.
Wow. Simply wow. Our results were contradictory, so we changed them, now, they are not. The models are safe now. That was really bugging us that we might be misleading the organization tasked with the sole purpose of proving us right! Now we can rest assured that the contradictions between the summary for policymakers and the main report will remain intact. Oh glee, oh Yay! Models are data once again, and we can go on scaring people. No wonder Greta Thunberg has so much credibility. Her handlers read this sh*t.
“To understand which data was correct–the models or the reanalyses–they had to compare the systems using a purely observational metric, untainted by any model or simulation. “
The models are *NOT* data. That was their first and most important mistake. They set out to prove the models. What else can be said? Real scientists look for ways to refute their model/hypothesis.
Then they adjust the actual data (Hadley cell circulations) to meet the models.
And then to conflate Hadley Cell circulation with precipitation… See Stephen Wilde’s comment above, he nails it. Hydrologic cycle and Hadley circulations are loosely correlated (R^2 < 0.5). Cherry picking is quite easy at that level.
Junk science… all the way down.
Speaking of all the way down…All you had to do was scroll to the bottom and see… EurekAlert!
Word to the wise…Check for the EurekAlert! before wasting any time reading. Unless your blood pressure is low and in need of being elevated. It’s highly effective at treating hypotension in climate skeptics.
“To understand which data was correct–the models or the reanalyses–they had to compare the systems using a purely observational metric, untainted by any model or simulation. “
The models are *NOT* data. That was their first and most important mistake. They set out to prove the models. What else can be said? Real scientists look for ways to refute their model/hypothesis.
Then they adjust the actual data (Hadley cell circulations) to meet the models.
And then to conflate Hadley Cell circulation with precipitation… See Stephen Wilde’s comment above, he nails it IMO. In fact Hydrologic cycle and Hadley circulations are only loosely correlated (R^2 < 0.5). Cherry picking is quite easy at that R level.
Junk science… all the way down.
Then the authors conclude their Abstract with this zinger:
"Our results highlight the role of anthropogenic emissions in the recent slowdown of the atmospheric circulation, which is projected to continue in coming decades, and question the reliability of reanalyses for estimating trends in the Hadley circulation.
Well, I doubt many honest scientists in the atmospheric physics and climate community agree with them on “question the reliability of reanalyses”, which is a foundational principle in studying the atmosphere cause and effect.
IOW, these “scientists” had to ditch “reanalysis” as a valid tool to come to their conclusion. That won’t be well received me thinks.
Thanks Joel, that was what I reacted to as well.
I must admit I wonder how they managed to coin the term “reanalyses” when they are actually just hindcast models (according to comments above). A reanalysis would suggest analysing data in my mind, but neither the models nor the reanalyses seem to do that. Another example of coining your own term to give more credence to your opinions?
“”Our results highlight the role of anthropogenic emissions in the recent slowdown of the atmospheric circulation, …”
Absolute, blatant propaganda. Their study in no way considered anthropogenic emissions on Hadley Cell circulation. Acolytes regurgitating the grand lie of CliSci.
Most posts get quite a number of comments – why so few here?
It is Late night in US, and AW’s moderation comment settings of allowing comments to batch post only once per hour.
As in it is 12:20 am on the US west coast as I post this comment, but no one will see my comment until 01:02 am… another 40 minutes.
1. It was posted 2 hours ago
2. It is a post regarding just yet another flaw in climate modelling – not much new there
3. Most of the US is still safely in bed
4. ?
And as always – their whole effort is to confirm their own bias and it never occurs to them that there is natural variation that causes the climate to change in a way that their little brains just cannot conceive.
Excuse me, but what causes “circulation” to start with? It’s not CO2.
Ahhh well 4timesayear, in a way it is CO2 (and water vapour of course). You see, the atmosphere does “work” . We harvest some of that work via wind turbines and hydroelectric plants. The work however represents energy which has to come from somewhere and it comes of course from the sun. The atmosphere is in fact a giant heat engine, but heat engines must obey Carnot’s law. Which means there must be a hot junction where heat energy is gained (the surface of the Earth in this case) plus there must also be a separate cold junction where heat leaves the system (in this case escaping to outer space). The cold junction is the tropopause or lower stratosphere which radiates energy to outer space. The radiation comes from gases in the atmosphere at that altitude but BY DEFINITION any gas that can absorb and thus also radiate energy in the thermal infrared range of wavelengths is a green house gas. CO2 and water vapour can, nitrogen and oxygen cannot. No green house gases, no radiation from the tropopause so no cold junction thus no heat engine and that means no convection, no Hadley cell, no rainfall, no wind, no lapse rate, just a static air mass of uniform temperature throughout. And of course no land life on earth.
Michael H
I fear that at the end you tripped into a trap set by the IPCC. Without GHGs you are saying the atmosphere wouldn’t be heated because of a lack of absorption. That is what the IPCC says: the air would be cold. Really cold.
But the surface is always heated by the sun which heats the atmosphere via the common mechanism of convective heat transfer. Without GHGs the surface would get hot every day and warm an atmosphere incapable of cooling by radiation. The temperature of the air would rise each day and not fall.
As with Monckton’s discussion of the feedbacks, the IPCC forgot the sun shines, in this case, on the ground. I have experimented with my feet and a parking lot. The ground is much warmer when the sun shines on it. This has nothing to do with green houses or their gaseous effects.
The only reason the surface of the moon gets so hot in sunshine is it doesn’t have an atmosphere to heat by conduction (which would cool the surface, of course).
The Hadley cells will rise and roll and return the air with or without GHGs and no anthropogenic fractional change in the amount of CO2 will have the slightest detectable effect on it.
It is solar powered.
Crispin – rubbish, you have completely misunderstood. I did not say the atmosphere would not be warmed, on the contrary, what I said was it would have no way of cooling. If there is no cold junction (no way for it to lose energy) there can be no heat engine which means the atmosphere cannot do any work. That means it cannot raise water vapour to fall as rain, it cannot create winds, it cannot even more air around. NO the atmosphere would not be really cold, on the contrary it would be at the same temperature as the surface of the earth right up to the top of the atmosphere. There would be some convection until the entire atmosphere was hot which would have occurred millennia ago and thereafter it would be completely static. If the surface got momentarily hotter it would generate some transient convection which would stop as soon as the surface cooled again.
Mike,
You’ve nearly got it but not quite.
It is correct that with no way of cooling the atmosphere attains the same temperature from top to bottom via conduction alone and stays that way. It behaves like a solid in other words.
However being a gas it moves and different rules apply.
As soon as ANY up or down movement begins the energy taken from the surface in uplift is returned simultaneously to the surface in the connected descent in another location so that the energy added back to the surface beneath the descent can then be radiated to space.
Once begun, convection cannot stop because the density differentials cannot be removed so you always end up with the entire mass of the atmosphere involved in convective overturning. There is even convective overturning in the stratosphere but largely disconnected from that in the troposphere by the tropopause.
Once hydrostatic equilibrium is achieved energy taken up in the ascent exactly equals energy returned to the surface in the descent so you have a net zero effect between the two energy budgets BUT you have delayed some radiative emission to space in order to fuel the ongoing process and that increases the surface temperature because you need a hot enough surface to BOTH match radiation in with radiation out AND maintain the ongoing process of convective overturning.
So, you have an atmosphere that cannot shed its heat at all if it remains static but as soon as you introduce up and down movement it can shed radiative energy to space via its contact with the surface beneath descending columns.
However, the energy shed is continually replaced by fresh energy taken up in areas of ascent.
The essential component to create the greenhouse effect is simply the presence of up and down movement within a gaseous medium.
Convection alone is the cause of the surface temperature enhancement for every planet with an atmosphere and if one adds radiative material you simply get a change in the rate of convective overturning which results in a change in the height of effective radiative emission to space in order to keep surface temperature the same.
Faster convection under the potentially warming influence of radiative gases will cause the effective radiating height to fall to a lower warmer height so that energy escapes to space faster thereby offsetting any potential surface warming effect from back radiation.
The radiative theory is therefore fatally flawed since it does not include the effect of the speed of convection on the effective emission height.
Radiative materials in an atmosphere cause faster convection and faster convection lowers the effective emission height. That is the mechanical process that counters any surface thermal effect from back radiation.
Stephen;
I do not agree with the point you make. You say energy taken from the surface in uplift is returned to the surface by the descending air and that the surface then radiates that extra energy to space. That means you are claiming the hot junction where energy is transferred to the working fluid is also the cold junction where energy is abstracted from the working fluid. That breaches Carnot’s law. The rising air rises because it is warmer. If it is to then fall it must first lose energy but without GHG it cannot do so.
Convection implies work is being done. Consider, one could put a turbine in the rising or falling air mass which would turn and generate mechanical work but generating mechanical work from heat implies a heat engine and that must obey Carnot’s law. Just look at it from the point of view of a heat engine, where is the cold junction? It cannot be the same as the hot junction. A working fluid cycling from hot junction and then back to hot junction doing work on the way but without losing any energy in the process amounts to a perpetual motion machine.
One could argue the hot junction is the equator and the cold junction is the poles with the surface at the poles radiating then energy to space. That would indeed fulfil the Carnot law requirements and if the Earth were not rotating it would be quite realistic. But the earth is rotating and that rotation precludes air movement directly from equator to pole. The radius of rotation is decreasing as one moves polewards and that causes a centripetal force which pushes the air back towards the equator. Its why we have 3 cycles (Hadley, Ferrel and Polar) instead of just 1. If the earth were rotating faster we would probably have 5 cells not 3. A problem can be simple or complex depending on how one chooses to look at it. In this case, from the perspective of Carnot’s law and the operation of heat engines the answer is very clear and simple.
Mike,
The cold junction involves radiation to space from the surface that does its best to get back to the temperature of space. The kinetic energy in the descending air is supplied in a constant stream from potential energy in the vertical column so the air arriving at the surface is always warmer than the surface and heat is constantly transferred to the radiating surface by conduction.
The surface is therefore kept warmer than it otherwise would have been and radiates to space commensurately faster than it otherwise would have done.
No breach of Carnot and no perpetual motion because energy is constantly being replenished on the ascent side.
You also say that the air has to lose energy in order to descend but that is not so. It only needs to lose heat and that is achieved by conversion of PE to KE. The total energy content stays the same.
You do not need GHGs to obtain a temperature drop when uplift occurs.
“To understand which data was correct–the models or the reanalyses–they had to compare the systems using a purely observational metric, untainted by any model or simulation. In this case, precipitation served as an observational proxy for latent heating since it is equal to the net latent heating in the atmospheric column. This observational data revealed that the artifact, or flaw, is in the reanalyses–confirming that the model projections for the future climate are, in fact, correct.”
So many contradictions and logical flaws wrapped up in such a short passage. First, model simulations do not qualify as “data” – unless you think it’s OK for a person to fabricate data. Second, re-analyses may be based on data, but again are not data. They seem to at least subconsciously understand this since they felt the need for information “untainted by any model or simulation.” Yet, even then, they ultimately have to use something that is admittedly just a “proxy.” The biggest whopper is the last sentence – merely showing that the reanalysis – which contradicts the models – has some flaw in it does not logically “confirm[ ] that the model projections for the future climate are, in fact, correct.”
Something here tells me that these “researchers” miraculously found exactly what they set out to find.
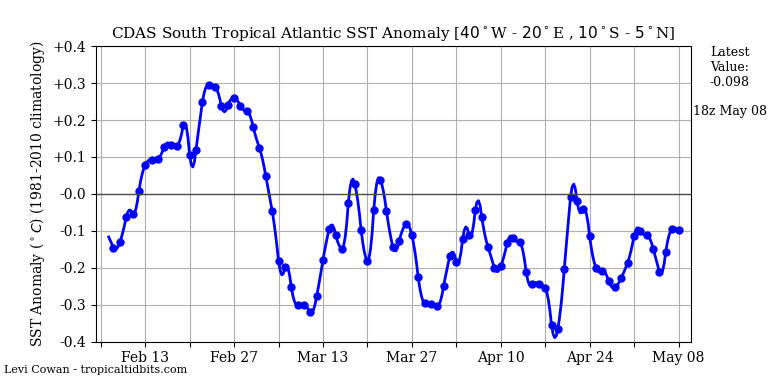
The big drop in temperature on the equatorial Atlantic is not conducive to the formation of hurricanes.

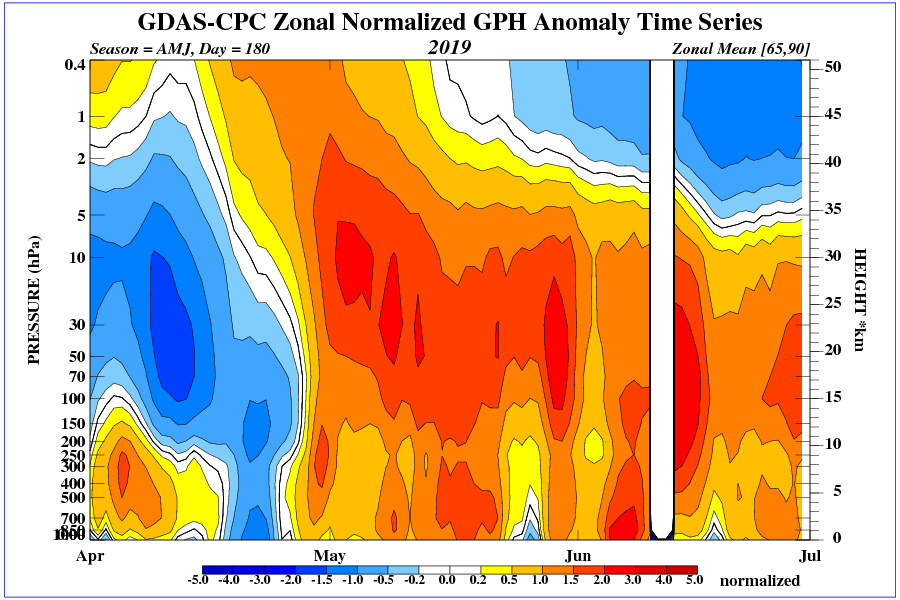
I think the breakdown of the polar vortex with associated arctic warming is resulting in lower temperature contrasts and fewer hurricanes.
In the south, now it works winter stratospheric polar vortex.
http://ds.data.jma.go.jp/tcc/tcc/products/clisys/STRAT/gif/zu_sh.gif
Ren
Your statement would be correct if SST was the key reason why hurricanes exist. SST is not the key driver to TV formation or duration. The recent 4 part series on tropical cyclones, by Judith Curry is a good place to start.
You must separate why TC exist, and what TC do. They are two separate things. And then there is rapid intensification, a whole new discussion.
SST is a fuel or lubricant, not causation.
Regards
The low surface temperature at the equator results from current circulation and is therefore a good indicator of hurricanes.
Regards.
Look at the temperature waves.
High SST is a necessary but not sufficient precondition for hurricanes.
No high SST = No Hurricane
Better said, high enough SST. That’s about 77F/25C, at depth, too. It is a bit higher for major hurricanes because of the various losses and other conditions. (Remember, Clausius/Clapeyron is not just temperature dependent, it is pressure dependent too; and pressure and temperature are themselves interrelated.)
June is not conducive to hurricanes in the Atlantic. Wake me up in August if the El Nino has settled down.
http://media.bmsgroup.com/wp-content/uploads/2016/05/Season.jpg
Exactly, because SST is just *one* of the thresholded conditions that are necessary.
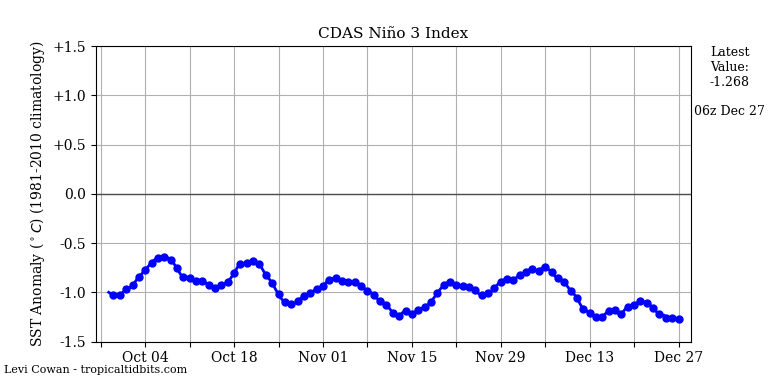
Further temperature drop in the eastern tropical Pacific. There are still no hurricanes.
The increase in ionization in the stratosphere results in an increase in geopotential above the polar circle.
“SPACE WEATHER BALLOON DATA: Approximately once a week, Spaceweather.com and the students of Earth to Sky Calculus fly space weather balloons to the stratosphere over California. These balloons are equipped with radiation sensors that detect cosmic rays, a surprisingly “down to Earth” form of space weather. Cosmic rays can seed clouds, trigger lightning, and penetrate commercial airplanes. Furthermore, there are studies ( #1, #2, #3, #4) linking cosmic rays with cardiac arrhythmias and sudden cardiac death in the general population. Our latest measurements show that cosmic rays are intensifying, with an increase of more than 18% since 2015:”
http://www.spaceweather.com/
“Historically, climate models have shown a progressive weakening of the Hadley cell…”
Nope. Climate models have forecast a progressive weakening of the Hadley cell… And it turns out that the forecast was wrong – Nature did not agree. Or maybe the forecast was right and Nature got it wrong…
“…if the two disagree, that means that either the models or reanalyses are flawed.”
On the other hand, if they agree they may well both be wrong. They are computer games divorced from reality.
What? The reanalysis disconfirms the models? Oh my, what to do? Search, search, search, BINGO! Precipitation. Yeah, that’s the ticket!
Models give a spaghetti of global temperature anomolies and spread. They run hot compared to measurements. They predict a tropospheric hot spot which isn’t there. So they are wrong on the most basic application of Feynman’s maxim. hence if they agree with Hadley Cell behaviour then that must be a fluke. If they disagree than who’d be surprised?
Interesting question, son. What is the spread of the models concerning physical weakening of the Hadley Cells?
Additionally, since the models don’t get precipitation right, how does a precipitation proxy prove UN IPCC climate models get Hadley circulation right? I admit: I’m confused.
“Because of this new study, scientists now have added confidence that models are reliable tools for climate predictions.” A rare “It’s Better Than We Thought!!!!”
A non-modelling person’s musing: Models represent relationships, but relationships can change? Each other? Randomly and not-so-randomly? How do you model that?
Coach
And, if you believe in Tipping Points, then relationships can change abruptly and also reverse direction. It would generally take empirical data to identify and characterize such changes.
Since they can’t fundamentally understand the climate system nor the myriad factors affecting any change, they just assume.