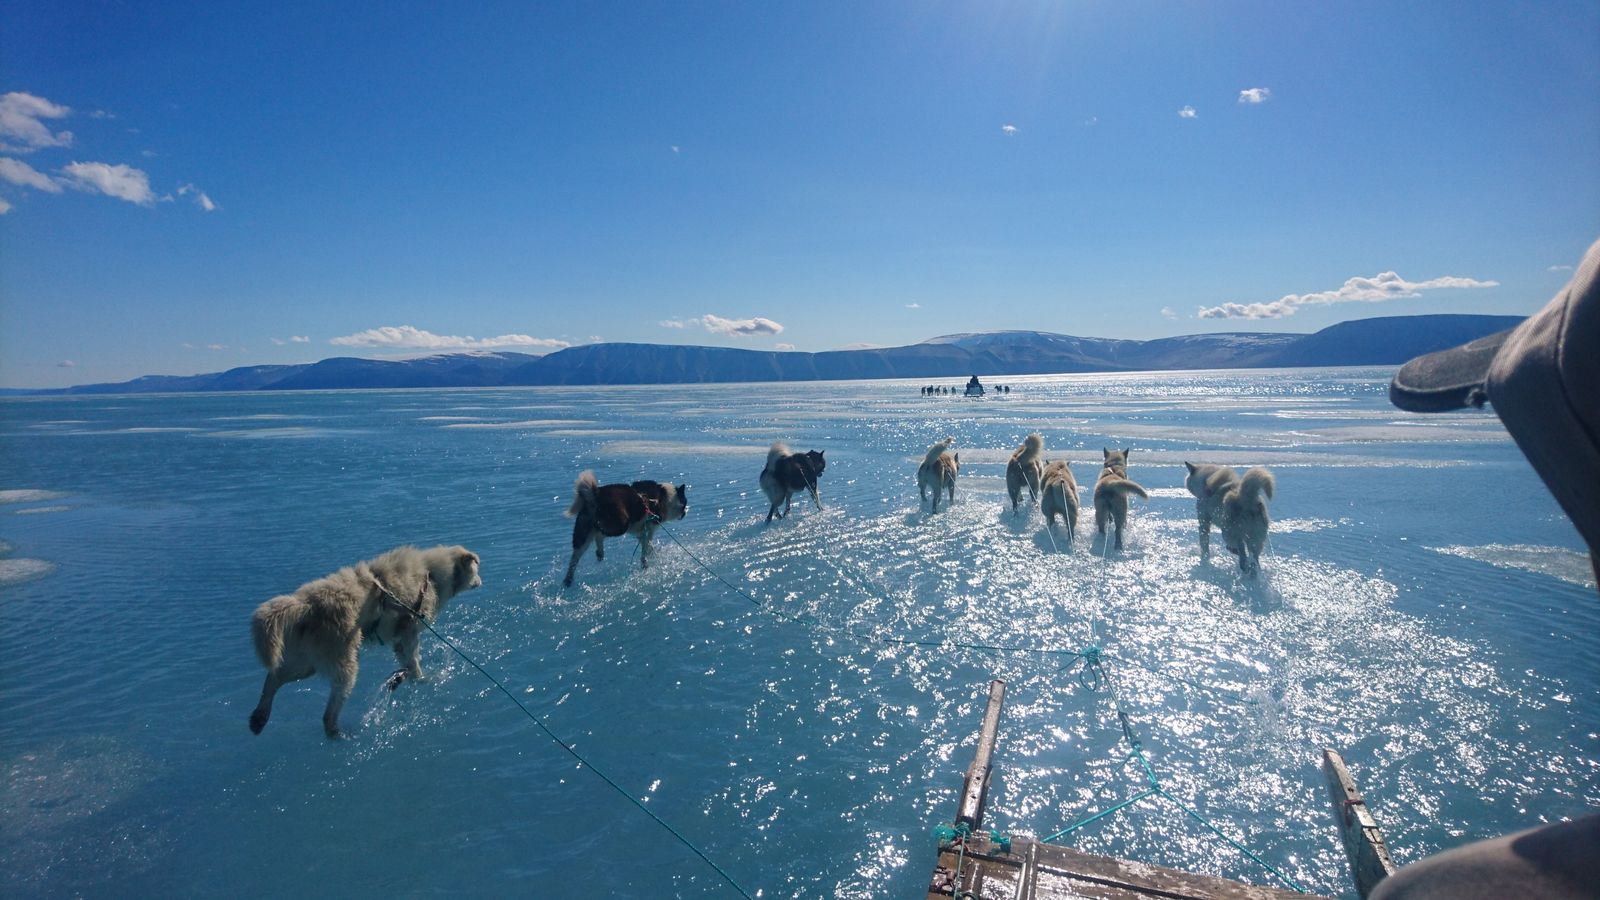
This photo of a dog sled team going through some meltwater on ice in Greenland has made headlines….but it’s just a snapshot of one place, with summer approaching. Nothing really all that unusual is going on.

Melting as summer approaches is natural, and spikes of fast melting due to lack of cloud cover and clear skies are not unprecedented, as some overwrought people (Bill McKibben comes to mind) like to claim.
We’ve covered it before in 2012 – along with the same level of catastrophic squawking.

In the image above, you can see that there’s a quick batch of surface meltwater visible to satellite. The cause was simple, and not catastrophic. In fact, it happens regularly on century-long scales.
It turned out to be a weather event, unrelated to “climate change”. The next year, there was no “insta-melt“.
In fact. we’d not even know about the melting in Greenland before satellites came on the scene. So how many times in the history of the Earth has Greenland has a quick melt spike? I’m guessing hundreds of thousands of times.
Meanwhile, NASA Earth Observatory has this to say:
Major Greenland Glacier Is Growing

Jakobshavn Glacier in western Greenland is notorious for being the world’s fastest-moving glacier. It is also one of the most active, discharging a tremendous amount of ice from the Greenland Ice Sheet into Ilulissat Icefjord and adjacent Disko Bay—with implications for sea level rise. The image above, acquired on June 6, 2019, by the Operational Land Imager (OLI) on Landsat 8, shows a natural-color view of the glacier.
Jakobshavn has spent decades in retreat—that is, until scientists observed an unexpected advance between 2016 and 2017. In addition to growing toward the ocean, the glacier was found to be slowing and thickening. New data collected in March 2019 confirm that the glacier has grown for the third year in a row, and scientists attribute the change to cool ocean waters.
“The third straight year of thickening of Greenland’s biggest glacier supports our conclusion that the ocean is the culprit,” said Josh Willis, an ocean scientist at NASA’s Jet Propulsion Laboratory and principal investigator of the Oceans Melting Greenland (OMG) mission.

2016 – 2019 Download the large JPEG image
The maps above show how the glacier’s height changed between March 2016 and 2017 (top); March 2017 and 2018 (middle); and March 2018 and 2019 (bottom). The elevation data come from a radar altimeter that has been flown on research airplanes each spring as part of OMG. Blue areas represent where the glacier’s height has increased, in some areas by as much as 30 meters per year.
The change is particularly striking at the glacier’s front (solid blue area on the left) between 2016 and 2017. That’s when the glacier advanced the most, replacing open water and sea ice with towering glacial ice. The glacier has not advanced as much since then, but it continues to slow and thicken.
Willis compared the glacier’s behavior to silly putty. “Pull it from one end and it stretches and gets thinner, or squash it together and it gets thicker,” he said. The latter scenario is what is happening now as the glacier slows down: Notice that by the third year, thickening is occurring across an increasingly wide area.
Willis and colleagues think the glacier is reacting to a shift in a climate pattern called the North Atlantic Oscillation, which has brought cold water northward along Greenland’s west coast. Measurements of the temperatures collected by the OMG team show that the cold water has persisted.
“Even three years after the cold water arrived, the glacier is still reacting,” Willis said. “I’m really excited to go back this August and measure the temperature again. Is it still cold? Or has it warmed back up?”
NASA Earth Observatory images by Joshua Stevens, using Landsat data from the U.S. Geological Survey, and data courtesy of Josh Willis/NASA JPL and the Oceans Melting Greenland (OMG) Program. Story by Kathryn Hansen.
The picture of the sled dogs in standing water is rather like the cachexic polar bear a few years ago, much more striking an image than actually revealing anything about the Arctic.
It reveals that by the wonder of cheap fossil fuels, a lot more photographers are going to the Arctic.
A century ago, almost no one but the most sophisticated and costly teams could get to the Arctic. Today, almost any idiot can and does go there and with cameras that are largely idiot proof many of them can take amazing pictures …. without a clue what they mean.
The idiot that reported this is Dr. Jason Box. His monitoring tools produced the curve.
Be careful with how you criticize.
https://www.facebook.com/1532118913672102/posts/2367355690148416/
The odd thing about his monitoring curve is that this dramatic spike isn’t nearly as dramatic in DMI:s version:
http://polarportal.dk/fileadmin/polarportal/meltarea/MELTA_combine_SM_DK_20190612.png
And after all they are the ones who actually have weather stations there.
And if he is actually an arctic specialist he will presumably be aware that meltwater pools on sea-ice is perfectly normal in summer.
Yep. It’s when they don’t get melt water pools during the summer that it is time to start paying attention.
One of my first questions would be: Who paid him to do this trip. Next question what is his annual income. Putting food on the table is important.
Follow the money.
I recall that several years ago some folks not familiar with the Arctic were visiting the North Pole and saw several polynas. These openings in the sea ice form regularly due to ocean currents moving the ice around. But the visitors didn’t know this and wrote an article in the New York Times proclaiming that the Arctic was melting. As usual, the panic traveled half-way around the world before the truth could get its boots on.
“as some overwrought people (Bill McKiebben )”..McKibben ?
Great post Anthony…
“It turned out to be a weather event, unrelated to “climate change”.
The last 30 years has been a series of weather events, but the alarmists point to all weather events, including cold weather events, as evidence of global warming and climate change. Even if we have a severe volcanic forcing leaving us with no summer for a few seasons’s and a billion people die of starvation, this is still a weather event. And 30 years is a fairly short duration to even judge what exactly is happening with climate, and what is natural and what is human caused. We don’t even fully understand natural climate change, so making statements about normal weather events is meaningless.
Regarding the surface water on the snow/ice, that must have some effect on how that season is recorded in the annual layering when looked at in an ice core a century from now. I can only assume that many ice cores we study have been similarly altered and affected from ponded melt water on the ice. Being told it takes many years for accumulated snow to turn into compacted ice sort of makes all that seem like fiction too.
This is not caused by “weather”.


Given that Greenland has 2,850,000 cubic kilometres of ice, the recent loss of a very small amount of ice (4000 Gt) relatively speaking to the total ice sheet mass is a rounding error. That is .00014% melting the last 17 years according to your link. It would take 14,000 years to all melt at current melting rates. We don’t even see much of an acceleration in SLR from all the supposed melting of the icecaps at both hemispheres, although I suspect Antarctica is probably growing to a similar amount than is lost in Greenland including all the mountain glaciers. It would even be weirder if everything just stayed the same forever. I am not worried and you shouldn’t be either.
Uh huh. But you agree with my statement: This is not caused by “weather”.
If sealevel rise is not accelerating, its weather.
Nice try, again.
Loydo
It´s weather. Without “”s.
Why does melting glacial ice during an interglaical period always cause so much concern? Isn’t that exactly why they named it interglaical in the first place?
Loydo: When the Laurentide sheet melted back, it wasn’t weather. Hard to imagine your state of panic if you’d been around back then. Put aside what word we use to describe it, instead tell us, what caused the Laurentide (vastly more ice than anything we see melting off Greenland) to melt? After you tell us that, you can then tell us what’s different about the current melt from the Laurentide melt. “Til then, you should consider the old adage about keeping quiet, so we only THINK you’re a fool.
Looydoo sez:
This is not caused by “weather”.
At least try to get simple definitions right. It’s ALWAYS weather. “”””Climate”””” is a math-construct.
I do note that the start of the graph is around 1980; i.e. around the end of “The ice age cometh!” scare. Is it possible that, at the start of this graph, sea ice extent was anomalously high? Very possible, when you view the data since satellite measurements began, in 1973, which shows that the sea ice has slowly gone back to that extent, then.
Oh my!
Again, you reproduce a simplistic straight-line extrapolation of a cyclical trend of a 66-70 year sea ice cycle, extrapolating it past its highest ever measured point, extrapolating down below its lowest values. For fully 1/3 of the measured years, minimum sea ice has not continued decreasing, but has been steady since 2007.
By the way, less sea ice in the Arctic year-round, more heat energy is lost to space by increased LW radiation from the exposed ocean waters, increased convection losses to the air, increased evaporation from the open ocean, and increased conduction by loss of the insulating ice blanket.
Again, you wave your arms aroung and provide nothing to back up your 66-70 year claim.
Doesn’t look cyclical to me.
https://www.nature.com/articles/nature10581/figures/3
September/October seaice has flattened but every other month shows continuing decreases because its become warmer since 2007.
http://berkeleyearth.org/wp-content/uploads/2018/01/Arctic2017.png
On track this year for a record low or near record low. I know, you expect things to turn around any time soon because warmer means less ice means more heat radiates away means colder. Warmer means colder, right?
The existence of 60 to 70 year cycles is well documented already.
I’m surprised you are still able to ignore them.
We are going to play snap in future with “Loydo random graph of the day”. So any day we see a Loydo random graph first to reply snap wins and gets one to their score tally.
Warmer means Colder seems to be the AGW narrative
As in a warming world means more cold spells in the great plains of the USA
There’s no larger significance to any melting glaciers on Greenland, Loydo.
The climate has warmed and some glaciers are melting back. So, what? That just means the climate has become more clement.
We can expect milder weather extremes, a longer growing season, and prosperity in a warmer climate.
There’s no evidence whatever that human CO2 emissions — your implicit grounds of concern — have impacted the climate in any way (except for the general greening-up of the global ecology)
So there is “evidence whatsoever”?
Witty riposte, Loydo.
How about, no evidence of any scientific kind that human CO2 emissions have impacted the climate (except for the greening).
It’s not caused by climate either. It’s caused by normal cycles in the North Atlantic.
Loydo
We’re talking about glaciers and you present pictures of sea ice?
Next week will get pictures of the ice in his freezer.
Greetings Earthling2, I am currently writing a political play that has the Yellowstone super-volcano blowing up on a scale similar to what you describe in your comment but the worst-case scenario could be a mass-extinction event:
As winter approaches, take heart in the fact that it won’t last 80 years. That’s how long two volcanic winters may have lasted after two separate explosions of the Yellowstone volcano about 630,000 years ago, the same eruptions that formed the Yellowstone caldera, and the last big eruptions of the volcano. The explosions occurred about 170 years apart and helped drop the ocean surface temperature by about 5.4 degrees.
However, this worst-case scenario happening in our lifetimes is extremely unlikely and the Yellowstone super-volcano may never have an eruption again.
The poetic irony of the play is the Green Party character recognizing that the preparation against global warming was misdirected energy that should have gone to preparing against weather events and natural catastrophes.
This is why I believe we should try and argue that any public funds that are spent on climate mitigation efforts are spent wisely on things we will need anyway to protect from weather events and natural catastrophes. Things like expanding and hardening/securing our electricity grids, investing in flood capture control by monetizing water as a comodity, and planing for eventual sea level rise with storm surge barriers, to list just a few. Unfortunately, things like a carbon tax that just go into general revenues to win elections for the governing party wind up lowering overall economic activity so that we don’t have the monies to pay for the resilience that is always required from normal everyday weather and natural catastrophes. Hopefully Yellowstone doesn’t pop off in the mean time since that would seriously crimp our style.
One of the reasons I recently switched from the Greens to the Peace & Freedom Party was there lack of understanding on how to properly prepare for future developments- over the years I reached out to their leaders (Nader, Cobb, Stein, Hawkins) and their followers about many issues such as pushing for direct federal governmental investment in wave technology instead of the totally eliminating fossil fuels fantasy with no success- I wish I could write for a worthwhile congressional candidate (running against the candidates of the two evil war parties) that believes in strengthening and expanding the electrical grid wisely and gradually; unfortunately, political parties have divided us so deeply that almost none of the many Liberals, Progressives, Socialists and Greens that I have encountered are willing to support my idea of a Green Libertarian Socialist Labor Party voting coalition so for now I am going back to writing plays that address our fascist police state style. Thanks for your response.
progressives never mean the compassion they tout, Herk. They have supported every single mass-murdering collectivist state of the 20th century, including Fascist Germany.
You’re being duped by their rhetoric.
Whenever Progressives get into power, the result has been tyranny, thought crimes and mass-murder. Without fail.
Take a look at what’s happening in Canada right now. Under advancing Progressive control, Canada now has legislated thought crimes. Make a gender dysphoriac cry because you used the pronoun of biological reference, go to jail.
It’s a generational march to tyranny.
I published Progressivism is Hostile to Humanism, that lays out the case.
Progressives oppose every single Enlightenment value that makes our civilization worth supporting: freedom of conscience, freedom of association, freedom of speech.
Progressives stand in opposition to every single one of them.
That case is obviously made in the headlines describing suppression of speech, association, and conscience on college campuses all across the West. By progressives.
Once again, Herk, you’re being duped by progressive rhetoric. They don’t mean what they say. The issue is not the issue, remember?
Their words are just a vehicle to power. Their way is paved with useful idiots.
Support Progressives, collude in murder.
Unfortunately, I feel that many Americans are being duped into voting for the Democrats with liberal rhetoric and are being tricked into voting for the Republicans with conservative beliefs who represent mostly Neo-Liberal governance and Neo-Conservative foreign policies while We The People are being controlled by the FED (and the other big banksters) and our elections are being purchased by corporate interests; without the freedom to vote out our corporatized parasites in free and fair elections there will no worthwhile progress made in American Society just many broken promises, unnecessary subsidies, crushing taxes and token gestures made by our politicians while manipulative warmongering for blood-money profits remains unchecked so that is why my activism is primarily focused on the totally non-partisan movement of establishing a real democracy by getting rid of the instruments of tyranny (abolishing the electoral college, repealing FECA, replacing the hackable voting machines and ending Citizens United) and my main goal, speaking as an aspiring political speechwriter, is to work for a worthwhile congressional candidate that will actually represent the victimized masses instead of our mass-murdering Fascist Rulers hellbent on global domination. Ironically, the Peace and Freedom Party might have a more compatible candidate for me to work for than either the Greens or the Libertarians because my political blog is called Green Libertarian. Luckily, my desire to speak freely against our fascist police state has opened my conscious enough to freely associate with any anti-war party who supports peace and freedom regardless of their ideology, the basis of a new Green Libertarianism. Thanks for your interest.
The first thing you might do to improve your speech writing skill, Herk, is to make use of paragraph divisions.
The US is not a Fascist police state. There are no Fascist state observables in the structure of US politics.
There is no ‘everything inside the state, nothing outside the state.’
There is no resting of privileges on adherence to a party line (as is the case in China, for example). There is no government-enforced trampling upon individual rights (as is the case in China, for example).
There is no police oversight of your daily life, no thought-crimes, no political show-trials.
The absent traits are characteristic of Fascist states. None are present in the US.
The Electoral College provides protection against the tyranny of the majority, Herk. It gives the rural population some political clout against domination by the few large population centers. A Libertarian would support that.
If you see problems then by all means apply yourself to them. But seeing problems through the lens of a political ideology such as Progressivism is just a way to substitute new problems — usually worse ones — for the old problems.
Yes, one (1) glacier has been growing for three years…
Good thing you weren’t living during the world-wide glacial melting at the beginning of the Holocene. You’d really be wringing your hands.
Earthling2
When I was on the edge of the glacier east of Thule AB (Camp Tuto) in July of 1966, I observed an Arctic Fox running on the surface of the glacier. However, the surface was a slush that I doubt would have supported the weight of a human, at least not without snow shoes. I threw a large cobble (maybe 10 lbs) as far as I could and it sunk what appeared to be well over a foot into the slush. Such a drastic modification of the surface (annually?) would certainly call into question the temporal resolution of CO2 measurements in drill cores. From inside the tunnel that the Army had driven into the glacier, a melt water stream could be heard flowing when an air shaft being driven upward got near enough to the surface for blue light to be seen. At the base of the ice tunnel, there were intermixed layers of clear and sediment filled ice that were shearing upward from the uneven topography, adding yet another variable to the dating of the ice, particularly in cores that get near the bottom.
Any picture manipulation folk had a close look at this image yet? I found it a bit strange that any sledder would take a valuable team out onto open melt water. I had a look and found some distortion on the right sled runner and on the dog lines.
It is a melted sea ice (please pay attention to image captions, especially BBC captions). The team is riding on a solid sea floor. 🙂
Here’s the guy what done it, don’t think there was any photo shopping going on:
https://news.sky.com/story/dramatic-photo-shows-husky-dogs-walking-on-water-in-greenland-11743906
The explanation says it all – you can even see the ice in the full version here:
 ?20190618112258
Rocket**
I agree, Alan. I wouldn’t trust anything coming from the leftist media. Any and every trick/manipulation/lie is employed.
Catastrophic linear thinking refuted by the real cyclical world.
“catastrophic squawking,” has a nice clarifying sound to it, with respect to so-called catastrophic global warming.
For the last 30 years or so, we’ve been experiencing an increasingly greater level of catastrophic anthropogenic global squawking.
Anthropogenic global squawking has now reached crisis levels, wherein small events lead to major squawks.
Maybe we’ve entered a squawk tipping point, or maybe it’s an accelerating squawk cascade. Experts disagree.
It’ll take a squawkentist to get the model right.
The 4 big Iceland glaciers have also grown this year.
How do you know? Links?
Loydo,
The crowd around here is fairly sophisticated, when it comes to dealing with internet troll behavior.
Asking others to provide links is a well- known tactic, used by rather unsophisticated trolls.
Now, you know about it, too. What an opportunity to step up your game!
There is more to you than what your history here reveals, isn’t there?
Asking for evidence from arm-wavers is trolling? And then you go and feed me, so sophisticated.
Others will no doubt notice, that you did just admit to your game.
It looks like my simplistic effort bore fruit, after all.
Trolls always demand to be spoon fed with evidence that runs counter to their Climate Change Religion dogma. These links I am about to provide you Loydo, are readily available and easily found.
So, not that it will do one little bit of good, here’s some of the “evidence”:
https://earthobservatory.nasa.gov/images/145185/major-greenland-glacier-is-growing
https://www.sciencealert.com/one-greenland-glacier-is-growing-but-that-is-not-a-cause-for-celebration
Now who is the “arm waver”?
So, not that it will do one little bit of good, here’s some of the “evidence”:
https://earthobservatory.nasa.gov/images/145185/major-greenland-glacier-is-growing
https://www.sciencealert.com/one-greenland-glacier-is-growing-but-that-is-not-a-cause-for-celebration
This has nothing to do with Iceland’s glaciers.
Typical of this site, no evidence just a lazy lie and pointing out the lie is regarded as trolling.
Loydo – look 4 yourself:
“Webergebnisse:
Icelandic Glaciers are Expanding For the First Time in Decades – Grand Solar …
06.12.2018 · Icelandic Glaciers are Expanding For the First Time in Decades — Grand Solar Minimum.
According to researchers from the University of Iceland, ALL Icelandic glaciers are projected to expand this year, this would make it the first time the glaciers wouldn’t have shrunk year-on-year in a quarter of a century.”
Grand solar Minimum!
https://www.google.com/search?q=Icelandic+Glaciers+are+Expanding+For+the+First+Time+in+Decades&oq=Icelandic+Glaciers+are+Expanding+For+the+First+Time+in+Decades&aqs=chrome.
When I googled it I found that link too, but don’t get too carried away:
Langjökull had been losing around one and a half meters of ice per year for the past twenty years, “but in the last few years he has been close to zero, that is, he has neither expanded nor diminished. And that applies to this year, both for Vatnajökull and Langjökull as well,” said Pálsson.
I’m still wondering where Joe B read this: The 4 big Iceland glaciers have also grown this year. Or did he make it up.
This year?
What about the trends?
The result for the last glacial year (september to september) shows for the Vatnajökull no growth.
And Vatanjökull ist the biggest one:
https://www.vatnajokulsthjodgardur.is/en/areas/melting-glaciers/glaciology/mass-balance
Facts are sooooooooooooo inconvenient !
O
M
G
Charles whose quote is this? “Greenland is catastrophically melting”
It’s not a catastrophy until a greenie gets a wedgie from hot weather … after that it goes nuclear.
We have long past reached Peak Hype on Greenland etc. Just watched an edition of the Irish equivalent of Meet The Press in relation to the media and political consensus to railroad through savage carbon taxes; ban the sale of petrol/diesel private vehicles by 2030; and to outlaw new installations of fossil fuel home heating by 2025. In the codes for broadcasters in our national Broadcasting Authority of Ireland there is a Guideline which says that “views and behaviour that damage the environment” should not be permitted and that “artifical balance” is not required. In tonight’s programme a Labour politician was worried that cold and wet Ireland would soon become a “sizzling wasteland”. Game over. Greta rules.
Meanwhile , in Antarctica there’s a -5.5°C temperature anomaly.
https://imgur.com/a/PhRoSKz
But no one talks about this, for some reason. /s
“how do alarmists explain NASA’s growing Greenland glacier”….easy…Jakobshavn Glacier is the only one growing, all others are melting. Actually this glacier is stealing ice from other glaciers, so factually it is not growing, it is making the others melt faster, including itself. /sarc
“Glaciers actually getting thicker? – We don’t want to talk about that anymore”– union of consensus scientists.
“Glaciers”. One glacier for localised reasons: “rapid cooling of the ocean current in southwest Greenland in early 2016. The cooler waters arrived near Jakobshavn that summer”.
“It lost so much ice between 2003 and 2016 that its thickness, top to bottom, shrank by 500 feet (152 meters).”
https://www.jpl.nasa.gov/news/news.php?feature=7356
Sure, Loydo,
When Jakobshavn glacier is receding, it’s the AGW poster child sign of impending doom. When it’s growing and advancing, it’s just one localized anomaly. Riiight!
It’s amazing how facile the duplicitous, worm tongued arguments from ‘Climate Change’ catastrophists can be. Truly, amazing!
Loydo
How´s your cherrybucket? Enough for next winter already?
Not one glacier, and not localized:
¨f only the 6 largest glaciers are considered, they have grown only slightly overall. This applies to Jakobshavn, Kangerdlugssuaq, Helheim, Petermann, Zachariae and 79° Glacier, which increased their area by an average of +3.7 km2 during the year. Two of these glaciers retreated, however, whereas the other four grew in size.”
http://polarportal.dk/fileadmin/user_upload/polarportal-saesonrapport-2018-EN.pdf
Ok.., well can one of you geniuses tell me “What Are” the Negative effects of Human CO2 emissions on Climate. ? Or is it being said Here that CO2 has No Causes on Climate change..?
Well, CO2 IS effect. Warm is the cause. Nobody can change cause / effect.
Nature loves CO2, and more is better.
And who cares what ice is doing in Greenland, in summer? What is this hysteria?
Try to write the English language correctly and you might receive an answer.
F!nn, the hysteria is from cultural effemination resulting in snarky language police like JimW.
Oops, if moderator can’t strike my prior remark, my apologies to JimW. I thought he was mocking F1nn’s English (which would not have been cool) when he was just pushing back on “Flazh”.
The growing Jakobshavn glacier is caused by global warming….obviously.
Nothing to see here.
In fact. we’d not even know about the melting in Greenland before satellites came on the scene. So how many times in the history of the Earth has Greenland had a quick melt spike? I’m guessing hundreds of thousands of times.
BINGO!
The climate lobby doesn’t say it’s never happened before, but if that’s what the media reports, they don’t pipe up with a correction.
There´s forest under the Greenland ice. It´s inconvenient truth.
In Finland we have found oaks in Laplands swamps. Now Lapland is tundra, with few scrubby birch.
But those facts are not very interesting, and for sure that kind of news don´t sell.
Tonight’s headline:
“Spring arrives, ice melts!”
A crevasse opened up right under the end-of-the-world narrative.
“The third straight year of thickening of Greenland’s biggest glacier supports our conclusion that the ocean is the culprit”
Josh Willis? He of the Argo buoys are wrong? 😉
Have you guys read Steffan’s twitter feed? It’s an absolutely sickening line of “journalists” asking permission to use the photo for their “climate” stories. None ask why the event occurred, if it has occurred in the past, how frequent it occurs or any other information. Just hyenas looking for a startling image to associate with climate change regardless of any facts.
Literally 2 months before and just a couple tweets down, Steffan says: “Impressions from the ocean, climate and cryosphere monitoring program, NW #Greenland, just successfully completed by local hunters and #dmidk. Preliminary results show an increased #seaice thickness and less heat in the ocean compared to recent years.”
69°10′N 49°50′W is where the glacier is.
south west.
Photo was taken at
77°27′N 67°48′W
inglefield gulf
Imagine that.
in one place further north you have ice melting.
further south you have snow accumulating in one area.
There is a REASON we look at Large areas ( and not just single locations)
and there is a REASON why we look over long periods of time.. not just a day
photo of melting ice or a couple years of glacier growth.
large areas: long times.
otherwise you get to confirm your bias and enjoy cherry pie
. . . like the Alarmists do, Stephen . . ?
. .really . . ?
Warmistas mostly aren’t very intelligent people, but Coolistas aren’t even a bit better!
That is exactly what Steven Mosher wanted to explain.
And he is perfectly right.
thanks.
I see this crap on both sides.
Absolutely
Melting of Himalayan Glaciers has Doubled in Recent Years
https://phys.org/news/2019-06-himalayan-glaciers-years.html
A newly comprehensive study shows that melting of Himalayan glaciers caused by rising temperatures has accelerated dramatically since the start of the 21st century. The analysis, spanning 40 years of satellite observations across India, China, Nepal and Bhutan, indicates that glaciers have been losing the equivalent of more than a vertical foot and half of ice each year since 2000—double the amount of melting that took place from 1975 to 2000.
“Here, we quantify changes in ice thickness during the intervals 1975–2000 and 2000–2016 across the Himalayas, using a set of digital elevation models derived from cold war–era spy satellite film and modern stereo satellite imagery. ”
So what was the accuracy of the sensors 40 years ago that allows such conclusions to be drawn?
Particularly since only the older less exact imagery has been declassified.
There was little that was ‘inexact’ about the older military satellites. The film cameras were state of the art. The spatial resolution has only been exceeded in about the last two decades, which is unclassified commercial imagery. There is little reason to keep the older imagery classified since we now have higher resolution imagery available. Of course, the intelligence imagery now has the highest resolution that tax money can buy. But, that is largely overkill for monitoring a glacier.
Actually, the resolution of the older satellites wasn’t too bad. If memory serves me right, Corona was about 8 meters per pixel — far better than the Landsat series that followed a decade later.
Actually, for elevation determination, the older sensors were superior because they were overlapping scenes that could be analyzed with stereoscopes to determine the relative elevation differences. Most modern satellites have very little if any overlap, precluding stereoscopic analysis.
Sorry forgot he attribution.
https://advances.sciencemag.org/content/5/6/eaav7266
Loydo
So what? Who cares Himalayan glaciers? Go there and try pick up your cherries.
How much has sealevel rise accelerated because your cherries? It hasn´t.
Relax and go play with your legos. Do something useful for a while.
I understand that the Himalayan glaciers do matter because they provide the water supply for people over a wide area. Whether they are actually going to disappear is another question.
When reading F1nn’s supertough comment I suddenly remember that one of my friends had a short stay somewhere in the Great Plains, about 20 years ago.
He told to a farmer’s sun (+- 20 y) a bit about Europe.
The farmer’s sun replied: “Yurop? Wha’s that? C’n I eat it?”
This is an issue I Don’t quite understand. Back in the 70’s they had quite regular catastrophic floods in Bangladesh as a combined result of the high altitude seasonal melt and the monsoons.
Thousands died almost every year.
If the glaciers weren’t there to melt in the spring then it would mean that the snow that falls during the winter would be melting earlier and more gradually and sometimes it would be rain. I can’t see how that would be a catastrophe as it should mean a more steady supply of water and less flooding.
What am I missing? Seems to me that those with an axe to grind foresee disaster no matter what changes occur. Pretty superficial and juvenile.
“I understand that the Himalayan glaciers do matter because they provide the water supply for people over a wide area.”
You don’t understand. This is pure fantasy. Glaciers don’t miraculously create water out of nothing. They can however be important by evening out flow in rivers by accumulating snow in winter which then melts during the dry summer season. However this does not apply to Himalayan glaciers since in South Asia the summer is the wet season (summer Monsoon) while winter is dry.
As a matter of fact the only way a glacier can provide a net water supply is by melting.
tty
Yes, if it suddenly turned much colder, the Winter snow would quit melting and the people down river would find a shortage of water. What the people of the Indian subcontinent need are Goldilocks Glaciers.
It must be a failing in me, but for years I have mistrusted the phrase “a newly comprehensive study” (or similar wording). Somehow it mostly turns out that I was right to.
If further investigation turns up the words “computer” or “model” my score rises to 100%.
Doesn’t McKibbles ever get tired of being wrong all of the time?
So long as his paychecks don’t bounce.
Is it cold water in the ocean, or is it the huge leap in the amount of snow that has fallen over Greenland in the past several years, that has effected the glacier?
Arctic oscillation has recently switch to cold mode, and it is near north Greenland. It have effects and this recent hysteria maybe is one of them.
Everyone who have lived over 60 years know these 60-65 years oscillations, and next is the big one coming = AMO (Atlantic Multidecadal Oscillation). So 70´s iceage hysteria is coming back. And, of course, it´s man made this time.
You don’t have to have lived over 60 years. Just be willing to read all of the literature, not just the stuff that supports your paycheck.
Yeah, that is all Jim Bandy for sure, but I still think growing glaciers a few years after records snows in the source are for the glacier, maybe just May Be somehow connected.
But I’m crazy like that , so…
I’m sure we’re still very doomed.
That is so very right. But our doom is not global warming.
“”There is two infinite in the world: Humans stupidity and space. But I´m not certain about the last one.”” Albert Einstein.
That is our doom.
I think Einstein’s English was much better than your quote.
“Very” hilarious!